

Significance
Many sharks and rays are threatened with extinction, and the paths to recovery remain challenging. We took advantage of a large-scale “Before–After Control–Impact” comparison to document successful recoveries in nine wide-ranging coastal shark species following implementation of the US Fishery Management Plan for Sharks of the Atlantic Ocean. By analyzing the IUCN Red List status of 26 wide-ranging coastal sharks and rays, and comparing the Northwest to the Southwest Atlantic, we show that extinction risk increased with fishing pressure but was offset by the strength of management (National Plan of Action for sharks and rays). Well-enforced governance and science-based effective limits on fishing have prevented population collapses and reduced extinction risk for many species in the Northwestern Atlantic.
Keywords: IUCN red list status, population recovery, overfishing, management, sustainable fisheries
Abstract
Overfishing is the most significant threat facing sharks and rays. Given the growth in consumption of seafood, combined with the compounding effects of habitat loss, climate change, and pollution, there is a need to identify recovery paths, particularly in poorly managed and poorly monitored fisheries. Here, we document conservation through fisheries management success for 11 coastal sharks in US waters by comparing population trends through a Bayesian state-space model before and after the implementation of the 1993 Fisheries Management Plan for Sharks. We took advantage of the spatial and temporal gradients in fishing exposure and fisheries management in the Western Atlantic to analyze the effect on the Red List status of all 26 wide-ranging coastal sharks and rays. We show that extinction risk was greater where fishing pressure was higher, but this was offset by the strength of management engagement (indicated by strength of National and Regional Plan of Action for sharks and rays). The regional Red List Index (which tracks changes in extinction risk through time) declined in all regions until the 1980s but then improved in the North and Central Atlantic such that the average extinction risk is currently half that in the Southwest. Many sharks and rays are wide ranging, and successful fisheries management in one country can be undone by poorly regulated or unregulated fishing elsewhere. Our study underscores that well-enforced, science-based management of carefully monitored fisheries can achieve conservation success, even for slow-growing species.
Global fish landings are underestimated with as much as one-third missing, and most fisheries are unassessed (1, 2). Only half of the reported landings comes from stocks or populations with a formal assessment, with appropriate management generally leading to healthier stocks (3). However, most of the stock assessments that integrate the best available data (e.g., catch history, abundance trends, age structure, and life history information) are conducted for economically high-valued species by the wealthiest countries with high management capacity (3). The remainder of the reported catch is from fisheries that are generally located in lower capacity regions yet are still subject to heavy exploitation and are unassessed (1, 3). While fisheries in lower capacity regions may be less visible to the global economy, they are a vital safety net for millions of people as a source of livelihood, poverty alleviation, nutrition, and well-being (4–6). Limited understanding of the effectiveness of management measures around the world has hampered our progress toward the zero-overfishing target of the United Nations Sustainable Development Goal 14 (7). Furthermore, the social and economic dimensions of fisheries are underpinned by resilient ecosystems, which require the presence of functionally important species, including predators (8, 9).
Intense conservation efforts have successfully recovered some populations of marine megafauna, notably marine mammals (10). It is a different story for most sharks and rays, which have been largely depleted globally (10, 11). Oceanic sharks and rays have declined by 71% since 1970, and three-quarters of these wide-ranging species are threatened (12). Half of coastal sharks and rays (51%, 296 of 582 species) are threatened with extinction primarily due to overfishing based on the International Union for Conservation of Nature (IUCN) Red List of Threatened Species criteria (13). The high intrinsic sensitivity of many sharks and rays (due to long generation times and low intrinsic population growth rates) combined with their long history of overfishing has likely caused permanent biodiversity loss through numerous local and regional extinctions (14–16). There is now increasing evidence that three species are also globally extinct (13, 17, 18). Some shark and ray populations are recovering and being sustainably fished, but such success stories are restricted to select, well-managed fisheries in developed countries, such as Australia, New Zealand, the United States, or Canada (19, 20; Appendix S2).
The depletion of sharks and rays throughout most of the oceans is representative of the dire status of many other data-poor stocks in countries with low capacity or political will for fisheries management (21, 22). Fisheries could progress toward sustainability with the implementation of management measures and periodic assessments of their effectiveness. For some managed fisheries in wealthy countries, this is typically accomplished by comparing management decisions against quantitative metrics of stock status. By contrast, most of the world’s shark and ray catch is not monitored or managed. Only 3% (43 of the 1,199) of all chondrichthyan species have a formal stock assessment (23), and threatened species protections are often not enforced (24, 25). Yet, considerable success in understanding the status of shark and ray stocks has been achieved using comparative analyses of direct and indirect measures of fishing pressure and management capacity, such as the presence of government fishery management plans or extent of spatial protection (11, 18, 26). Managing threatened shark species in the absence of conventional stock assessments is a general challenge. Even developing countries and island states may need to use catch control measures without formal assessments to prevent overfishing and comply with international treaty obligations.
Coastal sharks and rays that inhabit a wide latitudinal range provide an opportunity to explore the diversity of exposure to fishing and the effectiveness of management. Indeed, wide-ranging species are more likely to be threatened globally because they span more jurisdictions and hence are more likely to encounter a patchwork of management regimes with large proportions of their distribution poorly managed (27, 28). Here, we analyzed trends in fishing pressure, fisheries management, and population status for all 26 coastal sharks and rays that occur in all three United Nations Food and Agriculture Organization [FAO] Major Fishing Areas in the Western Atlantic Ocean. This area encompasses a very diverse range of fishing activity and fisheries management capacity and enforcement. For example, Brazil and Mexico have large and growing economies but have lower engagement in fisheries management than the United States—although all maintain intense fishing pressure (11, 29–31). The Western Central Atlantic (FAO region 31) also encompasses small island developing states with fisheries targeting sharks and rays and low management capacity (32).
To make an ecological inference about the effect of fisheries management, we take advantage of this Before–After Control–Impact natural experimental design; this could be considered a counterfactual approach of analyzing population status “with” and “without” management intervention (33). We first used a Before–After temporal comparison to quantify the success of fisheries management by comparing available population trends of 11 wide-ranging coastal shark species in the US Atlantic waters before and after the implementation of the Fishery Management Plan for Sharks of the Atlantic Ocean in 1993 (Fishery Management Plan) (34) (SI Appendix, Fig. S3). This plan was developed in response to the intense expansion of commercial and recreational fisheries in the 1970s to 1980s due to the increased demand for shark meat, fins, and cartilage worldwide and concerns about their effects on shark populations (35). Prior to the 1990s, sharks were considered an underutilized resource, and commercial and recreational fishers were encouraged and otherwise incentivized to fish for them (36), resulting in severe depletion of some large coastal sharks (35, 37). Second, we estimated the regional IUCN Red List status of all 26 wide-ranging coastal sharks and rays in the Western Atlantic and used the current Northwest Atlantic (FAO region 21) IUCN Red List statuses as the managed “Control” against which to compare the “Impact” of undermanagement in the Southwest Atlantic (FAO region 41). We used a Bayesian mixed-effect ordinal logistic model to evaluate the IUCN Red List status as a function of intrinsic sensitivity of species (maximum body size) and regional fishing exposure (catches of sharks and rays) and indirect measures of fisheries management (the presence and robustness of a National or Regional Plan of Action for sharks and rays, hereafter “Shark-Plan”). These Shark-Plans should address ten aims for sustainable fisheries and conservation spanning sustainability, threat assessment and protection of threatened species, effective consultation between different stakeholders, waste minimization, protection of the ecosystem and its functions, and improved monitoring and reporting of catch, landings, and trade. The development of these plans was encouraged following the creation of the International Plan of Action for the Conservation and Management of Sharks (“IPOA-Shark”) in the 1990s by the FAO (38). We also considered three other proxies for national engagement in management: fisheries subsidies, parties to the recent Port State Measures Agreement to combat Illegal, Unregulated, and Unreported Fishing, and the coverage of no-take marine protected areas (MPAs). Finally, we identified the expected gains resulting from conservation action by developing a regional Red List Index (RLI) to track changes in the relative extinction risk of taxa over time across the three FAO regions (39, 40).
Results
Analysis of the available time series data in the east coast waters of the United States shows that almost all of the 11 focal species either increased (toward rebuilding, n = 6) or stabilized (n = 3), following adoption of the 1993 Fishery Management Plan (Fig. 1 and SI Appendix, Fig.S4). For example, the White Shark (Carcharodon carcharias) population time series began in 1961 with an annual rate of decline of −0.07% (95% credible interval [CI]: −0.11, −0.01) until 1993 and then stabilized and subsequently increased at an annual rate of increase of 0.1% (95% CI: 0.02, 0.19) soon after the introduction of the Fishery Management Plan (Fig. 1). The positive change in the annual trend after the introduction of the Fisheries Management Plan is clear, with 99% of the posterior distribution showing population increase (Fig. 1B). Similarly, five other species (Tiger Shark Galeocerdo cuvier, Scalloped Hammerhead Sphyrna lewini, Great Hammerhead S. mokarran, Bonnethead Shark S. tiburo, and Dusky Smooth-Hound Mustelus canis) were declining prior to the introduction of the Fishery Management Plan and have been clearly recovering since, with more than 90% of the posterior distributions showing a population increase in each case. Furthermore, both the Sandbar Shark (Carcharhinus plumbeus) and Dusky Shark (C. obscurus) had population time series that were initially declining in the 1980s but eventually declined at a slower rate toward the end of the time series. However, there was no change in the population time series trajectories of the Lemon Shark (Negaprion brevirostris) or the Blacktip Shark (Carcharhinus limbatus).
Fig. 1.

Temporal comparison of population trends of eleven wide-ranging coastal shark species in US waters before and after the 1993 implementation of the Fishery Management Plan for Sharks of the Atlantic Ocean ordered by decreasing effect change. (A) Modeled time series for each species (individual time series for each species is shown in SI Appendix, Fig. S4). The thick, gray ribbon denotes the 95% credible interval, while the thick line denotes the mean year-to-year change. The line is colored based on the percentage of posteriors of the year-to-year rate of change above (80% dark green and 50% light green) or below (80% red and 50% orange) zero. (B) Posterior distribution of the difference in the rate of change since 1993. The values on the left and right side of the distributions indicate the posterior probabilities of a negative or positive effect change (as percentages), respectively. *Dusky Smooth-Hound was added to the 1993 Fishery Management Plan for Sharks of the Atlantic Ocean for data collection purposes only. **Two Blacktip Shark time series were considered for the two existing stocks (Gulf of Mexico and US East Coast).
We found a clear difference in shark and ray fishing exposure and fisheries management between the Northwest and the Southwest Atlantic (Fig. 2A and SI Appendix, Figs. S1 and S2). The Northwest Atlantic has an intermediate fishing exposure (Fig. 2B), with shark and ray catches totaling 0.3 metric tonnes (mt) km−2 across this region from 2001 to 2018 (the latest available period equivalent to the average generation length of our species, 18 y). The maximum catch over this time was 0.76 mt km−2 for the United States (Fig. 2A). However, this region has a high score for fisheries management (Fig. 2C) based on the combination of the highest regional Shark-Plan average score over 2003 to 2020 of 13 of 20 (driven by an older high-quality US Shark-Plan and relatively older medium-quality Canadian Shark-Plan). By comparison, the Southwest Atlantic has double the fishing exposure, with shark and ray catches totaling 0.61 mt km−2, and half the management engagement (Shark-Plans average score of 6 of 20 with recent medium-quality Shark-Plans; Fig. 2B). Similar patterns were found with two other metrics of fisheries management (fisheries subsidies and support of the Port State Measures Agreement; SI Appendix, Fig. S2). The equivalent of 10% of the value of all landed catch was spent on “harmful” capacity-enhancing fisheries subsidies in the Southwest Atlantic, which was 1.5 times higher than those in the Northwest Atlantic, while only 7% was spent on beneficial subsidies (e.g., research and management), which was 1.8 times lower than those in the Northwest Atlantic (SI Appendix, Fig. S2). All countries in the Northwest Atlantic are signatories to the Port State Measures Agreement. However, in the Southwest Atlantic region, only 3% of the area is managed by signatories of the Port State Measures Agreement. Finally, coverage of no-take MPAs is low in both the Northwest and Southwest Atlantic (around 0.02%) and higher (1%) in the Western Central Atlantic (FAO 31) (SI Appendix, Fig. S2). However, these three proxies were less informative because their temporal and/or spatial scales were narrow relative to the ranges of our focal species.
Fig. 2.

Regional differences in fishing exposure, management engagement, and the IUCN Red List status of 26 wide-ranging coastal sharks and rays in the Western Atlantic. (A) Maximum distribution range of the species within national Exclusive Economic Zones (EEZs), whereby national values for fishing exposure are shown with the filled polygon color (red shades, natural Jenks Break) and fisheries management (National or Regional Plan of Action for sharks and rays, Shark-Plan) are shown with polygon edge colors (blue shades, equal breaks). Fishing exposure is the total catch in metric tonnes (mt) km−2 over the last 18 y (2001 to 2018, spanning one average generation length of our 26 species) of all sharks and rays expressed by the surface area of the EEZ of the fishing entity. Fisheries management is the average Shark-Plan quality score (of 20) over the last 18 y (2003 to 2020). FAO major fishing regions average values of (B) fishing exposure for sharks and rays, (C) fisheries management (National Plan of Action for sharks and rays, Shark-Plan score). Both (B) and (C) are lollipop charts, where the dot represents the value, and the line represents the distance from zero. (D) Regional IUCN Red List status of all 26 species [from dark green to red: Least Concern (LC), Near Threatened (NT), Vulnerable (VU), Endangered (EN), and Critically Endangered (CR)].
The North–South contrast is also evident in the differences in the regional IUCN Red List status of the 26 wide-ranging shark and ray species that are present throughout the Western Atlantic (Fig. 2D). The current number of wide-ranging coastal species threatened with extinction is almost four times lower in the Northwest (n = 6 of 26, 23%) than that in the Southwest Atlantic (n = 23 of 26, 88%), where half of these species (n = 13) are listed in the highest threat category—Critically EN (Fig. 2D). The Western Central Atlantic has the lowest fishing exposure (0.16 mt km−2) of all regions but an intermediate score of fisheries management relative to the Northwest and Southwest. Nearly half (45%) of this region is covered by the Port State Measures Agreement, and 1% of the region is covered by no-take MPAs (SI Appendix, Fig. S2). The regional Red List statuses are also intermediate, with eight species threatened (of 26, 31%) and six Near Threatened (NT).
We found that large-bodied species are generally at greater risk of extinction (Fig. 3 A and D; 2.85, 95% CI = 0.45, 5.67; 99% of posteriors above zero) and that regional differences in the Red List status are related to two factors: fishing exposure and fisheries management (Fig. 3 A–C). Fishing exposure (indexed by catches of sharks and rays) increased extinction risk (Fig. 3E; 3.30, 95% CI = −4.45, 9.96, 89% of posteriors above zero), while the fisheries management lowered extinction risk (as indexed by a high-quality Shark-Plan; Fig. 3F; −2.47, 95% CI = −9.39, 4.98, 85% posteriors below zero).
Fig. 3.

Regional IUCN extinction risk status of the 26 coastal sharks and rays explained by the combination of (A) intrinsic sensitivity (maximum body size in centimeters), (B) fishing exposure (catch metric tonnes (mt) km−2), and (C) fisheries management (National or Regional Plan of Action for sharks and rays, “Shark-Plan score”) obtained from the Bayesian mixed-effect ordinal logistic model. (A–C) are colored based on their IUCN extinction risk status ranging from Least Concern (dark green) to Critically Endangered (red). Posterior distributions are shown on the Right panels (D, E, and F) with the values on the left and right sides of the distributions indicating the posterior probabilities of a negative or positive effect change (as percentages), respectively.
Using the same pool of 26 species and retrospective regional extinction risk status, the RLI shows a recent positive trajectory for the Northwest and Western Central Atlantic, which both rebounded after 2005 following an initial decrease in RLI (i.e., increase in extinction risk) from 1980 to 2005 (Fig. 4). This contrasts strongly with the ongoing increase in extinction risk in the Southwest Atlantic. The current RLI is relatively high in the Northwest and Western Central Atlantic (0.82 and 0.78, respectively) but extremely low in the Southwest Atlantic (0.42). This contrast in RLI trajectories represents an important counterfactual, demonstrating the magnitude of conservation success in the Northwest Atlantic, while also showing the challenge, by making clear what could be achieved in the Southwest Atlantic with meaningful management engagement.
Fig. 4.
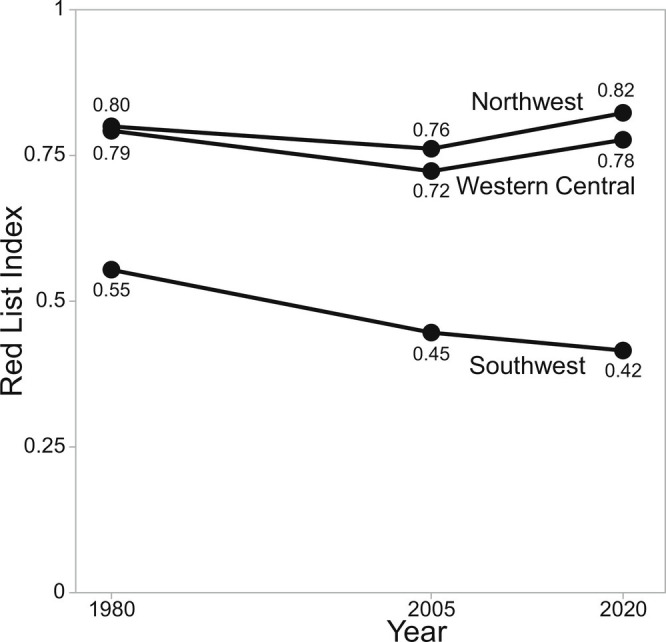
Regional Red List Index of the 26 wide-ranging coastal shark and ray species in three regions: the Northwest, Western Central, and Southwest Atlantic, estimated in 1980, 2005, and 2020. A Red List Index of 1 means all species are Least Concern and a Red List of 0 means all species are Extinct.
Discussion
We found clear evidence for coastal shark fisheries management success following the implementation of fisheries regulations and conservation measures for sharks in the US Atlantic waters in 1993. Across a broader spatial range, we found a consistent pattern of recovery in both population trends and the RLI in the Northwest Atlantic and a steep decline in the Southwest Atlantic, underscoring both the success in US Atlantic waters and the consequences of low management in the Southwest Atlantic. Next, we address 1) the primary elements to the recovery of sharks in US waters, 2) the difference in fishing exposure and the lack of management implementation in the Southwest Atlantic and the intermediate situation in Western Central Atlantic, 3) the strength of fisheries management to reduce extinction risk in coastal sharks and rays, and finally, 4) consider three challenges that, if met, would improve the status of shark and ray populations.
The recovery of sharks in US waters is likely due to three primary elements: regulation, enforcement, and monitoring (SI Appendix, Fig. S3 and Supplementary Text 1). First, since 1993, a strong system of regulations has been put in place for these species, including catch reporting requirements, aggregate- and species-specific quotas, and catch prohibitions for some species [ref. 34 and subsequent amendments to the Fisheries Management Plan]. Second, management is strongly enforced by US Coast Guard and Law Enforcement agencies for fishers in US waters. Third, the government continued to monitor and assess fisheries while reducing fishing mortality with additional regulations when needed. In addition, over the last decades, there has been a significant reduction in the fishing effort through the numbers of vessels, permits, and trips in the US shark fishery (SI Appendix, Fig. S3). For example, in 1997, there were 802 active shark-directed permit holders (active is defined as permit holders who caught at least one shark per year), but that number declined to 114 in 2014 and to 73 in 2019 (41). With strict regulations on fishing, even species with large body sizes, long generation lengths, and large home ranges can recover, although slowly (e.g., White Shark).
In contrast to the trends of species in the Northwest Atlantic, populations of coastal sharks and rays in the Southwest Atlantic are declining due to overfishing. When comparing their IUCN Red List status between all FAO Major Fishing Areas in the Western Atlantic, we found that fishing pressure has been increasing extinction risk. In the Southwest, the intensity of fishing activity has increased and maintained catch levels of some species, even though their fisheries are at risk of collapse (30, 42, 43). The extent of the resource crisis is made apparent by stagnation and decline in the national catch of sharks, the doubling of the price of shark meat, and the rapid rise in imports of shark meat into Brazil (44, 45). High rates of opportunistic retention of incidental catch and some unreported targeted fisheries for sharks or other coastal species contributed to the probable local extinction of some sharks and rays, including the Smalltooth Sawfish (Pristis pectinata), and endemic coastal species such as the Daggernose Shark (Isogomphodon oxyrhynchus) and Smalltail Shark (Carcharhinus porosus) (46–49). Although the general picture appears better in the Western Central Atlantic than in the Southwest, this pattern is mostly driven by recent recovery in managed populations in the US Gulf of Mexico and possible refuge in large areas of less fished habitat, such as The Bahamas (50), and the situation is still very concerning in most Western Central Atlantic countries’ waters.
Here, we show that strong fisheries management reduces extinction risk for sharks and rays. The strongest Shark-Plans completely matched the aims of the IPOA-Shark developed by the FAO in 1999 and were associated with a schedule of actions and estimation of costs. Countries with very comprehensive Shark-Plans tend to already have relatively sound management already in place (11, 15). For countries with low management capacity, a Shark-Plan that closely follows the IPOA-Shark guidelines represents good intentions and the early stages of meaningful shark and ray fisheries management (such as in Brazil, in 2016), even though the plan is nonbinding. While the existence of a high-scoring Shark-Plan may be a precursor to management and an indicator of management improvements, the production of a Shark-Plan by itself is no guarantee of any improvement and is not intended to replace fisheries regulations (such as US Fishery Management Plan) (11, 51). We considered several proxies for management engagement and focused on countries’ Shark-Plans (and regional Shark-Plans) scores as the most informative explanatory variable of the IUCN Red List status of the wide-ranging species.
The other three proxies considered in this study for engagement in sustainable management of shark and ray fisheries included 1) the amount of fisheries subsidies provided by governments, the regional coverage of 2) water of countries that are party to the Port State Measures Agreement, and of 3) no-take MPAs. Fisheries subsidies are payments (direct or indirect) from governments to the fishing sector, and while some of these payments can help reduce fishing pressure (the so-called “beneficial” subsidies), most of the estimated USD $35 billion a year of global fisheries subsidies are considered to be harmful subsidies (52) because they stimulate overcapacity and exacerbate overfishing (e.g., tax exemption or fuel subsidies) (53). Therefore, harmful fisheries subsidies can be used to reflect governments’ support for sustainable management or their willingness to support unsustainable fishing activity (54). As with Shark-Plan scores, we found that beneficial subsidies (standardized by the total profit from all catch), such as investments in fisheries research, monitoring, assessment, or protected areas, were twice as large in the Northwest Atlantic as in the Southwest. However, harmful subsidies in the Southwest Atlantic were almost one and a half times greater than the amount of such subsidies in the Northwest. An obvious task would be to redirect those harmful subsidies to support the transition of both target and incidental capture fisheries to a more sustainable future (54). In recent years, all national waters in the Northwest Atlantic have been entirely covered by the Port State Measures Agreement. The binding nature of this agreement shows the commitment of signatory nations to eliminate Illegal, Unregulated, and Unreported Fishing. However, the ratification rate is low in the rest of the Western Atlantic and, of the signatory parties, not enough time has passed to see meaningful changes to species’ status. This agreement is potentially also less indicative of the fisheries management for coastal species, compared with more oceanic species, as provisions for domestic fishers can be weaker than for those from foreign-flagged vessels. Finally, no-take MPAs have the potential to make a difference in some developing countries where direct fisheries management is currently challenging, but spatial protection still needs a science-based design and effective enforcement to contribute directly to a reduction in shark mortality, which is lacking in some cases. For example, the creation of “shark sanctuaries,” which are branded as a type of shark MPA, vary greatly in their level of regulation (e.g., a ban on commercial targeted fishing for sharks but allowing landings of incidentally caught sharks and rays), have had limited influence because they were created without the additional resources necessary for enforcement of spatial restrictions on fishing (55, 56). Most no-take MPAs are small (<10 km2) and might be more important for smaller-bodied, smaller-ranging species than for the larger, highly migratory wide-ranging species considered here (57).
Our results add context to the growing body of evidence that three challenges, if met, would improve the status of shark and ray populations. Ultimately, consistent reduction of fishing mortality to sustainable levels is essential to meet both biodiversity and sustainable development goals and targets. This can be achieved through measures to 1) improve catch monitoring, 2) employ consistent fisheries management strategies between countries for wide-ranging species moving between jurisdictions, and 3) ensure sustainability of imported seafood.
Initially, a precautionary approach should be used to set fishing limits until species-specific population data are collected to set precise fishing limits and minimize socioeconomic costs. However, decades of poor catch reporting, the lack of species identification, and paucity of species-specific time series can mask changes in catch composition and potential declines of sensitive species. Only one-third of the global catch of chondrichthyans is reported to the species level, and many countries are still reporting aggregated catches using categories (e.g., “sharks” and “hammerheads”) (38). For example, in Mexico, catches of one of the largest shark and ray fishing countries in the region are still recorded in only three categories (“small shark,” “large shark,” or “ray”), despite the identification of catch reporting as a top priority (58, 59). An additional challenge is that coastal Atlantic fisheries are diverse, varying from artisanal, small-scale fisheries to recreational sport fisheries to nearshore industrial fisheries. For example, small-scale fishing vessels represent 97% of Mexico’s fleet (31) and are generally known to be less-intensely managed and monitored than large-scale commercial fisheries (60). Measures and tools to improve monitoring of shark and ray catches include port monitoring measures, increased onboard scientific observer coverage, and electronic monitoring and surveillance. However, for some wide-ranging species that span multiple jurisdictions, these recent advances in management can be undermined by limited reporting of landings and at-sea discards. In these cases, the stocks (or species) will continue to decline if overfishing continues and data reporting practices do not improve enough for status to be accurately assessed (38). Additionally, a key to ensure that more fisheries, especially in low capacity countries, progress toward sustainability is to expand the tool kit of evaluation methods to quantify management impact to address data limitations (13) (SI Appendix, Supplementary Text 2).
Wide-ranging coastal sharks and rays moving broadly through jurisdictions face the added challenge of requiring coordinated regional and/or global efforts across many fishing and trading countries to ensure sustainability. Governments should harmonize fisheries management strategies with bilateral or multilateral agreements [such as the US–Mexico agreement (61)] focusing on regional approaches to manage these transboundary stocks, such that successful conservation in one country is not undone by less regulated fishing areas outside their borders. The Regional Fisheries Management Organizations, which directly manage fisheries in the high seas, are specifically designed for this purpose but have not yet halted fishing mortality and population declines for sharks and rays (12, 62). A Regional Plan of Action is currently being drafted in the Western Central Atlantic region and represents the first comprehensive effort (all 34 members to the Western Central Atlantic Fishery Commission, WECAFC) to ensure that countries sharing the same stocks within this region (including many countries with small Exclusive Economic Zones (EEZs)) collaborate on a shared management plan (63). It is critical that these initial forms of management engagement rapidly mature into concrete, monitored, enforced, and measurable actions to reduce fishing mortality to sustainable levels.
As more developed countries move toward sustainable fisheries (3), they should also ensure they import seafood from sustainable sources (64). The increase in seafood consumption has outpaced that of all other animal proteins in some regions (65). This growing market has incentivized overfishing in some places, including of sharks and rays. For example, Brazil has become one of the world’s top importers of shark meat (66) to meet consumer demand as their domestic stocks have been increasingly overfished. Similarly, much of the seafood in the United States is caught elsewhere (65, 67). Developed countries with good domestic records for sustainable fisheries have ample opportunities to share best practices with other nations and should also strive to ensure that demand from their consumers is not fueling imports of overfished species from other jurisdictions. The requirement to develop Non-Detriment Findings by countries in order to export species listed on Appendix II of the Convention on International Trade in EN Species of Wild Fauna and Flora (CITES) is driving sustainability assessments in many (68), along with associated improvements in data gathering and governance, but, overall, trade reporting, transparency of NDFs, and associated fishing limits are still lacking (69).
Conclusion
We are now in a critical decade where the future of fisheries and the world’s oceans will be determined not only by the extension of protected areas but also by our ability to effectively assess and manage fisheries sustainably in the remainder of the ocean. We conclude that halting and reversing declines to create sustainable fisheries is possible even for wide-ranging sharks and rays with slow life histories, but this requires strong governance and management. Our findings provide hope but are a microcosm of the wider problem faced by sharks and rays. We believe that successful recoveries and rebuilding of species can be spread further by drawing on partnerships with scientists and managers, as well as nongovernmental organizations, coastal fishers, and communities. We must aim beyond extinction avoidance and broaden our ambitions on the recovery of species and sustainable exploitation as future goals to ensure ecosystem functioning and human food security.
Materials and Methods
We first describe the taxonomic scope and the selection of the 26 species of coastal sharks and rays in the Western Atlantic. Second, we used a subset of 11 of these species, for which the only stock assessment time series and other high-quality data were available (from US Atlantic waters) to compare temporal trends. We used a Bayesian population state-space model to calculate the population trajectories before and after the 1993 implementation of the Fishery Management Plan for Sharks of the Atlantic Ocean (34). Third, we detail the regional IUCN’s Red List of Threatened Species status for all 26 species. We then describe the Bayesian ordinal model used to analyze the impact of potential explanatory factors (intrinsic sensitivity, exposure to fishing, and fisheries management). Finally, we describe the calculation of the RLI over time, tracking changes in extinction risk using all the regional IUCN Red List statuses in 1980, 2005, and 2020.
Species Selection.
To select the coastal species occurring in all three FAO Major Fishing Areas covering the Western Atlantic (Northwest: 21, Western Central: 31, and Southwest: 41), we extracted the FAO region of occurrence of all 1,199 species of sharks and rays (and chimaeras) from the IUCN Species Information Service (SIS; and available at https://www.iucnredlist.org/) and determined candidate species occurring in all three selected FAO regions. We retained only species for which the primary habitat is “coastal” (excluding deep water and fresh water) and the species with the primary habitat as “pelagic” and secondary habitat as coastal, as defined in ref. 13. For these reasons, other commonly caught species, such as the Spiny Dogfish (Squalus acanthias), are not included in this assemblage. Carolina Hammerhead (Sphyrna gilberti) was removed as insufficient information exists for our analysis (currently assessed as Data Deficient following the IUCN guidelines, no existing population time series). The final list of 26 coastal species consisted of 17 sharks and nine rays (SI Appendix, Table S1). The nomenclature and taxonomic authorities used for chondrichthyans follow those of the online electronic version of the Catalog of Fishes (70), Sharks of the World (71), and Rays of the World (72).
US Population Time Series Analysis (Before–After Fisheries Management Plan).
Selection of time series.
We obtained time series data for our focal 26 species from Sharkipedia, a curated open-source database of life history trait information and population time series for all sharks and rays (73) (https://www.sharkipedia.org). Selection of the time series was done by JKC and NKD based on the criteria that the time series was representative of US waters and spanned at least a decade before and after 1993. We prioritized the time series already analyzed in the recent (2018 to 2022) IUCN Red List assessments, and when possible, time series from stock assessments were preferred over standardized catch per unit effort (CPUE) or nominal CPUE from scientific surveys or fisheries data (SI Appendix, Table S2).
JARA analysis for time series.
To analyze the population time series, we used a Bayesian population state-space model designed for the IUCN Red List assessments [“Just Another Red List Assessment,” JARA (12, 74, 75)], which builds on the Bayesian state-space tool for averaging relative abundance indices by Winker et al. (76) and is available in a R package on an open-source repository on GitHub (www.github.com/henning-winker/JARA; JARA v. 1.0.9).
Model formulation.
A central assumption of the state-space approach is that trend of index in year follows a Markovian process, such that will be conditioned on the in the previous year . It is assumed that the underlying population trend follows a conventional exponential growth model , where is the growth rate in year . The population growth rate can vary annually to accommodate fluctuations in recruitment, fishing mortality, and other time-varying latent (unobservable) effects. On the log scale, the basic process equation becomes , where , and the annual rate of change is . The annual rate of change realizes a random walk of the form , such that varies around the estimable mean population rate of change (i.e., the underlying trend) given a process error as a function of the estimable process variance . The corresponding observation equation is then formulated as , where is the relative abundance observations for year t and index i, is the natural logarithm of the expected abundance trend, is the lognormal observation error term for index i and year t, and is a scaling parameter for index i. The observation variance was separately estimated for each index i using an additional variance approach to combine inputted SEs (on the log scale) with index-specific variances that were estimated internally by the model, so that The SEs were set generically based on the type data: 1) for population trajectories from stock assessments, 2) for standardized CPUE indices, and 3) for nominal CPUE. The time series of opportunistic sightings data was heavily down-weighted with given the unknown variation in effort through time. Thus, the variance weighting approach represented the sum of an assumed minimal variance for each data type and additional model internal weighting in the form of additional variance estimates.
Time blocks on trend estimation.
For this analysis, we implemented an extension of the JARA process equation to enable the introduction of a time block after which the expected rate of change is reestimated. In this case, the rate of change was partitioned in two time blocks before and after 1993, which was the date of implementation of the Fishery Management Plan for Sharks of the Atlantic Ocean that was intended to rebuild populations. The time block effect is implemented into process equation as , where denotes the difference in the rate of change from the initial period (i.e., ).
Bayesian implementation.
In JARA vague (uninformative), prior distributions are generally used, so all inferences are drawn from the information in the data. The estimation of annual growth rate deviates and is implemented through hierarchical priors (77), where is informed by the population mean for relative abundance indices, and is informed by for absolute abundance indices. Vague normal priors with a mean of 0 and variance of 1,000, are assumed for both and . The initial population size in the first year is drawn in log space from a normal distribution with the mean equal to the log of the first available count and a SD of 1,000. Priors for the process variance () can be either fixed or estimated. If estimated (default), the process variance prior is implemented via a vague inverse-gamma distribution by setting both scaling parameters to 0.001: , which yields an approximately uniform prior on the log scale (76).
Model run.
Three Monte Carlo Markov chains were run for each dataset with different initial values. In each chain, the first 40,000 iterations were discarded (“burn-in”), and of the remaining 60,000 iterations, 10,000 were selected for posterior inference (“thinning rate” = 6). Thus, posterior distributions were estimated from 30,000 iterations. Convergence of each parameter was checked with the Gelman and Rubin diagnostics (78). The observed and predicted abundance values for each time series together with the 95% posterior predictive credibility intervals are in SI Appendix, Fig. S4. We conducted posterior predictive checks (drawing simulated values from the joint posterior predictive distribution of replicated data and comparing these samples to the observed data) by checking that the CI of the fit of the models falls each time within the posterior predictive distribution limits (79). Analyses were performed using R statistical software v4.1.0 (79) and via the package JARA v1.0.9 (75). The highest posterior density interval was used to estimate 95% CIs.
Species Regional Iucn Red List Status of the Species.
While the IUCN Red List assessments were conducted for species at the global scale, the assessors (including JKC, CLR, PC, RAP, and NKD) were challenged to reconcile widely divergent views of the status of species that were more common in the Northwest Atlantic and rare or near-absent in the Southwest Atlantic. In order to do a regional comparison on the status of these 26 species, we (JKC, CLR, and NKD) determined status by FAO regions for 2020, then 2005, and finally 1980 following the recommended IUCN backcast methodology (80, 81). We defined the three regions following the boundaries of the FAO Major Fishing Areas, that is the Northwestern (21), Western Central (31), and Southwestern (41) parts of the Atlantic Ocean. The determination of the status was based on previously published global and regional IUCN Red List Assessments, as well as species-specific and taxonomically aggregated time series from the Sea Around Us reconstructed catch database (1). The IUCN Red List Categories used in the assessments were Critically EN, EN, VU, NT, and Least Concern (LC) as no species of coastal sharks and rays were assessed in the categories Extinct, Extinct in the Wild, or Not Evaluated.
Regional Fishing Exposure and Fisheries Management.
The Western Atlantic coast, from Southwest Greenland to Isla Grande De Tierra del Fuego, Argentina, displays a very diverse range of fisheries management regimes and management capacity, with significant socioeconomic disparities. No global standardized database yet exists to categorize countries’ (referring to states or territories) or regions’ management regimes and the degree of implementation, or marine fishing pressure. We thus used indirect measures (i.e., proxies) intended to represent the relevant fishing pressure and management processes. Given the regional scope of our analysis and that most covariates were at the country level, we describe below 1) the spatial extent of the analysis and the regional delineation and 2) the description of the covariates and the transformation to the regional level when needed. All spatial data described were processed using ESRI ArcGIS v10.7 (82) and R statistical software v4.1.0 (83) in Eckert IV equal-area projection.
Spatial extent of the analysis and regional delineation.
The spatial extent of the analysis is defined as the spatial area where the selected species occur and limited to the maritime boundaries controlled by each country—the EEZ. The final spatial extent of the analysis is the intersection of all species’ maximum range, countries’ EEZ, and FAO regions.
Species maps.
We generated a global distribution range map for each species. For reassessments, these were based on the previous assessment maps (15), which primarily follow the geographic ranges in field guides (71, 72) with modifications based on new records revealed in the IUCN workshop processes (full details in ref. 13). The geographic ranges were clipped to the minimum and maximum depth of demersal species.
EEZ map.
We used the EEZs (200 nautical miles), version 11 (including the boundary polylines) (84). The polygon of the joint regime area between Argentina and Uruguay (part of the Rio de la Plata) was considered a part of each country’s EEZ and merged with their respective EEZ. All overlapping claims (where two states claim sovereignty over the same territory) were removed due to the impossibility to determine the relative influence of countries’ management in these areas. Only the Falkland Islands/Las Malvinas overlapping claim was considered in this analysis as covariates exist for this area.
Delineation of regions.
We used the boundaries of the FAO Major Fishing Areas, especially the Northwestern (21), Western (31), and Southwestern (41) parts of the Atlantic Ocean. The shapefile was downloaded from the FAO website (https://data.apps.fao.org/map/catalog/srv/eng/catalog.search#/metadata/ac02a460-da52-11dc-9d70-0017f293bd28).
From country values to regional covariates.
To transform each country’s covariates to regional covariates, we averaged the countries’ covariates weighted by the proportion of the FAO region’s total area their EEZ represents. The area of joint regimes—where two states can have an agreement to share some control over the same area—such as joint regimes of Colombia and Dominican Republic, Colombia and Jamaica, and Honduras and Cayman Islands—were assigned an average of the countries’ covariate values prior to the calculation of the regional weighted average. The final country values are given in SI Appendix, Table S3.
Covariates.
Fishery exposure.
We used reconstructed shark and ray catches as a proxy of exposure to fishing activity. Outside the United States, there are very few indices of fishing pressure, such as CPUE, reported for sharks and rays. Instead, we extracted the total Sea Around Us project reconstructed reported and reconstructed unreported catch data of all sharks and rays caught in each EEZ (domestic and foreign fleets) and summed the most recent 18 y of available data (1). Eighteen years corresponds to the average generation length of the 26 species selected, given our criteria. Generation lengths are reported on the IUCN Red List assessment for each species (as archived in ref. 13). Thus, the time series of fishery exposure spanned 2001 to 2018 as the Sea Around Us data are not currently available after 2018. We used taxonomically aggregated data (“commercial group” equal to “sharks and rays”) because reconstructed species-specific catch data were not available. The total catch of each EEZ was weighted by the total surface of the EEZ (mt km−2). Two US catch areas were differentiated on the Sea Around Us database, the “East Coast” and the “Gulf of Mexico” (see Sea Around Us website map), but US “East Coast” overlapped two FAO regions (21: Northwest Atlantic, and 31: Western Atlantic). Therefore, we calculated the proportion of the US East Coast in the two regions (52.2% in region 21) and used the result to distribute the weighted total catch of this area across the two regions. Hence, we summed to the US “Gulf of Mexico” total catch for the US EEZ in region 31. In the same way, Brazil’s catch area [“Brazil (mainland)”] in the Sea Around Us database overlapped both regions 31 (Western Atlantic) and 41 (Southwest Atlantic) and was distributed proportionally to the area in each region (1.5% in the region 31).
Recreational catches of Blue Shark (Prionace glauca) in 2017 and 2018 were incorrect on the Sea Around Us database, and we used the corrected version sent by Brittany Derrick (Sea Around Us Catch Reconstruction Team Leader).
Fisheries management.
We quantified fisheries management at the national scale for every country with a Western Atlantic coastline by scoring National or Regional Plan of Action for sharks and rays (hereafter Shark-Plan). Nations can develop Shark-Plans following the framework set by the International Plan of Action for Conservation and Management of Sharks [and rays] (IPOA-Shark) created in the 1990s by the United Nations Food and Agriculture Organization (“UN FAO”) (38). These plans are legally nonbinding and may include some or all of the ten aims as originally set out by the IPOA-Shark. These 10 objectives span sustainability, threat assessment and protection of threatened species, effective consultation between different stakeholders, waste minimization, protection of the ecosystem and its functions, and improved monitoring and reporting of catch, landings, and trade. However, measuring implementation and enforcement is a challenge due to the nonbinding aspect of the Shark-Plan and the nonexistence or low rate of published updates with reports of concrete actions (51). We searched for Shark-Plan documents on the FAO website (https://www.fao.org/ipoa-sharks/database-of-measures/en/), which lists most shark and ray national and regional Shark-Plans and the countries that are involved. We then searched online with the terms “National” or “Regional” “Plan of Action for Sharks,” or “NPOA” or “RPOA,” “+ country name,” and also “Plan de Acción” “Nacional” or “Regional,” or “PAN” or “PAR” “Tiburones + country name” to obtain all Shark-Plan documents and amendments in English and Spanish. CSS then reviewed each document. Each document was given a score of 20, according to the following rubric: one point when the document included one of the 10 aims and another point if the document specified concrete actions, plans, or further elaboration of the aim, specifically with reference to time, budget, and/or manpower (11). The aims were not required to be stated word for word. Where language was unclear, aims could be attributed half points as well. We assumed that the Shark-Plan became active when published and remained active for subsequent years. The score was updated when a new Shark-Plan or amendment was published. When a country had a Shark-Plan and a regional Shark-Plan, the best score was retained. A country with no Shark-Plan and no RPOA thus had a score of 0 of 20. A maximum score of 20 was achieved by the United States as all ten aims were addressed word for word and linked to specific time-bound and budgeted tasks. The annual Shark-Plan scores were averaged between the last 18 y (2003 to 2020 corresponding to the average generation length of our 26 species reported on the IUCN Red List assessment online). Detailed Shark-Plan scores are in SI Appendix, Table S4.
Other proxies for fisheries management (not included in the main analysis).
The methods for the other proxies considered for engagement in sustainable management of shark and ray fisheries, including the type of fishing subsidies provided by governments, whether the national was party to the Port State Measures Agreement to combat Illegal, Unregulated, and Unreported Fishing, and the national coverage of no-take MPAs (shark “sanctuaries” and similar areas that prevent only a partial shark or ray fishing specifically are not included), are in SI Appendix, Supplementary Text 3.
Analysis of Regional Extinction Risk Status vs. Covariates.
We used a Bayesian mixed-effect ordinal model to quantify the impact of selected covariates (fishing exposure and engagement in fisheries management) and intrinsic sensitivity (maximum body size, measured as total length in centimeters) on the regional IUCN extinction risk status of the 26 species (SI Appendix, Table S1 and Supplementary Text 4). Maximum size is an accessible measure of intrinsic sensitivity (16, 85). Preference was given to studies that used, in the following order of preference, validated size, the widest size range, and size estimates that included repeat readers, measuring precision and bias. This ordinal model preserves the variance structure of the ordered categorical response variables, such as the IUCN Red List Categories (LC < NT < VU < EN < Critically Endangered [CR]). The fixed covariates considered were fishing exposure and Shark-Plan score at the regional level and maximum body size of species at the species level. We focused on these covariates as the data were hypothesized to be sufficient to have a potential effect on extinction risk status. For instance, the Shark-Plans have the potential to reflect management engagement over the last two decades, if they were adopted in 2002, compared with the Port State Measures Agreement that entered into force only in 2016. Similarly, most MPAs were created during the last decade, and capacity-enhancing fisheries subsidies only represent a snapshot of the current fisheries situation in 2018.
Each covariate was scaled by the means and standardized by dividing by two standard deviations. We included the species identity and the region as a cross-level random effect. All models were implemented in the R statistical language v.4.1.0 (83) using the brms package v.2.16.2 (86). Convergence of each parameter was checked with the Gelman and Rubin diagnostics (78). We conducted posterior predictive checks by drawing simulated values from the joint posterior predictive distribution of replicated data and comparing these samples to the observed data, checking that the CI of the fit of the models fell within the posterior predictive distribution limits each time.
Tracking Changes in Regional Extinction Risk Status Over Time.
We calculated changes in extinction risk by tracking the IUCN RLI over time based on the proportion of the 26 coastal shark and ray species in each IUCN Red List Category in 1980, 2005, and 2020 (SI Appendix, Table S1). The RLI value of a particular year t was calculated by multiplying the number of species s in each IUCN Red List Category by the category weight Wc (0 for Least Concern, 1 for Near Threatened, 2 for Vulnerable, 3 for Endangered, 4 for Critically Endangered, and 5 for Extinct) and then summing the product and dividing by the maximum possible product (number of species N multiplied by the maximum weight WEX = 5). This value was subtracted from 1 to have an index between 0 [where all species were extinct (EX)] and 1 (where all species were Least Concern [LC]) (39, 40) as follows:
Supplementary Material
Appendix 01 (PDF)
Acknowledgments
We thank all members of the IUCN Species Survival Commission Shark Specialist Group and invited national, regional, and international experts who attended Shark Specialist Group Red List workshops, as well as all the experts who contributed data and their expertise in-person or by correspondence, especially Cristopher Avalos, María del Pilar Blanco-Parra, Alejandra Briones Bell-lloch, Diego Cardeñosa, Danielle Derrick, William Driggers III, Eloísa Espinoza, Daniel Fernando, Luciana Ferreira, Brit Finucci, Sonja Fordham, Katelyn Herman, Rima Jabado, Peter Kyne, Kwang-Ming Liu, Andrea Marshall, Jorge Manuel Morales-Saldaña, Beatriz Naranjo-Elizondo, Juan Carlos Pérez-Jiménez, Evgeny Romanov, Eric Schneider, Richard Sherley, and Nikola Simpson. We thank Brittany Derrick for sending corrected data from the Sea Around Us project and Karyl Brewster-Geisz and Tobey Curtis for assistance with understanding amendments to the Fishery Management Plan for Sharks of the Atlantic Ocean. We thank the two anonymous reviewers for their constructive comments. This project was funded by the Shark Conservation Fund, a philanthropic collaborative pooling expertise and resources to meet the threats facing the world’s sharks and rays. The Shark Conservation Fund is a project of Rockefeller Philanthropy Advisors. This work was funded by the Shark Conservation Fund as part of the Global Shark Trends Project to N.K.D. and C.A.S. and US National Science Foundation grant DEB-1556779 to H.K.K. URS acknowledges support from the OceanCanada and Solving the Sustainability Challenges at the Food, Climate and Biodiversity nexus Partnerships both supported by the Social Sciences and Humanities Research Council of Canada. N.K.D. was supported by the Natural Science and Engineering Research Council Discovery and Accelerator Awards and the Canada Research Chairs Program. The scientific results and conclusions, as well as any views or opinions expressed herein, are those of the author(s) and do not necessarily reflect those of institutions or data providers.
Author contributions
N.P., J.K.C., H.K.K., P.C., and N.K.D. designed research; N.P., J.K.C., H.K.K., C.L.R., H.W., C.A.S., P.C., R.A.P., R.B., C.S.S., B.S.T., D.J.S., U.R.S., J.H.M., W.J.V., H.F.Y., and N.K.D. performed research; N.P. and H.W. analyzed data; and N.P., J.K.C., H.K.K., C.L.R., H.W., C.A.S., P.C., R.A.P., R.B., C.S.S., B.S.T., D.J.S., U.R.S., J.H.M., W.J.V., H.F.Y., and N.K.D. wrote the paper.
Competing interest
The authors declare no competing interest.
Footnotes
This article is a PNAS Direct Submission.
Data, Materials, and Software Availability
Previously published data were used for this work (73).
Supporting Information
References
- 1.Pauly D., Zeller D., Catch reconstructions reveal that global marine fisheries catches are higher than reported and declining. Nat. Commun. 7, 10244 (2016). [DOI] [PMC free article] [PubMed] [Google Scholar]
- 2.Ovando D., et al. , Improving estimates of the state of global fisheries depends on better data. Fish Fish. 22, 1377–1391 (2021). [Google Scholar]
- 3.Hilborn R., et al. , Effective fisheries management instrumental in improving fish stock status. Proc. Natl. Acad. Sci. U.S.A. 117, 2218–2224 (2020). [DOI] [PMC free article] [PubMed] [Google Scholar]
- 4.Béné C., Hersoug B., Allison E. H., Not by rent alone: Analysing the pro-poor functions of small-scale fisheries in developing countries. Dev. Policy Rev. 28, 325–358 (2010). [Google Scholar]
- 5.Hicks C. C., et al. , Harnessing global fisheries to tackle micronutrient deficiencies. Nature 574, 95–98 (2019). [DOI] [PubMed] [Google Scholar]
- 6.Teh L. C., Sumaila U. R., Contribution of marine fisheries to worldwide employment. Fish Fish. 14, 77–88 (2013). [Google Scholar]
- 7.United Nations, Resolution Adopted by the General Assembly on 6 July 2017, Work of the Statistical Commission Pertaining to the 2030 Agenda for Sustainable Development (A/RES/71/313) (General Assembly New York, NY, USA, 2017). [Google Scholar]
- 8.Pimiento C., et al. , Functional diversity of marine megafauna in the Anthropocene. Sci. Adv. 6, eaay7650 (2020). [DOI] [PMC free article] [PubMed] [Google Scholar]
- 9.Llope M., et al. , Overfishing of top predators eroded the resilience of the Black Sea system regardless of the climate and anthropogenic conditions. Global Change Biol. 17, 1251–1265 (2011). [Google Scholar]
- 10.Duarte C. M., et al. , Rebuilding marine life. Nature 580, 39–51 (2020). [DOI] [PubMed] [Google Scholar]
- 11.Davidson L. N., Krawchuk M. A., Dulvy N. K., Why have global shark and ray landings declined: Improved management or overfishing? Fish Fish. 17, 438–458 (2016). [Google Scholar]
- 12.Pacoureau N., et al. , Half a century of global decline in oceanic sharks and rays. Nature 589, 567–571 (2021). [DOI] [PubMed] [Google Scholar]
- 13.Dulvy N. K., et al. , Overfishing drives over one-third of all sharks and rays toward a global extinction crisis. Curr. Biol. 31, 4773–4787.e8 (2021). [DOI] [PubMed] [Google Scholar]
- 14.Dulvy N. K., Kindsvater H. K., “The future species of Anthropocene seas” in Conservation for the Anthropocene Ocean (Elsevier, 2017), pp. 39–64. [Google Scholar]
- 15.Dulvy N. K., et al. , Extinction risk and conservation of the world’s sharks and rays. Elife 3, e00590 (2014). [DOI] [PMC free article] [PubMed] [Google Scholar]
- 16.Pardo S. A., Kindsvater H. K., Reynolds J. D., Dulvy N. K., Maximum intrinsic rate of population increase in sharks, rays, and chimaeras: the importance of survival to maturity. Can. J. Fish. Aquat. Sci. 73, 1159–1163 (2016). [Google Scholar]
- 17.Lawson J. M., et al. , Extinction risk and conservation of critically endangered angel sharks in the Eastern Atlantic and Mediterranean Sea. ICES J. Mar. Sci. 77, 12–29 (2020). [Google Scholar]
- 18.Yan H. F., et al. , Overfishing and habitat loss drive range contraction of iconic marine fishes to near extinction. Sci. Adv. 7, eabb6026 (2021). [DOI] [PMC free article] [PubMed] [Google Scholar]
- 19.Simpfendorfer C. A., Dulvy N. K., Bright spots of sustainable shark fishing. Curr. Biol. 27, R97–R98 (2017). [DOI] [PubMed] [Google Scholar]
- 20.Grace M. K., et al. , Testing a global standard for quantifying species recovery and assessing conservation impact. Conserv. Biol. 35, 1833–1849 (2021). [DOI] [PubMed] [Google Scholar]
- 21.Momigliano P., Harcourt R., Klein N., Techera E., Sharks: Conservation, Governance and Management (Routledge, Taylor & Francis Group. 2014), p. 89. [Google Scholar]
- 22.Booth H., Squires D., Milner-Gulland E. J., The neglected complexities of shark fisheries, and priorities for holistic risk-based management. Ocean Coastal Manage. 182, 104994 (2019). [Google Scholar]
- 23.RAM Legacy Stock Assessment Database, RAM Legacy Stock Assessment Database v4.495 (v4.495) (2021). 10.5281/zenodo.4824192. (April 1, 2022). [DOI]
- 24.Feitosa L. M., et al. , DNA-based identification reveals illegal trade of threatened shark species in a global elasmobranch conservation hotspot. Sci. Rep. 8, 1–11 (2018). [DOI] [PMC free article] [PubMed] [Google Scholar]
- 25.Lawson J. M., Fordham F., Realizing the potential of the convention on migratory species to conserve elasmobranchs (Shark Advocates International, The Ocean Foundation, 2018). [Google Scholar]
- 26.MacNeil M. A., et al. , Global status and conservation potential of reef sharks. Nature 583, 801–806 (2020). [DOI] [PubMed] [Google Scholar]
- 27.Heupel M. R., et al. , Conservation challenges of sharks with continental scale migrations. Front. Mar. Sci. 2, 12 (2015). [Google Scholar]
- 28.Dulvy N. K., et al. , Challenges and priorities in shark and ray conservation. Curr. Biol. 27, R565–R572 (2017). [DOI] [PubMed] [Google Scholar]
- 29.Neto J. B. G., de Alencar Goyanna F. A., Feitosa C. V., Soares M. O., A sleeping giant: The historically neglected Brazilian fishing sector. Ocean Coastal Manage. 209, 105699 (2021). [Google Scholar]
- 30.Vasconcellos M., Diegues A. C., Kalikoski D. C., “Coastal fisheries of Brazil” in Coastal fisheries of Latin America and the Caribbean (FAO Fisheries and Aquaculture Technical Paper 544, 2011). [Google Scholar]
- 31.Fernández J. I., et al. , “10. Coastal fisheries of Mexico” in Coastal fisheries of Latin America and the Caribbean (Food and Agriculture Organization of the United Nations, 2011), p. 231. [Google Scholar]
- 32.Talwar B. S., Extinction risk, reconstructed catches, and management of chondrichthyan fishes in the Western Central Atlantic Ocean. Fish and Fisheries 00, 1–30 (2022). [Google Scholar]
- 33.Atkinson G., Mourato S., Environmental cost-benefit analysis. Annu. Rev. Environ. Res. 33, 317–344 (2008). [Google Scholar]
- 34.NMFS, “Fishery Management Plan for Sharks of the Atlantic Ocean” (Office of Sustainable Fisheries, National Marine Fisheries Service, Silver Spring, Maryland, 1993). [Google Scholar]
- 35.Musick J. A., Branstetter S., Colvocoresses J. A., “Trends in shark abundance from 1974 to 1991 for the Chesapeake Bight region of the US Mid-Atlantic coast” in Conservation Biology of Elasmobranchs (National Marine Fisheries Service, 1993), pp. 1–18. [Google Scholar]
- 36.Otwell W. S., et al. , “Manual on shark fishing: A compilation of papers” (Sea Grant Project No. SGEP-7, Grant No. NA80AA-D-00038, Sea Grant Report No. 73, Florida Sea Grant College. 44, 1985).
- 37.McCandless C. T., et al. , Status review report: Northwest Atlantic dusky shark (Carcharhinus obscurus) (National Marine Fisheries Service, 2014). [Google Scholar]
- 38.Fischer J., Erikstein K., D’Offay B., Guggisberg S., Barone M., Review of the Implementation of the International Plan of Action for the Conservation and Management of Sharks (FAO Fisheries and Aquaculture Circular I, 2012). [Google Scholar]
- 39.Butchart S. H., et al. , Improvements to the red list index. PLoS one 2, e140 (2007). [DOI] [PMC free article] [PubMed] [Google Scholar]
- 40.Butchart S. H., et al. , Global biodiversity: Indicators of recent declines. Science 328, 1164–1168 (2010). [DOI] [PubMed] [Google Scholar]
- 41.NMFS, “Draft Atlantic Shark Fishery Review (SHARE)” (Highly Migratory Species Management Division, Office of Sustainable Fisheries, National Marine Fisheries Service, Silver Spring, Maryland, 2021). [Google Scholar]
- 42.Barreto R., et al. , Trends in the exploitation of South Atlantic shark populations. Conserv. Biol. 30, 792–804 (2016). [DOI] [PubMed] [Google Scholar]
- 43.Defeo O., Puig P., Horta S., de Alava A., “Coastal fisheries of Uruguay” (Tech. Rep. 544, FAO Fisheries and Aquaculture, Uruguay, 2011). [Google Scholar]
- 44.Bornatowski H., Braga R. R., Kalinowski C., Vitule J. R. S., “Buying a pig in a poke” the problem of elasmobranch meat consumption in Southern Brazil. Ethnobiol. Lett. 6, 196–202 (2015). [Google Scholar]
- 45.Pincinato R. B. M., Gasalla M. A., Garlock T., Anderson J. L., Market incentives for shark fisheries. Mar. Policy 139, 105031 (2022). [Google Scholar]
- 46.Charvet P., Faria V. V., “Southwest Atlantic Ocean” in Sawfish: A Global Strategy for Conservation, Harrison Lucy R., Dulvy Nicholas K. (International Union for the Conservation of Nature Species Survival Commission’s Shark Specialist Group, Vancouver, Canada, 2014), pp. 48–49. [Google Scholar]
- 47.Lessa R., Batista V. S., Santana F. M., Close to extinction? The collapse of the endemic daggernose shark (Isogomphodon oxyrhynchus) off Brazil. Global Ecol. Conserv. 7, 70–81 (2016). [Google Scholar]
- 48.Reis-Filho J. A., et al. , Traditional fisher perceptions on the regional disappearance of the largetooth sawfish Pristis pristis from the central coast of Brazil. Endangered Species Res. 29, 189–200 (2016). [Google Scholar]
- 49.Santana F. M., Feitosa L. M., Lessa R. P., From plentiful to critically endangered: Demographic evidence of the artisanal fisheries impact on the smalltail shark (Carcharhinus porosus) from Northern Brazil. PLos one 15, e0236146 (2020). [DOI] [PMC free article] [PubMed] [Google Scholar]
- 50.Hansell A. C., et al. , Local indicators of abundance and demographics for the coastal shark assemblage of Bimini, Bahamas. Fish. Res. 197, 34–44 (2018). [Google Scholar]
- 51.Lack M., Sant G., The Future of Sharks: A Review of Action and Inaction (Traffic International, 2011). [Google Scholar]
- 52.Sumaila U. R., et al. , Updated estimates and analysis of global fisheries subsidies. Mar. Policy 109, 103695 (2019). [Google Scholar]
- 53.Sumaila U. R., et al. , WTO must ban harmful fisheries subsidies. Science 374, 544–544 (2021). [DOI] [PubMed] [Google Scholar]
- 54.Sumaila U. R., et al. , Financing a sustainable ocean economy. Nat. Commun. 12, 1–11 (2021). [DOI] [PMC free article] [PubMed] [Google Scholar]
- 55.Bustamante G., et al. , Marine protected areas management in the Caribbean and Mediterranean seas: Making them more than paper parks. Aquat. Conserv. Mar. Freshw. Ecosyst. 24, 153–165 (2014). [Google Scholar]
- 56.Valderrama S. P., et al. , Marine protected areas in Cuba. Bull. Marine Sci. 94, 423–442 (2018). [Google Scholar]
- 57.Chin A., et al. , Conceptual frameworks and key questions for assessing the contribution of marine protected areas to shark and ray conservation. Conserv. Biol., 10.1111/cobi.13917 (2022). [DOI] [PMC free article] [PubMed]
- 58.Becerril-García E. E., et al. , Research priorities for the conservation of chondrichthyans in Latin America. Biol. Conserv. 269, 109535 (2022). [Google Scholar]
- 59.Pérez-Jiménez J. C., Mendez-Loeza I., The small-scale shark fisheries in the southern Gulf of Mexico: Understanding their heterogeneity to improve their management. Fish. Res. 172, 96–104 (2015). [Google Scholar]
- 60.Singh-Renton S., McIvor I., “Review of current fisheries management performance and conservation measures in the WECAFC area” (FAO Fisheries and Aquaculture Technical Paper No. 587, Food and Agricultural Organization, 2015).
- 61.N. Fisheries, Bilateral agreements | NOAA fisheries (NOAA, 2021) (September 21, 2022). [Google Scholar]
- 62.Juan-Jordá M. J., et al. , Seventy years of tunas, billfishes, and sharks as sentinels of global ocean health. Science, 378, eabj0211 (2022). [DOI] [PubMed] [Google Scholar]
- 63.Western central atlantic fishery commission (WECAFC), Eleventh Session of the Scientific Advisory Group, Draft Regional plan of action for the conservation and management of sharks, rays and chimaeras in the WECAFC area (WECAFC/SAG/XI/2022/9) (2022), (April 25-27, 2022).
- 64.Smith M. D., et al. , Sustainability and global seafood. Science 327, 784–786 (2010). [DOI] [PubMed] [Google Scholar]
- 65.F. SOFIA, The State of World Fisheries and Aquaculture 2020. Sustainability in action (Food and Agriculture Organization of the United Nations, Rome, 2020). [Google Scholar]
- 66.Dent F., Clarke S., “State of the global market for shark products” (FAO Fisheries and Aquaculture technical paper I, FAO Fisheries and Aquaculture Department, 2015). [Google Scholar]
- 67.Gephart J. A., Froehlich H. E., Branch T. A., Opinion: To create sustainable seafood industries, the United States needs a better accounting of imports and exports. Proc. Natl. Acad. Sci. U.S.A. 116, 9142–9146 (2019). [DOI] [PMC free article] [PubMed] [Google Scholar]
- 68.Vincent A. C., Sadovy de Mitcheson Y. J., Fowler S. L., Lieberman S., The role of CITES in the conservation of marine fishes subject to international trade. Fish Fish. 15, 563–592 (2014). [Google Scholar]
- 69.Friedman K., et al. , Examining the impact of CITES listing of sharks and rays in Southeast Asian fisheries. Fish Fish. 19, 662–676 (2018). [Google Scholar]
- 70.Fricke R., Eschmeyer W. N., Van der Laan R., Catalog of Fishes: Genera, Species, References (California Academy of Sciences, 2022). Electronic version accessed 01/04/2022. [Google Scholar]
- 71.Ebert D. A., Dando M., Fowler S., Sharks of the World: A Complete Guide (Princeton University Press, 2021). [Google Scholar]
- 72.Last P., et al. , Rays of the World (CSIRO publishing, 2016). [Google Scholar]
- 73.Mull C., et al. , Sharkipedia: A curated open access database of shark and ray life history traits and abundance time-series. Scientific Data 9, 559 (2022). [DOI] [PMC free article] [PubMed] [Google Scholar]
- 74.Sherley R. B., et al. , Estimating IUCN red list population reduction: JARA—A decision-support tool applied to pelagic sharks. Conserv. Lett. 13, e12688 (2020). [Google Scholar]
- 75.Winker H., Pacoureau N., Sherley R. B., JARA: Just another red-list assessment. bioRxiv [Preprint] (2020). 10.1101/672899. [DOI]
- 76.Winker H., Carvalho F., Kapur M., JABBA: Just another Bayesian biomass assessment. Fish. Res. 204, 275–288 (2018). [Google Scholar]
- 77.Jiao Y., Hayes C., Cortés E., Hierarchical Bayesian approach for population dynamics modelling of fish complexes without species-specific data. ICES J. Mar. Sci. 66, 367–377 (2009). [Google Scholar]
- 78.Gelman A., Rubin D. B., Inference from iterative simulation using multiple sequences. Statist. Sci. 7, 457–472 (1992). [Google Scholar]
- 79.Gelman A., et al. , Bayesian Data Analysis (CRC Press, 2013). [Google Scholar]
- 80.Butchart S. H. M., et al. , Measuring global trends in the status of biodiversity: Red list indices for birds. PLoS Biol. 2, e383 (2004). [DOI] [PMC free article] [PubMed] [Google Scholar]
- 81.Bubb P., et al. , IUCN Red List Index: Guidance for National and Regional Use (Version 1.1, IUCN, 2009). [Google Scholar]
- 82.Environmental Systems Research Institute (ESRI), ArcGIS desktop (Version 10.7, Redlands, CA, 2019). [Google Scholar]
- 83.R Core Team, R: A Language and Environment for Statistical Computing (R Foundation for Statistical Computing, Vienna, Austria, 2021). [Google Scholar]
- 84.Flanders Marine Institute, Maritime Boundaries Geodatabase (Version 11, 2019).
- 85.Denney N. H., Jennings S., Reynolds J. D., Life–history correlates of maximum population growth rates in marine fishes. Proc. Biol. Sci. 269, 2229–2237 (2002). [DOI] [PMC free article] [PubMed] [Google Scholar]
- 86.Bürkner P.-C., brms: An R package for Bayesian multilevel models using Stan. J. Statist. Software 80, 1–28 (2017). [Google Scholar]
Associated Data
This section collects any data citations, data availability statements, or supplementary materials included in this article.
Supplementary Materials
Appendix 01 (PDF)
Data Availability Statement
Previously published data were used for this work (73).