

Summary
Increase in grain yield is always a major objective of wheat genetic improvement. The SQUAMOSA promoter‐binding protein‐like (SPL) genes, coding for a small family of diverse plant‐specific transcription factors, represent important targets for improving grain yield and other major agronomic traits in rice. The function of the SPL genes in wheat remains to be investigated in this respect. In this study, we identified 56 wheat orthologues of rice SPL genes belonging to 19 homoeologous groups. Like in rice, nine orthologous TaSPL genes harbour the microRNA156 recognition elements (MRE) in their last exons except for TaSPL13, which harbour the MRE in its 3′‐untranslated region (3′UTR). We modified the MRE of TaSPL13 using CRISPR‐Cas9 and generated 12 mutations in the three homoeologous genes. As expected, the MRE mutations led to an approximately two‐fold increase in the TaSPL13 mutant transcripts. The phenotypic evaluation showed that the MRE mutations in TaSPL13 resulted in a decrease in flowering time, tiller number, and plant height, and a concomitantly increase in grain size and number. The results show that the TaSPL13 mutants exhibit a combination of different phenotypes observed in Arabidopsis AtSPL3/4/5 mutants and rice OsSPL13/14/16 mutants and hold great potential in improving wheat yield by simultaneously increasing grain size and number and by refining plant architecture. The novel TaSPL13 mutations generated can be utilized in wheat breeding programmes to improve these agronomic traits.
Keywords: wheat genome editing, SQUAMOSA promoter‐like (SPL), microRNA156, yield, plant architecture
Introduction
As the most widely grown crop, wheat (Triticum aestivum) is the staple food crop for 35% of the world population, provides 20% of daily calories and proteins (FAO, http://www.fao.org/faostat/), thus plays an important role in global food security. Recent years saw the fragility of wheat production and supplies due to climate change and regional wars. To meet the demands of the growing world population, wheat production also needs to be increased at an unprecedented rate of 1.7% per annum (http://iwyp.org). High yielding has been one of the top objectives of wheat breeding. In the post‐Green Revolution era, the improvement of grain yield in rice is largely achieved by utilization of desired alleles from yield‐related genes in addition to heterosis (Huang et al., 2011, 2018; Ikeda et al., 2013; Sakamoto and Matsuoka, 2008; Wing et al., 2018; Zeng et al., 2017; Zhang et al., 2017b). A large number of yield genes and their alleles have been identified in rice by forward genetics approaches, such as mapping‐based cloning of quantitative trait loci (QTLs) and screening of the T‐DNA insertion libraries (Huang et al., 2018; Si et al., 2016; Wing et al., 2018; Zhang et al., 2017b; Zuo and Li, 2014). These yield genes are conserved between rice and wheat (Li & Yang, 2017), which are potential candidates for improving wheat yield by reverse genetics approaches, such as CRISPR‐Cas9‐based genome editing.
Of these rice yield‐related genes, several encode SQUAMOSA promoter‐binding protein‐like (SPL) transcription factors (TFs), including the GRAIN LENGTH and WEIGHT 7 (GLW7) allele of OsSPL13 (Si et al., 2016), the ideal plant architecture‐1d (ipa‐1d) (Jiao et al., 2010), and ipa‐2d (Zhang et al., 2017b) alleles and epi‐allele WEALTHY FARMER'S PANICLE (WFP) (Miura et al., 2010) of OsSPL14, and the GRAIN WEIGHT 8 (GW8) allele of OsSPL16 (Wang et al., 2012). The SPL gene family is plant‐specific (Preston and Hileman, 2013) and regulates a plethora of plant developmental and yield‐related traits (Chen et al., 2010). In rice, the increased the expression of the OsSPL mutant alleles contributes to the grain yield and plant architecture. The GLW7 allele increases the expression of OsSPL13 and positively regulates cell size in the grain hull and enhances grain length and yield (Si et al., 2016). GW8 positively regulates cell division during grain filling and increases grain width and yield (Wang et al., 2012). The ipa‐1d (Jiao et al., 2010), ipa‐2d (Zhang et al., 2017b), and WFP (Miura et al., 2010) mutants define a new plant type with reduced tiller number, increased lodging resistance, and enhanced grain yield. The allelic variants corresponding to GLW7, GW8, and ipa1/WFP of rice remain to be identified in wheat.
One of the important features of the SPL family is that more than half of its members are negatively regulated by microRNA156/157 (miR156) (Wang and Wang, 2015). The OsSPL13/14/16 harbours the miR156 recognition element (MRE), and the GW8 (Wang et al., 2012) and ipa‐1d (Jiao et al., 2010) alleles are due to the rare mutations in the MREs. The miR156 levels are higher during the vegetative phase and decrease as the plant ages (Wang et al., 2009; Wu et al., 2009). Concomitantly, levels of SPL transcripts increase with the decrease in miR156 levels (Wang, 2014). This miR156‐SPL module acts as a regulatory hub for controlling various plant developmental features such as phase transition and flowering time, tillering/branching, fruit ripening, plant architecture, yield, and response to stresses (Wang and Wang, 2015). Therefore, this regulatory hub can be engineered to fine‐tune the expression of SPL genes for enhanced agronomic traits.
Engineered CRISPR/Cas9 is a powerful genetic tool for site‐specific modifications of eukaryotic genomes (Doudna and Charpentier, 2014). The core requirement of CRISPR‐Cas9 is a 20‐bp protospacer and a trinucleotide 5′‐NGG‐3′ protospacer adjacent motif (PAM) (Jinek et al., 2012; Sternberg et al., 2014). For specific SPL gene editing, a gene‐specific guide RNA with PAM motif within or close to the MRE is required. After meeting the requirement of PAM and complementary base pairing between gRNA and target sequence of the SPL genes, Cas9 can induce double‐strand breaks (DSBs) at the MRE site (Cong et al., 2013; Deltcheva et al., 2011; Jinek et al., 2012). The error‐prone nonhomologous end‐joining (NHEJ) repair machinery joins these broken ends while doing so can cause mutations in the MRE (Puchta, 2017; Puchta et al., 1996). This tool can be utilized for targeted mutagenesis of the miR156‐SPL module to release them from the negative regulation of miR156 for enhanced agronomic traits in crops. Because conventional CRISPR‐Cas9 technology mainly produces deletions and insertions, which cause frameshift, it can only be applied to the MREs outside of the coding regions. Modification of the MREs within the coding region, however, will require precision editing technologies, such as base editing or prime editing, to avoid altering the protein sequences.
The SPL gene family, particularly miR156‐SPL module, in wheat, has not been well documented despite a few reports on bioinformatics analysis of the SPL gene family using the diploid wheat genome assemblies (Wang et al., 2015a; Zhang et al., 2014), haplotype analysis of TaSPL20 and TaSPL21 in wheat (Zhang et al., 2017a), exogenous expression of TaSPL16 in Arabidopsis (Cao et al., 2019), and knockout of TaSPL14 (Cao et al., 2021). Thus, there are significant knowledge gaps in understanding the SPL gene family and miR156‐SPL module in wheat. To gain insights into the function of SPL genes in the regulation of yield components and other agronomic traits, we conducted the phylogenetic analysis and domain prediction of TaSPL genes in hexaploid wheat. Based on the phylogenetic analysis we identified the TaSPL13 gene that is orthologous to rice OsSPL13, and that is the only SPL gene in wheat, which carries MRE for miR156 in its 3′‐untranslated region (3′UTR). Targeting the MRE of TaSPL13 using CRISPR‐Cas9, we developed 12 NHEJ mutations in hexaploid wheat Fielder. We subsequently analysed the phenotypic effects of both single mutants of TaSPL13‐B and TaSPL13‐AB. The mutations in TaSPL13‐B and TaSPL13‐AB displayed a pleiotropic phenotypic effect with increased seeds per spike, decreased tillers, increased grain width, reduced height, and earliness in flowering. Our results show that there is a functional divergence in TaSPL13 and OsSPL13, and the TaSPL13 phenotype has a mosaic of OsSPL13/14/16 and AtSPL3/4/5 phenotypes in rice and Arabidopsis, respectively.
Results
Phylogenetic analysis of wheat SPL genes
Searching the wheat proteome sequences (IWGSC, 2018) using the SQUAMOSA promoter‐binding (SPB) domain as a query led to the identification of 56 TaSPL genes at 19 orthologous loci, which are named following their rice homologues for convenience of comparison (Xie et al., 2006) except for the wheat ortholog of OsSPL5, which has been named as TaSPL21 by Zhang et al. (2017a) (Table 1; Figure 1a). While no orthologues were found for OsSPL11/12/19, duplications were detected at the OsSPL10 orthologous locus in the wheat genome. Accordingly, the three SPL10 paralogues were named as TaSPL20/22/23, of which TaSPL23 was previously studied under the same designation (Cao et al., 2021; Zhang et al., 2017a; Figure 1; Table 1). TaSPL10/20/22/23 form a tandem cluster on the group‐7 chromosomes (Table 1) and are next to each other in the phylogenetic tree (Figure 1a). Searching the genomes of grasses, including barley, Brachypodium, maize, rice, sorghum, and diploid (T. urartu and Aegilops tauschii), and tetraploid wheat species (T. turgidum), we found that all species except tetraploid wheat contain only one member at the SPL10 locus. Like hexaploid wheat, tetraploid wheat (durum wheat and wild emmer) had three similar genes in the collinear region. These results indicate that the cluster is specific for polyploid wheat, suggesting that the duplication occurred upon the first round of polyploidization, which gave rise to tetraploid wheat and transmitted to the hexaploid wheat, and the duplication recurrently occurred in the D‐genome after hexaploidization. Except for TaSPL23, the B‐genome copy of which is missing in the wheat reference genome, all three homoeologs are present for the remaining 18 TaSPL genes (Table 1). Thus, the SPL gene family members are largely conserved across grasses but significantly reshaped by polyploidization in the wheat lineage.
Table 1.
List of rice and wheat SPL genes with the MRE sequence in wheat
| Rice SPL genes | Wheat SPL genes | Wheat gene ID | MRE Sequence in wheat SPL |
|---|---|---|---|
| OsSPL1 | TaSPL1‐A | TraesCS7A02G208000 | No MRE |
| TaSPL1‐B | TraesCS7B02G115200 | No MRE | |
| TaSPL1‐D | TraesCS7D02G210400 | No MRE | |
| OsSPL2 | TaSPL2‐A | TraesCS3A02G432500 | TGTGCTCTCTCTCTTCTGTCA |
| TaSPL2‐B | TraesCS3B02G468400 | TGTGCTCTCTCTCTTCTGTCA | |
| TaSPL2‐D | TraesCS3D02G425800 | TGTGCTCTCTCTCTTCTGTCA | |
| OsSPL3 | TaSPL3‐A | TraesCS6A02G110100 | ATGCTCTCTCTCTTCTGTCA |
| TaSPL3‐B | TraesCS6B02G138400 | ATGCTCTCTCTCTTCTGTCA | |
| TaSPL3‐D | TraesCS6D02G098500 | ATGCTCTCTCTCTTCTGTCA | |
| OsSPL4 | TaSPL4‐A | TraesCS6A02G155300 | GTGCTCTCTCTCTTCTGTCA |
| TaSPL4‐B | TraesCS6B02G183400 | GTGCTCTCTCTCTTCTGTCA | |
| TaSPL4‐D | TraesCS6D02G145200 | ATGCTCTCTCTCTTCTGTCA | |
| OsSPL5 | TaSPL5(21)‐A | TraesCS6A02G152000 | No MRE |
| TaSPL5(21)‐B | TraesCS6B02G180300 | No MRE | |
| TaSPL5(21)‐D | TraesCS6D02G142100 | No MRE | |
| OsSPL6 | TaSPL6‐A | TraesCS4A02G359500 | No MRE |
| TaSPL6‐B | TraesCS5B02G512800 | No MRE | |
| TaSPL6‐D | TraesCS5D02G513300 | No MRE | |
| OsSPL7 | TaSPL7‐A | TraesCS2A02G413900 | GTGCTCTCTCTCTTCTGTCA |
| TaSPL7‐B | TraesCS2B02G432700 | GTGCTCTCTCTCTTCTGTCA | |
| TaSPL7‐D | TraesCS2D02G410700 | GTGCTCTCTCTCTTCTGTCA | |
| OsSPL8 | TaSPL8‐A | TraesCS2A02G502300 | No MRE |
| TaSPL8‐B | TraesCS2B02G530400 | No MRE | |
| TaSPL8‐D | TraesCS2D02G502900 | No MRE | |
| OsSPL9 | TaSPL9‐A | TraesCS1A02G255300 | No MRE |
| TaSPL9‐B | TraesCS1B02G266100 | No MRE | |
| TaSPL9‐D | TraesCS1D02G254700 | No MRE | |
| OsSPL10 | TaSPL10‐A | TraesCS7A02G494900 | No MRE |
| TaSPL10‐B | TraesCS7B02G402400 | No MRE | |
| TaSPL10‐D | TraesCS7D02G482300 | No MRE | |
| OsSPL11 | NA | NA | |
| OsSPL12 | NA | NA | |
| OsSPL13 | TaSPL13‐A | TraesCS2A02G232400 | TGCTCCCTCTCTTCTGTCA |
| TaSPL13‐B | TraesCS2B02G250900 | TGCTCCCTCTCTTCTGTCA | |
| TaSPL13‐D | TraesCS2D02G232800 | TGCTCCCTCTCTTCTGTCA | |
| OsSPL14 | TaSPL14‐A | TraesCS7A02G246500 | TGTGCTCTCTCTCTTCTGTCAA |
| TaSPL14‐B | TraesCS7B02G144900 | TGTGCTCTCTCTCTTCTGTCAA | |
| TaSPL14‐D | TraesCS7D02G245200 | TGTGCTCTCTCTCTTCTGTCAA | |
| OsSPL15 | TaSPL15‐A | TraesCS7A02G249100 | No MRE |
| TaSPL15‐B | TraesCS7B02G142200 | No MRE | |
| TaSPL15‐D | TraesCS7D02G248000 | No MRE | |
| OsSPL16 | TaSPL16‐A | TraesCS7A02G260500 | TGTGCTCTCTCTCTTCTGTCA |
| TaSPL16‐B | TraesCS7B02G158500 | TGTGCTCTCTCTCTTCTGTCA | |
| TaSPL16‐D | TraesCS7D02G261500 | TGTGCTCTCTCTCTTCTGTCA | |
| OsSPL17 | TaSPL17‐A | TraesCS5A02G265900 | TGTGCTCTCTCTCTTCTGTCAA |
| TaSPL17‐B | TraesCS5B02G265600 | TGTGCTCTCTCTCTTCTGTCAA | |
| TaSPL17‐D | TraesCS5D02G273900 | TGTGCTCTCTCTCTTCTGTCAA | |
| OsSPL18 | TaSPL18‐A | TraesCS5A02G286700 | TGTGCTCTCTCTCTTCTGTCA |
| TaSPL18‐B | TraesCS5B02G286000 | TGTGCTCTCTCTCTTCTGTCA | |
| TaSPL18‐D | TraesCS5D02G294400 | TGTGCTCTCTCTCTTCTGTCA | |
| OsSPL19 | NA | NA | |
| OsSPL10 | TaSPL20‐A | TraesCS7A02G495000 | No MRE |
| TaSPL20‐B | TraesCS7B02G402300 | No MRE | |
| TaSPL20‐D | TraesCS7D02G482400 | No MRE | |
| OsSPL10 | TaSPL22‐A | TraesCS7A02G495100 | No MRE |
| TaSPL22‐B | TraesCS7B02G402200 | No MRE | |
| TaSPL22‐D | TraesCS7D02G482500 | No MRE | |
| OsSPL10 | TaSPL23‐A | TraesCS7A02G494800 | No MRE |
| TaSPL23‐D | TraesCS7D02G482200 | No MRE |
Figure 1.
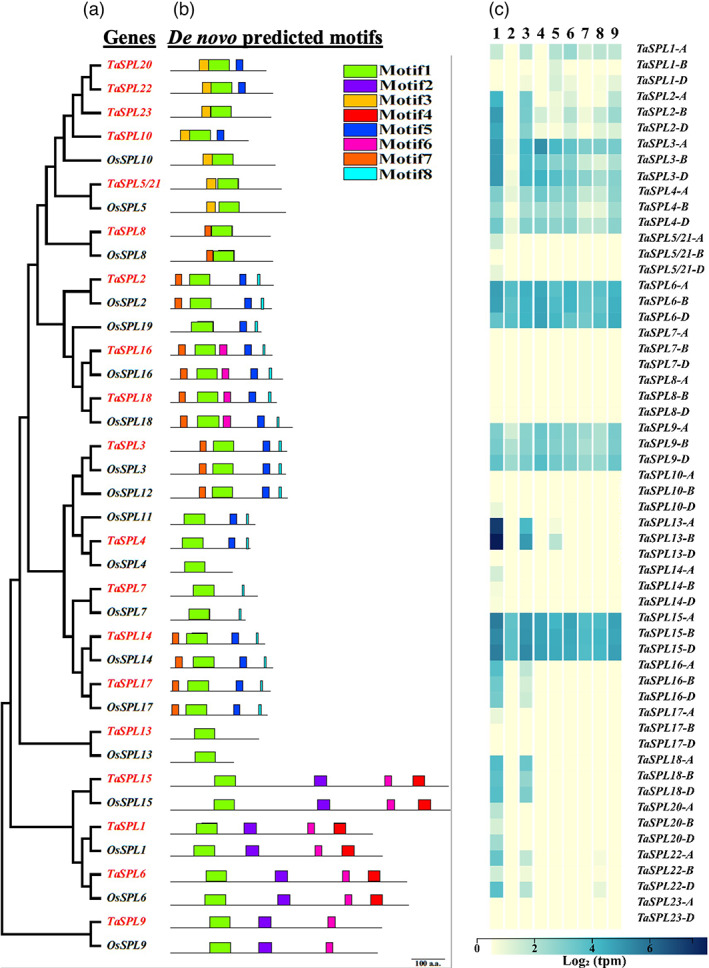
Phylogenetic analysis, de novo motif prediction and expression pattern of SPL genes. (a) For phylogenetic tree construction, the D‐genome copies of hexaploid wheat (red colour) and rice SPL genes (black colour) were used. (b) the de novo predicted motifs from the amino acid sequences encoded by the SPL genes are colour‐coded. Motif 1 is the SBP domain and is present in all SPLs. Motif 8 is encoded by MRE, which is present in the last exon of some of the SPL genes. The MRE of OsSPL4, OsSPL13, and TaSPL13 is present in the 3′‐UTR, hence not shown in the figure. The phylogenetic tree was constructed using MEGA7 software (https://www.megasoftware.net/), the protein motifs were predicted using the MEME suite (http://meme‐suite.org), and the MRE was predicted using the miRbase (http://mirbase.org) online tool. The scale bar indicates 100 amino acids. (c) Heatmap indicating expression pattern of wheat TaSPL genes in nine different tissues on a Log2 TPM (transcripts per million) scale. Blue colour indicates higher expression, and the white colour indicates lower expression. The nine tissues are numbered 1–9 on top of the heat map, where 1: young spikes, 2: grains, 3: matured spikes, 4: roots at reproductive stage, 5: leaves/shoots at reproductive stage, 6: roots at the vegetative stage, 7: leaves/shoots at the vegetative stage, 8: leaves/shoots at the seedling stage, 9: roots at the seedling stage. The heatmap was generated using a wheat expression browser (http://www.wheat‐expression.com/).
Of the 19 orthologous TaSPLs, TaSPL2/3/4/7/13/14/16/17/18 carry the miR156 MREs located in the coding regions except for TaSPL13 (Figure 1b). Like its rice ortholog OsSPL13, TaSPL13 encodes the smallest SPL protein only containing the SBP domain and harbouring the MRE in its 3′UTR. Mining the wheat transcriptome database WheatExp (https://wheat.pw.usda.gov/WheatExp/) revealed all nine miR156‐regulated TaSPL genes being expressed in most of the wheat tissues, with the highest levels detected in spikes and stems (Figure 1c). Three homoeologs of each TaSPL are present in the A, B, and D genomes, but not all the homoeologs are expressed equally. In some cases, one homoeolog is dominant in all the tissues over the others. For example, the A‐genome homoeolog of TaSPL1, the B‐genome homoeologs of TaSPL2/13, and the A‐ and D‐genome homoeologs of TaSPL3/4/9/18/20/22 are predominant over the others (Figure 1c), suggesting that expression of the TaSPL genes may have been reprogrammed upon polyploidization. The highest expression of these genes is detected in spikes (Figure 1c), which suggests their role in spike development and morphology. Within the TaSPL10/20/22/23 cluster, TaSPL23 is not expressed in any of the eight tissues, and TaSPL10/20/22 are expressed in the young and matured spikes (Figure 1c), suggesting that subfunctionalization occurred after duplication of these SPL genes.
Engineering the MRE of TaSPL13 by CRISPR/Cas9
Because the MRE is in the 3′UTR of TaSPL13, the NHEJ mutations of small indels (insertions/deletions) in the MRE are expected to increase the abundance of the TaSPL13 transcripts and not change the amino acid sequence of the TaSPL13 protein. The MRE contains two PAM motifs in the antisense strand, which would facilitate in targeting the MRE sequence to disrupt the miR156 binding (Figure 2a). Previously, we developed transgenic plants in Fielder expressing the CRISPR/Cas9 targeting the MRE of TaSPL13 (Figure 2a,b) and identified two mutations in two T1 populations, a 10‐bp and a 25‐bp deletion in the MRE of TaSPL13‐A in plants #32 and #38, respectively (Zhang et al., 2019). Further efforts to screen the T2 and T3 progenies of these mutant lines led to the identification of ten more mutations, six in TaSPL13‐B and four in TaSPL13‐D (Figure 2d; Table 2). Out of the six mutations in TaSPL13‐B, two mutations, both of 1‐bp insertion, were confined within the MRE. One of the 1‐bp insertions was recovered in the background of TaSPL13‐a (10‐bp deletion) and designated TaSPL13‐ab, and another was recovered from the other T1 population as a single mutation and designed as TaSPL13‐b. Remaining four mutations are large deletions expanded into the coding region (Figure 2d; Table 2). Interestingly, both the 1‐bp insertions were the same nucleotide (thymine) inserted at the same position in TaSPL13‐B originating from two different T2 populations. Both mutations were treated as independent events during phenotypic analysis because they were generated and recovered in different T2 plants. Of the four TaSPL13‐D mutations, a 5‐bp deletion and a 33‐bp deletion occurred within the MRE, and the other two mutations, a 39‐bp deletion and a 75‐bp deletion expanded into the coding regions of homoeologous copies of TaSPL13 (Figure 2d; Table 2). Both mutations in TaSPL13‐A, 1‐bp insertions in TaSPL13‐B, and 5‐bp deletions in TaSPL13‐D were selected for further evaluation because these mutations did not affect the amino acid sequences of the TaSPL13 proteins.
Figure 2.
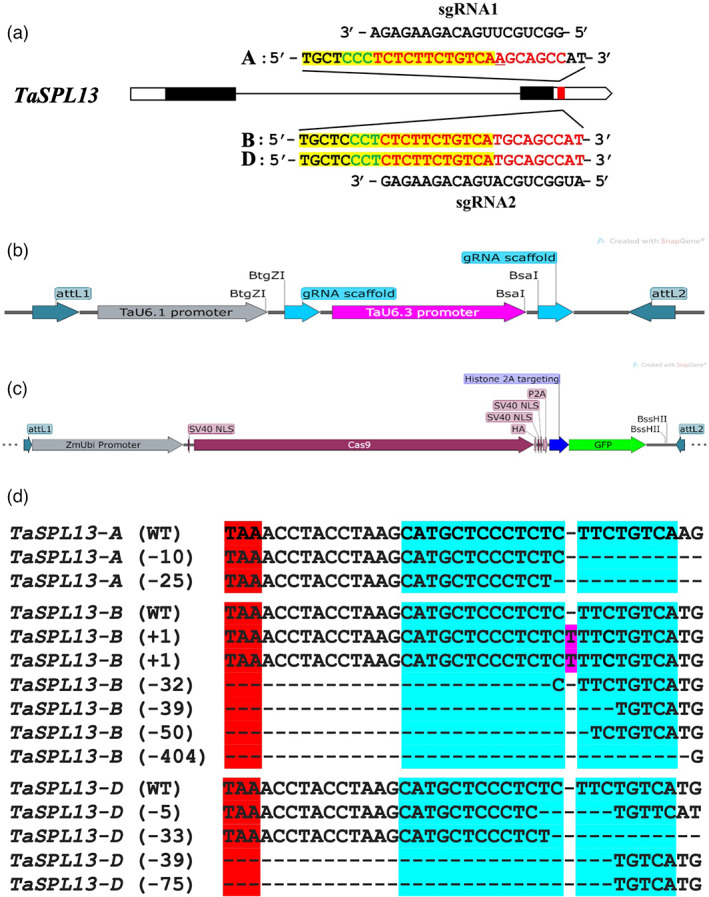
Engineering the MRE of TaSPL13. (a) The gene model of the TaSPL13 gene with black blocks representing the exons and white blocks representing the 5′‐ and 3′‐UTRs. The genomic sequences targeted by two sgRNAs (only spacer sequences shown) are shown in red letters with the PAM in green and MRE shaded in yellow. The underlined letter in the protospacer sequence for sgRNA1 shows an SNP corresponding to sgRNA2. (b) The entry vector cassette for cloning the sgRNAs, BtgZI, and BsaI restriction sites is used for digestion‐ligation cloning. The entry vector has attL sequences for the Gateway LR cloning. (c) The binary vector cassette with Cas9 for wheat transformation. The sgRNA along with TaU6 promoters is cloned into the binary vector. (d) Mutations were obtained in the T1 and subsequent generations. The genotype is written on the left side, mutation size is written inside the parentheses, minus sign is for deletion, and plus sign for insertion. Blue highlighted text is the MRE, red highlighted TAA triplet is the stop codon, magenta colour indicates the insertion, and dash lines represent sites of deletions. Five out of 12 mutations did not affect the coding region.
Table 2.
Mutation count in different generations corresponding to the genotype
| Transgenic generation | Population size | Mutant genotypes | ||
|---|---|---|---|---|
| TaSPL13‐a | TaSPL13‐b | TaSPL13‐d | ||
| T0 | 2 | 0 | 0 | 0 |
| T1 | 74 | 2 | 0 | 0 |
| T2 | 90 | 0 | 0 | 1 |
| T3 | 265 | 0 | 6 | 3 |
| Total | 431 | 2 | 6 | 4 |
Although the MRE mutations are gain‐of‐function in increasing the expression of the TaSPL13 genes, the double or triple mutations, particularly the double mutations of the TaSPL13‐A and TaSPL13‐B, may enhance the phenotype of the mutants. Thus, we combined the mutations in A‐, B‐, and D‐genome copies by the genetic crossing and obtained double and triple mutant lines. While double‐mutant TaSPL13‐ab (aabbDD) was developed by the identification of the first 1‐bp insertion in TaSPL13‐B in the background of the 10‐bp deletion in TaSPL13‐A, and a triple mutant TaSPL13‐abd was developed by combining the 25‐bp deletion in TaSPL13‐A, the second 1‐bp insertion in TaSPL13‐B, and the 5‐bp deletion in TaSPL13‐D via genetic crosses.
Mutations in MRE interfere with the miR156‐mediated repression of TaSPL13
To validate the suppressive activity of miR156 on TaSPL13 and to quantify the effect of the MRE mutations, we conducted dual luciferase assays (Liu et al., 2014; Moyle et al., 2017). In the luciferase assays, tobacco leaves were infiltrated with Agrobacterium clones overexpressing a single miR156 encoding gene of wheat and carrying the wild‐type or the mutant MRE sites ligated to the 3′UTR of firefly luciferase (F‐LUC) as target and renilla luciferase (R‐LUC) as an internal control. Compared with the wild‐type MRE, complete loss of MRE control showed a 5.3‐fold higher luciferase signal, implying that the TamiR156 gene has the suppression activity in tobacco. The MRE mutations had varying effects on TamiR156‐mediated LUC gene repression (Figure 3a); the 1‐bp insertion of TaSPL13‐B, 10‐ and 25‐bp deletion of TaSPL13‐A, and 5‐bp deletion of TaSPL13‐D lead to 2‐ to 4‐fold more (P < 0.05) F‐LUC signal than intact miR156 MRE, respectively. This suggests that the MRE of TaSPL13 is a target of the wheat miR156, and disruption of the MRE site can lead to the increased transcript abundance of TaSPL13.
Figure 3.
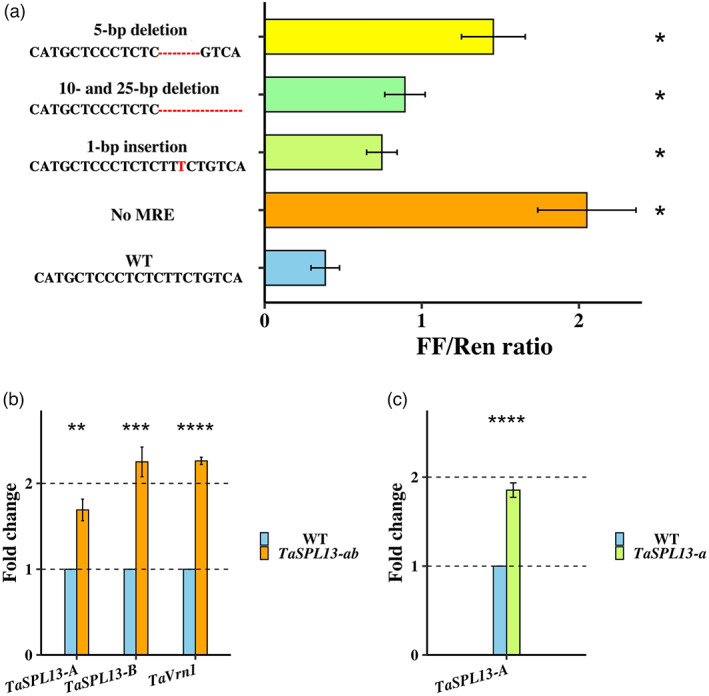
Effect of MRE mutations on TaSPL13 expression using dual luciferase assay and RT‐qPCR. (a) Dual luciferase assay was carried out on four CRISPR‐induced mutations and a no MRE control. Significant release of repression was observed in all mutations with no MRE being the highest with 5‐fold higher FF activity. In mutant MREs ~2‐ to 4‐fold higher FF luciferase was detected, strengthening the hypothesis that the MRE mutations lead to increased SPL13 transcript levels in wheat. (b) Mutations in MRE of TaSPL13‐A (25‐bp deletion) and B (1‐bp insertion) increased their expression by 1.7‐ and 2.3‐fold, respectively, and major flowering gene in wheat TaVrn1 was upregulated 2.3‐fold in TaSPL13‐ab lines. (c) the 10‐bp deletion in the TaSPL13‐A increased the expression by 1.9‐fold in the TaSPL13‐a lines. MRE; microRNA recognition element, FF; Firefly luciferase, Ren; Renilla luciferase, WT; Wildtype, strikethrough represents the no MRE control, red coloured nucleotides indicate the variation from the WT, and red dash lines represent the deletion mutations. * Indicates P‐value <0.05, ** indicates P < 0.01, *** indicates P < 0.001, ****P < 0.0001.
The WheatExp database (https://wheat.pw.usda.gov/WheatExp/) showed that, of the three homoeologs, TaSPL13‐B had the highest expression in developing spikes at a level of 321.3 fragments per kilobase per million mapped reads (FPKM) as compared to TaSPL13‐A with only 3.0 FPKM, and the expression of TaSPL13‐D was undetectable (Figure 1c and Figure S1a). In addition to the developing spikes, the transcription of TaSPL13‐B was observed in stem and developing grains at a lower level of 13.6 and 11.2 FPKM, respectively, while TaSPL13‐A and TaSPL13‐D were undetectable (Figure 1c and Figure S1a). Because TaSPL13 was expressed at the highest level in the developing spikes, we quantified the effect of the MRE mutations on the TaSPL13 transcript levels in this tissue type in the WT and mutant lines using quantitative reverse transcription PCR (qRT‐PCR). In accordance with WheatExp, the transcript level of TaSPL13‐B was found to be at least 10‐fold higher than that of TaSPL13‐A in the WT lines (P = 0.018; Figure S1b). Due to high sequence similarity, we were unable to develop TaSPL13‐D‐specific qRT‐PCR primers. Thus, most of our transcript analysis focussed on A and B gene mutations. The 10‐bp and 25‐bp deletions increased the expression of TaSPL13‐A ~1.8‐fold in the double‐mutant TaSPL13‐ab and single‐mutant TaSPL13‐a (P < 0.002; Figure 3b,c), and the 1‐bp insertion increased the expression of TaSPL13‐B 2.25‐fold (P = 0.00079) compared with the WT segregant lines (Figure 3b). To observe the effect of TaSPL13‐D MRE mutation, however, we used the universal primers that could amplify all three genes and found that 5‐bp deletion in MRE of TaSPL13‐D in the single‐mutant background had no significant difference in transcript level (Fold change = 0.987; P = 0.89) compared with WT possibly due to undetectably low amounts of TaSPL13‐D transcripts. Thus, our qRT‐PCR results comply with the dual luciferase assay and suggest that MRE mutations suppress the miR156 repression of TaSPL13 leading to ~2‐fold increase of TaSPL13 transcripts in mutant lines compared with WT segregant lines.
TaSPL13‐b/ab/abd mutants have an early flowering phenotype
The development of the additional TaSPL13 mutations, particularly the double and triple mutations, provides an opportunity to characterize the function of this gene in wheat. To this end, we phenotyped the TaSPL13 mutants in the 2019 fall and 2020 spring seasons under greenhouse conditions for flowering time, tiller numbers, plant height, grain number per spike, and grain size. Compared with the WT segregants, the TaSPL13‐b/ab/abd mutants flowered 1–2 weeks earlier (Figure 4a–h and Figure S2a–e). The WT plants grown in the fall season headed in 73 days and flowered in 81.8 days and plants grown in the spring season headed in 50.3 days and flowered in 60 days. The TaSPL13‐ab mutants headed 11 days (P = 1.56E‐03), flowered 10 days (P = 5.45E‐03), and matured 15 days (P = 1.43E‐09) earlier in the fall (Figure 4b,e,g,h), while in spring the same mutants headed 5 days (P = 5.62E‐06) and flowered 6 days (P = 1.49E‐05) earlier than the WT plants (Figure S2b,d,e). The TaSPL13‐b single‐mutant lines displayed a similar phenotype to TaSPL13‐ab lines (Figure 4a,d,g,h and Figure S2a,d,e). Moreover, the two knockout lines with deletions extended to the coding region in TaSPL13‐B headed and flowered at least 12 days late compared with the WT in spring (P < 3.05E‐06; Figure S3a,b). These results indicate that TaSPL13 protein is involved in phase transitioning and reproductive development in wheat. The flowering characters of the mutant lines remained consistent during different seasons. In Arabidopsis, AtSPL3/4/5 proteins physically interact with the flowering locus T (FT)‐FD module to facilitate vegetative‐to‐reproductive transitioning by direct upstream activation of LEAFY (LFY), FRUITFUL (FUL), and APETALA1 (AP1) (Yamaguchi et al., 2009). Wheat TaSPL13 is orthologous to Arabidopsis AtSPL3, and wheat VERNALIZATION 1 (TaVrn1) is orthologous to Arabidopsis AP1 (Yan et al., 2003). We examined the expression of TaVrn1 and found that it increased 2.3‐fold in the double‐mutant TaSPL13‐ab as compared to the WT (P = 1.7E‐09; Figure 3b). This result suggests putative functional conservation between the TaSPL13 and AtSPL3 in terms of phase transition and flowering.
Figure 4.
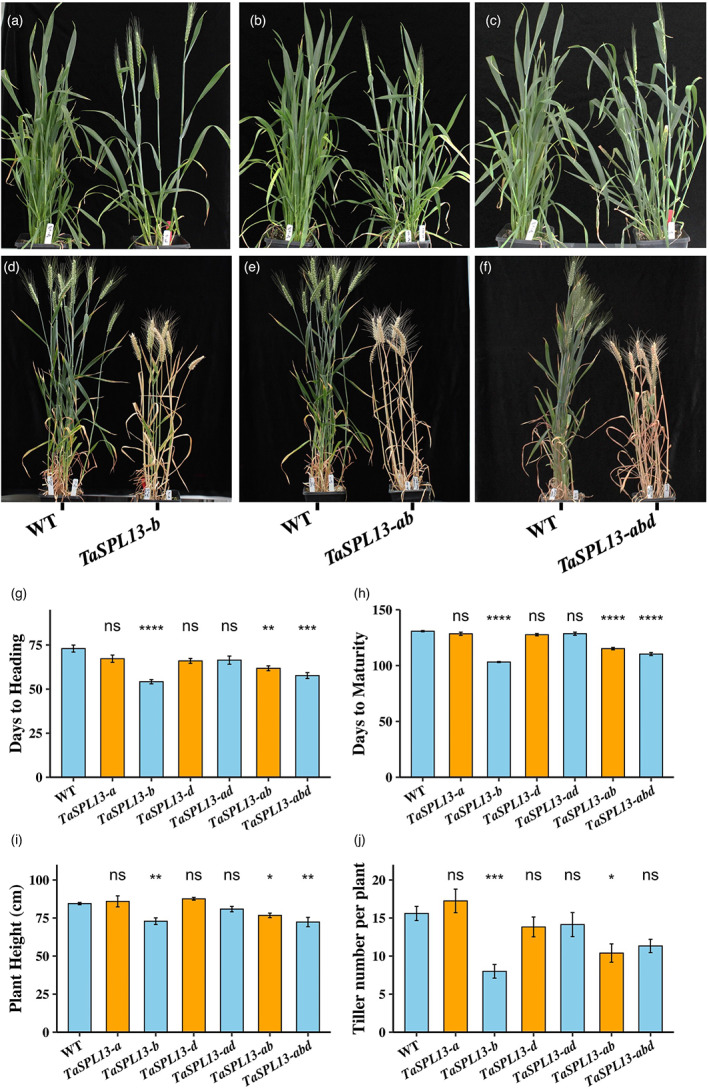
Effect of TaSPL13 mutations on flowering time and plant architecture during the 2020 fall season. (a–f) Phenotype of TaSPL13 mutant lines for heading and maturation time. The TaSPL13‐b/ab/abd plants (g) headed and (h) matured earlier compared with the WT plants, (i) plant height of TaSPL13‐b/ab/abd mutants reduced and (j) the tiller number also reduced. Error bars represent the standard error to the mean, * indicates P < 0.05, ** indicates P < 0.01, *** indicates P < 0.001, and **** indicates P < 0.0001. The P‐values are adjusted for multiple comparisons using Bonferroni correction.
TaSPL13 mutations reduced tiller numbers and plant height
Along with early flowering, the TaSPL13‐b/ab displayed reduced tillering capacity and plant height characteristics. In the fall season, the TaSPL13‐b/ab plants showed >7.17% reduction in plant height (from 84.5 cm to 74–78.44 cm; P < 0.05; Figure 4a,b,d,e,i) and >33.3% reduction in tiller number per plant as compared to the WT (P < 0.05; Figure 4a,b,d,e,j). But the differences in plant height and tiller numbers between the TaSPL13‐b/ab and the WT plants grown in the spring season were not significant (Figure S2f,g). A similar trend was observed for the triple mutant line TaSPL13‐abd in both seasons (Figures 4c,f,I and Figure S2c,f), except for tiller numbers (Figure 4c,f,j and Figure S2c,g). The tiller number for TaSPL13‐abd reduced by 27% in the fall (P = 0.0613) and the spring seasons (P < 0.05; Figure S2f,g). Notably, TaSPL13‐b lines had either a similar or more drastic effect on plant height and tiller number compared with TaSPL13‐ab/abd lines, suggesting that the B‐genome copy is the major contributor of TaSPL13 mediated plant growth and development. To validate this possibility, we measured the plant height and tiller number from the two TaSPL13‐B knockout lines. The two independent knockout lines of TaSPL13‐B displayed an increased plant height by at least 15% compared with the WT (P < 1.99E‐05; Figure S3c), but the tiller number remained unaffected in these mutant lines (P > 0.24).
TaSPL13 mutations increased grain size and grain number per spike
One of our major objectives for the development of the TaSPL13 mutants is to improve the wheat grain yield components. Thus, we scored grain number per spike, grain size, and thousand‐grain weight (TGW) of the mutants and the WT plants in the fall and spring seasons. In the fall season, grain numbers on the main‐stem spikes increased by 18.6% in TaSPL13‐b compared with the WT (P = 0.0246, Figure 5a,d). The spikelet number per spike did not change significantly (P = 0.8194) while the seed numbers per spikelet increased by 13.75% in TaSPL13‐b lines compared with the WT (P = 0.0213, Figure 5a,e). The grain area and TGW of the TaSPL13‐b plants also increased by 11.2% (P = 7.3E‐06, Figure 5f) and 5.9% (P = 0.0353, Figure 5i), respectively, compared with the WT. The increase in grain size was contributed by both an increase in grain width (7.9%; P = 2.19E‐05; Figure 5c,g) and an increase in grain length (by 4.0%; P = 0.0054; Figure 5h) with a greater degree in the former. The TaSPL13‐ab displayed comparable results for grain area (12.8% increase; P = 9.17E‐06; Figure 5c,f), but the increase in grain number was not significant (6.0%; P = 0.3; Figure 5d) compared with the WT segregant lines.
Figure 5.
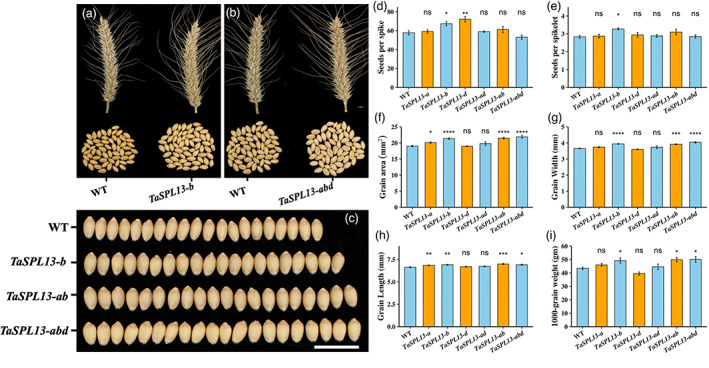
Effect of TaSPL13 mutations on grain size and number during the 2020 fall season. (a, b, d, and e) Grains per spike and spikelet per spike of the TaSPL13‐b lines were higher than WT. Grain area (f), grain width (c, g), grain length (h), and 1000‐grain weight (i) of TaSPL13‐b/ad/abd lines increased significantly compared with WT. Error bars represent the standard error to the mean, * indicates P < 0.05, ** indicates P < 0.01, *** indicates P < 0.001, and **** indicates P < 0.0001. The P‐values are adjusted for multiple comparisons using Bonferroni correction.
In spring, no increase in grain number per spike and spikelet per spike was detected in both TaSPL13‐b and TaSPL13‐ab mutants compared with the WT (P > 0.9183; Figure S4a,b), while the grain size increased by 4.8% in TaSPL13‐b (P = 0.0034; Figure S4c) and 6.2% in TaSPL13‐ab mutant compared with the WT (P = 0.01; Figure S4c). The TGW increased by 12.5% in TaSPL13‐abd (P < 0.05; Figure S4d) and ~10% in TaSPL13‐b but at a nonsignificant level (P = 0.14; Figure S4d). These results indicate that the TaSPL13 mutations increased grain size both in the fall and spring seasons despite quantitative variations.
Discussion
While the SPL‐miR156 module plays an important role in plant development (Xu et al., 2016), it also functions as a regulatory hub controlling many important agronomic traits in cereal crops (Wang et al., 2015a; Wang and Wang, 2015). Due to high selection pressure, the MRE is highly conserved across the plant kingdom and the only MRE mutation, i.e. ipa‐1d mutant allele of OsSPL14, was found in rice (Jiao et al., 2010). For functional characterization of the TaSPL genes in native conditions and exploring the SPL‐mi156 module for genetic improvement of wheat, we phylogenetically analysed the TaSPL family and developed 12 NHEJ mutations targeting the MRE in the TaSPL13. Our functional and molecular analysis of TaSPL13 is the first report of the TaSPL‐TamiR156 module in wheat. The results from this study showed a functional divergence in the SPL genes among cereal crops with a pleiotropic effect on plant development and agronomic traits. Thus, the TaSPL13 mutations developed will provide opportunities not only for the functional study of TaSPL genes in wheat but also for germplasm innovation for wheat breeding.
Many SPL TFs act redundantly in controlling the various traits of plant development (Chen et al., 2010). Therefore, the knockout of one gene is often complicated by other functionally overlapping copies. In hexaploid wheat, most TaSPL genes are triplicated (Ramírez‐González et al., 2018). Thus, a dominant mutation in a single gene is of advantage over its knockout mutations in studying its phenotypic effects. The disruption of MRE of TaSPL13 releases the transcriptional and translational repression by miR156 and leads to overexpression in the mutant plants (Figure 3). The semi‐dominant mutations in TaSPL13‐b displayed a nonadditive gene action compared with double and triple mutants. This is partly due to the much higher expression levels of B‐genome copy and/or to the optimal increase of gene expression levels with single mutations. We noticed the discrepancy in the quantitative effect of TaSPL13‐b, ‐ab, and ‐abd on tiller number and plant height (Figure 4i,j). This is possibly due to the background effect because the two 1‐bp insertions in TaSPL13‐B were originated from the different T2 populations.
The most fascinating feature of the SPLs is that such a small TF gene family controls so many developmental processes, including vegetative phase change, flowering, tillering, plastochron, panicle architecture, fertility, and stress response, which represent important targets for crop improvement. Not surprisingly, the miR156‐SPL module was targeted in crop domestication and modern plant breeding. The maize TGA1 locus (Wang et al., 2005, 2015b) and the rice MIR156b/c locus (Wang et al., 2007) have experienced strong selection during domestication. Several spontaneous mutant alleles of the SPL genes in rice have been selected by breeding, such as the GLW7 allele of OsSPL13 (Si et al., 2016), the GW8 allele of the OsSPL16 (Wang et al., 2012), and ipa1‐1D (Jiao et al., 2010), ipa1‐2D (Zhang et al., 2017b), and WFP alleles (Miura et al., 2010) of OsSPL14, for increasing grain yield. In wheat, TaSPL14 knockout mutations showed decreased plant height, panicle length, spikelet number, and thousand‐grain weight (Cao et al., 2021). The TaSPL13‐b and TaSPL13‐ab mutants exhibit a pleiotropic effect on grain size, grain number, plant height, tiller number, and flowering time. All these traits are agronomically important and have a major impact on yield. Grain size in mutant lines increased by 11.5% compared with WT lines consistent with the GLW7 allele of OsSPL13 (Si et al., 2016). Compared with its rice orthologue OsSPL13, TaSPL13 showed a more significant effect on grain width than grain length (Figure 5c,g,h). These results are functionally more resembling OsSPL16, which increases grain width and weight in rice (Wang et al., 2012). Along with wider grains, the spikes bear more grains compared to WT plants with lower but more productive tillers per plant. The increased grain number and reduced tiller number have been observed in OsSPL14, IPA1, and WFP mutant lines (Jiao et al., 2010; Miura et al., 2010). Therefore, the TaSPL13 mutant lines exhibit a mosaic of different phenotypes of AtSPL3/4/5 and OsSPL13/14/16 mutants.
The TaSPL13 mutant effect varies significantly between the fall and spring growing seasons in the greenhouse conditions. Compared with the fall season, the effect of TaSPL13 mutation on plant height, tiller numbers, and flowering time alleviated in the spring season. The WT plants headed and flowered >10 days earlier in spring compared with the fall (P < 3.3E‐08, Figure S5a,b). This contributed to the reduction in plant height (from 84.5 to 72.5 cm; P = 4E‐04; Figure S5c) and tiller number (15.6 to 8.6; P = 3.1E‐05; Figure S5d) of WT plants in the spring season, while the tiller number and plant height for the mutants remained constant during two seasons (P > 0.1). One of the environmental factors differing between the fall and spring seasons would be the day length. In Arabidopsis, the FLOWERING LOCUS T (FT)‐FD complex directly activates SPL3/4/5 genes, which are orthologous to OsSPL13 of rice and TaSPL13 of wheat, under long day (LD) condition in an miR156‐independent manner (Jung et al., 2016; Wang et al., 2009). If the FT‐FD module functions in the same way to activate the TaSPL13, this may explain seasonal variation in the traits, such as plant height, tiller numbers, and flowering time, observed in the present study. Rigorous experiments will be needed to clarify the day‐length effect on the expression of TaSPL13 and validate the TaSPL13 activation by the TaFT‐TaFD module. Among the traits regulated by TaSPL13, the mutant effect on the grain size is least affected by the seasonal variation, suggesting potential in improving grain yield of both spring and winter wheat.
In Arabidopsis, AtSPL3/4/5 are the best‐documented SPL genes for the vegetative‐to‐reproductive phase transition (Wang and Wang, 2015). Without the activation domain, the AtSPL3/4/5 act redundantly to activate LFY, FUL1, and AP1 (Wang et al., 2009; Yamaguchi et al., 2009) via recruitment of the FT‐FD module to the promoters of these direct target genes (Jung et al., 2016). Our TaSPL13‐ab mutant lines with 2‐fold higher levels of TaSPL13‐A and TaSPL13‐B transcripts displayed an increase in the expression of the major flowering gene TaVrn1, orthologous to AP1, by 2.3‐folds in the inflorescence. The promoter region of the TaVrn1 harbours two GTAC motifs putatively for SPL13 binding suggesting possible conservation of genetic pathway in controlling phase transitioning between wheat and A rabidopsis. More work is needed to validate the binding of TaSPL13 protein to these motifs. Identification of the direct targets and interacting proteins will help understand the TaSPL13‐mediated genetic pathway and integration of the environmental factors, day length in particular and genes identified can be specifically modified to optimize the plant type and flowering time and enhance the yield potential.
Recent studies in rice showed that the effect of OsSPL14 on yield depends upon but is not proportional to the expression dosage (Zhang et al., 2017b), and overexpressing SPL transcripts have negative pleiotropic effects (Wang and Zhang, 2017). Similar to this, single mutations of TaSPL13 produced more grains per spike and per spikelet compared with the double mutations. Therefore, the TaSPL13 expression levels need to be fine‐tuned for enhancing agronomic traits. To this end, precise editing of single bases in the MRE by a prime editor (Anzalone et al., 2019; Lin et al., 2020) or CRISPR/Cas9‐mediated tiling deletion of the promoter (Rodríguez‐Leal et al., 2017; Song et al., 2022) can be applied.
Materials and methods
Plant materials and growing conditions
The development of the CRISPR/Cas9 transgenic plants in wheat cultivar Fielder and the T1 populations was described by (Zhang et al., 2019). All the wheat plants were grown in plastic pots containing Pro‐Mix BX Growing Medium (Growers House, Tucson, AZ), one plant in one pot, and placed in the greenhouse with the temperature set at 16 °C for night (8 h) and 22 °C for day (16 h). Approximately 20 g of Multicore controlled‐release fertilizer (Haifa Group, Altamonte Springs, FL) was applied, and the plants were regularly watered.
Phylogenetic analysis and de novo domain prediction
The wheat genome was searched for the SBP domain using the BLASTP tool on Ensembl plants (https://plants.ensembl.org/Triticum_aestivum/Tools/Blast). The phylogenetic tree was constructed using the protein sequences of rice and D‐genome copies of wheat SPL genes. The sequences were aligned using the ClustalW algorithm (Thompson et al., 2003), and MEGA7 software was used for tree construction using the neighbour‐joining method with 1000 bootstrap replicates (Kumar et al., 2016; Saitou and Nei, 1987).
DNA isolation, primer design, and polymerase chain reaction (PCR)
The genomic DNA was isolated from the wheat leaf tissues following the protocol described by (Doyle and Doyle, 1987). The gene‐specific primers for specifically amplifying TaSPL13‐A, TaSPL13‐B, and TaSPL13‐D were listed in Table S1. For PCR, ~100 ng of genomic DNA, 3 μL of 5x GoTaq green buffer, 1 μM each of forward and reverse primers, 0.25 μm of dNTPs and 0.2 μL of Taq polymerase enzyme were added in a 15 μL reaction. The reaction was set to initial denaturation at 95 °C for 5 min, followed by 35 rounds of amplification at 95 °C for 30 s, 55 °C to 65 °C (based on primer annealing temperature) for 30 s and 72 °C for 1 min per kilobase and final extension of 5 min at 72 °C. The resulting PCR product was analysed on agarose gel.
Mutation detection and genotyping
Multiple methods for mutation detection and subsequent genotyping were used. For ribonucleoprotein (RNP), 0.5 μg of Cas9, 0.5 μg of in vitro transcribed sgRNA and 2 μL of 5x Cas9 reaction buffer were mixed with 3 μL of PCR product spanning the sgRNA target sites in TaSPL13 genes and incubated at 37 °C for 3 h followed by inactivation at 65 °C and subsequent analysis through agarose gel electrophoresis (Anders and Jinek, 2014). For T7 endonuclease I (T7E1) assay, 3‐5 μL of the amplified PCR products were denatured/annealed and mixed with 2 μL of 10x cutting buffer, 1 unit of T7E1 (New England Biolabs, Ipswich, MA). The reaction was set up at 37 °C for 3 h, followed by agarose gel electrophoresis. A method of nested PCR‐mediated small indel genotyping was utilized for small indels (Gupta and Li, 2021), and the same approach was combined with semi‐thermal asymmetric PCR, alias STAR‐P (Long et al., 2017), to genotype SNP mutations. For the nested PCR approach, the target loci spanning the gRNA target site were amplified with gene‐specific primers followed by the second round of amplification using common primers to amplify 80–150 bp encompassing the target site. The resulting PCR fragment was analysed through polyacrylamide gel (8%) electrophoresis to detect indels up to a size of 3 bp. For genotyping SNP mutations, the second round of PCR is carried out with allele‐specific primers following STAR‐P guidelines.
Sanger sequencing and sequence analysis
For Sanger sequencing, PCR was performed using the colourless GoTaq buffer. The PCR amplicons were treated with ExoSAP‐IT™ PCR Product Cleanup Reagent (ThermoFisher Scientific, Waltham, MA) following the manufacturer's manual for removing excess dNTPs and primers. The sequence files were analysed manually, using R‐programming and a computer program Ice‐Synthego (https://ice.synthego.com/) for heterozygous chromatograms.
Dual luciferase assay to quantify the repression of target sequences by microRNA
The microRNA genes (miR156) along with hairpin were amplified from the genomic DNA of wheat cultivar Fielder and cloned under 35S promoter at XhoI‐EcoRI sites in pGreen vector (Liu et al., 2014). Additionally, the miRNA binding site was cloned in the 3′UTR of the Firefly LUC at the PstI‐SalI restriction sites (Moyle et al., 2017). The plasmids were introduced into the Agrobacterium strain GV3101 with pSOUP. The agroinfiltration was carried out according to the protocol described by (Liu et al., 2014). Briefly, bacterial culture carrying plasmids for both miRNA and miRNA binding sites were grown overnight and diluted to 0.4–0.6 OD600 using infiltration medium or 0.5X MS + 100 μm acetosyringone. The two clones were mixed at a ratio of 1 : 1 and incubated for 3–4 h at room temperature at 150 rpm. One‐month‐old tobacco leaves were infiltrated using needleless syringes in the abaxial region of the leaf. Each leaf was considered as one biological replicate, and at least six leaves were infiltrated for each. Leaf discs from the inoculated area where chlorosis appeared were harvested 3–5 days after the infiltration in liquid nitrogen. The harvested discs were ground for dual luciferase assay. Dual reporter assay system (Promega, Madison, WI) was used for this assay according to the described protocol (Liu et al., 2014).
RNA isolation, quantitative reverse transcription PCR
Total RNA was isolated from coleoptiles, seedlings, leaves, roots, immature inflorescence, and developing grains using a Tri‐reagent (Zymo Research, Irvin, CA) and purified using a Direct‐Zol RNA Miniprep Plus Clean & Concentrator™ kit (Zymo Research, Irvine, CA). Three biological replicates were used for each genotype. RNA quality and concentration were assessed using the NanoDrop ND‐2000 spectrophotometer (ThermoFisher Scientific, Waltham, MA). The purified RNA samples from leaves, roots, and grains of the transgenic plants and their WT segregants were used for first‐strand cDNA synthesis following the mRNA enrichment oligo dT approach. The resulting cDNA was used for qRT‐PCR analysis following the protocol as described (Zhang et al., 2013). Wheat constitutively expressed genes TaActin and TaRPII were used as internal controls for normalization.
Phenotyping and data analysis
The heading date was determined when the heads emerged on a plant. Flowering time was defined at the anthesis stage, and the maturity date was noted when plants completely dried out. Tiller number and plant height were recorded manually. For grain size and number analysis, the spikes from the main stem were harvested after maturation and dried at 37 °C for 2 days. The spikes were recorded for spikelet number, grain number per spike, and spikelet number per spike manually. The grain size from the spikes was measured using GrainScan software (Whan et al., 2014). Statistical analysis was carried out using the R statistical package (Team, 2013). A two‐tailed student's t‐test was applied for all the statistical analyses, and computed P‐values were reported for two groups. For multiple groups, P‐values were adjusted for multiple comparisons using Bonferroni correction.
Conflicts of interest
The authors declare no competing interest.
Authors' contributions
W.L. and B.Y. conceived the research idea, designed the experiments, and supervised the research. A.G., L.H., and Z.Z. performed the experiments. Z.Z. developed the constructs. A.G. and L.H. identified the mutations. A.G. performed the phylogenetic analysis of the SPL gene family, double luciferase assay, qPCR analysis, and phenotyping of the mutants, and analysed the data. A.G., B.Y., and W.L. wrote the paper, and all authors revised it.
Supporting information
Figure S1 Expression analysis of TaSPL13.
Figure S2 Effect of TaSPL13 mutations on flowering time and plant architecture during the 2021 spring season.
Figure S3 Effect of TaSPL‐b knockout mutations on flowering time and plant height.
Figure S4 Effect of TaSPL13 mutations on grain size and number during the spring season.
Figure S5 Effect of season on flowering time and plant architecture.
Table S1 Primer information.
Acknowledgements
This research is supported by USDA NIFA‐IWYP (award number: 2017‐67008‐25934 to WL and BY). We thank Ahmed Alhusays and Yanhang Zhang for their technical assistance.
Contributor Information
Bing Yang, Email: yangbi@missouri.edu.
Wanlong Li, Email: wanlong.li@sdstate.edu.
REFERENCES
- Anders, C. and Jinek, M. (2014) In vitro enzymology of Cas9. Methods Enzymol. 546, 1–20. [DOI] [PMC free article] [PubMed] [Google Scholar]
- Anzalone, A.V. , Randolph, P.B. , Davis, J.R. , Sousa, A.A. , Koblan, L.W. , Levy, J.M. , Chen, P.J. et al. (2019) Search‐and‐replace genome editing without double‐strand breaks or donor DNA. Nature, 576, 149–157. [DOI] [PMC free article] [PubMed] [Google Scholar]
- Cao, R. , Guo, L. , Ma, M. , Zhang, W. , Liu, X. and Zhao, H. (2019) Identification and functional characterization of squamosa promoter binding protein‐like gene TaSPL16 in wheat (Triticum aestivum L.). Front . Plant Sci. 10, 212. [DOI] [PMC free article] [PubMed] [Google Scholar]
- Cao, J. , Liu, K. , Song, W. , Zhang, J. , Yao, Y. , Xin, M. , Hu, Z. et al. (2021) Pleiotropic function of the SQUAMOSA PROMOTER‐BINDING PROTEIN‐LIKE gene TaSPL14 in wheat plant architecture. Planta, 253, 44. [DOI] [PMC free article] [PubMed] [Google Scholar]
- Chen, X. , Zhang, Z. , Liu, D. , Zhang, K. , Li, A. and Mao, L. (2010) SQUAMOSA promoter‐binding protein‐like transcription factors: star players for plant growth and development. J. Integr. Plant Biol. 52, 946–951. [DOI] [PubMed] [Google Scholar]
- Cong, L. , Ran, F.A. , Cox, D. , Lin, S. , Barretto, R. , Habib, N. , Hsu, P.D. et al. (2013) Multiplex genome engineering using CRISPR/Cas systems. Science, 339, 819–823. [DOI] [PMC free article] [PubMed] [Google Scholar]
- Deltcheva, E. , Chylinski, K. , Sharma, C.M. , Gonzales, K. , Chao, Y. , Pirzada, Z.A. , Eckert, M.R. et al. (2011) CRISPR RNA maturation by trans‐encoded small RNA and host factor RNase III. Nature, 471, 602–607. [DOI] [PMC free article] [PubMed] [Google Scholar]
- Doudna, J.A. and Charpentier, E. (2014) Genome editing. The new frontier of genome engineering with CRISPR‐Cas9. Science, 346, 1258096. [DOI] [PubMed] [Google Scholar]
- Doyle, J.J. and Doyle, J.L. (1987) A rapid DNA isolation procedure for small quantities of fresh leaf tissue. Phytochem. Bull. 19, 11–15. [Google Scholar]
- Gupta, A. and Li, W. (2021) Genotyping strategies for detecting CRISPR mutations in polyploid species: a case study‐based approach in hexaploid wheat. BioRiv .
- Huang, X. , Zhao, Y. , Wei, X. , Li, C. , Wang, A. , Zhao, Q. , Li, W. et al. (2011) Genome‐wide association study of flowering time and grain yield traits in a worldwide collection of rice germplasm. Nat. Genet. 44, 32–39. [DOI] [PubMed] [Google Scholar]
- Huang, J. , Li, J. , Zhou, J. , Wang, L. , Yang, S. , Hurst, L.D. , Li, W.H. et al. (2018) Identifying a large number of high‐yield genes in rice by pedigree analysis, whole‐genome sequencing, and CRISPR‐Cas9 gene knockout. Proc. Natl. Acad. Sci. USA, 115, E7559–e7567. [DOI] [PMC free article] [PubMed] [Google Scholar]
- Ikeda, M. , Miura, K. , Aya, K. , Kitano, H. and Matsuoka, M. (2013) Genes offering the potential for designing yield‐related traits in rice. Curr. Opin. Plant Biol. 16, 213–220. [DOI] [PubMed] [Google Scholar]
- International Wheat Genome Sequencing Consortium (IWGSC) . (2018). Shifting the limits in wheat research and breeding using a fully annotated reference genome. Science, 361(6403), eaar7191. [DOI] [PubMed] [Google Scholar]
- Jiao, Y. , Wang, Y. , Xue, D. , Wang, J. , Yan, M. , Liu, G. , Dong, G. et al. (2010) Regulation of OsSPL14 by OsmiR156 defines ideal plant architecture in rice. Nat. Genet. 42, 541–544. [DOI] [PubMed] [Google Scholar]
- Jinek, M. , Chylinski, K. , Fonfara, I. , Hauer, M. , Doudna, J.A. and Charpentier, E. (2012) A programmable dual‐RNA‐guided DNA endonuclease in adaptive bacterial immunity. Science, 337, 816–821. [DOI] [PMC free article] [PubMed] [Google Scholar]
- Jung, J.H. , Lee, H.J. , Ryu, J.Y. and Park, C.M. (2016) SPL3/4/5 integrate developmental aging and photoperiodic signals into the FT‐FD module in Arabidopsis flowering. Mol. Plant, 9, 1647–1659. [DOI] [PubMed] [Google Scholar]
- Kumar, S. , Stecher, G. and Tamura, K. (2016) MEGA7: molecular evolutionary genetics analysis version 7.0 for bigger datasets. Mol. Biol. Evol. 33, 1870–1874. [DOI] [PMC free article] [PubMed] [Google Scholar]
- Li, W. and Yang, B. .(2017) Translational genomics of grain size regulation in wheat. Theoretical and Applied Genetics, 130(9), 1765–1771. [DOI] [PubMed] [Google Scholar]
- Lin, Q. , Zong, Y. , Xue, C. , Wang, S. , Jin, S. , Zhu, Z. , Wang, Y. et al. (2020) Prime genome editing in rice and wheat. Nat. Biotechnol. 38, 582–585. [DOI] [PubMed] [Google Scholar]
- Liu, Q. , Wang, F. and Axtell, M.J. (2014) Analysis of complementarity requirements for plant microRNA targeting using a Nicotiana benthamiana quantitative transient assay. Plant Cell, 26, 741–753. [DOI] [PMC free article] [PubMed] [Google Scholar]
- Long, Y.M. , Chao, W.S. , Ma, G.J. , Xu, S.S. and Qi, L.L. (2017) An innovative SNP genotyping method adapting to multiple platforms and throughputs. Theor. Appl. Genet. 130, 597–607. [DOI] [PubMed] [Google Scholar]
- Miura, K. , Ikeda, M. , Matsubara, A. , Song, X.J. , Ito, M. , Asano, K. , Matsuoka, M. et al. (2010) OsSPL14 promotes panicle branching and higher grain productivity in rice. Nat. Genet. 42, 545–549. [DOI] [PubMed] [Google Scholar]
- Moyle, R.L. , Carvalhais, L.C. , Pretorius, L.S. , Nowak, E. , Subramaniam, G. , Dalton‐Morgan, J. and Schenk, P.M. (2017) An optimized transient dual luciferase assay for quantifying MicroRNA directed repression of targeted sequences. Front. Plant Sci. 8, 1631. [DOI] [PMC free article] [PubMed] [Google Scholar]
- Preston, J.C. and Hileman, L.C. (2013) Functional evolution in the plant squamosa‐promoter binding protein‐like (SPL) gene family. Front. Plant Sci. 4, 80. [DOI] [PMC free article] [PubMed] [Google Scholar]
- Puchta, H. (2017) Applying CRISPR/Cas for genome engineering in plants: the best is yet to come. Curr. Opin. Plant Biol. 36, 1–8. [DOI] [PubMed] [Google Scholar]
- Puchta, H. , Dujon, B. and Hohn, B. (1996) Two different but related mechanisms are used in plants for the repair of genomic double‐strand breaks by homologous recombination. Proc. Natl. Acad. Sci. USA, 93, 5055–5060. [DOI] [PMC free article] [PubMed] [Google Scholar]
- Ramírez‐González, R.H. , Borrill, P. , Lang, D. , Harrington, S.A. , Brinton, J. , Venturini, L. , Davey, M. et al. (2018) The transcriptional landscape of polyploid wheat. Science, 361, pii: eaar6089. [DOI] [PubMed] [Google Scholar]
- Rodríguez‐Leal, D. , Lemmon, Z.H. , Man, J. , Bartlett, M.E. and Lippman, Z.B. (2017) Engineering quantitative trait variation for crop improvement by genome editing. Cell, 171, 470–480.e478. [DOI] [PubMed] [Google Scholar]
- Saitou, N. and Nei, M. (1987) The neighbor‐joining method: a new method for reconstructing phylogenetic trees. Mol. Biol. Evol. 4, 406–425. [DOI] [PubMed] [Google Scholar]
- Sakamoto, T. and Matsuoka, M. (2008) Identifying and exploiting grain yield genes in rice. Curr. Opin. Plant Biol. 11, 209–214. [DOI] [PubMed] [Google Scholar]
- Si, L. , Chen, J. , Huang, X. , Gong, H. , Luo, J. , Hou, Q. , Zhou, T. et al. (2016) OsSPL13 controls grain size in cultivated rice. Nat. Genet. 48, 447–456. [DOI] [PubMed] [Google Scholar]
- Song, X. , Meng, X. , Guo, H. , Cheng, Q. , Jing, Y. , Chen, M. , Liu, G. et al. (2022) Targeting a gene regulatory element enhances rice grain yield by decoupling panicle number and size. Nat. Biotechnol. 40, 1403–1411. [DOI] [PubMed] [Google Scholar]
- Sternberg, S.H. , Redding, S. , Jinek, M. , Greene, E.C. and Doudna, J.A. (2014) DNA interrogation by the CRISPR RNA‐guided endonuclease Cas9. Nature, 507, 62–67. [DOI] [PMC free article] [PubMed] [Google Scholar]
- Team, R.C. (2013) R: A Language and Environment for Statistical Computing. Vienna, Austria: R Foundation for Statistical Computing. [Google Scholar]
- Thompson, J.D. , Gibson, T.J. and Higgins, D.G. (2003) Multiple sequence alignment using ClustalW and ClustalX. Current Protocols in Bioinformatics, 1, 2–3. [DOI] [PubMed] [Google Scholar]
- Wang, J.W. (2014) Regulation of flowering time by the miR156‐mediated age pathway. J. Exp. Bot. 65, 4723–4730. [DOI] [PubMed] [Google Scholar]
- Wang, H. and Wang, H. (2015) The miR156/SPL module, a regulatory hub and versatile toolbox, gears up crops for enhanced agronomic traits. Mol. Plant, 8, 677–688. [DOI] [PubMed] [Google Scholar]
- Wang, L. and Zhang, Q. (2017) Boosting rice yield by fine‐tuning SPL gene expression. Trends Plant Sci. 22, 643–646. [DOI] [PubMed] [Google Scholar]
- Wang, H. , Nussbaum‐Wagler, T. , Li, B. , Zhao, Q. , Vigouroux, Y. , Faller, M. , Bomblies, K. et al. (2005) The origin of the naked grains of maize. Nature, 436, 714–719. [DOI] [PMC free article] [PubMed] [Google Scholar]
- Wang, S. , Zhu, Q.H. , Guo, X. , Gui, Y. , Bao, J. , Helliwell, C. and Fan, L. (2007) Molecular evolution and selection of a gene encoding two tandem microRNAs in rice. FEBS Lett. 581, 4789–4793. [DOI] [PubMed] [Google Scholar]
- Wang, J.W. , Czech, B. and Weigel, D. (2009) miR156‐regulated SPL transcription factors define an endogenous flowering pathway in Arabidopsis thaliana . Cell, 138, 738–749. [DOI] [PubMed] [Google Scholar]
- Wang, S. , Wu, K. , Yuan, Q. , Liu, X. , Liu, Z. , Lin, X. , Zeng, R. et al. (2012) Control of grain size, shape and quality by OsSPL16 in rice. Nat. Genet. 44, 950–954. [DOI] [PubMed] [Google Scholar]
- Wang, B. , Geng, S. , Wang, D. , Feng, N. , Zhang, D. , Wu, L. , Hao, C. et al. (2015a) Characterization of squamosa promoter binding protein‐LIKE genes in wheat. J. Plant Biol. 58, 220–229. [Google Scholar]
- Wang, H. , Studer, A.J. , Zhao, Q. , Meeley, R. and Doebley, J.F. (2015b) Evidence that the origin of naked kernels during maize domestication was caused by a single amino acid substitution in tga1. Genetics, 200, 965–974. [DOI] [PMC free article] [PubMed] [Google Scholar]
- Whan, A.P. , Smith, A.B. , Cavanagh, C.R. , Ral, J.P. , Shaw, L.M. , Howitt, C.A. and Bischof, L. (2014) GrainScan: a low cost, fast method for grain size and colour measurements. Plant Methods, 10, 23. [DOI] [PMC free article] [PubMed] [Google Scholar]
- Wing, R.A. , Purugganan, M.D. and Zhang, Q. (2018) The rice genome revolution: from an ancient grain to Green Super Rice. Nat. Rev. Genet. 19, 505–517. [DOI] [PubMed] [Google Scholar]
- Wu, G. , Park, M.Y. , Conway, S.R. , Wang, J.W. , Weigel, D. and Poethig, R.S. (2009) The sequential action of miR156 and miR172 regulates developmental timing in Arabidopsis. Cell, 138, 750–759. [DOI] [PMC free article] [PubMed] [Google Scholar]
- Xie, K. , Wu, C. and Xiong, L. .(2006) Genomic organization, differential expression, and interaction of SQUAMOSA promoter-binding-like transcription factors and microRNA156 in rice. Plant Physiology, 142(1), 280–293. [DOI] [PMC free article] [PubMed] [Google Scholar]
- Xu, M. , Hu, T. , Zhao, J. , Park, M.Y. , Earley, K.W. , Wu, G. , Yang, L. et al. (2016) Developmental functions of miR156‐regulated SQUAMOSA PROMOTER BINDING PROTEIN‐LIKE (SPL) Genes in Arabidopsis thaliana . PLoS Genet. 12, e1006263. [DOI] [PMC free article] [PubMed] [Google Scholar]
- Yamaguchi, A. , Wu, M.F. , Yang, L. , Wu, G. , Poethig, R.S. and Wagner, D. (2009) The microRNA‐regulated SBP‐Box transcription factor SPL3 is a direct upstream activator of LEAFY, FRUITFULL, and APETALA1. Dev. Cell, 17, 268–278. [DOI] [PMC free article] [PubMed] [Google Scholar]
- Yan, L. , Loukoianov, A. , Tranquilli, G. , Helguera, M. , Fahima, T. and Dubcovsky, J. .(2003) Positional cloning of the wheat vernalization gene VRN1. Proceedings of the National Academy of Sciences, 100(10), 6263–6268. [DOI] [PMC free article] [PubMed] [Google Scholar]
- Zeng, D. , Tian, Z. , Rao, Y. , Dong, G. , Yang, Y. , Huang, L. , Leng, Y. et al. (2017) Rational design of high‐yield and superior‐quality rice. Nat. Plants, 3, 17031. [DOI] [PubMed] [Google Scholar]
- Zhang, Z. , Wang, W. and Li, W. (2013) Genetic interactions underlying the biosynthesis and inhibition of beta‐diketones in wheat and their impact on glaucousness and cuticle permeability. PLoS ONE, 8, e54129. [DOI] [PMC free article] [PubMed] [Google Scholar]
- Zhang, B. , Liu, X. , Zhao, G. , Mao, X. , Li, A. and Jing, R. (2014) Molecular characterization and expression analysis of Triticum aestivum squamosa‐promoter binding protein‐box genes involved in ear development. J. Integr. Plant Biol. 56, 571–581. [DOI] [PMC free article] [PubMed] [Google Scholar]
- Zhang, B. , Xu, W. , Liu, X. , Mao, X. , Li, A. , Wang, J. , Chang, X. et al. (2017a) Functional conservation and divergence among homoeologs of TaSPL20 and TaSPL21, two SBP‐Box genes governing yield‐related traits in hexaploid wheat. Plant Physiol. 174, 1177–1191. [DOI] [PMC free article] [PubMed] [Google Scholar]
- Zhang, L. , Yu, H. , Ma, B. , Liu, G. , Wang, J. , Wang, J. , Gao, R. et al. (2017b) A natural tandem array alleviates epigenetic repression of IPA1 and leads to superior yielding rice. Nat. Commun. 8, 14789. [DOI] [PMC free article] [PubMed] [Google Scholar]
- Zhang, Z. , Hua, L. , Gupta, A. , Tricoli, D. , Edwards, K.J. , Yang, B. and Li, W. (2019) Development of an Agrobacterium‐delivered CRISPR/Cas9 system for wheat genome editing. Plant Biotechnol. J. 17, 1623–1635. [DOI] [PMC free article] [PubMed] [Google Scholar]
- Zuo, J. and Li, J. (2014) Molecular genetic dissection of quantitative trait loci regulating rice grain size. Annu. Rev. Genet. 48, 99–118. [DOI] [PubMed] [Google Scholar]
Associated Data
This section collects any data citations, data availability statements, or supplementary materials included in this article.
Supplementary Materials
Figure S1 Expression analysis of TaSPL13.
Figure S2 Effect of TaSPL13 mutations on flowering time and plant architecture during the 2021 spring season.
Figure S3 Effect of TaSPL‐b knockout mutations on flowering time and plant height.
Figure S4 Effect of TaSPL13 mutations on grain size and number during the spring season.
Figure S5 Effect of season on flowering time and plant architecture.
Table S1 Primer information.