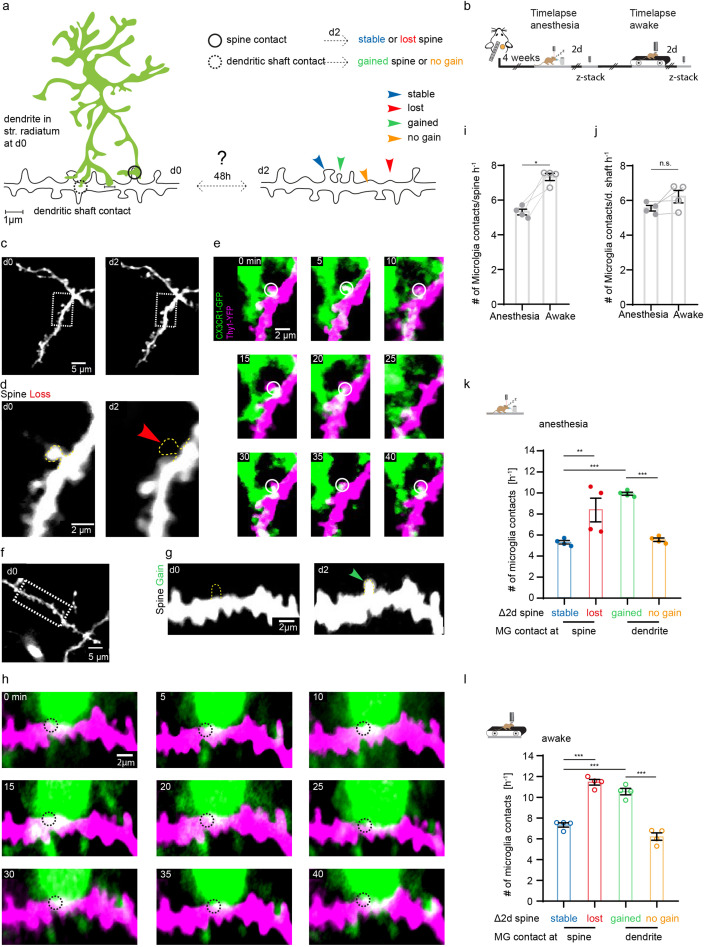
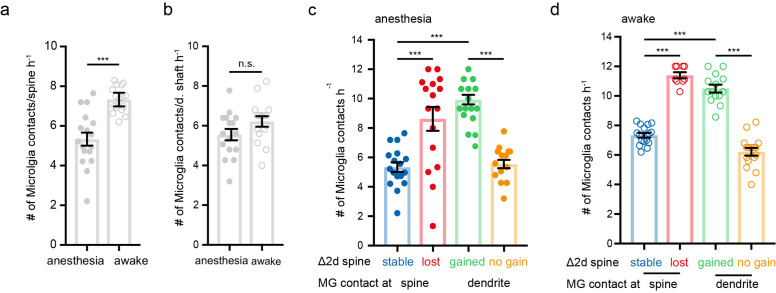
Figure 4. Microglia contact frequency is associated with spine stability in the hippocampus.
(a) Schematic illustrating the analysis between microglia contacts and spine stability in stratum radiatum of dorsal CA1: direct spine contacts (circle) can lead to a stable (blue arrow) or lost spine (red arrow) as analyzed 2 days later, whereas contacts of the dendritic shaft (dashed circle) can lead to a gained spine (green arrow) or no change/no spine gain (orange). (b) The same mice were imaged four times after implantation of the hippocampal window. First in anesthesia and 48 hr later two visualize potential changes of dendritc spines and then again under awake conditions, followed by relocalization 48 hr later. (c) Overview image of a dendrite in stratum radiatum (SR) at two consecutive time points 48 hr apart. (d) Zoom image from (c) illustrating a dendritic segment with distinctive dendritic spines. Note the lost spine after 2 days (red arrow). (e) Time-lapse of microglia processes (green) interacting with the dendrite and spines (magenta) in the hippocampus of an awake CX3CR1-GFP::thy-1-YFP-H mouse; the circle mark individual microglia contacts of spines. (f–h) Analog illustration as depicted in c–e for a gained spine example (green arrow in g). (i, j) Direct microglia contacts (h) and contacts along the dendritic shaft (i) in anesthetized vs. awake mice paired t-test (h, i); p=0.0105 (h), p=0.1452 (i). (k, l) Contact rate in anesthesia (j) and awake (k) at dendritic spines that are either stable (blue) or lost (red) and contacts at the dendritic shaft where either a spine was gained (green) after 48 hr or at random locations along the dendrite where no spine gain was detectable (orange). One-way ANOVA with Sidak’s multiple comparison test (j, k); F(3,12)=80.8 (j) and F(3,12)=73.91 (k); spine contacts averaged over n=4 mice (h–k); *p<0.05, **p<0.01, ***p<0.001. Error bars: SEM.


