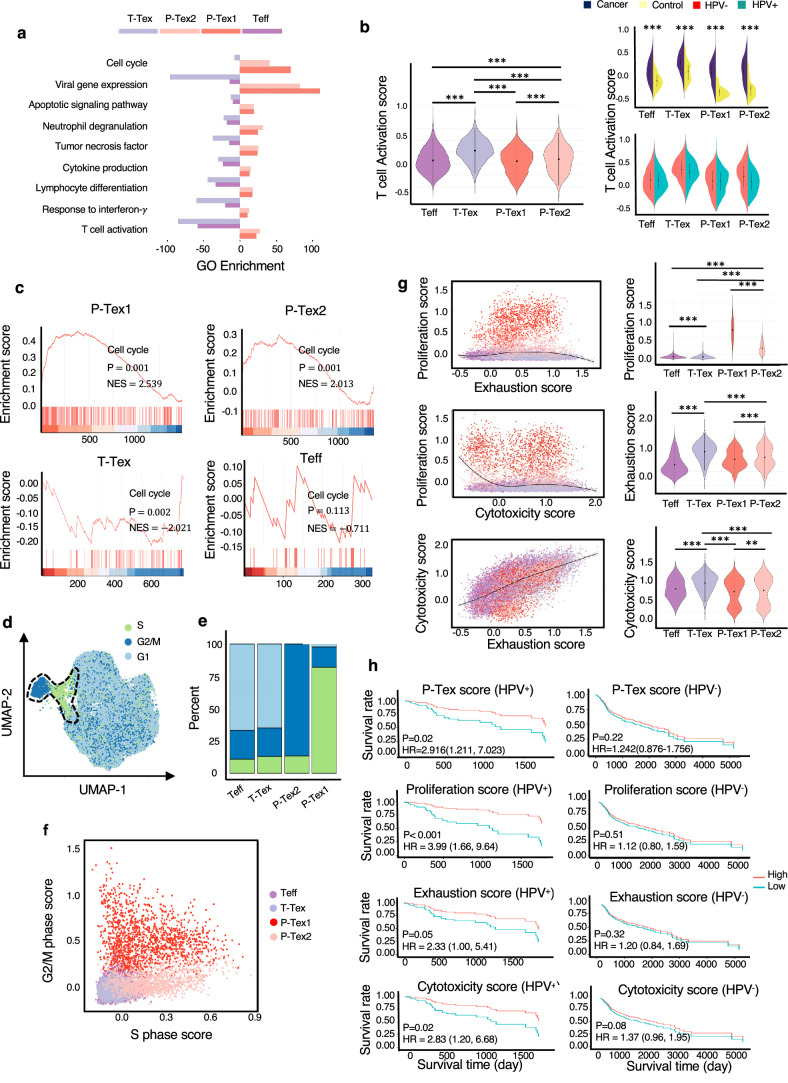
Figure 2. The comparison of functional characteristics between P-Texs and other CD8+ T cell clusters.
(a) Gene ontology (GO) analysis of differentially expressed genes in each CD8+ T cell clusters, colored by cell types. (b) The T cell activation score of each CD8+ T cell clusters. T cell activation score defined as the averaged expression of genes in the activation signature in Supplementary file 3. Statistics were assessed by Dunn's tests. (c) The gene set enrichment analysis (GSEA) diagrams show the enrichment profiles of cell cycle pathway in each CD8+ T cell clusters. (d–f) The distribution and scores of cell cycle phases of each CD8+ T cells. (g) The proliferation, exhaustion, and cytotoxic scores of each CD8+ T cell clusters. Proliferation score: averaged expression of MKI67-related genes; exhaustion score: averaged expression of PDCD1-related genes; cytotoxic score: averaged expression of GZMB-related genes. (h) The Kaplan–Meier curves show the overall survival rate of HPV+/HPV- head and neck squamous cell carcinoma (HNSCC) patients with different proliferation, exhaustion, and cytotoxic scores in The Cancer Genome Atlas (TCGA) cohort, adjusted for age and gender. ***: p<0.001, **: p<0.01, *: p<0.05.

