Abstract
The ability to simultaneously modulate a set of genes for lineage-specific development has made miRNA an ideal master regulator for organogenesis. However, most miRNA deletions do not exhibit obvious phenotypic defects possibly due to functional redundancy. miRNAs are known to regulate skeletal lineages as the loss of their maturation enzyme Dicer impairs bone remodeling processes. Therefore, it is important to identify specific miRNA essential for bone homeostasis. We report the loss of MIR27a causing severe osteoporosis in mice. MIR27a affects osteoclast-mediated bone resorption but not osteoblast-mediated bone formation during skeletal remodeling. Gene profiling and bioinformatics further identify the specific targets of MIR27a in osteoclast cells. MIR27a exerts its effects on osteoclast differentiation through modulation of Squstm1/p62 whose mutations have been linked to Paget’s disease of bone. Our findings reveal a new MIR27a-p62 axis necessary and sufficient to mediate osteoclast differentiation and highlight a therapeutic implication for osteoporosis.
Research organism: Mouse
Introduction
miRNA is a small non-coding RNA, base-pairing with complementary sequences of mRNA to control gene expression at post-transcriptional and translational levels (Bartel, 2004; Baek et al., 2008). In animals, miRNA recognizes the 3’ untranslated region of their targets via a small stretch of seed sequences. A single miRNA may simultaneously affect the expression of hundreds of genes (Hausser and Zavolan, 2014; Stark et al., 2005). Because of its potential to modulate the same biological process at various steps, miRNA has been postulated to function as a master regulator for organogenesis (Ebert and Sharp, 2012; Li and Rana, 2014), similar to the transcription factor capable of turning on a set of genes for lineage-specific development. However, possibly due to functional redundancy, most of the miRNA deletions do not cause phenotypic alterations (Miska et al., 2007; Park et al., 2012). With only limited evidence (Croce, 2009; Shenoy and Blelloch, 2014), it has been difficult to prove this concept.
The skeleton is constantly remodeled to maintain a healthy structure after its formation (Manolagas and Jilka, 1995). This lifelong process is called bone remodeling in which old bone is removed from the skeleton, followed by replaced with new bone. Therefore, a balance of osteoclast-mediated bone resorption and osteoblast-mediated bone formation is essential for bone metabolism (Manolagas and Jilka, 1995). Dysregulation of bone remodeling causes metabolic disorders, e.g., osteopetrosis, osteoporosis, and Paget’s disease (Feng and McDonald, 2011). The current treatments have major limitations leading to the exploration of new therapeutic strategies. Studies of Dicer, an RNase III endonuclease involved in the maturation of miRNAs, suggest their importance in the development of the skeletal lineages during bone remodeling (Gaur et al., 2010; Mizoguchi et al., 2010). However, the specific miRNA(s) required for the differentiation of osteoclasts and osteoblasts remains largely unclear. The Mir23a cluster consists of Mir23a, Mir27a, and Mir24-2. Aberrant regulation of Mir23a and Mir27a has been associated with osteoporotic patients and increased bone fracture risks (Seeliger et al., 2014; Guo et al., 2016; You et al., 2016). The effect of MIR23a and MIR27a on the differentiation of osteoblast or osteoclast cells has been shown by in vitro overexpression studies (Guo et al., 2016; Hassan et al., 2010; Guo et al., 2018). Interference of MIR23a or MIR27a by the use of inhibitor/sponge has implied their role in osteoblast and osteoclast cells (Hassan et al., 2010; Zeng et al., 2017). However, due to the cross-reactivity of the RNA inhibitor among family members that share common seed motifs (Androsavich et al., 2016; Ebert et al., 2007), the inhibitor assay may not truthfully reflect the function of the target miRNA. Therefore, the genetic loss-of-function study remains the most rigorous method for determining the endogenous function of MIR23a and MIR27a as well as testing the removal of Mir23a~27a sufficient to cause bone loss.
We have performed mouse genetic analyses to definitively assess the requirement of MIR23a and MIR27a for skeletogenesis and homeostasis. Surprisingly, the skeletal phenotypes developed in newly established loss-of-function mouse models reveal findings different from previous reports based on the gain-of-function analyses. Severe loss of bone mass developed in mice with the deletion of Mir23a~27a or Mir27a. MIR23a~27a is dispensable for osteoblast-mediated bone formation. However, compelling evidence supports that MIR27a is essential for osteoclastogenesis and osteoclast-mediated bone resorption during bone remodeling. Gene expression profiling and bioinformatics analyses further identify osteoclast-specific targets of MIR27a. We demonstrated that MIR27a exerts its effects on osteoclast differentiation through modulation of a new and essential target Squstm1/p62. MIR27a is necessary and sufficient to mediate osteoclast differentiation and as a biomarker and therapeutic target for osteoporosis.
Results
The loss of MIR23a~27a in mice causes low bone mass phenotypes
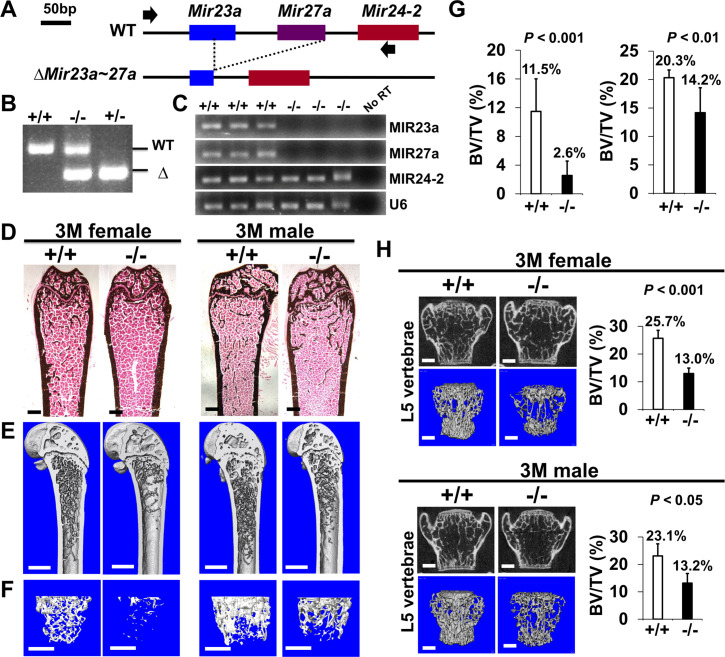
To determine the requirement of MIR23a~27a for skeletal development and maintenance, we created a new mouse model with the deletion of Mir27a and Mir23a. The CRISPR/Cas9 gene edition method was used to establish the mouse strain carrying the ∆Mir23a~27a allele (Figure 1A). PCR analysis of the Mir23a cluster demonstrated the sgRNA(single guide RNA)-mediated deletion and the reduction of 500 bp in the wild-type to 303 bp in the mutants (Figure 1B). Sequencing analysis also confirmed the expected genome editing (data not shown). Next, we tested if the deletions affect the expression of other miRNA molecules, generated from the same RNA precursor, within the same cluster. Semi-quantitative RT-PCR (qRT-PCR) analysis revealed that only MIR23a~27a are disrupted in the ∆Mir23a~27a mutants (Figure 1C). These results indicated our success in establishing mouse models deficient for Mir23a~27a.
Figure 1. Low bone mass phenotypes in mice deficient for Mir23a~27a.
(A) Diagrams illustrate the Mir23a cluster, consisting of Mir23a, Mir27a, and Mir24-2 (WT), and the creation of mouse strains deficient for Mir23a~27a (∆Mir23a~27a) by CRISPR/Cas9 genome editing. Broken lines and arrows indicate the deleted genomic regions and primers used for PCR genotyping analysis, respectively. (B) PCR analysis examines the Mir23a cluster for genotyping the wild-type (+/+), heterozygous (+/−), and homozygous (−/−) for miR-23a~27 a mice. The mutant (∆) alleles with deletion of Mir23a~27a result in the generation of shorter PCR products. (C) RT-PCR analysis of the MIR23a, MIR27a, and MIR24-2 RNAs reveals the disruption of specific miRNA(s) in the mutants. The analysis of small non-coding RNA U6 is used as an internal control. Femurs of the 3-month-old (3 M) wild-type (+/+) and mutant (−/−) males and females were analyzed by μCT scanning (E–F), followed by sectioning and von Kossa staining (D). Reconstructed μCT images of the distal femur (E) and femoral metaphysis (F) were subject to quantitative analysis for trabecular bone volume (G). (H) Spines of the 3-month-old (3 M) ∆Mir23a~27a males and females were analyzed by μCT scanning. Images show the μCT scanned wild-type (+/+) and mutant (−/−) L5 vertebrae (top) and three dimensional (3D)-rendered trabecular bone (bottom). Quantitative analyses of trabecular bone volume per total volume in the femurs (BV/TV(bone volume to total volume fraction), n=7, mean ± SD; student t-test) and vertebrates (BV/TV, n=4 for female and n=3 for male, mean ± SD; student t-test) are shown in graphs. Images (D–F and H) are representatives of three independent experiments. Scale bars, 500 µm (D–F and H).
Figure 1—figure supplement 1. MIR23a and MIR27a are dispensable during skeletal development.
Figure 1—figure supplement 2. The loss of MIR23a~27a causes an osteopenic phenotype in mice.

Figure 1—figure supplement 3. The loss of MIR23a~27a does not affect cortical bone thickness.
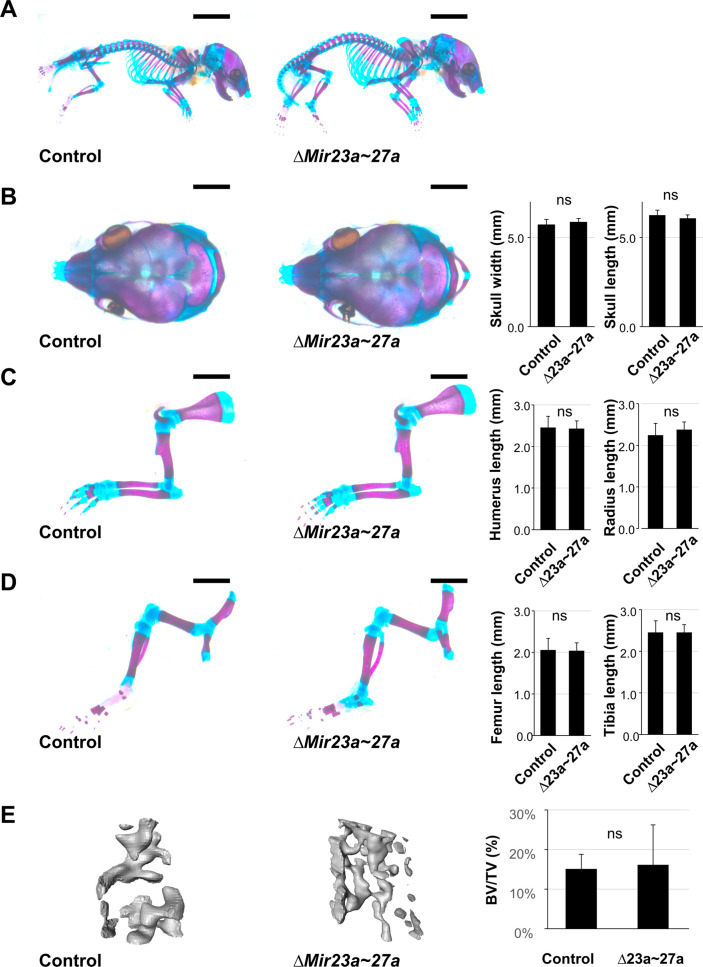
Mice heterozygous for ∆Mir23a~27a are viable and fertile. Intercross between the heterozygotes successfully obtained the homozygous mutants without any noticeable skeletal deformity, suggesting that MIR23a~27a are not required for the developmental processes (Figure 1—figure supplement 1). Next, we examined if their deletions affect the homeostatic maintenance of the bone in adults. At 3 months, von Kossa staining and three-dimensional (3D) µCT analyses of the ∆Mir23a~27a femurs revealed significant loss of the trabecular bone volume in both sexes (Figure 1D–G; BV/TV, n=3, mean ± SD; student t-test). Much more severe osteoporotic defects were detected in the 7-month-old mutant females of ∆Mir23a~27a (Figure 1—figure supplement 2; BV/TV, n=3, mean + SD; student t-test). However, cortical bone thickness does not seem to be affected by the deletion of Mir23a~27a (Figure 1—figure supplement 3). Next, we examined if similar bone loss phenotypes can be detected in the vertebrae where age-related changes in the trabecular architecture are minimal. Therefore, we examined the vertebrae of ∆Mir23a~27a and identified drastic reductions in vertebral bone mass associated with the mutations (Figure 1H). These data demonstrated that MIR23a~27a is required for homeostatic maintenance of the bone.
Osteoblast-mediated bone formation is not affected by the loss of MIR23a~27a
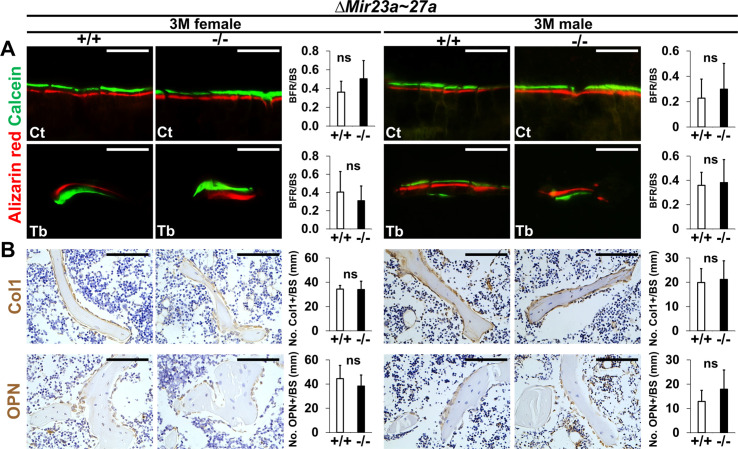
Proper maintenance of the skeleton requires balanced bone formation and resorption during bone remodeling. The bone loss phenotypes caused by the deletion of Mir23a~27a are likely to be associated with an imbalanced bone formation and resorption mediated by osteoblasts and osteoclasts, respectively. Therefore, we examined if bone formation and osteoblast activities are affected by the loss of MIR23a~27a. New bone formation was analyzed by double labeling with alizarin red and calcein at 3 months. Quantitative analyses did not reveal a significant difference in bone formation rate per unit of bone surface (BFR/BS) caused by the mutation (Figure 2—figure supplement 1A). In addition, the numbers of osteoblast cells positive for type 1 collagen (Col1) and Osteopontin (OPN) lining the trabecular BS remain comparable between the wild-type and homozygous littermates (Figure 2—figure supplement 1B), indicating that osteoblast-mediated bone formation is not affected by the Mir23a~27a deletion. The results suggested that MIR27a and MIR23a are not required for osteoblastogenesis and osteoblasts-mediated bone formation.
MIR23a~27a regulates osteoclast differentiation
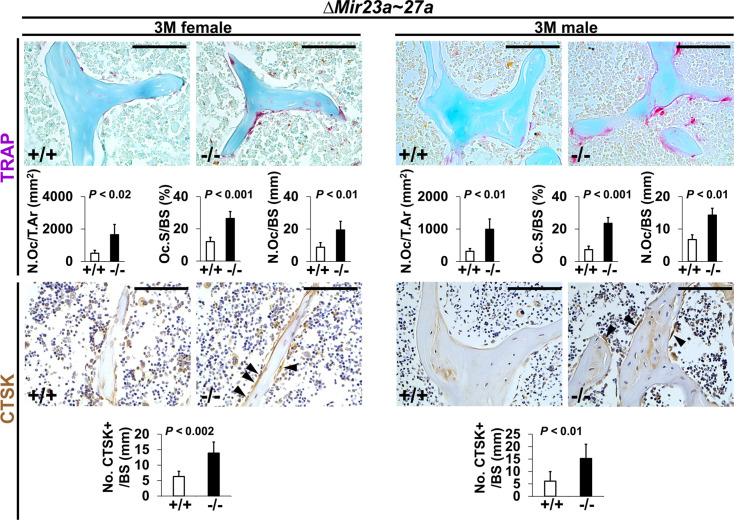
To determine if the loss of MIR23~27a affects bone resorption, we first examined osteoclast number by tartrate-resistant acid phosphatase (TRAP) staining. An increase of TRAP+ osteoclasts was detected in the 3-month-old ∆Mir23a~27 a males and females (Figure 2). When the number of TARP+ osteoclast cells in the total bone area (N.Oc/T.Ar), the ratio of TRAP + BS (Oc.S/BS), and the number of TRAP +osteoclast cells lining the BS (N.Oc/BS) were measured, we found that these parameters associated with bone resorption are significantly elevated in the mutants (Figure 2; n=5, mean ± SD; student t-test). In addition, there is a ~threefold increase in the number of Cathepsin K-expressing osteoclast cells lining the trabecular BS (Figure 2; n=5, mean ± SD; student t-test). These results support that the loss of MIR23a~27a stimulates osteoclastogenesis, leading to an elevation of bone resorption.
Figure 2. Increased number of osteoclast cells in the ∆Mir23a~27a mice.
Sections of the 3-month-old (3 M) ∆Mir23a~27a males and females were analyzed by tartrate-resistant acid phosphatase (TRAP) staining and immunostaining of Cathepsin K (CTSK). Graphs show quantitative analyses of positively stained cells in the wild-type (+/+) and mutant (−/−) distal femurs (No. of cell+/BS, n=5, mean ± SD; student t-test). Histomorphometric parameters of bone resorption are evaluated by the number of osteoclast/bone area (N.OC/T.Ar), osteoclast surface/bone surface (OC.S/BS), and osteoclast number/bone surface (N.OC/BS, n=5, mean ± SD; student t-test). Images are representatives of five independent experiments. Scale bars, 100 µm.
Figure 2—figure supplement 1. Bone formation and osteoblastogenesis are not affected by the ∆Mir23a~27a deletion.
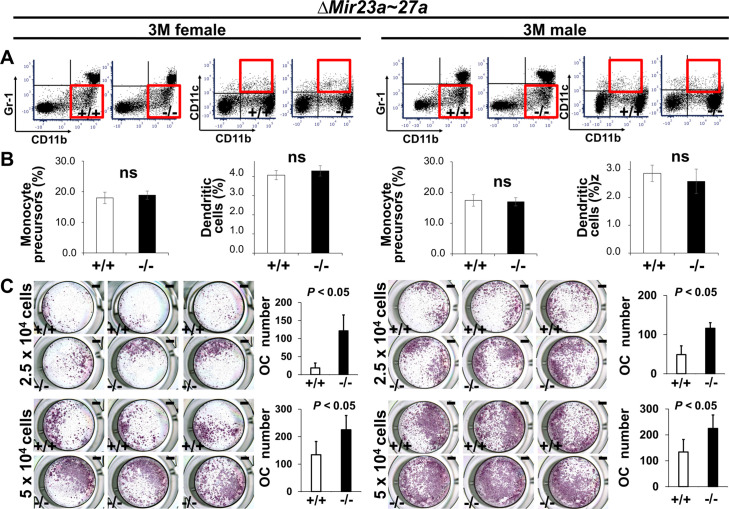
Next, to determine the role of MIR23a~27a in osteoclastogenesis, we analyzed cell populations associated with the differentiation of the osteoclast cells. During hematopoiesis, a common myeloid progenitor gives rise to monocytes that are precursors of several cell types, including dendritic cells, macrophages, and osteoclasts (Charles and Nakamura, 2014). Osteoclast precursors are known to derive from a monocyte population positive for CD11b and negative for Gr-1 (Yao et al., 2006). Therefore, we examined CD11b+ and Gr-1– monocytes to see if the Mir23a~27a deletion affects the osteoclast precursor population. Fluorescence-activated cell sorting(FACS) analysis revealed that the CD11b+ and Gr-1– population was not affected in the ∆Mir23a~27a bone marrow of both male and female mice (Figure 3A and B). The CD11b+/CD11c+ dendritic cell population, derived from the monocytes, was also unaffected by the Mir23a~27a deletion (Figure 3A and B). Although the precursors are not affected, MIR23a~27a may play a role in osteoclast differentiation.
Figure 3. MIR23a~27a regulates osteoclast (OC) differentiation.
(A) FACS analysis examines the CD11b+/Gr-1− and CD11b+/CD11c+ populations for monocyte precursors and dendritic cells, respectively. Images are representatives of three independent experiments. (B) The bone marrow of 3-month-old (3 M) wild-type (+/+) and ∆Mir23a~27a (−/−) males and females show no significant difference (ns; n=3, mean ± SD; student t-test). (C) Cells isolated from the bone marrow were induced for OC differentiation with Receptor activator of nuclear factor kappa-Β ligand(RANLK) and macrophage colony-stimulating factor(MCSF) for 5 days (top, 2.5×10⁴ cells/well and bottom, 5×10⁴ cells/well). The number of OC cells positive for tartrate-resistant acid phosphatase (TRAP) staining is significantly enhanced in the mutant cultures (n=3, mean ± SD; student t-test). Scale bars, 1 mm (C).
To test osteoclast differentiation affected by the loss of MIR23a~27a, an ex vivo analysis was performed with cultures of cells seeding at two different densities. Cells isolated from the bone marrow were cultured in the presence of M-CSF to obtain bone marrow-derived macrophages, followed by differentiation into osteoclasts with the treatment of RANKL. TRAP staining was then used to assess the extent of osteoclast differentiation. The number of TRAP+ cells was significantly increased by the loss of MIR23a~27a (Figure 3C; n=5, mean ± SD; student t-test).
MIR27a is an essential regulator for osteoclast-mediated skeletal remodeling
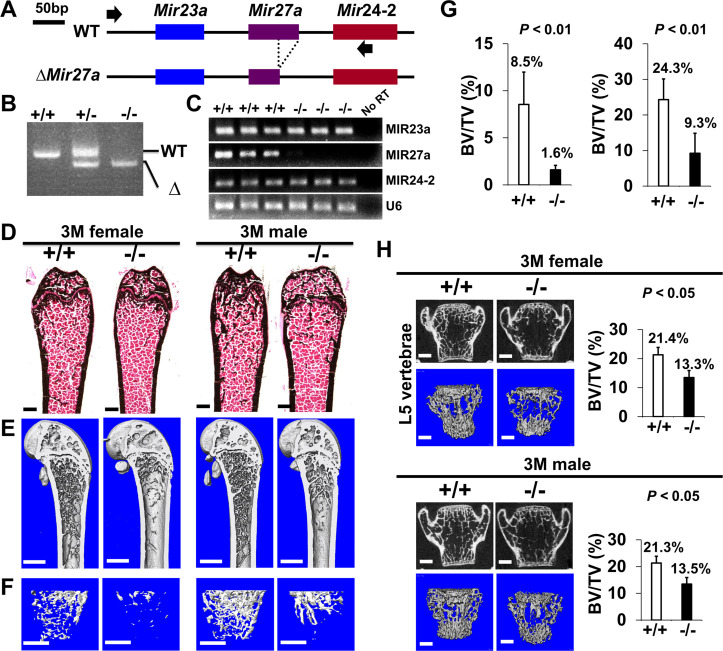
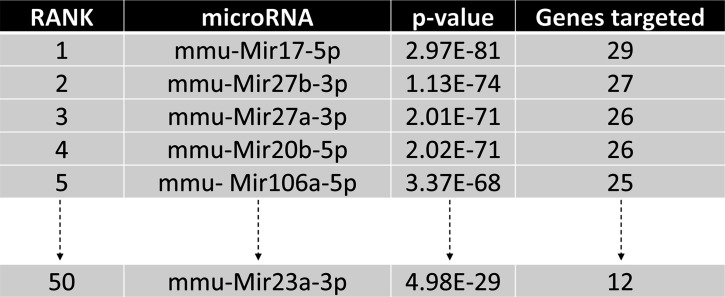
Using the miRPath Reverse-Search module, we searched and ranked miRNAs whose targets are accumulated in osteoclast differentiation-related genes based on the enrichment of the targets in the Kyoto Encyclopedia of Genes ad Genomics (KEGG: mmu04380; Kanehisa and Goto, 2000; Kanehisa et al., 2008). Among them, MIR27a was predicted as the top three candidates to regulate osteoclast differentiation (Figure 4—figure supplement 1, p<2.0×10–71). Its sister gene MIR27b contains the same seed sequences also ranked in the top three. However, MIR23a had a lower estimated rank, suggesting that MIR27a alone may be sufficient to exert osteoclast regulation (Figure 4—figure supplement 1, p<4.9×10⁻²⁹). To test this hypothesis, we created another mouse strain with the deletion of only MIR27a using CRISPR/Cas9 genome editing (Figure 4A). PCR analysis revealed the sgRNA-mediated deletion causes the reduction of 500 bp in the wild-type to 474 bp in the mutants (Figure 4B). Sequencing of the PCR products confirmed the genomic deletion (data not shown). Next, semi-qRT-PCR analysis indicated that only MIR27a are disrupted in the ∆Mir27a mutants, suggesting the deletions does not affect the expression of other miRNA generated from the same RNA precursor (Figure 4C). These results demonstrated our success in establishing mouse models deficient for MIR27a.
Figure 4. The loss of MIR27a alone causes osteoporotic defects.
(A) Diagrams illustrate the Mir23a cluster (WT), and the creation of mouse strains deficient for Mir27a (∆Mir27a) by CRISPR/Cas9 genome editing. Broken lines and arrows indicate the deleted genomic regions and primers used for PCR genotyping analysis, respectively. (B) PCR-based genotyping identifies the wild-type (+/+), heterozygous (+/–), and homozygous (–/–) for miR-27a mice showing the mutant (∆) alleles with deletion of Mir27a result in the generation of shorter PCR products. (C) RT-PCR analysis reveals the disruption of MIR27a but not MIR23a and MIR24-2 RNAs in ∆Mir27a mutants. The analysis of small non-coding RNA U6 is used as an internal control. Femurs of the 3-month-old (3 M) wild-type (+/+) and mutant (–/–) males and females were analyzed by μCT scanning (E–F), followed by sectioning and von Kossa staining (D). The three dimensional (3D) rendered μCT images of the distal femur (E) and femoral metaphysis (F) were subject to quantitative analysis for trabecular bone volume (G). (H) Spines of the 3-month-old (3 M) ∆Mir27a males and females were analyzed by μCT scanning. Images show the μCT scanned wild-type (+/+) and mutant (–/–) L5 vertebrae (top) and 3D-rendered trabecular bone (bottom). Quantitative analyses of trabecular bone volume per total volume in the femurs (BV/TV, n=5 for female and n=4 for male, mean ± SD; student t-test) and vertebrates (BV/TV, n=3, mean ± SD; student t-test) are shown in graphs. Images (D–F and H) are representatives of three independent experiments. Scale bars, 500 µm (D–F and H).
Figure 4—figure supplement 1. Identification of miRNA candidates in osteoclast differentiation pathway.
Figure 4—figure supplement 2. The loss of MIR27a does not affect cortical bone thickness.
Mice heterozygous and homozygous for ∆Mir27a are viable and fertile similar to the Mir23a~27a deletion. As anticipated, there was no noticeable skeletal deformity associated with the loss of MIR27a, suggesting its dispensable role in the developmental processes. However, von Kossa staining and 3D µCT analyses of the 3-month-old male and female femurs of ∆Mir27a revealed significant loss of the trabecular bone volume (Figure 4D–G; BV/TV, n=3, mean ± SD; student t-test), while cortical bone thickness was not affected (Figure 4—figure supplement 2). Drastic bone loss phenotypes can also be detected in the ∆Mir27a vertebrae where age-related changes in the trabecular architecture are minimal (Figure 4H). These data demonstrated the essential role of MIR27a in skeletal remodeling.
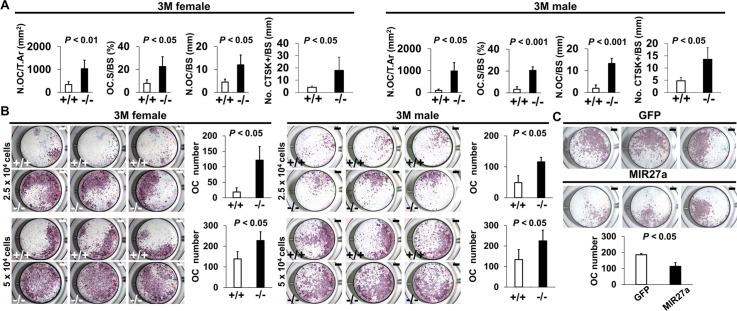
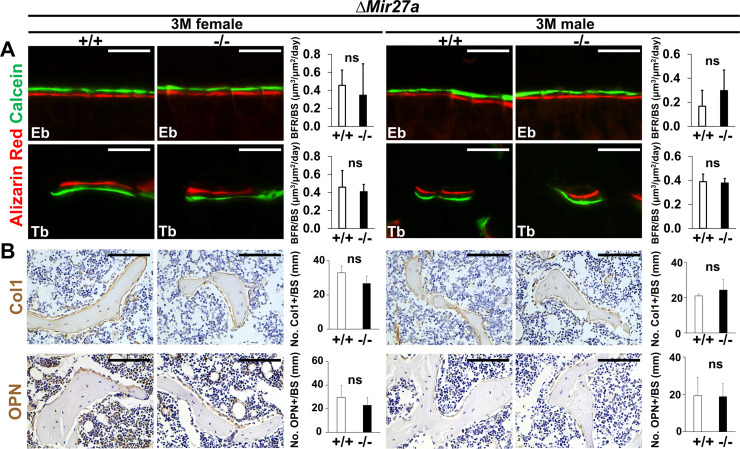
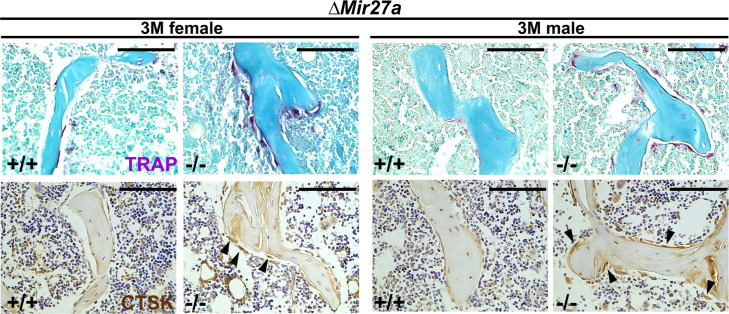
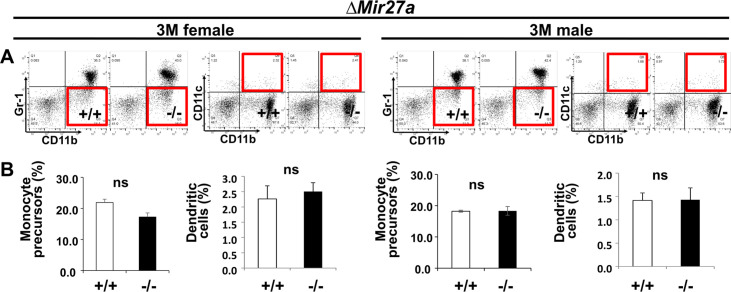
Using double labeling with alizarin red and calcein for quantitative analyses, we did not reveal a significant difference in BFR/BS (Figure 5—figure supplement 1A), and Col1+ and OPN+ osteoblast cells lining the trabecular BS (Figure 5—figure supplement 1B) at 3 months, suggesting that osteoblast-mediated bone formation is not affected by the Mir27a deletion. However, we detected a significant increase of TRAP+ and Cathepsin K-expressing osteoclast cells lining the trabecular BS in the 3-month-old ∆Mir27a males and females (Figure 5A and Figure 5—figure supplement 2; n=5, mean ± SD; student t-test), supporting that the loss of MIR27a stimulates osteoclastogenesis, leading to elevated bone resorption. While the CD11b+/Gr-1– and CD11b+/CD11c+ osteoclast precursor populations were not affected by the Mir27a deletion (Figure 5—figure supplement 3A, B), osteoclast differentiation was significantly increased by the loss of MIR27a (Figure 5B; n=5, mean ± SD; student t-test). Furthermore, the loss of a single MIR27a recapitulates the osteoporotic phenotypes caused by the double deletion of Mir23a and Mir27a, suggesting that MIR27a is responsible for skeletal maintenance through the modulation of bone remodeling processes. The results suggested that MIR27a functions as a negative regulator in osteoclast differentiation. To test this possibility, we overexpressed MIR27a in cells undergoing osteoclast differentiation. High levels of MIR27a significantly reduce the number of differentiated osteoclast cells (Figure 5C). Our findings demonstrated that MIR27a is necessary and sufficient to modulate osteoclast differentiation. Osteoclastogenesis mediated by MIR27a is essential for bone remodeling and homeostasis.
Figure 5. MIR27a is necessary and sufficient to repress osteoclast (OC) differentiation.
(A) Graphs show quantitative analyses of tartrate-resistant acid phosphatase (TRAP)+ and CTST + cells in the wild-type (+/+) and mutant (−/−) distal femurs detected in the stained section of the 3-month-old (3 M) ∆Mir27a males and females (n=5 for female and n=4 for male, mean ± SD; student t-test). Histomorphometric parameters of bone resorption are evaluated by the number of OC/bone area (N.OC/T.Ar), OC surface/bone surface (OC.S/BS), OC number/bone surface (N.OC/BS), and CTSK + cells/bone surface (No. CTSK+/BS). (B) Cells isolated from the wild-type (+/+) and mutant (−/−) bone marrows were induced for OC differentiation with RANLK and MCSF for 5 days (top, 2.5×10⁴ cells/well and bottom, 5×10⁴ cells/well). Graphs indicate the number of TRAP+ OC cells (n=3, mean ± SD; student t-test). (C) Cells isolated from the bone marrow were seeded (5×10⁴ cells/well) and induced for OC differentiation using RANLK and MCSF for 5 days with the lentivirus-mediated expression of green fluorescent protein(GFP) (control) or MIR27a. The TRAP+ OC cell number is significantly decreased in the MIR27 overexpression cultures (n=3, p<0.05, mean ± SD; student t-test). Scale bars, 1 mm (B and C).
Figure 5—figure supplement 1. Bone formation and osteoblastogenesis are not affected by the ∆Mir27a deletion.
Figure 5—figure supplement 2. Enhanced osteoclastogenesis in the ∆Mir27a mice.
Figure 5—figure supplement 3. Osteoclast precursor populations are not affected by the loss of MIR27a.
MIR27a regulates osteoclast differentiation through the modulation of p62
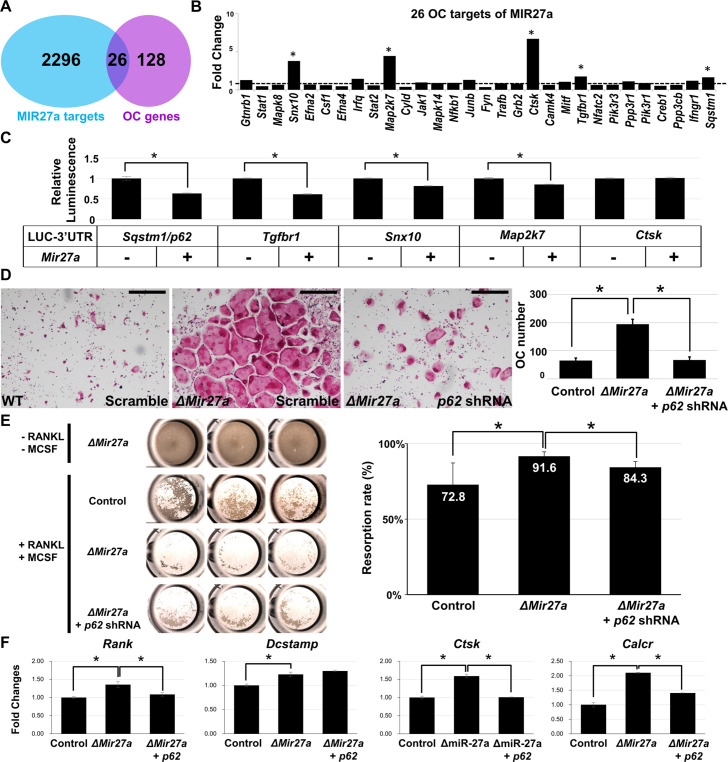
To elucidate the mechanism underlying osteoclast differentiation regulated by MIR27a, we first used a bioinformatics approach to identify its potential targets (Figure 6A). The TarBase computationally predicted 2312 target genes for MIR27a (Vlachos et al., 2015a). Furthermore, there were 154 genes associated with osteoclast differentiation based on the Kyoto Encyclopedia of Genes ad Genomics (KEGG: mmu04380; Kanehisa and Goto, 2000; Kanehisa et al., 2008). The miRPath software further identified 26 targets overlapping with the osteoclast-related genes (Vlachos et al., 2015b). Next, we examined the transcript level of these 26 targets in wild-type and ∆Mir27a osteoclast cells. qRT-PCR analyses revealed that five of these targets, Snx10, Map2k7, Ctsk, Tgfbr1, and Sqstm1, are significantly upregulated by the loss of MIR27a (Figure 6B, p<0.05, n=3; two-sided student t-test). To test if these genes were the direct targets of MIR27a, we performed 3’UTR-reporter assays. The expression of MIR27a significantly downregulated the luciferase activity associated with the 3’UTR of Sqstm1, Tgfbr1, Snx10, and Map2k7 but not Ctsk (Figure 6C, *; p<0.01, n=3, mean ± SD; two-sided student t-test). As Cathepsin K is a protease expressed in the mature osteoclast cells, its alteration at the transcript level is likely ascribed to indirect effects of increased osteoclastogenesis in ∆Mir27a. The data indicated Sqstm1, Tgfbr1, Snx10, and Map2k7 as direct targets of MIR27a.
Figure 6. MIR27a-dependent regulation of osteoclast (OC) differentiation is mediated through p62 modulation.
(A) Venn diagrams illustrate our strategy to identify the OC differentiation-associated genes (KEGG: mmu04380) that are directly regulated by MIR27a. (B) The 26 potential targets are examined by quantitative RT-PCR (qRT-PCR) analysis to detect the change of transcript levels in wild-type and ∆Mir27a OC cells (n=3; *, p-value<0.05, two-sided student’s t-test). (C) The 3’UTR-reporter assay examines five potential genes that are direct targets of MIR27a (n=3; *, p-value <0.01, means ± SD, two-sided student’s t-test). (D) A functional study of Sqstm1 also known as p62 reveals the enhancement of OC differentiation caused by the loss of miR-27a is alleviated by lentiviral-shRNA-mediated knockdown. Tartrate-resistant acid phosphatase (TRAP) staining examines the number of mature OC cells in the control, ∆Mir27a, and ∆Mir27a plus shRNA-mediated knockdown of p62 (∆Mir27a+p62 shRNA) cultures (n=3; *, p-value<0.05, means ± SD, two-sided student’s t-test). (E) Pit assay examined OC cells-mediated bone resorption rate of control, ∆Mir27a, ∆Mir27a plus shRNA-mediated p62 knockdown 5 days after differentiation (n=3; *, p-value<0.05, mean ± SD, two-sided student t-test). OC progenitors isolated from ∆Mir27a mice were cultured without RANKL and MCSF as negative control (Top raw). (F) qRT-PCR examined the expression of OC markers after 3 days (Rank and Dcstamp) or 7 days (Ctsk and Calcr) culture of the control, ∆Mir27a, and ∆Mir27a plus shRNA-mediated knockdown of p62 OC cells (n=3; *, p-value<0.05, mean ± SD, student t-test). Scale bars, 500 µm.
Figure 6—figure supplement 1. No effect of actin ring formation by the loss of MIR27a in osteoclast (OC) cells.
Sqstm1 also known as p62 whose gain of function mutations were linked to Paget’s disease of bone with disruption of bone renewal cycle causing weakening and deformity (Rea et al., 2006). The deletion of p62 in mice also impaired osteoclast differentiation (Durán et al., 2004). Therefore, we performed a functional study to test the importance of the MIR27a-p62 regulatory axis during osteoblastogenesis. Cells isolated from the bone marrow were induced for osteoclast differentiation and the number of osteoclast cells positive for TRAP staining was counted to determine the outcome of the differentiation. The enhanced osteoclast differentiation in the ∆Mir27a culture was significantly alleviated by the shRNA-mediated knockdown of p62 (Figure 6D, p<0.05, n=3, mean ± SD; two-sided student t-test). To assess osteoclast function, we first performed phalloidin staining to ensure actin ring formation was not affected by Mir27a deletion and p62 knockdown in OC cells (Figure 6—figure supplement 1). Bone resorption pit assay then revealed enhanced bone resorption activity of ∆Mir27a osteoclasts that can be alleviated by p62 knockdown (Figure 6E, p<0.05, n=3, mean ± SD; two-sided student t-test). Next, qRT-PCR of osteoclast markers was performed to decipher the regulatory process of MIR27a-mediated osteoclast differentiation. The deletion of Mir27a elevated the expression of Rank, but this elevation could be alleviated by p62 knockdown (Figure 6F, p<0.05, n=3, mean ± SD; two-sided student t-test), indicating the importance of the MIR27a-p62 axis for RANKL signaling. The expression of Dcstamp, essential for cell-cell fusion during osteoclastogenesis, was increased in ∆Mir27a osteoclasts (Figure 6F, p<0.05, n=3, mean ± SD; two-sided student t-test). However, the increased level of Dcstamp in ∆Mir27a osteoclasts could not be affected by p62 knockdown, implying that MIR27a-mediated regulation of osteoclast fusion is independent of p62. Mature osteoclast markers, e.g., Ctsk and Calcr, were significantly upregulated in ∆Mir27a osteoclasts but reduced by p62 knockdown (Figure 6F, p<0.05, n=3, mean ± SD; two-sided student t-test). The results demonstrated that MIR27a-dependent osteoclast differentiation is mediated through the regulation of p62. The MIR27a-p62 regulatory axis plays an important role in osteoclastogenesis during bone remodeling.
Discussion
The dysregulation of miRNA has been implicated in osteoporosis in menopausal women. Among 851 miRNAs tested MIR27a is one of the most significant genes downregulated in postmenopausal osteoporosis patients (You et al., 2016). However, it’s not clear whether the alteration of miRNAs is the cause or consequence of the disease. Our genetic study presented here has demonstrated the loss of MIR23a~27a or MIR27a results in significant bone loss. The findings suggest a single miRNA deficiency can lead to severe osteoporotic defects, indicating an essential role of MIR27a in bone remodeling. Because osteoporosis is caused by an imbalance of osteoblast-mediated bone formation and osteoclast-mediated bone resorption, the conventional knockout model is ideal to decipher the regulatory processes underlying MIR27a-dependent pathogenesis. Our data also suggest that MIR27a is dispensable for osteoblast differentiation and bone formation as its deletion does not affect the number of osteoblast cells and BFRs. The results do not agree with the previous gain-of-function study indicating an inhibitory role of MIR27a in osteoblastogenesis (Hassan et al., 2010). Therefore, the association of osteoporosis with both upregulation and downregulation is possibly mediated through distinct mechanisms underlying the regulatory process of the Mir23a cluster.
This study provides compelling evidence to first demonstrate that MIR27a is essential for regulating the bone resorption process through modulation of osteoclast differentiation. The loss of MIR27a in mice leads to elevated numbers of osteoclast cells as well as increases in bone resorption activity. The inhibitory function of MIR27a on osteoclastogenesis is also in agreement with previous in vitro culture data showing its crucial downregulation among miRNAs associated with osteoclast differentiation (Ma et al., 2016). Furthermore, MIR23a upregulation has been detected in osteopetrosis patients (Ou et al., 2014). Although the number of osteoclast progenitors is comparable between the control and mutant, the deletion of Mir27a strongly accelerates the process of osteoclastogenesis. The isolated ∆Mir27a exhibits a highly potent ability in differentiation and maturation, indicating cell-autonomous regulations of MIR27a in the osteoclast cell.
The gain-of-function mutations have linked p62 to the cause of Paget’s disease of bone – a genetic disorder characterized by aberrant osteoclastic activity (Rea et al., 2006; Laurin et al., 2002). The knockout of p62 in mice further supports its critical role in osteoclastogenesis (Rea et al., 2006). Our identification and characterization of p62 as a direct downstream regulator of MIR27a established a new osteoclast signaling axis. Not only osteoclast differentiation and maturation are suppressed by high levels of p62 but also its reduction can alleviate excessive osteoclastogenesis caused by the loss of MIR27a. Our findings suggest the MIR27a-p62 regulatory axis is necessary and sufficient to regulate bone remodeling through the modulation of osteoclastogenesis. In addition, circulatory miRNAs were released in the cell-free form either bound with protein components or encapsulated with microvesicles. They are quite stable and found with variations in miRNA signature as biomarkers (Garnero, 2008). Therefore, the identification of MIR27a as essential for bone remodeling promises its use as a biomarker for early detection of bone destruction-associated diseases, risk prediction for bone fracture, as well as personalized treatment and monitoring of the treatment efficacy.
Hormone therapy is effective for the prevention and treatment of postmenopausal osteoporosis as estrogen reduction is a crucial pathogenic factor. Because of the well-documented side effects, e.g., cardiovascular events and breast cancer risk, estrogen-based therapies are now limited to short-term use (Rossouw et al., 2002; Khosla and Hofbauer, 2017). Another widely used treatment for osteoporosis is bisphosphonates, which possess a high affinity for bone minerals with inhibitory effects on osteoclast cells (Khosla and Hofbauer, 2017; Russell et al., 2008). However, there is a need for alternative treatments due to the side effects of bisphosphonates, e.g., atypical femur fracture and osteonecrosis of the jaw (Russell et al., 2008; Shane et al., 2014). In addition, the treatment effectiveness after 5 years remains uncertain (Izano et al., 2020). A better understanding of the bone remodeling process can help maximize anti-fracture efficacy and minimize adverse skeletal effects.
The clear demonstration of osteoporotic bone loss caused by the disruption of MIR27a suggests its supplementation be explored as a new therapeutic approach. The clinical application requires a system for osteoclast delivery of MIR27a. However, this may be complicated by the negative effects of the MIR23a cluster on osteoblast-mediated bone formation (Zeng et al., 2017). High levels of MIR23a in the mast cells also lead to bone loss through the release of extracellular vesicles by neoplastic mast cells (Kim et al., 2021). Therefore, targeting MIR27a to the bone resorption surfaces with synthetic compounds such as bisphosphonates or osteoclast-targeting molecules such as acid octapeptides with aspartic acid is critical for future clinical applications (Dang et al., 2016).
Materials and methods
Animals
The CRISPR/Cas9 gene edition strategy was used to generate ∆Mir23a~27a and ∆Mir27a mouse strains (Cong et al., 2013; Mali et al., 2013). Complementary oligonucleotides containing the Mir23a or Mir27a sgRNA target sequences were designed by CRISPR Design Tool (http://crispr.mit.edu) and inserted into the pX335 plasmid (Addgene, Cambridge, MA, USA), followed by DNA sequencing to verify the correct cloning. A mixture of sgRNA plasmid, Cas9 protein (NEB, Ipswich, MA, USA), and ssODN (Integrated DNA Technologies, Coralville, IA, USA) was injected into the pronuclei and cytoplasm of fertilized eggs (Mashiko et al., 2013; Wu et al., 2016). The survived embryos were transferred into the oviduct of pseudopregnant females for carrying to term. The founder lines were genotyped by PCR analysis using primers 5’-GAC CCA GCC TGG TCA AGA TA-3’ and 5’-GGA CTC CTG TTC CTG CTG AA-3’ to determine the success of the gene edition and germline transmission. Both male and female mice were used in this study. Care and use of experimental animals described in this work comply with the guidelines and policies of the University Committee on Animal Resources at the University of Rochester and IACUC at the Forsyth Institute.
Genes
Total RNAs including miRNAs were isolated using a mirVana miRNA isolation kit (Thermo Fisher Scientific, Waltham, MA, USA), followed by polyadenylation using Escherichia coli Poly(A) polymerase (NEB), and reserve transcribed into DNA using Reverse Transcriptase (Thermo Fisher Scientific) and an anchor primer. Based on the dominant mature miRNA sequences, four to six nucleotides were added to the 5’ end to enhance the annealing specificity. To detect the expression of the miRNAs, the reverse transcription products were subject to PCR analysis using forward and reverse primers listed in Supplementary file 1. The PCR was performed by denaturation at 95°C for 2 min and 27 cycles of amplification (95°C for 20 s, 60°C for 10 s, and 70°C for 10 s). The Lentivirus-Mir27a (Cat #MmiR3347MR03, GeneCopoeia, Rockville, MD) and Lentivirus-shRNA Sqstm1 (Product ID: MSH093992, Accession: NM_011018.3, GeneCopoeia) were used to express Mir27a and knockdown Sqstm1, respectively.
Cells
Primary cells were harvested from bone marrows of the bilateral femur to obtain bone marrow cells. These cells were incubated with Mouse BD Fc Block (Cat #553142, BD Biosciences, San Jose, CA, USA) to reduce non-specific antibody staining caused by receptors for IgG, followed by FACS analysis with anti-CD11b/Mac-1 (M1/70)-APC (17-0112-81, eBioscience/Thermo Fisher Scientific; 1:400), anti-granulocyte mAb: anti-Ly-6G/Gr-1 (RB6-8C5)-PE (12-5931-81, eBioscience; 1:10000), and anti-dendritic cell mAb: anti-CD11c (N418)-FITC (11-0114-81, eBioscience; 1:20) using LSR II (BD Biosciences). For osteoclast differentiation, isolated cells were cultured in αMEM containing 10% FBS, 1% L-glutamine, 1% non-essential amino acids, and 5 ng/ml M-CSF for 2 days, followed by the addition of RANKL 10 ng/ml (R&D, Minneapolis, MN, USA). The differentiated cells were then fixed with 10% formalin followed by TRAP staining (Yao et al., 2006). For bone resorption assay, 5×10⁴ primary osteoclast progenitors isolated from 3-month-old control and ∆Mir27a femur were seeded in 96 well Corning Osteo Assay Surface plate (Cat #3988, Corning, Glendale, AZ, USA) and cultured in 5% CO2 with differentiation media at 37°C. After culturing for 5 days, the resorbed areas on the plates were imaged by a Nikon SMZ1500 microscope, followed by ImageJ analysis. For actin ring formation assay, 5×10⁴ primary osteoclast progenitors isolated from 3-month-old control and ∆Mir27a femur were seeded in 96 well plates. After 5 days of culture, the cells were fixed with 4% Paraformaldehyde(PFA) in PBS for 15 min, permeabilized with 0.1% Triton X-100 in PBS, and incubated with Phalloidin-Alexa 488 (Cat #A12379 Invitrogen) for 1 hr at room temperature. Nuclear counterstaining was performed by DAPI (4’,6-diamidino-2-phenylindole).
3’UTR assay
The LUC-3’UTR reporter DNA plasmids contain the 3'UTR from Sqstm1, Tgfbr1, Snx10, Map2k7, and Ctsk fused to the end of a luciferase reporter gene (MmiT079315-MT06, MmiT096143-MT06, MmiT073076-MT06, MmiT099033-MT06, MmiT091679-MT06, and GeneCopoeia). C3H10T1/2 mesenchymal cells were transfected by the LUC-3’UTR without or with co-transfection of Mir27a (MmiR3347-MR04-50 and GeneCopoeia) using Lipofectamine 200 (Cat #11668027, Invitrogen, Waltham, MA, USA). The transcript stability and its translation efficiency in the presence or absence of Mir27a were determined by the luciferase assay 72 hr after the transfection using the Dual-Luciferase Reporter Assay System (Cat #1910, Promega, Madison, WI, USA). The luminescent intensity was measured by the SpectraMax iD3 Multi-Mode Microplate Reader (Molecular Devices, San Jose, CA, USA). Firefly luciferase activities were normalized by the values of Renilla luciferase.
Bone analysis and staining
Mouse limbs and spines were collected for ex vivo μCT imaging using a vivaCT40 scanner (Scanco USA, Wayne, PA, USA). The scanned images were segmented for reconstruction to access the relative bone volume (BV/TV, %) by 3D visualization and analysis using Amira (FEI, Thermo Fisher Scientific). To perform quantitative measurements, 170 and 200 slices were used for the femur trabecular bone and L5 spine, respectively. Cortical bone thickness (Ct. Th, mm) was analyzed at a standardized location of 30 slices near the midshaft. Skeletal preparation, fixation, and embedding for paraffin sections were performed as described (Maruyama et al., 2010; Yu et al., 2005a; Mirando et al., 2010; Maruyama et al., 2013a; Yu et al., 2010; Yu et al., 2005b; Yu et al., 2007; Maruyama et al., 2013b; Maruyama et al., 2016; Maruyama et al., 2017). Samples were subject to hematoxylin and eosin staining for histology, TRAP staining, van Kossa staining, or immunological staining with avidin: biotinylated enzyme complex (Maruyama et al., 2010; Yu et al., 2005a; Maruyama et al., 2013a; Yu et al., 2005b; Yu et al., 2007; Maruyama et al., 2016; Maruyama et al., 2017; Chiu et al., 2008; Fu and Hsu, 2013; Russell, 1972; Fu et al., 2014). The immunological staining was visualized by enzymatic color reaction or fluorescence according to the manufacturer’s specification (Vector Laboratories, Burlingame, CA, USA). After TRAP staining, N.Oc/T.Ar, N.Oc/BS, and Oc.S/BS (%) were determined for statistical significance. Rabbit antibodies Collagen I (LSL-LB-1190, Cosmo Bio Co., LTD., Japan; 1:2000), Cathepsin K (ab19027, Abcam, Cambridge, MA, USA; 1:50); mouse antibodies Osteopontin (MPIIIB10, Hybridoma Bank, IA, USA; 1:500) were used in these analyses. Images were taken using Leica DM2500 and DFC310FX imaging system (Leica, Bannockburn, IL, USA) and Zeiss Axio Observer microscope (Carl Zeiss, Thornwood, NY, USA). BFR was examined by double labeling of Alizarin Red S and Calcein Green, injected intraperitoneally with a 7 day interval. The labeled samples were embedded without decalcification for frozen sections (SECTION-LAB Co. Ltd, Japan; Maruyama et al., 2013a; Maruyama et al., 2016; Maruyama et al., 2017), followed by analyzed under a fluorescent microscope using an OsteoMeasure morphometry system (OsteoMetrics, Atlanta, GA, USA) to determine Mineral Apposition Rate (MAR, BFR/BS).
Statistics and reproducibility
Microsoft Excel 2010 was used for statistical analysis. The significance was determined by two-sided student t-tests. A p-value less than 0.05 was considered statistically significant. Before performing the t-tests, the normality of the data distribution was first validated by the Shapiro-Wilk normality test. Analysis of samples by µCT was performed by a technician who is blinded to the condition. No randomization, statistical method to predetermine the sample size, and inclusion/exclusion criteria defining criteria for samples were used. At least three independent experiments were performed for statistical analyses of the animal tissues described in figure legends. Statistical data were presented as mean ± SD. The miPath v.3 KEGG Reverse Search with Search Pathway: mmu04380 and Method: TarBase v7.0 was used to identify the candidates that are both miR-27a targets (TarBase v7.0) and genes associated with osteoclast differentiation (KEGG: mmu04380).
Materials and correspondence
Correspondence and material requests should be addressed to W.H. and T.M.
Acknowledgements
We thank Chyuan-Sheng Lin, Keiko Kaneko, Ya-Hui Chiu, Michael Thullen, and Hsiao-Man Ivy Yu for assistance in transgenic mouse strains, plasmid DNA construction and purification, FACS, µCT scanning, and imaging analysis, respectively. Research reported in this publication is supported by the National Institute of Dental and Craniofacial Research of the National Institutes of Health under award numbers R01DE015654 and R01DE026936 to WH. and R21DE028696 to TM.
Funding Statement
The funders had no role in study design, data collection and interpretation, or the decision to submit the work for publication.
Contributor Information
Wei Hsu, Email: wei.hsu@hsdm.harvard.edu.
Takamitsu Maruyama, Email: tmaruyama@forsyth.org.
Ritu Trivedi, CSIR-Central Drug Research Institute, India.
Mone Zaidi, Icahn School of Medicine at Mount Sinai, United States.
Funding Information
This paper was supported by the following grants:
National Institutes of Health DE015654 to Wei Hsu.
National Institutes of Health DE026936 to Wei Hsu.
National Institutes of Health DE028696 to Takamitsu Maruyama.
Additional information
Competing interests
No competing interests declared.
No competing interests declared.
Author contributions
Conceptualization, Data curation, Formal analysis, Investigation, Writing - original draft.
Data curation, Formal analysis, Investigation.
Data curation, Formal analysis, Investigation.
Data curation.
Data curation, Formal analysis, Investigation.
Software, Methodology.
Conceptualization, Data curation, Supervision, Funding acquisition, Writing - original draft, Project administration, Writing - review and editing.
Conceptualization, Data curation, Supervision, Funding acquisition, Writing - original draft, Project administration, Writing - review and editing.
Ethics
Care and use of experimental animals described in this work comply with the recommendations in the Guide for the Care and Use of Laboratory Animals of the National Institutes of Health. All of the animals were handled according to approved institutional animal care and use committee (IACUC) protocols (#102402) of the University of Rochester and protocols (#21-005) of the Forsyth Institute.
Additional files
Data availability
All data generated or analyzed during this study are included in the manuscript and supporting file.
References
- Androsavich JR, Sobczynski DJ, Liu X, Pandya S, Kaimal V, Owen T, Liu K, MacKenna DA, Chau BN. Polysome shift assay for direct measurement of miRNA inhibition by anti-mirna drugs. Nucleic Acids Research. 2016;44:e13. doi: 10.1093/nar/gkv893. [DOI] [PMC free article] [PubMed] [Google Scholar]
- Baek D, Villén J, Shin C, Camargo FD, Gygi SP, Bartel DP. The impact of microRNAs on protein output. Nature. 2008;455:64–71. doi: 10.1038/nature07242. [DOI] [PMC free article] [PubMed] [Google Scholar]
- Bartel DP. Micrornas: genomics, biogenesis, mechanism, and function. Cell. 2004;116:281–297. doi: 10.1016/s0092-8674(04)00045-5. [DOI] [PubMed] [Google Scholar]
- Charles JF, Nakamura MC. Bone and the innate immune system. Current Osteoporosis Reports. 2014;12:1–8. doi: 10.1007/s11914-014-0195-2. [DOI] [PMC free article] [PubMed] [Google Scholar]
- Chiu SY, Asai N, Costantini F, Hsu W. Sumo-Specific protease 2 is essential for modulating p53-Mdm2 in development of trophoblast stem cell niches and lineages. PLOS Biology. 2008;6:e310. doi: 10.1371/journal.pbio.0060310. [DOI] [PMC free article] [PubMed] [Google Scholar]
- Cong L, Ran FA, Cox D, Lin S, Barretto R, Habib N, Hsu PD, Wu X, Jiang W, Marraffini LA, Zhang F. Multiplex genome engineering using CRISPR/cas systems. Science. 2013;339:819–823. doi: 10.1126/science.1231143. [DOI] [PMC free article] [PubMed] [Google Scholar]
- Croce CM. Causes and consequences of microRNA dysregulation in cancer. Nature Reviews. Genetics. 2009;10:704–714. doi: 10.1038/nrg2634. [DOI] [PMC free article] [PubMed] [Google Scholar]
- Dang L, Liu J, Li F, Wang L, Li D, Guo B, He X, Jiang F, Liang C, Liu B, Badshah SA, He B, Lu J, Lu C, Lu A, Zhang G. Targeted delivery systems for molecular therapy in skeletal disorders. International Journal of Molecular Sciences. 2016;17:428. doi: 10.3390/ijms17030428. [DOI] [PMC free article] [PubMed] [Google Scholar]
- Durán A, Serrano M, Leitges M, Flores JM, Picard S, Brown JP, Moscat J, Diaz-Meco MT. The atypical PKC-interacting protein p62 is an important mediator of RANK-activated osteoclastogenesis. Developmental Cell. 2004;6:303–309. doi: 10.1016/s1534-5807(03)00403-9. [DOI] [PubMed] [Google Scholar]
- Ebert MS, Neilson JR, Sharp PA. Microrna sponges: competitive inhibitors of small RNAs in mammalian cells. Nature Methods. 2007;4:721–726. doi: 10.1038/nmeth1079. [DOI] [PMC free article] [PubMed] [Google Scholar]
- Ebert MS, Sharp PA. Roles for microRNAs in conferring robustness to biological processes. Cell. 2012;149:515–524. doi: 10.1016/j.cell.2012.04.005. [DOI] [PMC free article] [PubMed] [Google Scholar]
- Feng X, McDonald JM. Disorders of bone remodeling. Annual Review of Pathology. 2011;6:121–145. doi: 10.1146/annurev-pathol-011110-130203. [DOI] [PMC free article] [PubMed] [Google Scholar]
- Fu J, Hsu W. Epidermal Wnt controls hair follicle induction by orchestrating dynamic signaling crosstalk between the epidermis and dermis. The Journal of Investigative Dermatology. 2013;133:890–898. doi: 10.1038/jid.2012.407. [DOI] [PMC free article] [PubMed] [Google Scholar]
- Fu J, Yu HMI, Chiu SY, Mirando AJ, Maruyama EO, Cheng JG, Hsu W. Disruption of SUMO-specific protease 2 induces mitochondria mediated neurodegeneration. PLOS Genetics. 2014;10:e1004579. doi: 10.1371/journal.pgen.1004579. [DOI] [PMC free article] [PubMed] [Google Scholar]
- Garnero P. Biomarkers for osteoporosis management: utility in diagnosis, fracture risk prediction and therapy monitoring. Molecular Diagnosis & Therapy. 2008;12:157–170. doi: 10.1007/BF03256280. [DOI] [PubMed] [Google Scholar]
- Gaur T, Hussain S, Mudhasani R, Parulkar I, Colby JL, Frederick D, Kream BE, van Wijnen AJ, Stein JL, Stein GS, Jones SN, Lian JB. Dicer inactivation in osteoprogenitor cells compromises fetal survival and bone formation, while excision in differentiated osteoblasts increases bone mass in the adult mouse. Developmental Biology. 2010;340:10–21. doi: 10.1016/j.ydbio.2010.01.008. [DOI] [PMC free article] [PubMed] [Google Scholar]
- Guo Q, Chen Y, Guo L, Jiang T, Lin Z. MiR-23a/b regulates the balance between osteoblast and adipocyte differentiation in bone marrow mesenchymal stem cells. Bone Research. 2016;4:16022. doi: 10.1038/boneres.2016.22. [DOI] [PMC free article] [PubMed] [Google Scholar]
- Guo L, Chen K, Yuan J, Huang P, Xu X, Li C, Qian N, Qi J, Shao Z, Deng L, He C, Xu J. Estrogen inhibits osteoclasts formation and bone resorption via microRNA-27a targeting PPARγ and APC. Journal of Cellular Physiology. 2018;234:581–594. doi: 10.1002/jcp.26788. [DOI] [PubMed] [Google Scholar]
- Hassan MQ, Gordon JAR, Beloti MM, Croce CM, van Wijnen AJ, Stein JL, Stein GS, Lian JB. A network connecting runx2, SATB2, and the mir-23a~27a~24-2 cluster regulates the osteoblast differentiation program. PNAS. 2010;107:19879–19884. doi: 10.1073/pnas.1007698107. [DOI] [PMC free article] [PubMed] [Google Scholar]
- Hausser J, Zavolan M. Identification and consequences of mirna-target interactions -- beyond repression of gene expression. Nature Reviews. Genetics. 2014;15:599–612. doi: 10.1038/nrg3765. [DOI] [PubMed] [Google Scholar]
- Izano MA, Lo JC, Adams AL, Ettinger B, Ott SM, Chandra M, Hui RL, Niu F, Li BH, Neugebauer RS. Bisphosphonate treatment beyond 5 years and hip fracture risk in older women. JAMA Network Open. 2020;3:e2025190. doi: 10.1001/jamanetworkopen.2020.25190. [DOI] [PMC free article] [PubMed] [Google Scholar]
- Kanehisa M, Goto S. Kegg: Kyoto encyclopedia of genes and genomes. Nucleic Acids Research. 2000;28:27–30. doi: 10.1093/nar/28.1.27. [DOI] [PMC free article] [PubMed] [Google Scholar]
- Kanehisa M, Araki M, Goto S, Hattori M, Hirakawa M, Itoh M, Katayama T, Kawashima S, Okuda S, Tokimatsu T, Yamanishi Y. Kegg for linking genomes to life and the environment. Nucleic Acids Research. 2008;36:D480–D484. doi: 10.1093/nar/gkm882. [DOI] [PMC free article] [PubMed] [Google Scholar]
- Khosla S, Hofbauer LC. Osteoporosis treatment: recent developments and ongoing challenges. The Lancet. Diabetes & Endocrinology. 2017;5:898–907. doi: 10.1016/S2213-8587(17)30188-2. [DOI] [PMC free article] [PubMed] [Google Scholar]
- Kim D-K, Bandara G, Cho Y-E, Komarow HD, Donahue DR, Karim B, Baek M-C, Kim HM, Metcalfe DD, Olivera A. Mastocytosis-derived extracellular vesicles deliver miR-23a and miR-30a into pre-osteoblasts and prevent osteoblastogenesis and bone formation. Nature Communications. 2021;12:2527. doi: 10.1038/s41467-021-22754-4. [DOI] [PMC free article] [PubMed] [Google Scholar]
- Laurin N, Brown JP, Morissette J, Raymond V. Recurrent mutation of the gene encoding sequestosome 1 (SQSTM1/p62) in Paget disease of bone. American Journal of Human Genetics. 2002;70:1582–1588. doi: 10.1086/340731. [DOI] [PMC free article] [PubMed] [Google Scholar]
- Li Z, Rana TM. Therapeutic targeting of microRNAs: current status and future challenges. Nature Reviews. Drug Discovery. 2014;13:622–638. doi: 10.1038/nrd4359. [DOI] [PubMed] [Google Scholar]
- Ma Y, Shan Z, Ma J, Wang Q, Chu J, Xu P, Qin A, Fan S. Validation of downregulated microRNAs during osteoclast formation and osteoporosis progression. Molecular Medicine Reports. 2016;13:2273–2280. doi: 10.3892/mmr.2016.4765. [DOI] [PubMed] [Google Scholar]
- Mali P, Yang L, Esvelt KM, Aach J, Guell M, DiCarlo JE, Norville JE, Church GM. Rna-Guided human genome engineering via Cas9. Science. 2013;339:823–826. doi: 10.1126/science.1232033. [DOI] [PMC free article] [PubMed] [Google Scholar]
- Manolagas SC, Jilka RL. Bone marrow, cytokines, and bone remodeling. Emerging insights into the pathophysiology of osteoporosis. The New England Journal of Medicine. 1995;332:305–311. doi: 10.1056/NEJM199502023320506. [DOI] [PubMed] [Google Scholar]
- Maruyama T, Mirando AJ, Deng CX, Hsu W. The balance of Wnt and FGF signaling influences mesenchymal stem cell fate during skeletal development. Science Signaling. 2010;3:ra40. doi: 10.1126/scisignal.2000727. [DOI] [PMC free article] [PubMed] [Google Scholar]
- Maruyama T, Jiang M, Hsu W. Gpr177, a novel locus for bone mineral density and osteoporosis, regulates osteogenesis and chondrogenesis in skeletal development. Journal of Bone and Mineral Research. 2013a;28:1150–1159. doi: 10.1002/jbmr.1830. [DOI] [PMC free article] [PubMed] [Google Scholar]
- Maruyama EO, Yu HMI, Jiang M, Fu J, Hsu W. Gpr177 deficiency impairs mammary development and prohibits wnt-induced tumorigenesis. PLOS ONE. 2013b;8:e56644. doi: 10.1371/journal.pone.0056644. [DOI] [PMC free article] [PubMed] [Google Scholar]
- Maruyama T, Jeong J, Sheu TJ, Hsu W. Stem cells of the suture mesenchyme in craniofacial bone development, repair and regeneration. Nature Communications. 2016;7:10526. doi: 10.1038/ncomms10526. [DOI] [PMC free article] [PubMed] [Google Scholar]
- Maruyama T, Jiang M, Abbott A, Yu HMI, Huang Q, Chrzanowska-Wodnicka M, Chen EI, Hsu W. Rap1B is an effector of AXIN2 regulating crosstalk of signaling pathways during skeletal development. Journal of Bone and Mineral Research. 2017;32:1816–1828. doi: 10.1002/jbmr.3171. [DOI] [PMC free article] [PubMed] [Google Scholar]
- Mashiko D, Fujihara Y, Satouh Y, Miyata H, Isotani A, Ikawa M. Generation of mutant mice by pronuclear injection of circular plasmid expressing Cas9 and single guided RNA. Scientific Reports. 2013;3:3355. doi: 10.1038/srep03355. [DOI] [PMC free article] [PubMed] [Google Scholar]
- Mirando AJ, Maruyama T, Fu J, Yu H-MI, Hsu W. β-catenin/cyclin D1 mediated development of suture mesenchyme in calvarial morphogenesis. BMC Developmental Biology. 2010;10:116. doi: 10.1186/1471-213X-10-116. [DOI] [PMC free article] [PubMed] [Google Scholar]
- Miska EA, Alvarez-Saavedra E, Abbott AL, Lau NC, Hellman AB, McGonagle SM, Bartel DP, Ambros VR, Horvitz HR. Most Caenorhabditis elegans microRNAs are individually not essential for development or viability. PLOS Genetics. 2007;3:e215. doi: 10.1371/journal.pgen.0030215. [DOI] [PMC free article] [PubMed] [Google Scholar]
- Mizoguchi F, Izu Y, Hayata T, Hemmi H, Nakashima K, Nakamura T, Kato S, Miyasaka N, Ezura Y, Noda M. Osteoclast-Specific Dicer gene deficiency suppresses osteoclastic bone resorption. Journal of Cellular Biochemistry. 2010;109:866–875. doi: 10.1002/jcb.22228. [DOI] [PubMed] [Google Scholar]
- Ou M, Zhang X, Dai Y, Gao J, Zhu M, Yang X, Li Y, Yang T, Ding M. Identification of potential microRNA-target pairs associated with osteopetrosis by deep sequencing, iTRAQ proteomics and bioinformatics. European Journal of Human Genetics. 2014;22:625–632. doi: 10.1038/ejhg.2013.221. [DOI] [PMC free article] [PubMed] [Google Scholar]
- Park CY, Jeker LT, Carver-Moore K, Oh A, Liu HJ, Cameron R, Richards H, Li Z, Adler D, Yoshinaga Y, Martinez M, Nefadov M, Abbas AK, Weiss A, Lanier LL, de Jong PJ, Bluestone JA, Srivastava D, McManus MT. A resource for the conditional ablation of microRNAs in the mouse. Cell Reports. 2012;1:385–391. doi: 10.1016/j.celrep.2012.02.008. [DOI] [PMC free article] [PubMed] [Google Scholar]
- Rea SL, Walsh JP, Ward L, Yip K, Ward BK, Kent GN, Steer JH, Xu J, Ratajczak T. A novel mutation (K378X) in the sequestosome 1 gene associated with increased NF-kappaB signaling and Paget’s disease of bone with a severe phenotype. Journal of Bone and Mineral Research. 2006;21:1136–1145. doi: 10.1359/jbmr.060405. [DOI] [PubMed] [Google Scholar]
- Rossouw JE, Anderson GL, Prentice RL, LaCroix AZ, Kooperberg C, Stefanick ML, Jackson RD, Beresford SAA, Howard BV, Johnson KC, Kotchen JM, Ockene J, Writing Group for the Women’s Health Initiative Investigators Risks and benefits of estrogen plus progestin in healthy postmenopausal women: principal results from the women’s health initiative randomized controlled trial. JAMA. 2002;288:321–333. doi: 10.1001/jama.288.3.321. [DOI] [PubMed] [Google Scholar]
- Russell HK. A modification of movat’s pentachrome stain. Archives of Pathology. 1972;94:187–191. [PubMed] [Google Scholar]
- Russell RGG, Watts NB, Ebetino FH, Rogers MJ. Mechanisms of action of bisphosphonates: similarities and differences and their potential influence on clinical efficacy. Osteoporosis International. 2008;19:733–759. doi: 10.1007/s00198-007-0540-8. [DOI] [PubMed] [Google Scholar]
- Seeliger C, Karpinski K, Haug AT, Vester H, Schmitt A, Bauer JS, van Griensven M. Five freely circulating miRNAs and bone tissue miRNAs are associated with osteoporotic fractures. Journal of Bone and Mineral Research. 2014;29:1718–1728. doi: 10.1002/jbmr.2175. [DOI] [PubMed] [Google Scholar]
- Shane E, Burr D, Abrahamsen B, Adler RA, Brown TD, Cheung AM, Cosman F, Curtis JR, Dell R, Dempster DW, Ebeling PR, Einhorn TA, Genant HK, Geusens P, Klaushofer K, Lane JM, McKiernan F, McKinney R, Ng A, Nieves J, O’Keefe R, Papapoulos S, Howe TS, van der Meulen MCH, Weinstein RS, Whyte MP. Atypical subtrochanteric and diaphyseal femoral fractures: second report of a task force of the American Society for bone and mineral research. Journal of Bone and Mineral Research. 2014;29:1–23. doi: 10.1002/jbmr.1998. [DOI] [PubMed] [Google Scholar]
- Shenoy A, Blelloch RH. Regulation of microRNA function in somatic stem cell proliferation and differentiation. Nature Reviews. Molecular Cell Biology. 2014;15:565–576. doi: 10.1038/nrm3854. [DOI] [PMC free article] [PubMed] [Google Scholar]
- Stark A, Brennecke J, Bushati N, Russell RB, Cohen SM. Animal microRNAs confer robustness to gene expression and have a significant impact on 3’UTR evolution. Cell. 2005;123:1133–1146. doi: 10.1016/j.cell.2005.11.023. [DOI] [PubMed] [Google Scholar]
- Vlachos IS, Paraskevopoulou MD, Karagkouni D, Georgakilas G, Vergoulis T, Kanellos I, Anastasopoulos IL, Maniou S, Karathanou K, Kalfakakou D, Fevgas A, Dalamagas T, Hatzigeorgiou AG. DIANA-tarbase v7.0: indexing more than half a million experimentally supported mirna: mrna interactions. Nucleic Acids Research. 2015a;43:D153–D159. doi: 10.1093/nar/gku1215. [DOI] [PMC free article] [PubMed] [Google Scholar]
- Vlachos IS, Zagganas K, Paraskevopoulou MD, Georgakilas G, Karagkouni D, Vergoulis T, Dalamagas T, Hatzigeorgiou AG. DIANA-mirpath v3.0: deciphering microrna function with experimental support. Nucleic Acids Research. 2015b;43:W460–W466. doi: 10.1093/nar/gkv403. [DOI] [PMC free article] [PubMed] [Google Scholar]
- Wu W-H, Tsai Y-T, Justus S, Lee T-T, Zhang L, Lin C-S, Bassuk AG, Mahajan VB, Tsang SH. Crispr repair reveals causative mutation in a preclinical model of retinitis pigmentosa. Molecular Therapy. 2016;24:1388–1394. doi: 10.1038/mt.2016.107. [DOI] [PMC free article] [PubMed] [Google Scholar]
- Yao Z, Li P, Zhang Q, Schwarz EM, Keng P, Arbini A, Boyce BF, Xing L. Tumor necrosis factor-alpha increases circulating osteoclast precursor numbers by promoting their proliferation and differentiation in the bone marrow through up-regulation of c-fms expression. The Journal of Biological Chemistry. 2006;281:11846–11855. doi: 10.1074/jbc.M512624200. [DOI] [PubMed] [Google Scholar]
- You L, Pan L, Chen L, Gu W, Chen J. Mir-27A is essential for the shift from osteogenic differentiation to adipogenic differentiation of mesenchymal stem cells in postmenopausal osteoporosis. Cellular Physiology and Biochemistry. 2016;39:253–265. doi: 10.1159/000445621. [DOI] [PubMed] [Google Scholar]
- Yu HMI, Jerchow B, Sheu TJ, Liu B, Costantini F, Puzas JE, Birchmeier W, Hsu W. The role of AXIN2 in calvarial morphogenesis and craniosynostosis. Development. 2005a;132:1995–2005. doi: 10.1242/dev.01786. [DOI] [PMC free article] [PubMed] [Google Scholar]
- Yu HMI, Liu B, Chiu SY, Costantini F, Hsu W. Development of a unique system for spatiotemporal and lineage-specific gene expression in mice. PNAS. 2005b;102:8615–8620. doi: 10.1073/pnas.0500124102. [DOI] [PMC free article] [PubMed] [Google Scholar]
- Yu H-MI, Liu B, Costantini F, Hsu W. Impaired neural development caused by inducible expression of Axin in transgenic mice. Mechanisms of Development. 2007;124:146–156. doi: 10.1016/j.mod.2006.10.002. [DOI] [PMC free article] [PubMed] [Google Scholar]
- Yu H-MI, Jin Y, Fu J, Hsu W. Expression of gpr177, a Wnt trafficking regulator, in mouse embryogenesis. Developmental Dynamics. 2010;239:2102–2109. doi: 10.1002/dvdy.22336. [DOI] [PMC free article] [PubMed] [Google Scholar]
- Zeng H-C, Bae Y, Dawson BC, Chen Y, Bertin T, Munivez E, Campeau PM, Tao J, Chen R, Lee BH. Microrna miR-23a cluster promotes osteocyte differentiation by regulating TGF-β signalling in osteoblasts. Nature Communications. 2017;8:15000. doi: 10.1038/ncomms15000. [DOI] [PMC free article] [PubMed] [Google Scholar]


