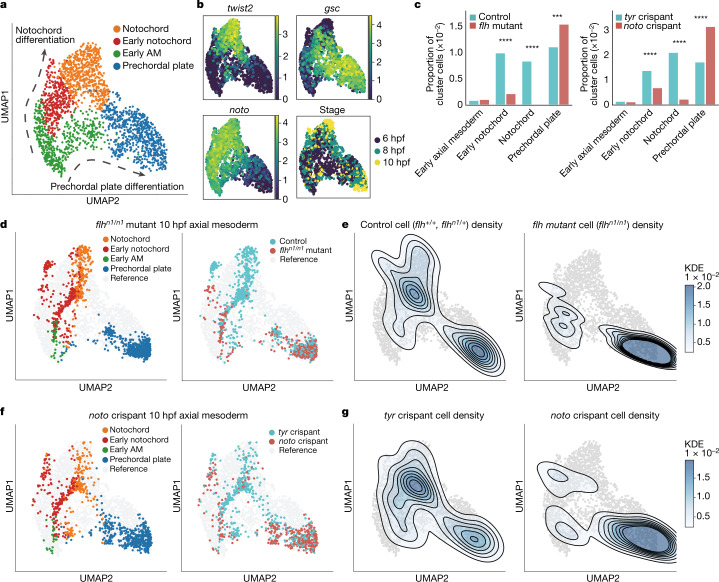
Fig. 4. Experimental validation of zebrafish noto LOF predictions.
a, UMAP plot of WT reference data for axial mesoderm (6, 8 and 10 hpf): notochord, early notochord, early axial mesoderm and prechordal plate clusters (n = 2,012 cells). Arrows indicate notochord differentiation (top) and prechordal plate differentiation (bottom). b, Gene expression (log-transformed unique molecular identifier (UMI) count) and developmental stage are projected onto the axial mesoderm UMAP plot. Noto and twist2 are expressed in notochord, whereas gsc marks the prechordal plate. c, Bar plots comparing cell cluster compositions between treatments and controls (left, flhn1/n1 mutants (10 hpf) and controls; right, noto crispants (10 hpf) and tyr crispants). Cluster compositions are presented as the proportion of each group normalized to the whole cell number. In both flhn1/n1 mutants and noto crispants, the notochord is significantly depleted (flhn1/n1: P = 5.55 × 10−52; noto: P = 1.39 × 10⁻³³, chi-square test) and the prechordal plate is significantly expanded (flhn1/n1: P = 1.07 × 10⁻⁴; noto: P = 5.01 × 10⁻¹⁸, chi-square test. ***P < 0.001; ****P < 0.0001). d–g, flhn1/n1 mutant or noto crispant data projected onto the WT axial mesoderm UMAP plot. d, Cluster annotation and sample label projected onto the UMAP plot. e, Kernel cell density contour plot shows control cell density (left) and flhn1/n1 mutant cell density (right). f, Cluster annotation and sample label projected onto the UMAP plot. g, tyr crispant cell density (left) and noto crispant cell density (right) shown on the kernel cell density contour plot.

