

Abstract
Objective:
Climate and social vulnerability contribute to morbidity and healthcare utilization. We examined associations between the neighborhood Social Vulnerability Index (SVI) and the Heat Vulnerability Index (HVI) and recurrent hospitalizations among individuals with rheumatic conditions.
Methods:
Using a Massachusetts multihospital centralized clinical data repository, we identified individuals ≥18 years with a rheumatic condition who received rheumatology care within 3 years of 4/2021. We defined the index date as two years before the last encounter and the baseline period as one year pre-index date. Addresses were geocoded and linked by census tract to the SVI and the HVI. We used multilevel, multinomial logistic regression to examine the odds of 1–3 and ≥4 hospitalizations (reference=0) over two years post index date by vulnerability index, adjusting for age, gender, race/ethnicity, insurance, and comorbidities.
Results:
Among 14,401 individuals with rheumatic conditions, the mean age was 61.9 (SD 15.7) years, 70% were female, 79% White, 7% Black, and 2% Hispanic. There were 8,251 hospitalizations; 11,649 individuals (81%) had 0, 2,063 (14%) had 1–3, and 689 (5%) had ≥4. Adjusting for individual-level factors, individuals living in the highest vs. lowest SVI areas had 1.84 times higher odds (95% CI 1.43–2.36) of ≥4 hospitalizations. Individuals living in the highest vs. lowest HVI areas had 1.64 times greater odds (95% CI 1.17–2.31) of ≥4 hospitalizations.
Conclusion:
Individuals with rheumatic conditions living in areas with high vs. low social and heat vulnerability had significantly greater odds of recurrent hospitalizations. Studies are needed to determine modifiable factors to mitigate risks.
Introduction
The place where a person lives directly affects overall health and health behaviors, healthcare utilization, and quality of life and contributes to racial, ethnic and socioeconomic disparities in outcomes.(1, 2) The neighborhood environment plays a critical role as a social determinant of health both through direct geographical factors (e.g., proximity to toxins, heat islands, health facilities) and as a structural condition that contributes to opportunities like education and employment. (3–5) Environmental exposures resulting from climate change, such as extreme heat, often overlap with neighborhood deprivation, and are independently associated with avoidable acute care use and adverse health outcomes. Historically redlined neighborhoods, which are lower income and include more marginalized populations, are on average, 5 degrees hotter in the summer.(6)
Among individuals with rheumatic conditions, neighborhood-level factors have been associated with disease prevalence, health behaviors and outcomes. There is a higher prevalence of systemic lupus erythematosus (SLE) among Medicaid beneficiaries living in ZIP codes with lower socioeconomic status.(7) Medicaid beneficiaries with SLE living in areas with higher vs. lower percentages of Black individuals had significantly higher odds of hydroxychloroquine nonadherence, suggesting that racial residential segregation may impact this health behavior. (8) In a study among individuals with SLE, living in an area of concentrated poverty amplified the effect of individual-level poverty on SLE-related damage.(9) Neighborhood disadvantage has also been associated with significantly poorer retention in SLE care (10) and worse functional status and faster functional decline in RA. (11) Among individuals with SLE and with RA, exposure to air pollution has been associated with a higher risk of disease flares (12–14), and poorer response to biologic medications.(15) Among patients with osteoarthritis and especially among those undergoing joint arthroplasties, area-level poverty has been associated with racial/ethnic disparities in care utilization patterns and with poorer outcomes.(16, 17) Higher gout severity, as measured by more frequent attacks, has also been associated with higher area-level deprivation and with higher ambient temperatures.(18, 19)
To date, while area-level deprivation and environmental exposures have been shown to be significantly associated with rheumatic disease-related outcomes, there is a scarcity of literature examining neighborhood social and environmental vulnerability. Higher temperatures related to climate change and wildfires have been associated with increased levels of air pollutants (e.g., fine particulate matter), which results in poor outcomes among individuals with pulmonary disease.(20, 21) Exposure to excess heat has been shown to result in increased morbidity among individuals with cardiac or renal disease, and increased mortality among individuals with psychiatric, pulmonary or cardiac disease.(22, 23) Rheumatic conditions alone, particularly among individuals with psychiatric, cardiac, renal, and pulmonary manifestations, may independently heighten vulnerability and may also amplify known vulnerability from comorbid conditions.(24) Since the frequency of extreme heat days is expected to increase(25), delineating the direct impact of heat vulnerability on individuals with rheumatic diseases is needed to minimize avoidable outcomes for the highest risk communities.(24) We therefore aimed to investigate associations between neighborhood social and heat vulnerability with recurrent hospitalizations among individuals with rheumatic conditions. We hypothesized that residing in more vulnerable areas would be associated with significantly higher odds of repeated hospitalizations, especially among individuals from historically marginalized groups.
Patients and Methods
Study Population
Using a centralized clinical data registry (the Mass General Brigham Research Patient Data Registry (RPDR)), we identified adults ≥18 years with ≥1 ICD-9 or 10 code for a systemic rheumatic condition, crystalline arthritis, or osteoarthritis (Supplemental Table 1) who were seen between 1/1/10 and 4/28/21 at a rheumatology practice affiliated with Brigham and Women’s Hospital or Massachusetts General Hospital. We restricted the population to individuals who resided in MA who were seen within three years of 4/28/21 with at least one encounter of any kind (e.g., acute care use, ambulatory care, laboratory visit) each year during this time-period to ensure that they were still engaged within our healthcare system. We defined the index date as the date two years prior to the individuals’ most recent encounter and required ≥1 code for the rheumatic condition to occur in the year prior to the index date (“baseline period”) to ensure that the diagnosis was prior to the index date.
Outcome of Interest
Our primary outcome was hospitalization within our healthcare system during the two years following the index date. As the largest multihospital integrated healthcare system in MA, we expected that most hospitalizations would be captured. To determine the cause of hospitalization, we used the Agency for Healthcare Research and Quality Clinical Classifications Software Refined (CCSR), which can be applied to combine ICD-10 codes for primary discharge diagnoses into clinically interpretable categories.(26) In our main analysis, we excluded hospitalizations due to external causes, injury, pregnancy, congenital malformations, and conditions originating in the perinatal period, based on primary discharge diagnosis ICD-10 codes (O00-O9A, P00-P96, Q00-Q99, S00-T88, V00-Y99) and those with missing or invalid codes. Recurrent hospitalizations for these causes were thought to have a low likelihood of being directly associated with neighborhood vulnerability. We classified hospitalizations as 0, 1–3 and ≥4 during the two-year follow-up period based on the distribution of our data with ≥4 hospitalizations representing the ≥96th percentile of utilization in our population.
Primary Exposures: Area-Level Indices
Social Vulnerability Index (SVI)
The Centers for Disease Control and Prevention/The Agency for Toxic Substances and Disease Registry’s Social Vulnerability Index (SVI) uses publicly available U.S. Census tract level data for 15 variables to characterize how susceptible a neighborhood is to hazardous events, and how readily a community can mobilize to prevent adverse effects.(27, 28) The SVI has four subindices: 1) socioeconomic status, 2) household composition and disability, 3) race/ethnicity/language and 4) housing type and transportation, using U.S. Census and American Community Survey variables. The SVI ranking is divided into quartiles based on national-level metrics and previously published studies (Quartile 1= least vulnerable, Quartile 4=most vulnerable).(29)
Heat Vulnerability Index (HVI)
The Heat Vulnerability Index (HVI) was developed by the Metropolitan Area Planning Council for the Metro Boston area to show how the adverse effects of climate change disproportionately affect certain populations.(30) It encompasses proximity to hazards (heat), socioeconomic, occupational, health and housing conditions that would predispose a population to adverse effects from climate changes, and factors that may influence a population’s ability to respond, adjust and redevelop after climate events.(30) The HVI was developed for neighborhoods in Metro Boston and includes three domains: exposure (extreme heat as measured by land surface temperature), sensitivity (overcrowding in housing units, population in group quarters, age <5 or ≥65, central air conditioning, disability, cardiovascular disease and diabetes prevalence, asthma hospitalization rate, and highly exposed workers), and adaptive capacity (including renter-occupied housing units, mobile housing units, households without a vehicle, households without internet access, educational attainment, unemployment rate, median household income, poverty rate, Latinx, Black Asian, Indigenous, multi or another race populations, age ≥65 and living alone, single-parent families, linguistic isolation, population without health insurance and population living in different residence).(30) The HVI was classified by percentile (higher percentiles=higher heat vulnerability) for the Metro Boston area, as presented by the developers of the index, and categorized as Group 1 (0–20th percentile), Group 2 (>20th-40th percentile), Group 3 (>40th-60th percentile, and Group 4 (>60th percentile, a combined category of >60–80 and >80–100 due to small sample size).(30)
Individual-level Covariates
We used the RPDR to obtain demographic information from the electronic health records (EHR) including age, gender, race (Asian, White, Black or African American, and Other/Unknown), ethnicity (Hispanic, Not Hispanic, and Unknown) and insurance status (Medicaid, Medicare, Commercial). We calculated the Deyo-Charlson Comorbidity Index (DCCI)(31) using ICD-10 codes from the one-year baseline period prior to the index date for 17 weighted comorbidities (Supplemental Table 2). (32)
Statistical Analyses
Geocoding
We utilized ArcGIS Desktop 10.8 to geocode street addresses; individuals with P.O. Boxes, erroneous or missing addresses were excluded (N=654). To ensure HIPAA protections, we downloaded a local ESRI geocoder.(33) A feature class with the geocoded address was added to a shapefile of census tracts in MA. Patients were then assigned to census tracts using the join function based on spatial overlay in ArcGIS. Then SVI and HVI data were determined for each patient based on their census tract ID. (34)
Statistical Analyses
We used multilevel multinomial regression models to examine the relationship between hospitalizations and vulnerability indices. Multilevel modeling enables simultaneous examination of the effects of individual- and area-level variables and accounts for clustering of individuals within areas.(35) This analysis involved two levels: 1) the patients and 2) the census tract where they reside. The outcome in the models was multinomial as hospitalizations were categorized as 0, 1–3 and ≥4 over the two-year period. Each primary model investigating the association between area vulnerability and hospitalizations included one area level index (SVI or HVI) and was adjusted for individual-level covariates (age, gender, race, ethnicity, insurance, and DCCI). Models for HVI used the subset of the cohort with Metro Boston area addresses. We examined models for the SVI subindices and HVI domains to assess whether specific area-level vulnerability factors had stronger associations with recurrent hospitalizations compared to others. We also examined cross-level interactions between race and area vulnerability index to determine whether there were differential effects by race on the association between vulnerability and hospitalizations. Due to sample size, we were unable to examine this by ethnicity.
In additional analyses, we restricted hospitalizations to the warmer months. We chose May-September because a prior study in New England demonstrated that the frequency of days with excessive heat, heavy precipitation, and ozone and fine particulate matter extremes during these months spatially corelated with social vulnerability.(36) We examined separate models for inflammatory arthritis (RA, psoriatic arthritis, ankylosing spondylitis, sacroiliitis, palindromic rheumatism, juvenile idiopathic arthritis), connective tissue disease-CTD (SLE, Sjogren’s, mixed or unspecified connective tissue disease, sarcoidosis, inflammatory myositis), vasculitis, crystalline arthritis (gout and pseudogout) and osteoarthritis. We used multivariable logistic regression models to examine the odds of ≥2 vs. <2 hospitalizations by SVI and HVI in three mutually exclusive subcohorts: 1) systemic rheumatic conditions (inflammatory arthritis, CTD and vasculitis), 2) crystalline arthritis without systemic rheumatic conditions, and 3) osteoarthritis without systemic conditions or crystalline arthritis. We conducted a sensitivity analysis restricting the follow-up time to the most recent year in case individuals had moved. We also examined models that included hospitalizations for all causes, without any diagnosis exclusions. We also examined associations between social vulnerability and hospitalizations in the Metro Boston subpopulation used for the HVI analyses.
This study was approved by the MGB Institutional Review Board. Analyses were performed using SAS Version 9.4 (SAS Institute Inc., Cary, NC).
Results
Among 24,584 patients identified with a rheumatic condition who received care over the past 10 years by a rheumatologist, we identified 14,401 individuals residing in MA with a valid street address who received care within this hospital system for the past three years. Of these individuals, 6,643 were seen by rheumatologists with inflammatory arthritis, 4,806 with a CTD, 2,620 with crystalline arthritis, 1,057 with vasculitis and 6,038 with osteoarthritis (categories were not mutually exclusive). While we required ≥1 rheumatic condition ICD code for inclusion, we found that 97% had ≥2 codes over the three-year period. The mean age was 61.9 (SD 15.7) years, 69.8% were female, 79% White, 7.4% Black, 4.3% Asian and 2.4% Hispanic (Table 1). Over fifty percent were publicly insured (10.5% Medicaid, 44.5% Medicare). The 14,401 individuals resided in 1,314 MA census tracts and 2,701 (18.8%) lived in the most socially vulnerable quartile (Figure 1). Among 10,862 individuals living in the Metro Boston area, 1,268 (11.7%) lived in areas with the highest heat vulnerability (Figure 2). There were 1,184 individuals (11% of 10,862) who resided in areas with both the highest heat and social vulnerability.
Table 1.
Characteristics of individuals with rheumatic conditions (N=14,401) overall and by number of hospitalizations during the follow-up period
| Characteristic | Overall | Hospitalizations (N=8,251) | ||
|---|---|---|---|---|
| 0 | 1–3 | ≥4 | ||
| Age – mean (SD) | 61.9 (15.7) | 60.8 (15.4) | 65.6 (16.0) | 69.2 (14.6) |
| 18–34 years | 896 (6.2) | 772 (6.6) | 107 (5.2) | 17 (2.5) |
| 35–50 years | 2429 (16.9) | 2118 (18.2) | 253 (12.3) | 58 (8.4) |
| >50 years | 11076 (76.9) | 8759 (75.2) | 1703 (82.6) | 614 (89.1) |
| Gender- N (%) | ||||
| Female | 10053 (69.8) | 8196 (70.4) | 1434 (69.5) | 423 (61.4) |
| Male | 4348 (30.2) | 3453 (29.6) | 629 (30.5) | 266 (38.6) |
| Race- N (%) | ||||
| Asian | 615 (4.3) | 526 (4.5) | 67 (3.3) | 22 (3.2) |
| Black | 1062 (7.4) | 764 (6.6) | 207 (10.0) | 91 (13.2) |
| White | 11374 (79.0) | 9289 (79.7) | 1588 (77.0) | 497 (72.1) |
| Other/Unknown/Missing | 1350 (9.4) | 1070 (9.2) | 201 (9.7) | 79 (11.5) |
| Ethnicity - N (%) | ||||
| Hispanic | 351 (2.4) | 289 (2.5) | 47 (2.3) | 15 (2.2) |
| Ethnicity Unknown/Missing | 993 (6.9) | 780 (6.7) | 151 (7.3) | 62 (9.0) |
| Ethnicity Not Hispanic | 13057 (90.7) | 10580 (90.8) | 1865 (90.4) | 612 (88.8) |
| Insurance - N (%) | ||||
| Medicaid | 1506 (10.5) | 1147 (9.9) | 254 (12.3) | 105 (15.2) |
| Medicare | 6411 (44.5) | 4779 (41.0) | 1185 (57.4) | 447 (64.9) |
| Commercial | 6401 (44.5) | 5654 (48.5) | 612 (29.7) | 135 (19.6) |
| Other/Unknown/Missing | 83 (0.6) | 69 (0.6) | 12 (0.6) | 2 (0.3) |
| Deyo-Charlson Comorbidity Index – mean (SD) | 1.7 (2.0) | 1.3 (1.6) | 2.6 (2.5) | 4.4 (3.2) |
| Rheumatic Condition*- N (%) | ||||
| Osteoarthritis | 6038 (41.9) | 4591 (39.4) | 1091 (52.9) | 356 (51.7) |
| Crystalline disease | 2620 (18.2) | 1902 (16.3) | 469 (22.7) | 249 (36.1) |
| Inflammatory Arthritis | 6643 (46.1) | 5495 (47.2) | 900 (43.6) | 248 (36.0) |
| SLE/Connective tissue disease | 4806 (33.4) | 3845 (33.0) | 728 (35.3) | 233 (33.8) |
| Vasculitis | 1057 (7.3) | 789 (6.9) | 182 (8.8) | 77 (11.2) |
| Social Vulnerability Index (SVI)**- N (%) | ||||
| 1st Quartile (lowest=least vulnerable) | 4638 (32.2) | 3910 (33.6) | 579 (28.1) | 149 (21.6) |
| 2nd Quartile | 3878 (26.9) | 3176 (27.3) | 538 (26.1) | 164 (23.8) |
| 3rd Quartile | 3184 (22.1) | 2549 (21.9) | 474 (23.0) | 161 (23.4) |
| 4th Quartile (highest = most vulnerable) | 2701 (18.8) | 2014 (17.3) | 472 (22.9) | 215 (31.2) |
| Heat Vulnerability Index (HVI)#- N (%) | ||||
| Group 1 (lowest=least vulnerable | 2636 (24.3) | 2208 (25.5) | 337 (20.5) | 91 (16.0) |
| Group 2 | 3979 (36.6) | 3210 (37.1) | 584 (35.6) | 185 (32.5) |
| Group 3 | 2979 (27.4) | 2317 (26.8) | 473 (28.8) | 189 (33.2) |
| Group 4 (highest=most vulnerable) | 1268 (11.7) | 916 (10.6) | 248 (15.1) | 104 (18.3) |
Rheumatic conditions are not mutually exclusive categories; Inflammatory arthritis includes rheumatoid arthritis, psoriatic arthritis, juvenile idiopathic arthritis, ankylosing spondylitis, sacroiliitis, palindromic rheumatism; SLE/Connective tissue disease includes systemic lupus erythematosus, systemic sclerosis, Sjogren’s syndrome, mixed connective tissue disease, unspecified connective tissue disease, sarcoidosis, dermatomyositis and polymyositis; Vasculitis includes granulomatosis with polyangiitis, eosinophilic granulomatosis with polyangiitis, microscopic polyangiitis, giant cell arteritis, Behcet’s and other vasculitis; Crystalline arthritis includes gout and pseudogout.
SVI quartiles were determined based on national U.S. census tract-level data
HVI data available for individuals living in the Metro Boston area only (N=10,862). The total number of hospitalizations for this subpopulation was 6,743.
Figure 1.

Social vulnerability index map for Massachusetts (N=14,401)
Figure 2.
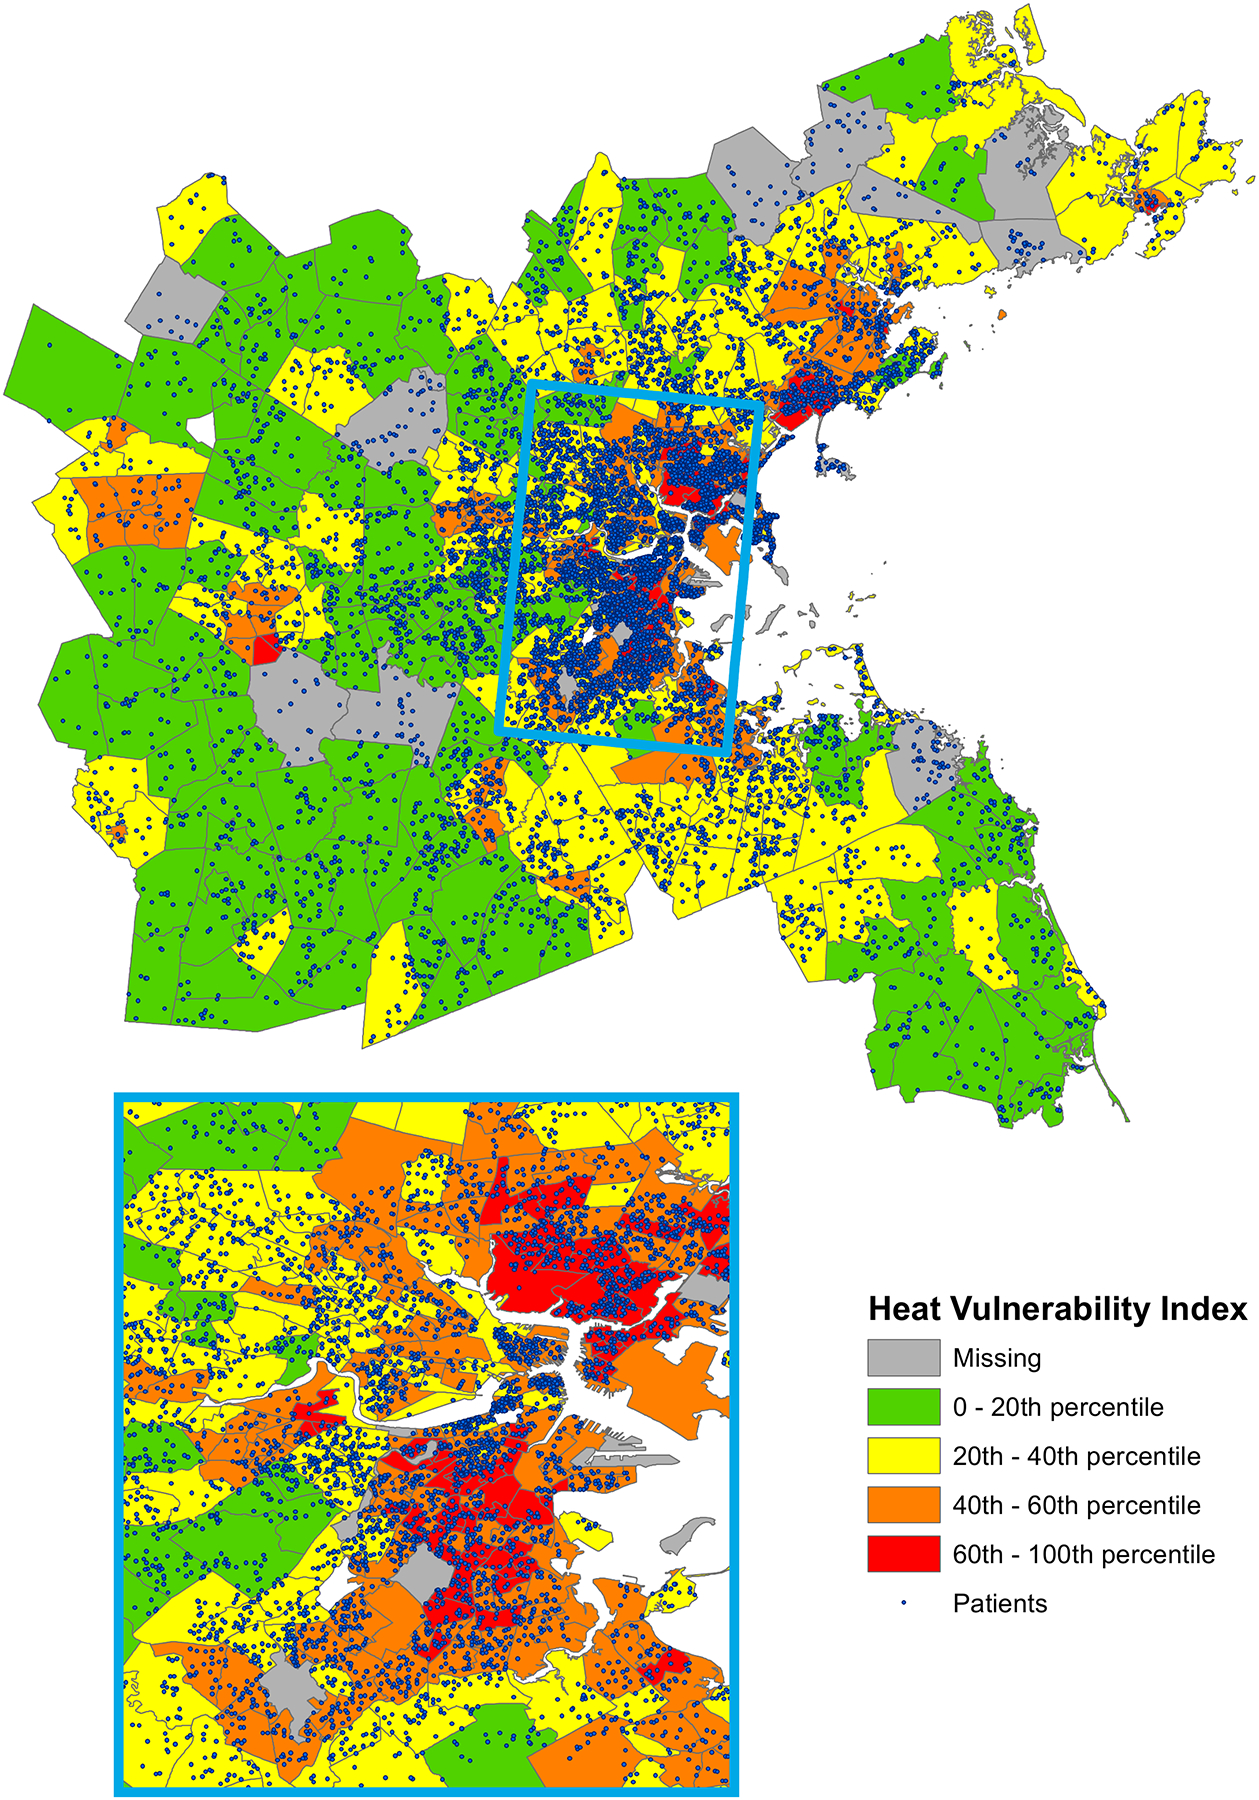
Heat vulnerability index map for the Metro Boston Area (N=10,862)
There were 9,185 total hospitalizations over the two-year follow-up period, including repeated visits, and 8,251 after excluding primary diagnoses for external causes, injury, pregnancy, congenital malformations, and conditions originating in the perinatal period, or missing or invalid codes. Of these, 3,371 hospitalizations occurred in the warmer months (May-September). There were 11,649 individuals (80.9%) with no hospitalizations, 2,063 with 1–3 (14.3%), and 689 with ≥4 (4.8%). Among individuals with systemic rheumatic conditions, 18% had ≥1 hospitalization (incidence rate (IR) 2.62 per 10 person-years). For crystalline arthritis without systemic conditions, 25% had ≥1 hospitalization (IR 3.99 per 10 person-years). For osteoarthritis without systemic or crystalline disease, 21% had ≥1 hospitalization (IR 2.47 per 10 person-years). In warmer months, 12,903 (89.6%) individuals overall had no hospitalizations, 1,261 had 1–3 (8.8%) and 237 had ≥4 (1.7%). The largest percentage of overall hospitalizations was categorized as diseases of the circulatory/cardiovascular system (25%), with other main causes including abnormal laboratory findings and other not classified findings (14%), endocrine, nutritional and metabolic diseases (8%) and diseases of the musculoskeletal system and connective tissue (7%) (Table 2). Patterns of causes of hospitalizations were similar across rheumatic conditions. In multilevel, multinomial models (reference=no hospitalizations), individuals living in areas with the highest social vulnerability had nearly two times higher odds (OR 1.84, 95% CI 1.43–2.36) of ≥4 hospitalizations compared to individuals living in the least vulnerable areas, after adjusting for individual-level demographics, insurance status and the DCCI (Table 3). We observed a dose-dependent association with higher odds of more hospitalizations with higher categories of social vulnerability. At the individual-level, adjusting for area social vulnerability, individuals who were Black (compared to White) had higher odds (OR 1.50, 95% CI 1.14–1.97) of ≥4 hospitalizations. Women compared to men had significantly lower odds of ≥4 hospitalizations (OR 0.64, 95% CI 0.54–0.76). Both Medicaid and Medicare beneficiaries had significantly higher odds of 1–3 and ≥4 hospitalizations compared to individuals who were commercially insured.
Table 2:
Categories of primary discharge diagnosis ICD-10 codes for hospitalizations overall (N=8,251) and during warmer months (N=3,371)
| Discharge Diagnosis Category* - N (%) | All Hospital Discharge Primary Diagnoses | Hospital Discharge Primary Diagnoses During Warmer Months (May-September) |
|---|---|---|
| Diseases of the circulatory/cardiovascular system | 2061 (25.0) | 830 (24.6) |
| Symptoms, signs and abnormal clinical and laboratory findings, not elsewhere classified | 1187 (14.4) | 475 (14.1) |
| Endocrine, nutritional and metabolic diseases | 661 (8.0) | 264 (7.8) |
| Diseases of the musculoskeletal system and connective tissue | 590 (7.2) | 248 (7.4) |
| Diseases of the digestive system | 559 (6.8) | 248 (7.4) |
| Diseases of the respiratory system | 528 (6.4) | 204 (6.1) |
| Diseases of the genitourinary system | 437 (5.3) | 178 (5.3) |
| Infectious and parasitic diseases | 414 (5.0) | 139 (4.1) |
| Neoplasms | 390 (4.7) | 192 (5.7) |
| Diseases of the blood and blood forming organs and disorders involving the immune system | 384 (4.7) | 150 (4.5) |
| Factors influencing health status and contact with health services | 380 (4.6) | 152 (4.5) |
| Diseases of the nervous system | 258 (3.1) | 93 (2.8) |
| Mental, Behavioral and Neurodevelopmental Disorders | 206 (2.5) | 114 (3.4) |
| Diseases of the skin and subcutaneous tissue | 159 (1.9) | 72 (2.1) |
| Diseases of the eye, ear and adnexa | 37 (0.4) | 12 (0.3) |
Clinical classifications defined by the Agency for Healthcare Research and Quality (https://www.hcup-us.ahrq.gov/toolssoftware/ccsr/dxccsr.jsp)
Table 3:
Multilevel multinomial models estimating the odds of hospitalization by individual level factors and census tract level social vulnerability overall and in the warmer months of May through September (N=14,401)
| Variable | Number of Hospitalizations (Ref=0) | Overall Odds Ratio (OR (95% CI)) | Warmer Months OR (95% CI) |
|---|---|---|---|
| Age category (Ref=18-<35 years) | |||
| 35–50 years | 1–3 | 0.84 (0.65, 1.07) | 0.94 (0.68, 1.30) |
| 35–50 years | 4+ | 1.16 (0.66, 2.02) | 2.12 (0.73, 6.22) |
| >50 years | 1–3 | 0.88 (0.71, 1.11) | 1.00 (0.75, 1.35) |
| >50 years | 4+ | 1.53 (0.91, 2.55) | 2.30 (0.83, 6.37) |
| Race (Ref=White) | |||
| Asian | 1–3 | 0.85 (0.65, 1.11) | 0.93 (0.67, 1.29) |
| Asian | 4+ | 0.96 (0.61, 1.51) | 0.99 (0.45, 2.16) |
| Black | 1–3 | 1.32 (1.10, 1.58) | 1.29 (1.04, 1.59) |
| Black | 4+ | 1.50 (1.14, 1.97) | 2.09 (1.39, 3.14) |
| Other/Unknown | 1–3 | 1.15 (0.56, 2.38) | 1.29 (0.53, 3.10) |
| Other/Unknown | 4+ | 1.43 (0.45, 4.57) | 2.06 (0.37, 11.51) |
| Ethnicity (Ref=Non-Hispanic) | |||
| Hispanic | 1–3 | 0.68 (0.32, 1.43) | 0.51 (0.20, 1.29) |
| Hispanic | 4+ | 0.46 (0.13, 1.55) | 0.43 (0.07, 2.74) |
| Unknown/Declined | 1–3 | 0.88 (0.42, 1.84) | 0.71 (0.29, 1.76) |
| Unknown/Declined | 4+ | 0.79 (0.24, 2.61) | 0.70 (0.12, 4.05) |
| Gender (Ref=Male) | |||
| Female | 1–3 | 0.93 (0.84, 1.03) | 0.92 (0.81, 1.04) |
| Female | 4+ | 0.64 (0.54, 0.76) | 0.62 (0.47, 0.81) |
| Insurance (Ref=Commercial) | |||
| Medicaid | 1–3 | 1.65 (1.40, 1.96) | 1.89 (1.54, 2.31) |
| Medicaid | 4+ | 2.45 (1.85, 3.25) | 2.22 (1.42, 3.49) |
| Medicare | 1–3 | 1.78 (1.58, 2.00) | 1.69 (1.46, 1.95) |
| Medicare | 4+ | 2.22 (1.79, 2.74) | 1.89 (1.33, 2.68) |
| Deyo-Charlson Comorbidity Index (DCCI, Ref=at or below mean) | |||
| DCCI | 1–3 | 2.64 (2.39, 2.92) | 3.25 (2.86, 3.69) |
| DCCI | 4+ | 6.74 (5.55, 8.18) | 7.78 (5.48, 11.05) |
| Social Vulnerability Index (Ref=least vulnerable) | |||
| 2 | 1–3 | 1.11 (0.97, 1.26) | 1.08 (0.92, 1.28) |
| 2 | 4+ | 1.29 (1.01, 1.64) | 1.06 (0.70, 1.60) |
| 3 | 1–3 | 1.14 (1.00, 1.31) | 1.26 (1.06, 1.49) |
| 3 | 4+ | 1.43 (1.12, 1.83) | 1.55 (1.04, 2.30) |
| 4 (Most vulnerable) | 1–3 | 1.22 (1.05, 1.42) | 1.31 (1.09, 1.57) |
| 4 (Most vulnerable) | 4+ | 1.84 (1.43, 2.36) | 1.50 (0.99, 2.28) |
Multilevel models account for clustering of individuals by census tract
Bolded values indicate statistically significant findings (p<0.05)
We examined separate models by subindices of the SVI. The strongest associations were found among individuals living in the lowest SES neighborhoods, followed by those living in areas with the greatest percentage of minority individuals and individuals who speak English less than well, and those living in areas with the most crowded housing and poorest access to transportation (Supplemental Table 3a). We did not observe strong associations in areas with more households with older (≥65 years) or younger (<17 years) individuals, individuals with disabilities, or single parent households. In models separated by HVI domain, the strongest associations were seen for adaptive capacity (Supplemental Table 3b).
During the warmer months, trends paralleled those from throughout the year (Table 3). At the area level, we observed higher odds of recurrent hospitalizations (≥4) among individuals living in the most socially vulnerable neighborhoods compared to the least (OR 1.50, 95% CI 0.99–2.28), although this was of borderline statistical significance likely due to fewer outcomes; findings were statistically significant for 1–3 hospitalizations and ≥4 hospitalization for both the third and fourth SVI quartile compared to the first. Individuals with more comorbidities had even higher odds of recurrent hospitalizations during warmer months compared to throughout the year. Black individuals compared to White also had significantly higher odds of recurrent hospitalizations (OR 2.09, 95% CI 1.39–3.14) during warmer months, and this was higher than the odd ratio of recurrent hospitalizations for Black compared to White individuals throughout the year.
Multilevel multinomial models examining heat vulnerability among individuals living in the Metro Boston area (N=10,862), demonstrated that individuals living in areas with the highest heat vulnerability had significantly higher odds of recurrent hospitalizations (OR 1.64, 95% CI 1.17–2.31) comparing ≥4 to no hospitalizations for the most compared to the least vulnerable areas (Table 4). During the warmer months, we observed a trend towards similar findings that was statistically significant for 1–3 hospitalizations vs. none among individuals living in the third and the highest (fourth) categories of heat vulnerability. We observed a similar trend for ≥4 hospitalizations but these results were not statistically significant likely due to fewer outcomes. We additionally examined models with cross-level interaction by race and area vulnerability. Most interaction terms were not statistically significant except for other/unknown race and both SVI and HVI at several levels, but this was uninterpretable given the unknown race category.
Table 4:
Multilevel multinomial models estimating the odds of hospitalization by individual level factors and census tract level heat vulnerability overall and in the warmer months of May through September (N=10,862)
| Variable | Number of Hospitalizations (Ref=0) | Overall Odds Ratio (OR (95% CI)) | Warmer Months OR (95% CI) |
|---|---|---|---|
| Age category (Ref=18-<35 years) | |||
| 35–50 years | 1–3 | 0.85 (0.64, 1.12) | 1.03 (0.71, 1.49) |
| 35–50 years | 4+ | 1.44 (0.73, 2.84) | 3.14 (0.72, 13.75) |
| >50 years | 1–3 | 0.87 (0.68, 1.12) | 1.00 (0.71, 1.39) |
| >50 years | 4+ | 1.84 (0.98, 3.43) | 3.72 (0.90, 15.32) |
| Race (Ref=White) | |||
| Asian | 1–3 | 0.73 (0.55, 0.99) | 0.78 (0.54, 1.12) |
| Asian | 4+ | 0.96 (0.59, 1.55) | 1.09 (0.50, 2.39) |
| Black | 1–3 | 1.27 (1.05, 1.54) | 1.24 (0.99, 1.55) |
| Black | 4+ | 1.67 (1.18, 2.09) | 2.18 (1.43, 3.34) |
| Other/Unknown | 1–3 | 1.26 (0.54, 2.95) | 1.52 (0.56, 4.13) |
| Other/Unknown | 4+ | 1.67 (0.44, 6.25) | 2.53 (0.38, 17.01) |
| Ethnicity (Ref=Non-Hispanic) | |||
| Hispanic | 1–3 | 0.55 (0.23, 1.32) | 0.41 (0.14, 1.18) |
| Hispanic | 4+ | 0.37 (0.09, 1.49) | 0.32 (0.04, 2.51) |
| Unknown/Declined | 1–3 | 0.75 (0.32, 1.81) | 0.61 (0.22, 1.71) |
| Unknown/Declined | 4+ | 0.66 (0.17, 2.57) | 0.55 (0.08, 3.84) |
| Gender (Ref=Male) | |||
| Female | 1–3 | 0.90 (0.80, 1.01) | 0.91 (0.79, 1.05) |
| Female | 4+ | 0.71 (0.59, 0.86) | 0.67 (0.49, 0.90) |
| Insurance (Ref=Commercial) | |||
| Medicaid | 1–3 | 1.64 (1.36, 1.98) | 1.84 (1.46, 2.31) |
| Medicaid | 4+ | 2.90 (2.11, 4.00) | 3.01 (1.80, 5.03) |
| Medicare | 1–3 | 1.77 (1.56, 2.02) | 1.74 (1.47, 2.06) |
| Medicare | 4+ | 2.71 (2.11, 3.47) | 2.41 (1.59, 3.65) |
| Deyo-Charlson Comorbidity Index (DCCI, Ref=at or below mean) | |||
| DCCI | 1–3 | 2.55 (2.28, 2.86) | 3.15 (2.72, 3.63) |
| DCCI | 4+ | 6.42 (5.16, 8.00) | 6.92 (4.69, 10.22) |
| Heat Vulnerability Index (Ref=least vulnerable) | |||
| 2 | 1–3 | 1.10 (0.95, 1.28) | 1.07 (0.89, 1.30) |
| 2 | 4+ | 1.23 (0.93, 1.62) | 1.11 (0.71, 1.73) |
| 3 | 1–3 | 1.13 (0.96, 1.32) | 1.24 (1.02, 1.51) |
| 3 | 4+ | 1.44 (1.08, 1.91) | 1.08 (0.68, 1.73) |
| 4 (Most vulnerable) | 1–3 | 1.35 (1.11, 1.65) | 1.38 (1.08, 1.75) |
| 4 (Most vulnerable) | 4+ | 1.64 (1.17, 2.31) | 1.36 (0.80, 2.33) |
Multilevel models account for clustering of individuals by census tract
Bolded values indicate statistically significant findings (p<0.05)
We also considered the associations between area-level vulnerability and hospitalizations in multilevel multinomial models by rheumatic disease (Supplemental Tables 4 and 5). Due to small sample size, we could not examine vasculitis-only models. For all disease groups, individuals living in areas with the highest vs. the lowest social vulnerability had greater odds of ≥4 hospitalizations (vs. 0). Results were statistically significant for individuals with inflammatory arthritis (OR 1.84, 95% CI 1.23–2.75), crystalline arthritis (OR 1.94, 95% CI 1.24–3.04) and osteoarthritis (OR 2.06, 95% CI 1.44–2.95); the trend was similar for individuals with SLE and other CTD. We did observe significantly greater odds of ≥4 hospitalizations (vs. 0) among individuals with SLE or CTD (OR 1.78, 95% CI 1.01–3.14), and osteoarthritis (OR 1.81, 95% CI 1.23–2.91) living in areas with the highest heat vulnerability compared to the lowest; trends were similar for individuals with inflammatory arthritis and crystalline arthritis. Among individuals with osteoarthritis only, we did not observe statistically significant associations between SVI or HVI and ≥2 vs <2 hospitalizations (Supplemental Table 6). Among individuals with crystalline arthritis, living in the third (OR 1.91, 95% CI 1.24–2.96) or fourth (OR 2.05, 95% CI 1.30–3.22) highest SVI category, and in the highest HVI category (OR 1.99, 95% CI 1.10–3.60) was associated with higher odds of hospitalization. Among individuals with systemic rheumatic conditions, living in the highest SVI area (OR 1.24, 95% CI 1.02–1.51) or in the highest HVI area (OR 1.36, 95% CI 1.05–1.77) was associated with increased odds of hospitalization.
In sensitivity analyses restricted to the most recent year of follow-up, we observed modestly attenuated but parallel findings for SVI and HVI, except for the highest quartile for HVI, which had a similar trend but the association with ≥4 vs. 0 hospitalizations was not statistically significant (Supplemental Table 7). In models that included all-cause hospitalizations, we did not observe meaningful differences. Multinomial models examining the association between the social vulnerability and recurrent hospitalization restricted to the Metro Boston area subpopulation (N=10,862) showed modestly stronger associations between areas with the highest SVI and ≥4 hospitalizations (Supplemental Table 8) compared to findings in the full MA population.
Discussion
In this study, individuals with rheumatic conditions residing in neighborhoods with high social or heat vulnerability had greater odds of recurrent hospitalizations compared to individuals living in areas with lower vulnerability. These findings were statistically significant in multilevel models that accounted for clustering by census tract and for individual-level demographics, insurance, and comorbidities. During warmer months, we observed similar findings among individuals in more socially vulnerable areas, and even higher odds of recurrent hospitalizations among Black compared to White individuals than throughout the year. We did not observe significant differences between recurrent hospitalizations and neighborhood by known race. We observed the strongest associations between the highest levels of heat and social vulnerability and recurrent hospitalizations among individuals with crystalline arthritis and among those with systemic rheumatic conditions. The rates of hospitalization, and percentages of individuals with ≥1 hospitalization in our population were slightly higher than those observed in prior U.S. studies of patients with gout, osteoarthritis, and lupus.(37–39) This may be because all individuals in our cohort received rheumatology care at tertiary, academic medical centers and may have more complex disease or be sicker at baseline than individuals in population-based cohorts.
The U.S. Environmental Protection Agency has stated that while climate change affects all individuals, the risk is amplified among socially vulnerable groups, defined as low income, minority individuals, lower educational attainment, and ages >65 years.(40) The disproportionate impact of climate change on these communities is multifactorial. Due to redlining, Black individuals are more likely to live in racially segregated neighborhoods in areas that are exposed to more extreme and higher temperatures, higher likelihood of flooding, and greater air pollution. (6, 40, 41) Among older individuals, heat-related mortality in urban areas has been linked to impervious land cover, poverty, poor housing conditions, and specifically, lower rates of air conditioning access, which was associated with household poverty and Black and African American race.(42) Other studies have similarly found that Black individuals have significantly poorer access to air conditioning, which is protective against heat stroke and heat-related death, compared to other racial/ethnic groups.(43, 44) While we did not have individual-level data on air conditioning, it is plausible that this contributed to our findings of higher odds of hospitalizations among Black compared to White individuals during warmer months. We found strong associations between the adaptive capacity domain of the HVI and recurrent hospitalizations suggesting that modifiable factors, such as improving internet access, may help reduce adverse effects from extreme heat particularly among historically marginalized groups.
Healthcare utilization patterns have been previously linked with social vulnerability particularly among individuals over age 65.(45) Among individuals with rheumatic conditions, and specifically SLE, area deprivation has been associated with utilization patterns. Among Medicare beneficiaries with SLE, individuals living in areas with higher area deprivation had a modestly higher odds of 30-day hospital readmissions.(46) Area deprivation has also been associated with increased ED utilization for pain among SLE patients.(47) We similarly found a dose-dependent increased odds of recurrent hospitalizations with higher area SVI. In disease-specific models, this was especially pronounced for individuals with inflammatory arthritis, crystalline arthritis, and osteoarthritis.
However, to our knowledge there are no studies that examine the association of heat vulnerability or other climate-related effects on hospitalizations among individuals with rheumatic conditions. Individuals with rheumatic conditions may be especially vulnerability to temperature extremes from their disease, from the medications they take, and from related comorbidities. Extreme heat exposure is associated with hospitalizations for chronic pulmonary, renal, and cardiac disease, organ systems directly involved in many rheumatic conditions, and with higher mortality. (48, 49) We found especially strong associations among individuals with systemic rheumatic conditions and crystalline disease suggesting that pathways independent of comorbidities may also enhance vulnerability. Air pollution has been associated with a higher risk of SLE and RA disease flares (12–14), and reduced response to biologic medications (15) raising the question of whether climate-related changes will have similar effects. Individuals with SLE and RA who live in vulnerable neighborhoods have poorer access to sustained, high quality outpatient care and to their medications at baseline, and climate emergencies will only exacerbate these issues.(24)
Strengths of this study include the use of publicly available census tract-level data to geocode addresses linked to vulnerability indices for a large population of individuals with rheumatic conditions. We were able to utilize a system that protected all personal health information in the geocoding process, all done on a secure network computer with ArcGIS downloaded locally. We examined associations between important neighborhood-level measures of vulnerability, and uniquely, heat vulnerability, using multilevel modeling that accounted for clustering by census tract and allowed for the simultaneous examination of area and individual-level factors.
This study has several limitations. Our focus was on patients receiving rheumatology care at a large medical system in MA and findings may not be generalizable. Heat vulnerability measures were only available for the Metro Boston area, however there was significant variability in this area and the population remained large. We were only able to capture hospitalizations within our multihospital medical system, but we hypothesize that there is unlikely to be enough systematic bias in missing hospitalizations over a two-year period for one area over another that it would change our findings significantly. There is the potential for misclassification of rheumatic conditions. We aimed for high sensitivity, capturing individuals seen in rheumatology clinics with ≥1 code for a rheumatic condition, which may have reduced our specificity. However, 97% had ≥2 codes over the three-year period. Some individuals may have moved during our study period, however national data from this study period suggests that fewer than 10% of individuals in the U.S. moved in a single year.(50) Also, economic mobility in the greater Boston area is slow and declining; only a small percentage of individuals living in more vulnerable areas would be likely to move to significantly less vulnerable areas during this study period.(51) There is also possible misclassification by race and ethnicity as the categories have changed over time in our EHR. While there was significant variation in neighborhood-level vulnerability, 79% our population was White, similar to the overall demographics of MA (81% White).(52) Thresholds for hospitalization may differ by geographic region, which may influence associations between area-level metrics and hospitalizations, however 90% of these hospitalizations occurred at three hospitals located in close proximity to each other. Further studies are needed in other geographic areas, and with more racially and ethnically diverse populations. There is the potential for residual confounding by individual-level factors such as rheumatic disease severity, other comorbidities like depression, and health behaviors such as smoking. However, these factors likely lie on the causal pathway and thus warrant further in-depth study as modifiable targets for intervention rather than as covariates for adjustment. There is also the possibility of reverse causation where individuals who are sicker with higher likelihood of hospitalizations may be forced to move to areas of higher vulnerability.
Overall, we found that individuals with rheumatic conditions, in particular systemic rheumatic diseases and crystalline arthritis, living in areas of high social and heat vulnerability had significantly higher odds of repeat hospitalizations compared to individuals living in areas of lower vulnerability. We observed dose-dependent effects - higher neighborhood social and heat vulnerability was associated with higher odds of recurrent hospitalizations. While we did not observe significant differences by race with respect to area vulnerability, Black individuals compared to White had significantly higher odds of recurrent hospitalizations and this effect was amplified in the warmer months. The effects of our climate emergency will soon be more frequent and severe; it is imperative that we understand which populations of our patients with rheumatic disease are at greatest risk for avoidable adverse events, and the mechanisms that contribute to this heightened risk. Once identified, we can more effectively focus on mitigative and adaptive strategies to implement preventive measures, improve access to sustained high quality healthcare, and advocate for socioeconomic and political change.
Supplementary Material
Supplemental Table 3a: Multilevel multinomial models by components of the area-level social vulnerability index, adjusted for demographic factors, insurance status and comorbidity index
Supplemental Table 3b: Association between health vulnerability domains (adaptive capacity, heat exposure and heat sensitivity) and recurrent hospitalizations
Supplemental Table 4: Odds Ratios (OR) and 95% CI for Social Vulnerability Index in multilevel multinomial models adjusted for demographic factors, insurance and comorbidities, stratified by disease category
Supplemental Table 5: Odds Ratios (OR) and 95% CI for Heat Vulnerability Index in multilevel multinomial models adjusted for demographic factors, insurance and comorbidities, stratified by disease category
Supplemental Table 6: Logistic regression models for the association between SVI and HVI and ≥2 vs. <2 hospitalizations in disease subcohorts
Supplemental Table 7: Multinomial models for association between SVI and HVI restricting hospitalizations to the most recent year
Supplemental Table 8: Multinomial models for association between social vulnerability and recurrent hospitalizations among individuals in the Metro Boston area (N=10,862)
Supplemental Table 1: Rheumatic conditions by ICD-9 and ICD-10 code
Supplemental Table 2: Deyo-Charlson Comorbidity Index (DDCI) ICD-10 Codes
Significance and Innovation.
Social and climate vulnerability can be assessed using publicly available data and linked to geocoded addresses by census tract to assess neighborhood-level risks for individuals with rheumatic conditions.
Residing in areas of high social and heat vulnerability was associated with more than 1.5 times higher odds of recurrent hospitalizations among individuals with rheumatic conditions after adjusting for individual-level demographic factors, insurance status and a comorbidity index.
Associations between social and heat vulnerability and recurrent hospitalizations were strongest among individuals with systemic rheumatic conditions and crystalline arthritis compared to individuals with osteoarthritis laying the groundwork for future studies to investigate mechanisms behind this heightened risk.
A clearer understanding of the impact of environmental factors, especially as they disproportionately affect historically marginalized populations and communities, may allow for adaptive strategies to reduce racial, ethnic, and socioeconomic disparities in rheumatic disease care, utilization patterns and outcomes.
Funding:
This study was funded in part by NIH NIAMS K23 AR071500 (Feldman).
The content of this article is solely the responsibility of the authors and does not necessarily represent the official view of the sources providing funding support to the authors.
Disclosures:
Dr. Feldman serves on the Medical and Scientific Advisory Board of the Lupus Foundation of America and was a member of the American College of Rheumatology Board of Directors (both unpaid positions). She receives research funding from Brigham and Women’s Hospital, the NIH, Pfizer Pharmaceuticals and Bristol Myers Squibb Foundation for work unrelated to the content of this article. She serves as a research consultant on grants to the American College of Rheumatology, the Lupus Foundation of America, and the University of Alabama also for work unrelated to the content of this article. Dr. Costenbader is supported by NIAMS K24 AR066109 and is the chair of the Medical and Scientific Advisory Board of the Lupus Foundation of America (unpaid). Dr. Collins receives research funding from Brigham and Women’s Hospital and the NIH for work unrelated to the content of this article. She serves as a statistical consultant for Boston Imaging Core Labs for work unrelated to the content of this article. Dr. Dellaripa and Ms. Santacroce have no relevant disclosures.
References
- 1.About Social Determinants of Health (SDOH). [cited 2022 March 7, 2022]; Available from: https://www.cdc.gov/socialdeterminants/about.html
- 2.Sheehy AM, Powell WR, Kaiksow FA, Buckingham WR, Bartels CM, Birstler J, et al. Thirty-Day Re-observation, Chronic Re-observation, and Neighborhood Disadvantage. Mayo Clin Proc. 2020;95(12):2644–54. [DOI] [PMC free article] [PubMed] [Google Scholar]
- 3.Jung J, Uejio CK, Kintziger KW, Duclos C, Reid K, Jordan M, et al. Heat illness data strengthens vulnerability maps. BMC Public Health. 2021;21(1):1999. [DOI] [PMC free article] [PubMed] [Google Scholar]
- 4.Bunker A, Wildenhain J, Vandenbergh A, Henschke N, Rocklov J, Hajat S, et al. Effects of Air Temperature on Climate-Sensitive Mortality and Morbidity Outcomes in the Elderly; a Systematic Review and Meta-analysis of Epidemiological Evidence. EBioMedicine. 2016;6:258–68. [DOI] [PMC free article] [PubMed] [Google Scholar]
- 5.Diez Roux AV. Investigating neighborhood and area effects on health. Am J Public Health. 2001;91(11):1783–9. [DOI] [PMC free article] [PubMed] [Google Scholar]
- 6.Hoffman JS, Shandas V, Pendleton N. The Effects of Historical Housing Policies on Resident Exposure to Intra-Urban Heat: A Study of 108 U.S. Urban Areas. Climate. 2020;8(1). [Google Scholar]
- 7.Feldman CH, Hiraki LT, Liu J, Fischer MA, Solomon DH, Alarcon GS, et al. Epidemiology and sociodemographics of systemic lupus erythematosus and lupus nephritis among US adults with Medicaid coverage, 2000–2004. Arthritis Rheum. 2013;65(3):753–63. [DOI] [PMC free article] [PubMed] [Google Scholar]
- 8.Feldman CH, Costenbader KH, Solomon DH, Subramanian SV, Kawachi I. Area-Level Predictors of Medication Nonadherence Among US Medicaid Beneficiaries With Lupus: A Multilevel Study. Arthritis Care Res (Hoboken). 2019;71(7):903–13. [DOI] [PMC free article] [PubMed] [Google Scholar]
- 9.Yelin E, Trupin L, Yazdany J. A Prospective Study of the Impact of Current Poverty, History of Poverty, and Exiting Poverty on Accumulation of Disease Damage in Systemic Lupus Erythematosus. Arthritis Rheumatol. 2017;69(8):1612–22. [DOI] [PMC free article] [PubMed] [Google Scholar]
- 10.Bartels CM, Rosenthal A, Wang X, Ahmad U, Chang I, Ezeh N, et al. Investigating lupus retention in care to inform interventions for disparities reduction: an observational cohort study. Arthritis Res Ther. 2020;22(1):35. [DOI] [PMC free article] [PubMed] [Google Scholar]
- 11.Izadi Z, Li J, Evans M, Hammam N, Katz P, Ogdie A, et al. Socioeconomic Disparities in Functional Status in a National Sample of Patients With Rheumatoid Arthritis. JAMA Netw Open. 2021;4(8):e2119400. [DOI] [PMC free article] [PubMed] [Google Scholar]
- 12.Bernatsky S, Fournier M, Pineau CA, Clarke AE, Vinet E, Smargiassi A. Associations between ambient fine particulate levels and disease activity in patients with systemic lupus erythematosus (SLE). Environ Health Perspect. 2011;119(1):45–9. [DOI] [PMC free article] [PubMed] [Google Scholar]
- 13.Stojan G, Kvit A, Curriero FC, Petri M. A Spatiotemporal Analysis of Organ-Specific Lupus Flares in Relation to Atmospheric Variables and Fine Particulate Matter Pollution. Arthritis Rheumatol. 2020;72(7):1134–42. [DOI] [PMC free article] [PubMed] [Google Scholar]
- 14.Adami G, Viapiana O, Rossini M, Orsolini G, Bertoldo E, Giollo A, et al. Association between environmental air pollution and rheumatoid arthritis flares. Rheumatology (Oxford). 2021;60(10):4591–7. [DOI] [PubMed] [Google Scholar]
- 15.Adami G, Rossini M, Viapiana O, Orsolini G, Bertoldo E, Pontalti M, et al. Environmental Air Pollution Is a Predictor of Poor Response to Biological Drugs in Chronic Inflammatory Arthritides. ACR Open Rheumatol. 2021;3(7):451–6. [DOI] [PMC free article] [PubMed] [Google Scholar]
- 16.Luong ML, Cleveland RJ, Nyrop KA, Callahan LF. Social determinants and osteoarthritis outcomes. Aging health. 2012;8(4):413–37. [DOI] [PMC free article] [PubMed] [Google Scholar]
- 17.Goodman SM, Mehta B, Zhang M, Szymonifka J, Nguyen JT, Lee L, et al. Disparities in Total Hip Arthroplasty Outcomes: Census Tract Data Show Interactions Between Race and Community Deprivation. J Am Acad Orthop Surg. 2018;26(21):e457–e64. [DOI] [PubMed] [Google Scholar]
- 18.Bowen-Davies Z, Muller S, Mallen CD, Hayward RA, Roddy E. Gout Severity, Socioeconomic Status, and Work Absence: A Cross-Sectional Study in Primary Care. Arthritis Care Res (Hoboken). 2018;70(12):1822–8. [DOI] [PubMed] [Google Scholar]
- 19.Neogi T, Chen C, Niu J, Chaisson C, Hunter DJ, Choi H, et al. Relation of temperature and humidity to the risk of recurrent gout attacks. Am J Epidemiol. 2014;180(4):372–7. [DOI] [PMC free article] [PubMed] [Google Scholar]
- 20.Xu R, Yu P, Abramson MJ, Johnston FH, Samet JM, Bell ML, et al. Wildfires, Global Climate Change, and Human Health. N Engl J Med. 2020;383(22):2173–81. [DOI] [PubMed] [Google Scholar]
- 21.Kinney PL. Interactions of Climate Change, Air Pollution, and Human Health. Curr Environ Health Rep. 2018;5(1):179–86. [DOI] [PubMed] [Google Scholar]
- 22.Lee WS, Kim WS, Lim YH, Hong YC. High Temperatures and Kidney Disease Morbidity: A Systematic Review and Meta-analysis. J Prev Med Public Health. 2019;52(1):1–13. [DOI] [PMC free article] [PubMed] [Google Scholar]
- 23.Bouchama A, Dehbi M, Mohamed G, Matthies F, Shoukri M, Menne B. Prognostic factors in heat wave related deaths: a meta-analysis. Arch Intern Med. 2007;167(20):2170–6. [DOI] [PubMed] [Google Scholar]
- 24.Bush T Potential adverse health consequences of climate change related to rheumatic diseases. The Journal of Climate Change and health. 2021;3. [Google Scholar]
- 25.Temperature Extremes. Climate and Health: Centers for Disease Control and Prevention; 2020. [Google Scholar]
- 26.Clinical Classifications Software Refined (CCSR) for ICD-10-CM Diagnoses, Healthcare Cost and Utilization Project. In: Quality AfHRa, editor. Rockville, MD; 2022. [Google Scholar]
- 27.Flanagan BE, Gregory EW, Hallisey EJ, Heitgerd JL, Lewis B. A social vulnerability index for disaster management. J Homel Secur Emerg manag. 2011;8(1). [Google Scholar]
- 28.CDC/ATSDR Social Vulnerability Index. In: Registry AfTSaD, editor. Atlanta, GA; 2022. [Google Scholar]
- 29.An R, Xiang X. Social Vulnerability and Leisure-time Physical Inactivity among US Adults. Am J Health Behav. 2015;39(6):751–60. [DOI] [PubMed] [Google Scholar]
- 30.Climate Vulnerability in Greater Boston. Boston, MA: The Metropolitan Area Planning Council; 2022. [Google Scholar]
- 31.Quan H, Sundararajan V, Halfon P, Fong A, Burnand B, Luthi JC, et al. Coding algorithms for defining comorbidities in ICD-9-CM and ICD-10 administrative data. Med Care. 2005;43(11):1130–9. [DOI] [PubMed] [Google Scholar]
- 32.Ladha KS, Zhao K, Quraishi SA, Kurth T, Eikermann M, Kaafarani HM, et al. The Deyo-Charlson and Elixhauser-van Walraven Comorbidity Indices as predictors of mortality in critically ill patients. BMJ Open. 2015;5(9):e008990. [DOI] [PMC free article] [PubMed] [Google Scholar]
- 33.ESRI Geocoder. Geocoding. Cambridge, MA: Center for Geographic Analysis, Institute for Quantitative Social Science; 2022. [Google Scholar]
- 34.MassGIS Data: 2010 U.S. Census. In: Information BoG, editor. MA: Commonwealth of Massachusetts; 2020. [Google Scholar]
- 35.Diez-Roux AV. Multilevel analysis in public health research. Annu Rev Public Health. 2000;21:171–92. [DOI] [PubMed] [Google Scholar]
- 36.Spangler KR, Manjourides J, Lynch AH, Wellenius GA. Characterizing Spatial Variability of Climate-Relevant Hazards and Vulnerabilities in the New England Region of the United States. Geohealth. 2019;3(4):104–20. [DOI] [PMC free article] [PubMed] [Google Scholar]
- 37.Zleik N, Elfishawi MM, Kvrgic Z, Michet CJ Jr., Crowson CS, Matteson EL, et al. Hospitalization Increases the Risk of Acute Arthritic Flares in Gout: A Population-based Study over 2 Decades. J Rheumatol. 2018;45(8):1188–91. [DOI] [PMC free article] [PubMed] [Google Scholar]
- 38.Murimi-Worstell IB, Lin DH, Kan H, Tierce J, Wang X, Nab H, et al. Healthcare Utilization and Costs of Systemic Lupus Erythematosus by Disease Severity in the United States. J Rheumatol. 2021;48(3):385–93. [DOI] [PubMed] [Google Scholar]
- 39.Dominick KL, Dudley TK, Coffman CJ, Bosworth HB. Comparison of three comorbidity measures for predicting health service use in patients with osteoarthritis. Arthritis Rheum. 2005;53(5):666–72. [DOI] [PubMed] [Google Scholar]
- 40.EPA. Climate Change and Social Vulnerability in the United States: A Focus on Six Impacts: U.S. Environmental Protection Agency; 2021.
- 41.Lane HM, Morello-Frosch R, Marshall JD, Apte JS. Historical Redlining is Associated with Present-Day Air Pollution Disparities in U.S. Cities. Environmental Science and Technology Letters. 2022. [DOI] [PMC free article] [PubMed] [Google Scholar]
- 42.Klein Rosenthal J, Kinney PL, Metzger KB. Intra-urban vulnerability to heat-related mortality in New York City, 1997–2006. Health Place. 2014;30:45–60. [DOI] [PMC free article] [PubMed] [Google Scholar]
- 43.Semenza JC, Rubin CH, Falter KH, Selanikio JD, Flanders WD, Howe HL, et al. Heat-related deaths during the July 1995 heat wave in Chicago. N Engl J Med. 1996;335(2):84–90. [DOI] [PubMed] [Google Scholar]
- 44.O’Neill MS, Zanobetti A, Schwartz J. Disparities by race in heat-related mortality in four US cities: the role of air conditioning prevalence. J Urban Health. 2005;82(2):191–7. [DOI] [PMC free article] [PubMed] [Google Scholar]
- 45.Gronlund CJ, Zanobetti A, Wellenius GA, Schwartz JD, O’Neill MS. Vulnerability to Renal, Heat and Respiratory Hospitalizations During Extreme Heat Among U.S. Elderly. Clim Change. 2016;136(3):631–45. [DOI] [PMC free article] [PubMed] [Google Scholar]
- 46.Bartels CM, Chodara A, Chen Y, Wang X, Powell WR, Shi F, et al. One Quarter of Medicare Hospitalizations in Patients with Systemic Lupus Erythematosus Readmitted within Thirty Days. Semin Arthritis Rheum. 2021;51(2):477–85. [DOI] [PMC free article] [PubMed] [Google Scholar]
- 47.Lee J, Lin J, Suter LG, Fraenkel L. Persistently Frequent Emergency Department Utilization Among Persons With Systemic Lupus Erythematosus. Arthritis Care Res (Hoboken). 2019;71(11):1410–8. [DOI] [PMC free article] [PubMed] [Google Scholar]
- 48.Glaser J, Lemery J, Rajagopalan B, Diaz HF, Garcia-Trabanino R, Taduri G, et al. Climate Change and the Emergent Epidemic of CKD from Heat Stress in Rural Communities: The Case for Heat Stress Nephropathy. Clin J Am Soc Nephrol. 2016;11(8):1472–83. [DOI] [PMC free article] [PubMed] [Google Scholar]
- 49.Remigio RV, Jiang C, Raimann J, Kotanko P, Usvyat L, Maddux FW, et al. Association of Extreme Heat Events With Hospital Admission or Mortality Among Patients With End-Stage Renal Disease. JAMA Netw Open. 2019;2(8):e198904. [DOI] [PMC free article] [PubMed] [Google Scholar]
- 50.Frey WH. For the first time on recrod, fewer than 10% of Americans moved in a year. The Avenue. Washington, DC: The Brookings Institution; 2019. [Google Scholar]
- 51.Schuster L, Ciurczak P. Boston’s Booming…But For Whom? MA; 2019. [Google Scholar]
- 52.Quick Facts: Massachusetts. 2021. [cited 2022; Available from: https://www.census.gov/quickfacts/MA
Associated Data
This section collects any data citations, data availability statements, or supplementary materials included in this article.
Supplementary Materials
Supplemental Table 3a: Multilevel multinomial models by components of the area-level social vulnerability index, adjusted for demographic factors, insurance status and comorbidity index
Supplemental Table 3b: Association between health vulnerability domains (adaptive capacity, heat exposure and heat sensitivity) and recurrent hospitalizations
Supplemental Table 4: Odds Ratios (OR) and 95% CI for Social Vulnerability Index in multilevel multinomial models adjusted for demographic factors, insurance and comorbidities, stratified by disease category
Supplemental Table 5: Odds Ratios (OR) and 95% CI for Heat Vulnerability Index in multilevel multinomial models adjusted for demographic factors, insurance and comorbidities, stratified by disease category
Supplemental Table 6: Logistic regression models for the association between SVI and HVI and ≥2 vs. <2 hospitalizations in disease subcohorts
Supplemental Table 7: Multinomial models for association between SVI and HVI restricting hospitalizations to the most recent year
Supplemental Table 8: Multinomial models for association between social vulnerability and recurrent hospitalizations among individuals in the Metro Boston area (N=10,862)
Supplemental Table 1: Rheumatic conditions by ICD-9 and ICD-10 code
Supplemental Table 2: Deyo-Charlson Comorbidity Index (DDCI) ICD-10 Codes