

Abstract
Canine tooth shape is known to vary with diet and killing behavior in wild animals and the relationship between form and function is driven in part by selective pressure. However, comparative investigation of the domestic dog (Canis lupus familiaris) is of interest. How do they compare to their wild counterparts? This study sought to quantify and characterize the morphology of the canine tooth in the domestic dog, and to provide a preliminary investigation into the variance in canine tooth morphology across individual dogs of varying breeds. Three-dimensional (3D) models generated from micro-computed tomography (μ-CT) studies of 10 mature maxillary canine teeth from the domesticated dog (Canis lupus familiaris) were used to quantify key morphological features and evaluate variance among dogs. Results show that, utilizing modern imaging and model building software, the morphology of the canine tooth can be comprehensively characterized and quantified. Morphological variables such as second moment of area and section modulus (geometrical parameters related to resistance to bending), as well as aspect ratio, ridge sharpness, cusp sharpness and enamel thickness are optimized in biomechanically critical areas of the tooth crown to balance form and function. Tooth diameter, second moment of area, section modulus, cross sectional area, tooth volume and length as well as enamel thickness are highly correlated with body weight. In addition, we found preliminary evidence of morphological variance across individual dogs. Quantification of these features provide insight into the balance of form and function of the canine tooth in wild and domesticated canids. In addition, results suggest that variance between dogs exist in some morphological features and most morphological features are highly correlated with body weight.
Keywords: carnivora, dog, canine tooth, tooth morphology, tooth geometry, elongate teeth, enamel thickness
1. Introduction
The morphology of the carnivoran canine tooth evolved to optimize its function as a tool to apprehend prey. The shape varies widely among the known extinct and extant species of the order Carnivora (Berkovitz & Shellis, 2018a; Pollock et al., 2021). However, in general, it can be described very simply as a rounded to elliptical cone with a high crown aspect ratio (ratio of crown length to base diameter) and a curvature of varying degrees (Berkovitz & Shellis, 2018a; Crofts et al., 2020; Pollock et al., 2021; Soukup et al., 2011, 2015; Van Valkenburgh et al., 1987). Felids generally have a straight canine tooth with a circular transverse cross-section while the canid canine tooth is more curved with a cross-section that is more elliptical (Berkovitz & Shellis, 2018a; Pollock et al., 2021; Van Valkenburgh et al., 1987). The canine tooth of the wolf (Canis lupus) and its subspecies, the domesticated dog (Canis lupus familiaris), being only recently removed (in evolutionary time) from one another, share common macroscopic morphological features with other hypercarnivores: significant curvature (compared to other canids) and cross-sectional ellipticity with a relatively sharp distal ridge (Pollock et al., 2021; Van Valkenburgh et al., 1987). It has been proposed that each of these features provide a specific benefit in the prey apprehension and killing techniques of wild canids (Crofts et al., 2020; Pollock et al., 2021). The curvature may help with the retention of prey, preventing it slipping from the mouth as it attempts to pull away (Frazzetta, 1966; Pollock et al., 2021). The ellipticity may help distribute stress when shearing forces are applied (Goldschmidt et al., 2017). The sharp distal ridge may serve as a ‘blade’ to improve penetration into tissue (Freeman & Lemen, 2006; Popowics & Fortelius, 1997).
Despite our understanding of the basic shape of the canine tooth, a detailed characterization of the surface features, volumetric data and cross-sectional geometry is lacking. Objective data on tooth morphology may improve our framework of the ideal canine tooth shape for carnivoran function; inform computational and analytical modeling of the canine tooth; aid clinicians in clinical decision making; and provide benchwork data that may benefit disciplines from zoology to clinical software engineering.
Efforts to understand the relationship between tooth form and function focus on how tooth morphology influences the balance between the need to penetrate tough materials and avoid fracture (Freeman & Lemen, 2007b). These efforts have suggested an ideal aspect ratio and tip sharpness exists that is based on differences in species diet and is balanced against calculated costs (Evans & Sanson, 1998; Freeman & Lemen, 2006, 2007b). Teeth with high aspect ratio and tip sharpness are ideally suited for deep penetration through hide and muscle with minimal force requirements but are prone to fracture; whereas, blunt teeth with low aspect ratio are more robust (fracture resistant) and better suited to species that kill through head biting but require more penetration force (Pollock et al., 2021; Soukup et al., 2015). However, within these analyses, it is often assumed that the tooth is a circular cone with a uniform aspect ratio (Evans & Sanson, 1998; Freeman & Lemen, 2006, 2007b). Given these assumptions, questions arise as to how the non-uniform shape of the dog canine tooth fits within the ideal shape framework. How do measures of aspect ratio and sharpness in these teeth fit into the trade-off framework established by Freeman and Lemen (2007b)? Quantifying aspect ratio, sharpness and other morphological features would likely contribute to a better understanding of the tooth’s biological function.
Biological function is also defined by mechanical properties of stiffness (deflection under load) and strength (stress at failure). Mechanical behavior in teeth is influenced by geometric properties and loading. The tooth may be simplified as a short composite beam (enamel and dentin) under combined axial and transverse loading. Using an idealization of the tooth as a beam with a uniform cross-section, prior studies used beam theory analysis (BTA) to estimate stress distribution within the canine tooth (P. Christiansen & Adolfssen, 2005; P. E. R. Christiansen, 2007; Freeman & Lemen, 2007a; Pollock et al., 2022; Van Valkenburgh & Ruff, 1987). Using Euler-Bernoulli beam theory, the maximum deflection and normal stress (σmax) within the structure can be calculated according to equations 1 and 2:
| (1) |
| (2) |
where PT = transverse force, PA = axial force, L is the length of the beam, A = cross-sectional area, E = material stiffness, M = the moment at a given cross-section, c = maximum distance from the neutral axis and I = second moment of area. I is a geometric property that describes how the shape of an area is distributed about the neutral axis and reflects the degree to which a structure will deflect when exposed to a bending load (W. Pilkey, 2002). Modeling the canine tooth as an elliptical or circular cone is a common assumption because it simplifies the calculation of I. However, the canine tooth is not axi-symmetric and the cross-sectional geometry is dynamic throughout the length of the tooth (Figure 1).
Figure 1:

μ-CT images of the dog canine tooth crown depicting changes in cross-sectional geometry between the base, mid-crown and tip areas (A). The x-ray attenuation is highest (white) in material that is dense (and stiff). These sections demonstrate the enamel’s high contribution to EI in comparison to the dentin. 3D renderings and axial slice from a μ-CT study (B) depicting the mesial and distal ridges of the dog canine tooth.
In biological structures with complex cross-sections, both I and c will vary based on the cross-section of interest. In the canine tooth, it is unknown if changes in I and c are proportional. If they are not proportional, then minor changes in either I or c could have effects on σmax. Therefore, a cross-sectional geometrical property that quantifies the relationship between I and c [section modulus (S); equation 3], may prove fruitful in understanding stress distribution throughout the length of the tooth. S provides a convenient mechanism for engineers to characterize the bending stress of a material in a single term. Bending stress is directly proportional to S.
| (3) |
Combining equations 2 and 3, equation 4 is provided.
| (4) |
Thus, σmax and S are inversely proportion, therefore, material stress is minimized by maximizing S.
In addition, canine teeth have defined ridges on their mesial and distal aspects (Figure 1). However, their presence or absence and relative position can vary between mammalian carnivore species (Pollock et al., 2021). These ridges contribute to the variance in the cross-sectional geometry of the tooth. Therefore, it is likely that the presence of these ridges would contribute to I, c and S and efforts to characterize and quantify these features could provide insight into the mechanical behavior of teeth under transverse loads.
Enamel thickness informs dietary behaviors (Dumont, 1995; Kay, 1981; Kono, 2004; P. Lucas et al., 2008; Popowics et al., 2001; Shellis et al., 1998). Increased thickness is thought to be a functional adaptation that provides abrasion and fracture resistance in species with a diet consisting of hard objects (Dumont, 1995; Kay, 1981; Kono, 2004; P. Lucas et al., 2008; Popowics et al., 2001; Shellis et al., 1998). While some hominid enamel may be as thick as 2.5 mm, canid enamel is generally understood to be much thinner (<1.0 mm) (Berkovitz & Shellis, 2018b; Crossley, 1995). Tooth enamel dominates the mechanical behavior of the tooth because of its high contributions to both material (E) and geometric (I) stiffness in comparison to dentin (Figure 1) (Soukup et al., 2022). Efforts to report the mean and range of enamel thickness contributes to basic scientific exploration. However, it may be of limited use when considering the relationship between canine tooth form and function. The functional role of enamel may be better appreciated by knowledge of the distribution of enamel thickness over the entire surface of the tooth. As elucidated above, some morphological features of the crown (e.g., cusp, mesial ridge and distal ridge) may influence stress distribution and, in turn, the contribution of enamel thickness along these features may provide an impactful influence especially in downstream biomechanical analyses like finite element analysis.
We propose that the morphology of the canine tooth can be objectively quantified and that better knowledge of the morphology and variance of the canine tooth can better inform scientific endeavors in numerous disciplines. Therefore, the aims of the present study are to 1) quantify and characterize the morphology of the canine tooth in Canis lupus familiaris, and to 2) provide a preliminary investigation into the variance in canine tooth morphology across individual dogs of varying breeds.
2. Materials and Methods
2.1. Sample and Preparation
Ten maxillary canine teeth were extracted, with owner consent, from individual dogs euthanized for reasons unrelated to the study. The teeth selected represented a range of dog breeds including border collie, Labradoodle, Labrador retriever, golden doodle, miniature pinscher, Siberian husky and Vizsla. Individuals were aged between 3.8-15.6 years and ranged in weight between 3.2-43 kilograms (see Table 1 for additional information). Teeth were visually inspected to insure the absence of enamel defects and excessive enamel wear. The teeth were wrapped in HBSS saturated gauze, vacuum sealed and stored at −20° C. Teeth were thawed at ambient temperature for 24 hours prior to submersion in resin (Orthodontic Resin, Hygenic, Akron, OH) to create tooth blocks, which were then allowed to cure for 24 hours. Body weight (BW; kg) of each dog was recorded and verified as being representative of lean body mass with a body condition score of 4-5/9 (Hanford & Linder, 2021).
Table 1:
Breed, age and sex of dogs from which teeth included in the study were obtained. (F = female; M = male; FS = spayed female; MN = neutered male)
| Tooth # | Breed | Age (yrs) | Weight (kg) | Sex |
|---|---|---|---|---|
| 1 | Border collie | 3.8 | 19 | FS |
| 2 | Labradoodle | 11.6 | 34.7 | MN |
| 3 | Labrador retriever | 1.5 | 30 | M |
| 4 | Labrador retriever | 12.4 | 37 | MN |
| 5 | Golden doodle | 7.0 | 37.2 | FS |
| 6 | Miniature pinscher | 15.6 | 3.2 | MN |
| 7 | Siberian husky | 11.1 | 21.8 | FS |
| 8 | Labradoodle | 12.2 | 31.5 | FS |
| 9 | Vizsla | 11.7 | 23.6 | MN |
| 10 | Labrador retriever | 11.5 | 43 | MN |
2.2. μ-CT Acquisition and Reconstruction
Tooth blocks were scanned with a Siemens Inveon μ-CT (Siemens Medical Solutions USA, Inc., Knoxville, TN). All scans were acquired with the following parameters: 80 kVp, 1000 μA current, 850 ms exposure time, 220 rotation steps with 500 projections, medium-high magnification, and binning factor of 2 using a 0.5 mm aluminum filter to reduce beam hardening artifacts. Raw data were reconstructed with filtered back-projection applying the Shepp-Logan filter using the high-speed COBRA reconstruction software (Exxim Computing Corporation, Pleasanton, CA) yielding isotropic voxels of 39.7 μm.
2.3. Image Segmentation and 3D Model Development
Three-dimensional (3D) computer models of the teeth were generated with an interactive medical imaging software (Mimics Innovation Suite, 22.0, Materialise, Leuven, Belgium). DICOM files for each tooth were imported into Mimics. Individual masks of enamel, dentin and pulp were generated via a segmentation procedure using a semi-automated pixel density thresholding process combined with manual refinements, including region-growing, gap-filling, 10-pixel closing and edge refinements (Figure 2A). 3D models of the segmented enamel, dentin and pulp were created. Subsequently, these 3D models were combined into a whole tooth model using a Boolean addition operation (Figure 2B). The tooth crown was then separated from the tooth root using the ‘cut with curve’ 3D tool function along the cemento-enamel junction (CEJ) (Figures 2C-D).
Figure 2:

Images from μ-CT study depicting the segmentation results (A), model building results for the whole tooth (B) and separation of the crown and root models (C-D).
2.4. Tooth Cross-Sectional Geometry
Cross-sectional geometry measurements were made in ImageJ 1.53 NIH software. DICOM files for each tooth were imported into ImageJ and using the slice geometry analysis feature of the BoneJ 1.4.3 plugin, pertinent cross-sectional geometric properties of each μ-CT slice along the long axis of the tooth crown were acquired (Doube et al., 2010). Geometric properties captured were cross-sectional area (CSA), maximum chord length from major axis (R1), maximum chord length from minor axis (R2), second moment of area around minor axis (Imin), second moment of area around major axis (Imax), minimum caliper width (Fmin), and maximum caliper width (Fmax) (Figure 3A; Table 2; Supplemental Table 1). Major (D2) and minor (D1) diameters were used instead of Fmin and Fmax for calculations and analyses (see supplemental materials for further explanation). D1 and D2 were calculated by multiplying R1 and R2 by 2, respectively. For the purposes of calculating section modulus around minor axis (Smin), and section modulus around major axis (Smax), c from equation 3 is represented by R2 and R1, respectively. Cross-sectional ellipticity (CSE) was calculated for each μ-CT slice according to equation 5:
| (5) |
where D2 is the major diameter of the ellipse and D1 is the minor diameter of the ellipse.
Figure 3:

(A) Schematic depicting the relationship between major and minor axes, minor diameter (D1), major diameter (D2), maximum chord length from minor axis (R1), maximum chord length from major axis (R2), minimum caliper width (Fmin) and maximum caliper width (Fmax) as measured by the BoneJ plugin for ImageJ. Note that R1 and R2 (and consequently D1 and D2) are parallel to the major and minor axes, respectively, whereas, Fmax and Fmin are not necessarily parallel to their respective axes. (B) μ-CT images depicting the process of developing the region of interest (ROI) for cusp sharpness and ridge sharpness. (C) Images depicting the development and display of the distal and mesial ridge splines (A) and the measurement of ellipticity of both the mesial and distal ridges. (D) Images depicting the tooth centerline and designated locations for measurement of aspect ratio (AR) and cross-sectional area (CSA). Panel E depicts the CSA measurement locations (green ellipses). SL=standard length.
Table 2:
Geometric properties and descriptions of variables measured in the BoneJ plugin.
| Geometric Property |
Description | Units |
|---|---|---|
| CSA | Cross-sectional area | mm2 |
| R1 | Maximum chord length from major axis (the short hemi-width) | mm |
| R2 | Maximum chord length from minor axis (the long hemi-width) | mm |
| D1 | Minor diameter - maximum chord length from major axis (R1) X 2 | mm |
| D2 | Major diameter - maximum chord length from minor axis (R2) X 2 | mm |
| Imin | Second moment of area around minor axis (the larger I value) | mm4 |
| Imax | Second moment of area around major axis (the smaller I value) | mm4 |
| Smax | Section modulus around major axis (Imax / R1) | mm3 |
| Smin | Section modulus around minor axis (Imin / R2) | mm3 |
| Feret Min (Fmin) | Minimum caliper width | mm |
| Feret Max (Fmax) | Maximum caliper width | mm |
| CSE | Cross-sectional ellipticity (equation 5) | unitless |
Cross-sectional properties are reported from the crown base to the crown tip. DICOM studies were cropped to exclude the tooth root. The tooth crown was defined as all image slices in which enamel was visible 360° around the circumference of the tooth cross-section. The number of image slices comprising the crown was variable between teeth. Therefore, a normalization process was performed wherein each image slice number was converted to a percentage of the total number of slices (0=crown base; 1=crown tip).
2.5. Cusp and Ridge Sharpness
Cusp Sharpness (CS), Mesial Ridge Sharpness (RSM) and Distal Ridge Sharpness (RSD) were calculated according to previously established methods that used scaled measures of cross-sectional area to quantify sharpness (Cleuren et al., 2021; Hocking et al., 2017; Pollock et al., 2021). DICOM files for each tooth were imported into an open source image viewing and analysis software (Horos 3.3.6, Horos Project, Annapolis, MD). For CS, the μ-CT slice representing the median plane in the disto-mesial direction was identified in the coronal viewing window. A reference line was drawn from the pulp tip to the tip of the cusp. For RSM and RSD, the μ-CT slice representing the median plane in the disto-mesial direction was identified in the coronal viewing window. A reference line was drawn from the tooth center to the tip of each ridge. Standard Length (SL) lines, defined by equation 6, were then developed to standardize the area measured.
| (6) |
where the Midsection area (MSA) is the cross-sectional area (from the slice geometry data) of the tooth at 50% of the crown length. The SL lines were ruled inwards, parallel to the aforementioned reference lines. A line was then inserted perpendicular to the SL line. The cross-sectional area bounded by this perpendicular line and the tooth periphery defined a region of interest (ROI) (Figure 3B). The cross-sectional area of the ROI was measured and standardized to variable canine tooth size with final Sharpness, represented by equation 7. Sharp edges were represented by smaller sharpness values, and blunt edges by larger sharpness values.
| (7) |
2.6. Ridge Ellipticity
Ridge ellipticity (RE) was measured using 2D images and 3D models in Mimics. Splines along the mesial and distal ridges of the crown from the cusp to the cementoenamel junction (CEJ) were defined by a manual process of placing points every 0.25-0.5 mm along the ridge length, which were visible in all viewing windows (2D and 3D) (Figure 3C). An ellipse was then fitted to the curvature of each spline. The mesial ridge curves in two planes, thus this procedure was performed in the 3D viewing window (Figure 3C). Since the distal ridge curves in only one plane, the procedure was performed in the 2D axial image viewing window (Figure 3C). Ridge ellipticity (RED for the distal ridge and REM for the mesial ridge) was then quantified according to equation 8:
| (8) |
where D2 is the major diameter of the ellipse and D1 is the minor diameter of the ellipse. This process was repeated two additional times on each tooth ridge to evaluate repeatability.
2.7. Aspect Ratio
Crown aspect ratio (AR) was calculated at four locations through the height of the tooth. A centerline was fit down the vertical axis of the crown model (Figure 3D). The intersection of the crown model and the centerline was marked with a point representing the crown base. The length of the crown along the centerline was then measured from the crown tip to crown base. Three additional points along the centerline were then marked and measured (25% crown length, 50% crown length and 75% crown length) (Figure 3D). AR, which represents the ratio of crown length (L) to diameter (D), was calculated for each of the marked points in the disto-mesial plane and the vestibulo-oral plane using total crown length along the centerline and D1 and D2 (from the BoneJ slice geometry crown base measurements), respectively. The disto-mesial and vestibulo-oral AR values at the crown base were averaged to provide an overall crown AR.
2.8. Cross-Sectional Area
Within Mimics, the crown cross-sectional area (CSA) about the centerline was determined at the same four points used for aspect ratio (Figure 3E). For comparison of methodologies, the CSA at the same locations along the vertical axis of the crown was also acquired from the BoneJ slice geometry crown measurements.
2.9. Volume, Length and Ratios
The volume of the enamel (VOLE), dentin (VOLD), total crown (VOLC) and total root (VOLR) was calculated from the isolated 3D models. In addition, the lengths of the crown (LC) and root (LR) were recorded. The following ratios were then calculated: enamel:tooth volume (VOLE:T), crown:total tooth volume (VOLC:T), root:total tooth volume (VOLR:T), crown:root volume (VOLC:R), crown:root length (LC:R).
2.10. Characterization of Enamel Thickness
Points were marked at dedicated surfaces around the periphery of the tooth at predetermined cross-sections (crown base and 25%, 50%, 75% lengths – same sections as AR and CSA measurements). Dedicated surfaces included mesial surface, vestibular surface, oral surface, mesial ridge surface, distal ridge surface and cusp tip (Figure 4A). All marks were converted to 3D objects by saving as Initial Graphics Exchanges (IGES) files. Standard tessellation (STL) files of the enamel model and all IGES files were exported into 3-Matic 3D modeling software (13.0, Materialise, Leuven, Belgium). A thickness analysis of the enamel was performed using a software algorithm that reports an average wall thickness for each triangular element of the mesh. A color-coded thickness map was produced as a visual representation of the enamel thickness distribution for each tooth (Figure 4B). The first quartile (Q1), median, third quartile (Q3), mean and standard deviation of thickness were recorded for each tooth. A local thickness analysis was also performed: the enamel thickness of the 4-5 mesh elements immediately surrounding each marked surface point was recorded and an average taken (Figure 4C).
Figure 4:

Images depicting the process of measuring enamel thickness. The red dots (A) are the locations on the tooth surface where the enamel thickness was measured. For the purposes of illustration, the coronal half of the crown in panel A has been removed from the model. Panels B-C depict the enamel thickness analysis performed in 3-Matic. The blue dots represent locations where the enamel thickness was measured. The triangular mesh element containing the measurement location can be seen in panel C.
2.11. Statistical Analysis
Data were analyzed to visualize and investigate how aspects of canine geometry varies with crown length. All data visualization, manipulation and statistical analyses were conducted in GraphPad Prism version 9.4.1 for MacOS (GraphPad Software, San Diego, California USA, www.graphpad.com) unless otherwise noted. All tooth cross-sectional geometry measures (except CSE) for all dogs were normalized as a function of body weight (variable/BW) to assess for allometry (Creighton, 1980; Pollock et al., 2021).
2.11.1. Tooth Cross-Sectional Geometry
All tooth cross-sectional geometry measures (except CSE) for all dogs were normalized as a function of body weight (variable/BW) and plotted as a function of crown cross-section from base to tip.
2.11.2. Cusp and Ridge Sharpness
CS, RSM and RSD are reported as mean, median and SD. A mixed effects ANOVA with location as a fixed effect and sample as a random variable was run to compare sharpness values. A post-hoc Tukey multiple comparison test was used to determine significance between locations. A simple linear regression model was performed to assess the effect of BW on sharpness.
2.11.3. Ridge Ellipticity
RE is reported as mean, median and SD. Agreement between repeated distal ridge measurements and between repeated mesial ridge measurements was estimated with intraclass correlation coefficient (ICC; 95% CI) using R for statistical computing v4.0; R Core Team 2021. Differences between RED and REM was analyzed with a paired t test. To assess the effect of BW on ellipticity, a simple linear regression was performed.
2.11.4. Aspect Ratio
Overall crown AR is reported as mean, median and SD. AR for each sample was plotted as a function of crown cross-section from base to the 0.75 length location. A mixed effect ANOVA was used to compare the means at each location. A post-hoc Tukey multiple comparison test was used to determine significance between locations. Differences in mean AR between the disto-mesial and the vestibulo-oral planes at each location were compared with a one-way ANOVA followed by a post hoc Tukey multiple comparison analysis to control for repeated measures.
2.11.5. Cross-Sectional Area
Differences between measurement method (BoneJ vs Mimics) was evaluated with a mixed effects ANOVA controlling for location using R for statistical computing. Subsequent analyses were performed on BoneJ data set. CSA for each sample was normalized to body weight (CSA/BW) and plotted as a function of crown cross-section from base to tip. The area under the curve (AUC) of the plots for CSA/BW, which is akin to a normalized crown volume measurement, for each sample was calculated from the plot. Subsequently, a simple linear regression model was used to assess the effect of BW on the AUC. A mixed effects ANOVA with a post hoc Tukey multiple comparison test was used to compare the means at the base, 0.25, 0.50 and 0.75 length locations.
2.11.6. Volume, Length and Ratios
VOLE, VOLD, VOLC and VOLR, LC, and LR are reported as mean, median and SD. A simple linear regression model to assess the effect of BW on each variable was conducted.
2.11.7. Characterization of Enamel Thickness
A mixed effects ANOVA with a post hoc Tukey multiple comparison test to analyze the interaction of surface/ridge location and length location was conducted using R for statistical computing. Subsequently, an unpaired t test to compare the overall mean enamel thickness between surfaces and ridges was conducted in R for statistical computing. A simple linear regression to analyze the effect of BW on the mean enamel thickness for each sample was conducted.
3. Results
3.1. Tooth Cross-Sectional Geometry
3.1.1. Major (D2) and Minor (D1) Diameter
D2/BW varied substantially (0.3-2.1 at the crown base and 0.14-1.2 at the 0.75 region) (Figure 5B). The variance between teeth at the base (0.3-0.54) and at the 0.75 region (0.14-0.24) diminished when tooth 6 (miniature pinscher; a clear outlier) was excluded. The slope was generally consistent between teeth. However, tooth 1 (Border collie) showed a steep slope around the 0.25 region before leveling off and resembling the other teeth.
Figure 5:

Plots of minor diameter (D1)/BW (A) and major diameter (D2)/BW (B) as a function of crown cross-section location. The upper right inset plot in each panel shows all teeth and the lower left plot excludes tooth 6 (miniature pinscher). Plots of second moment of area around the minor axis (Imin)/BW (C) and second moment of area around the major axis (Imax)/BW (D) as a function of crown cross-section location. A difference in the slope of tooth 6 (miniature pinscher; represented by the purple line), when compared to all other teeth, can be appreciated. Plots of section modulus around the major axis (Smax)/BW (E) and section modulus around the minor axis (Smin)/BW (F) as a function of crown cross-section location. A difference in the slope of tooth 6 (miniature pinscher; represented by the purple line), when compared to all other teeth, can be appreciated. Along the x-axis, the crown base is on the left and the crown tip is on the right for all plots.
D1/BW also had a consistent slope and varied substantially at each location (0.16-1.2 at the crown base and 0.10-.98 at the 0.75 region); variance narrowed (0.16-0.3 at the crown base and 0.10-0.19 at the 0.75 region) when tooth 6 (miniature pinscher) was excluded (Figure 5A).
3.1.2. Second moment of area (Imin; Imax)
Imin and Imax were generally highest in the base 25% of the tooth crown for all tooth samples but varied substantially (Imin=11.5-18.5 mm4/BW; Imax=3.5-7.1 mm4/BW) (Figure 5C and D). The variance decreased from the base to the tip of the tooth. Imin is higher than Imax consistent with the elliptical shape of the tooth throughout most of its length. Tooth 6 remains an exception in that the slope of the curve is generally less steep than other teeth consistent with a more columnar shaped tooth with a high AR.
3.1.3. Section Modulus (Smin; Smax)
Substantial variation in Smin and Smax was observed between tooth samples and as a function of location within individual teeth (Smin=1.91-4.48 mm3/BW and Smax=1.12-2.75 mm3/BW at the base; Smin=0.26-1.24 mm3/BW and Smax=0.20-1.02 mm3/BW at the 0.75 region) (Figure 5E and F). The shape of the curves resembles the curves for Imin and Imax. Tooth 6 remains an outlier with generally large values and slightly different curves.
3.1.4. Cross-Sectional Ellipticity
Variation in CSE was minimal between teeth and gradually transitioned from an elliptical base (~0.8) to a round tip (~0.5). This transition was consistent as evidenced by the consistent slope of the curve (Figure 6). The ability of the software to reliably measure the CSE became less reliable near the tip of the tooth.
Figure 6:

Plot of cross-sectional ellipticity (CSE) as a function of crown cross-section location. The gradual decrease in CSE from crown base to crown tip depicts the dynamic cross-sectional change from an elliptical base to a round tip.
3.2. Cusp and Ridge Sharpness
The distal ridge (mean=13.61; median=13.76; SD=0.96) was sharper than the mesial ridge (mean=16.58; median=16.49; SD=0.82) (p<0.0001) and the cusp (mean=16.02; median=15.96; SD=0.59)(p=0.0007) for all teeth (Figure 7). RSD was more variable than RSM or CS. We found no significant correlation between sharpness and BW for any location (mesial ridge=p>0.3262; distal ridge=p>0.2495; cusp=p>0.0722 ; Supplemental Figure 2).
Figure 7:

Violin plots of distal ridge, mesial ridge and cusp sharpness. Distal and mesial ridge sharpness were significantly different and distal ridge and cusp sharpness were significantly different.
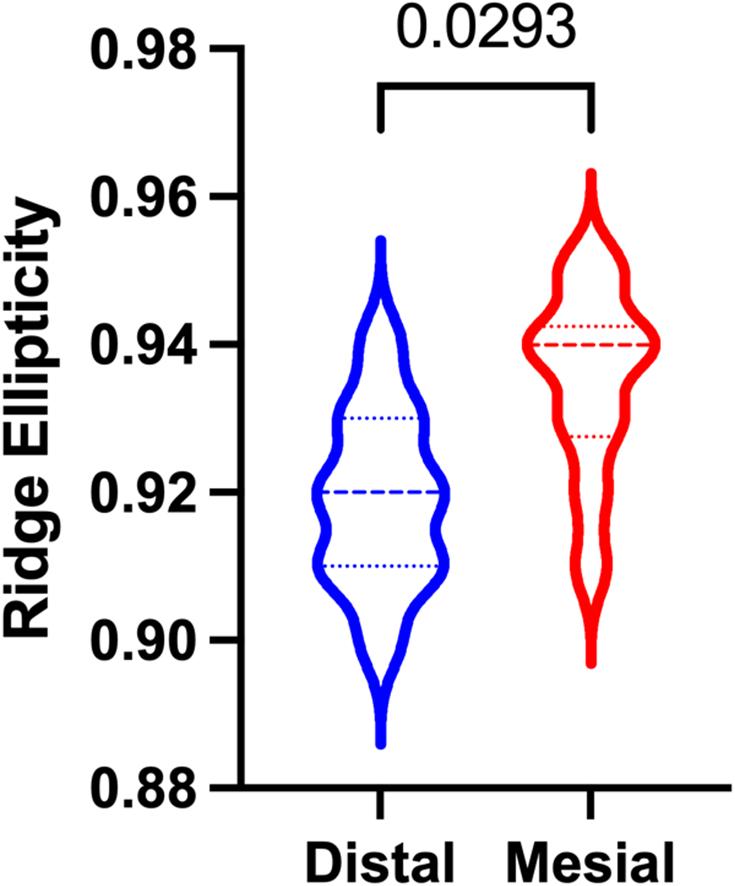
3.3. Ridge Ellipticity
RED was significantly different than REM (p=0.0293) with RED generally lower than REM (Figure 8). RE was not well correlated with BW (R2=0.0571, p>0.5061 and 0.0477, p>0.5440 for distal and mesial ridge, respectively) (Supplemental Figure 3). Agreement between measures of ellipticity for the distal (mean=0.92; median=0.92; SD=0.01) and mesial ridge (mean=0.93; median=0.94; SD=0.01) was moderate and excellent, respectively [ICC=0.61 (95% CI =0.30-0.84) and 0.91 (95% CI=0.79-0.97) for distal and mesial ridge, respectively].
Figure 8:
Violin plots depicting significant differences between distal ridge ellipticity (RED) and mesial ridge ellipticity (REM).
3.4. Aspect Ratio
The overall crown AR mean was 2.26 (median=2.29; SD=0.24). AR increased approximately 2-fold from the base (disto-mesial: mean=1.71; median=1.78; SD=0.2 and vestibulo-oral: mean=2.81; median=2.83; SD=0.3) to the tip (0.75) (disto-mesial: mean=3.77; median=3.82; SD=0.38 and vestibulo-oral: mean=4.64; median=4.74; SD=0.43) (Figure 9) and the differences between all locations were significant (p<0.001). The AR in the disto-mesial plane was significantly lower than in the vestibulo-oral plane at all locations (p<0.0001) (Figure 9).
Figure 9:

Plots of aspect ratio (AR) in the disto-mesial and vestibulo-oral directions as a function of crown cross-section. Violin plots comparing AR in the disto-mesial and vestibulo-oral directions at each location along the length of the crown. AR was significantly different between orientations at all locations.
3.5. Cross-Sectional Area
When controlling for location, methods of CSA measurement (Mimics vs BoneJ) were significantly different from one another (p<0.001) with Mimics values consistently larger (Figure 10A). However, there was a consistent trend between the two methods over the length of the tooth. Subsequent results and analyses were made with data acquired in BoneJ. CSA decreased significantly (Figure 10B) from base to cusp and the slope of the decrease was similar between teeth in the mid-section of the crown (Figure 11). Near the base, a difference in slope can be appreciated. A strong correlation (R2=0.7117, p<0.002) between CSA/BW AUC and BW was present (Supplemental Figure 4). Tooth 6 (miniature pinscher) was visibly different than the other teeth with a normalized CSA that was approximately three times higher than the other teeth throughout the length of the crown. The variability between teeth decreases toward the cusp tip.
Figure 10:

Violin plots comparing cross-sectional area (CSA)/BW measurements with BoneJ and Mimics at each location along the length of the crown (A; *p<0.0001). Results were significantly different between methods when controlling for location. Violin plots comparing CSA/BW (BoneJ) between locations (B; ****p<0.0001, ***p=0.0002, **p=0.0073).
Figure 11:

Plot of cross-sectional area (CSA)/BW (BoneJ) as a function of crown cross-section.
3.6. Volume, Length and Ratios
Tooth 8 (labradoodle) was excluded from all volume and length calculations due to the presence of root resorption. The crown makes up a small portion of the overall tooth volume (VOLC:T = mean 0.27, median 0.25, SD 0.06; VOLC:R = mean 0.39, median 0.34, SD 0.14) and tooth length (LC:R = mean 0.75, median 0.73, SD 0.09) (Figure 12); whereas the root makes up the bulk of the tooth structure (VOLR:T = mean 0.72, median 0.74, SD 0.07). Volume and length measures significantly correlated with BW (VOLC: R2=0.6696; VOLR: R2=0.5859; VOLE: R2=0.7141; VOLD: R2=0.5940; LC: R2=0.7276; LR: R2=0.7861) (Figure 13).
Figure 12:

Violin plots of volume and length ratios. Note a very wide range between teeth for all ratios.
Figure 13:

Linear regression models of crown, root, enamel and dentin volume as well as crown and root length as a function of dog BW showing that all parameters were well correlated with BW.
3.7. Characterization of Enamel Thickness
Enamel thickness (first quartile, median, third quartile, mean and SD) for each individual tooth as well as overall mean median and SD is provided in supplemental table 2. Due to the presence of distal abrasion in the basal ½ of the crown, tooth 1 (Border collie) was excluded from calculation of mean enamel thickness and from the linear regression models. The range of mean enamel thickness for the entire tooth surface was 0.35-0.44 mm (tooth 5 from the golden doodle and tooth 6 from the miniature pinscher, respectively). Visual assessment of enamel thickness for each sample suggest that the enamel is thickest along the distal and mesial ridges and in the coronal half of the tooth (Figure 14). Although the distal ridge, mesial ridge and mesial surface did appear to have thicker enamel (Figure 15), these differences were not significant (p=0.082). However, significant differences in enamel thickness were determined at specific locations. The mesial wall was thicker than the vestibular and oral walls at the 0.25, 0.50 and 0.75 length locations (p<0.001) (Figure 16). The mesial ridge enamel was thicker than the vestibular wall and the oral wall at all length locations (p<0.001) (Figure 16). The mesial ridge was thicker than the distal ridge at only the crown base (p<0.001) (Figure 16). The distal ridge enamel was thicker than the vestibular wall at the 0.25 and 0.50 lengths and was thicker than the oral wall at the 0.25, 0.50 and 0.75 lengths (p<0.001) (Figure 16). Along the lengths of each surface/ridge, the enamel gradually became thicker from base to tip (p<0.001) except between the 0.50 and 0.75 length locations along the distal ridge (Figure 16). There was no significant difference in thickness between the vestibular and oral walls. There was a noticeable drop in enamel thickness from the 0.75 length location and the tip (Figure 16). The difference in enamel thickness between all surface locations (mesial, vestibular and oral walls) was not significantly different than the enamel thickness at all ridge locations (Figure 17). Mean enamel thickness was highly correlated with BW (R2=0.7784, p<0.0037) with enamel becoming thinner with increasing BW (Supplemental Figure 5).
Figure 14:

Images of the distal, vestibular, mesial and oral surfaces of the tooth crown in which an overall visual assessment of enamel thickness can be appreciated. Red = thicker enamel; green = thinner enamel.
Figure 15:

Violin plots of enamel thickness at crown surfaces and ridges. There was no significant difference in mean thickness between these locations.
Figure 16:

Plot of surface and ridge enamel thickness as a function of crown cross-section. For all surfaces and ridges, enamel thickness increases from the base to the tip. a=mesial wall thicker than vestibular wall at noted locations; b=mesial ridge thicker than vestibular wall at noted locations; c=mesial ridge thicker than distal ridge at noted location; d=distal ridge thicker than vestibular wall at noted locations; e=distal ridge thicker than oral wall at noted locations; f=mesial ridge thicker than oral wall at noted locations.
Figure 17:

Box plots comparing all surface measurements (mesial, oral and vestibular) to all ridge measurements (distal and mesial ridges) of enamel thickness.
4.0. Discussion
Utilizing modern imaging and modeling software, we have shown that the morphology and cross-sectional geometry of the canine tooth can be objectively quantified in Canis lupus familiaris, achieving our first aim. Despite the variability in body shape and size of the domesticated dog, we have shown that, for the most part, key features of canine tooth morphology (tooth diameter, second moment of area, section modulus, cross sectional area, tooth volume, crown length and enamel thickness) are preserved and scale with body weight. However, within our small sample size, there was one notable exception (tooth 6 from a miniature pinscher) that exhibited several differences in morphological/geometrical features that will be elaborated upon in the following discussion. By showing differences in D1, D2, Imax, Imin, Smax, Smin and CSA between some teeth, we have also achieved our second aim of providing a preliminary insight into the presence of variance in canine tooth morphology between individual dogs.
The canine tooth is a tool with morphology that reflects the various biomechanical and ecological demands of an animal. This includes biting into foods of specific materials (e.g., skin and muscle have high toughness and are difficult to penetrate), resisting breakage under feeding related loads and even other considerations like sexual or threat displays (Berkovitz & Shellis, 2018b; Crofts et al., 2020; Freeman & Lemen, 2007b; P. W. Lucas, 2004; Van Valkenburgh et al., 1987). Given the inability of mammalian teeth to self-repair or be replaced, one would expect the ratio of the load that causes it to fail relative to the load it is expected to encounter (i.e., safety factor) to be high. However, one study of wild canids suggested teeth possess a relatively low safety factor when compared to biomaterials that can regenerate (i.e., bone) (Van Valkenburgh, 1988). We have proposed that a comprehensive analysis of the macroscale level morphological and cross-sectional geometric features may provide insight into why this may be true despite the importance of the tooth lasting a lifetime.
4.1. Tooth Cross-Sectional Geometry
4.1.1. Major (D2) and Minor (D1) Diameter
While some studies have evaluated cross-sectional features of teeth at pre-determined points along the length of the tooth (P. E. R. Christiansen, 2007; Evans et al., 2021), we have built upon these studies by evaluating slice-by-slice measurements, thus, creating a more detailed picture of tooth crown cross-sectional geometry. In doing so, we were able to describe how key parameters change throughout the length of the crown and how they compare between different dogs.
Changes in tooth diameter (D1 and D2) as a function of crown cross section resembled a linear relationship. This is consistent with correlations between tooth radius and tooth length found in several vertebrates including Amphibia, Aves, Chondrichthyes, Dinosauria, Mammalia, Osteichthyes and Reptilia (Evans et al., 2021). D1 and D2 throughout the length of the crown was very similar when comparing between teeth. In addition, D1 and D2 decreased from base to crown at a consistent rate. While these parameters scaled well to BW, there remains quite a bit of variance in D1 and D2 between teeth at the crown base.
One tooth from a 3.2 kg dog (tooth 6 from a miniature pinscher) was a consistent outlier and had values that were much higher than the other dogs. This may suggest that overall tooth size is proportionally higher in small dogs compared to large dogs. Two previous studies support this assertion (Gioso et al., 2001; Scherer et al., 2019). The ratio of the mandibular height to the mandibular molar height is significantly inversely correlated with BW (Gioso et al., 2001). In addition, the mandibular molar and mandibular canine tooth volume is proportionally larger in smaller dogs compared to larger dogs (Scherer et al., 2019). A larger sample size would be necessary to fully investigate this possibility for the maxillary canine tooth.
The D2/BW plot of tooth 1 (Border collie) had a slightly different slope in the middle ½ of the tooth crown compared to the other teeth. D2, which is the diameter between the mesial and distal walls of the tooth, decreased quite suddenly in this region. This is consistent with abrasion along the distal ridge that was noted in this tooth. Distal ridge abrasion is a common occurrence in the teeth of domesticated dogs and can create a stress riser leading to tooth fracture (le Brech et al., 1997).
4.1.2. Second moment of area (Imin and Imax) and Section Modulus (Smin and Smax)
Within the limits of this study, we have shown that the dog canine tooth has geometrical features that resembles a structural steel I-beam, a structure that epitomizes a cross-section in which second moment of area is maximized to resist bending deflection and reduce stress (increase resistance to fracture) (W. Pilkey, 2002). Imin represents the distribution of the tooth cross-sectional area about the minor/minimum diameter (D1). Imax on the other hand represents the distribution bout the major/maximum diameter (D2). Given the elliptical shape of the tooth, most of the cross-sectional area at the base of the tooth is distributed away from the D1 rather than the D2 and Imin values are higher than Imax. As we approach the crown tip, where the cross-sectional area becomes more circular, Imin and Imax values approach equivalency.
The tooth anchored to the jaw has often been modeled as a cantilevered beam (Freeman & Lemen, 2007a; Van Valkenburgh et al., 1987). The canid canine tooth is used in a slashing and pulling motion directed at the flanks of prey in an attempt to pull it down (Mech et al., 2015; Van Valkenburgh et al., 1987). In this behavior, the primary load is delivered in an oblique fashion from distal to mesial (Goldschmidt et al., 2016, 2017). Thus, to maximize resistance to the resulting bending moment when forces are delivered in this direction, Imin should be as high as biologically possible. Our previous work showing that fracture resistance to oblique forces delivered from the distal surface (i.e., pulling force) are higher than from other directions would support the findings of the present study (Goldschmidt et al., 2016). In addition, recent BTA and FEA analysis of canine teeth in mammalian carnivores revealed lower stress when pulling forces are applied compared to shaking (i.e., lateral) forces (Pollock et al., 2022).
Evolutionary pressures to optimize Imin in canids has resulted in an elliptical cross-section at the base. As discussed below, an elliptical cross-section at the tip would counteract another key role of the canine tooth; puncturing tough materials. Thus, Imin and Imax approach similar values (rounder cross-section) nearer the crown tip to meet that need (Crofts et al., 2020; Freeman & Lemen, 2007b; Freeman & Weins, 1997; Pollock et al., 2021). The presence of the mesial ridge adds cross-sectional area at the periphery of an otherwise elliptical cross-section and likely contributes to optimizing Imin.
Again, tooth 6 (miniature pinscher) is an outlier. In this tooth, the values of Imin and Imax converge upon one another sooner. This is consistent with the less elliptical cross-section (compared to other teeth) that the D1 and D2 values suggest. This tooth was from a 3.2 kg miniature Pinscher and the reason for this more rounded cross-section is likely due to selective breeding practices.
While one of our motivations was to quantify the overall shape of the tooth and develop a means to compare between teeth, the Imin and Imax values for each tooth at each location may also be of some benefit. Modelling the canine tooth as a cantilevered beam has its limitations. Nevertheless, insight into tooth strength can still be gained (Freeman & Lemen, 2007a; Van Valkenburgh et al., 1987). Attempts to use BTA has necessarily simplified calculation of Imin and Imax by limiting interest to the base of the tooth and idealizing the canine tooth as an elliptical cone (Van Valkenburgh et al., 1987). By providing a means to provide an accurate calculation of Imin and Imax at any point along the crown length, the results of this study may help future investigators improve the accuracy of BTA to tooth mechanics.
Section modulus is a parameter that characterizes the bending stress of a structures cross-section into a single term. A material with a higher section modulus will be more resistant to bending deflection and can withstand higher bending moments with an equivalent rise in bending stress. In addition, maximizing S leads to a reduction in material stress and therefore an increase in strength. Our results have shown that S distribution along the length of the crown largely correlates with I. Thus, it appears that changes in I and c are proportional.
4.1.3. Cross-Sectional Ellipticity
CSE ranged from approximately 0.8 (more elliptical) at the crown base to 0.6 (rounder) near the crown tip. While the round nature of the crown tip is a more optimal shape for puncturing tough materials (Crofts et al., 2020; Evans & Sanson, 1998; Freeman & Lemen, 2007b; Freeman & Weins, 1997; Pollock et al., 2021; Schofield et al., 2016), the elliptical nature of the crown base is a more optimal shape to resist deflection (Crofts et al., 2020; Freeman & Lemen, 2007a; Pollock et al., 2021; Van Valkenburgh et al., 1987). By maximizing cross-sectional area away from the center axis, elliptical cross-sections have higher I. During killing behavior, canids exhibit a biting/pulling motion that places significant load in the disto-mesial plane (Goldschmidt et al., 2017; Pollock et al., 2021). The ellipticity being oriented in this same plane optimizes the tooths ability to resist loads in this plane (Goldschmidt et al., 2017; Pollock et al., 2021). The orientation of the ellipse would also suggest that forces in the orthogonal (vestibulo-oral) plane during killing behavior are comparatively smaller (Pollock et al., 2021). Felids, on the other hand have a rounder cross-section throughout the entire length of the crown when compared to canids (Berkovitz & Shellis, 2018a; Crofts et al., 2020; Pollock et al., 2021). This is in fitting with their killing behavior in which the canine teeth deeply puncture the nape of their prey (Pollock et al., 2021). As such, felid canine teeth are not subjected to the same high loads in the disto-mesial plane (Pollock et al., 2021).
4.2. Cusp and Ridge Sharpness
Cusp sharpness ranged between 15.21-17, which is in the range of values previously reported (12.4-17.7) (Pollock et al., 2021). In a recent study of mammalian carnivores, the sharpest canine teeth were found in wild felids (meat and meat/bone diets), whereas the bluntest canine teeth were found in species that have a more generalist diet (i.e., omnivores) such as honey badgers and mongoose (Pollock et al., 2021). The carnivoran canine tooth must possess a sharp enough point to easily puncture tough materials (skin, muscle) while at the same time be robust enough to avoid fracture (Crofts et al., 2020; Freeman & Lemen, 2007b; Lawn, Chai, et al., 2013; Pollock et al., 2021). This balance between sharpness and robustness is dependent on the killing behavior of the animal and the material properties of the prey. Wild felids are generally considered throat killers that deliver a lethal bite to the neck (Berkovitz & Shellis, 2018a; Pollock et al., 2021). As such, they require sharp canine teeth that can penetrate deeply and, because of the more circular cross-section of the canine tooth base, do not require additional features that protect from lateral forces (Pollock et al., 2021).
The force required to penetrate materials is correlated with cusp sharpness. As sharpness decreases, the force required to penetrate increases (Freeman & Lemen, 2007b; Freeman & Weins, 1997). This is because sharper materials concentrate force in a smaller area, which in turn increases the stress in the area (i.e., stress concentration). However, decreasing the area of contact also reduces robustness. To prevent fracture, there is a limit to how sharp a tooth can be. The trade-off between sharpness and robustness leads to the possibility of an optimal canine tooth shape with an ideal sharpness and ideal aspect ratio (Freeman & Lemen, 2007b). For any given aspect ratio, sharpness can be expressed as a taper parameter (ε) between 0-1 with 1 representing a perfectly sharp object (i.e., a straight-sided cone) (Freeman & Lemen, 2007b). The force required to penetrate animal hide in an idealized canine tooth increases dramatically at ε<0.5 (Freeman & Lemen, 2007b). However, stress in the crown tip increases as ε approaches 1 (Freeman & Lemen, 2007b). The ideal balance between sharpness and cost (high stress) in an idealized canine tooth occurred with ε=0.55 (Freeman & Lemen, 2007b). In wild felid teeth, when cross-sections are similar to an idealized canine tooth, ε approximates the ideal balance of 0.55 (Freeman & Lemen, 2007b). While a direct comparison between sharpness values used in that study (ε) with the methodology in the present study is not possible, visual assessment suggests that the cusp of the dog canine tooth would have an ε value of approximately 0.5. We must also bear in mind that the optimal balance of sharpness and robustness as defined by Freeman and Lemen is specific to felid canine teeth and specific prey material (i.e., pig and deer hide) and the optimal balance will likely differ for other taxonomic groups (canids, bears, etc.) and may be influenced by prey material.
Distal ridge sharpness ranged between 11.99-14.83, which is in the low- to mid-range reported in mammalian carnivores (10.6-21.4) (Pollock et al., 2021). The functional purpose of the distal (posterior) ridge of the canine tooth has been a topic exploration (Freeman & Lemen, 2006; Pollock et al., 2021). It is generally accepted that the addition of sharp edges (or “blades”) to the shank of the tooth concentrates energy for efficient crack propagation in tough (i.e., resistant to crack propagation) materials such as animal hide (Freeman & Lemen, 2006). The addition of an edged shank to a model canine tooth resulted in significant decrease in force to penetrate tough materials (leather, chicken, turkey skin, etc.) compared to a model tooth without a sharp edge (Freeman & Lemen, 2006). The sharpness of the distal ridge has also been shown to be associated with killing method with throat killers (wild felids) having the sharpest distal ridge (Pollock et al., 2021). This feature would help with deep penetration of the canine teeth. For those species that kill with head bites (wolverine, mongoose, etc.) where tooth robustness is favored over sharpness, the distal ridge is comparatively dull (Pollock et al., 2021). The RSD of the domestic dog compares closely with mammalian carnivores, including Canis lupus, that use a tear killing technique in which the canine teeth are used to deliver targeted bites or tear at the flanks/abdomen of their prey (Pollock et al., 2021).
The mesial ridge of the dog canine tooth is a unique, almost exaggerated, feature that is not prevalent in many other species nor is clearly discussed in the literature. Although the location of this ridge is between the mesial and oral surfaces of the tooth, we have referred to this unique ridge as the mesial ridge because it is located more toward the mesial than the oral surface. However, it curves in two dimensions. As such, at the crown base, it is slightly more oral. As it travels up the crown length, it curves mesially and laterally. Compared to the distal ridge, the mesial ridge is relatively blunt and compares with the typical edge sharpness of head biters (Pollock et al., 2021). This would suggest that the mesial ridge, in addition to the possibility of aiding in penetration and crack propagation (Freeman, 1992), may have other biological functions. The mesial ridge is more exaggerated in the bottom half of the canine tooth. In this peripheral location, it may serve to maximize the proportion of the cross-section located away from the centroid. Thus, it would serve to increase I and as a result decrease σmax. Tooth bending strength is directly proportional to I (Van Valkenburgh et al., 1987). Thus, the mesial ridge may provide lateral (buttressing) support to the tooth. Looking at wolf killing behavior as inspiration, we suggest that the mesial ridge may improve fracture resistance when exposed to sudden lateral movements of prey or during head shaking killing behavior.
4.3. Ridge Ellipticity
Curvature is an important morphological feature that has been postulated as contributing to the function of the canine tooth (Crofts et al., 2020; King, 1983; Pollock et al., 2021). However, quantification of curvature has not been extensively explored. In a recent study, Pollock et. al. (Pollock et al., 2021) applied three-dimensional geometric morphometric analyses to capture aspects of canine shape including curvature. Relationships were observed between tooth curvature and species as well as killing behavior.
The method employed here to measure tooth curvature is a novel approach in which the ellipticity of the distal and mesial ridges are used as measures of curvature. Given the novelty of the method, it is difficult to compare the degree of canine tooth curvature to previously published results. High ellipticity values (0.9) would equate to relatively low curvature, whereas low ellipticity values (0.5) would equate to comparatively higher curvature (Supplemental Figure 6). We found the method to be highly repeatable and conclude that it is a good representation of curvature that is not technically demanding. In addition, this method enables researchers to capture multiple values of curvature per tooth and look for nuanced differences, whereas previous efforts only captured a single value per tooth (Pollock et al., 2021).
Straight canines are generally found in species that regularly bite into hard objects (head biters) and nape throat killers (felids) (Pollock et al., 2021). When biting, the direction of force in straight teeth is parallel to the long axis of the tooth, which results in more even stress distribution around the central axis (Frazzetta, 1966; Pollock et al., 2021, 2022). The highest curvature is found in the shake tear and shake toss killers [red fox (Vulpes vulpes), coyote (Canis latrans), jackal (Canis mesomelas), and civet (Viverra zibetha)] in which prey are torn, shaken or tossed until dead (Pollock et al., 2021). It has been suggested that the curvature may help with the retention of prey. When the canine tooth is embedded, high curvature will prevent prey from slipping out of the mouth as it attempts to pull away (Pollock et al., 2021). However, when biting in highly curved canine teeth, stress is not evenly distributed around the central axis of the tooth, which may lead to an increase in fracture risk (Pollock et al., 2021, 2022). Larger canids (wolf and dog) have intermediate curvature which may allow them to balance tooth robustness with the need to kill by several different methods (shake toss, shake tear, tear/exsanguination).
4.4. Aspect Ratio
The higher AR in the coronal half of the crown equates to a more columnar structure that, combined with the cusp sharpness, is optimized as a piercing tool for quick penetration. In the cervical half of the crown the AR is lower creating a more box-like structure that is optimized for robustness/strength. In carnivores, tooth elongation (higher AR) helps prevents vertical fractures when exposed to axial loads (Barani et al., 2012). However, this benefit appears to taper off when AR>2. While tooth elongation decreases risk of vertical fracture, it increases the risk of transverse fractures (Freeman & Lemen, 2007a; Lawn, Bush, et al., 2013; Lawn, Chai, et al., 2013). The “ideal” AR of the felid canine tooth has been reported to be 2.5 (Freeman & Lemen, 2007b). AR values greater than 2.5 increase the theoretical risk of fracture and unnecessarily increase energy expenditure during odontogenesis (Freeman & Lemen, 2007b). Thus, it appears there may be a goldilocks zone between of 2>AR>2.5 that optimizes the balance between the functional requirements of deflection/fracture resistance, robustness and puncturing ability. This theoretical optimal AR is consistent with the mean overall AR of 2.26 reported here. Due to the elliptical cross-section of the dog canine tooth, whole tooth AR measurements were lower (mean 1.71) in the disto-mesial plane and higher (mean 2.81) in the vestibulo-oral plane. Ellipticity seems to be another functional adaptation to killing behavior that helps resist deflection in the disto-mesial plane.
4.5. Cross-Sectional Area, Volume, Length and Ratio
Unsurprisingly, given the non-uniform shape of the canine tooth, the CSA varied significantly between the base of the tip of the crown. Variation that was seen between dogs decreased when normalized to BW. However, normalization did not completely remove the variation and a clear pattern of decreased CSA with increasing body weight was visible. To better visualize this correlation, CSA/BW AUC for each tooth was calculated and plotted against BW. In a sense, CSA/BW AUC represents tooth volume. Considered in this sense, our results suggest that relative tooth size is inversely correlated with BW; as BW increases, relative tooth size, decreases. This is consistent with previous reports showing a similar phenomenon at the mandibular first molar tooth in dogs (Gioso et al., 2001; Scherer et al., 2019). A larger study evaluating the correlation is warranted. Figure 11 show that tooth 6 (miniature pinscher) stands out from the others. This was from a 3.2 kg miniature pinscher and was substantially smaller from the other dogs in the study. However, after removal of this tooth from the correlation analysis the correlation between area and BW remained unchanged and high.
We measured CSA in two ways. BoneJ measurements are based on μ-CT slices, which are at regular intervals perpendicular to the vertical axis of the tooth. On the other hand, Mimics measurements are performed perpendicular to a fitted tooth centerline that is dynamic (i.e., follows the curvature of the crown) and not necessarily parallel with the same vertical axis of the μ-CT study. Therefore, at any given point along the centerline, the plane in which the CSA is calculated in Mimics is at variable angles to the vertical axis. The Mimics method may provide a more accurate representation of cross-sectional area as it pertains to BTA (i.e., it accounts for tooth curvature). However, visual assessment of the area being evaluated within the software revealed a consistent overestimate of CSA. On the other hand, while the BoneJ method may not always measure CSA perpendicular to the true centerline of the tooth (i.e., not accounting for tooth curvature), it was determined to be a more accurate representation of the cross-sectional area at each individual measurement location.
Volume and length ratios varied minimally between teeth. Tooth 6 was again quite different than other teeth with a higher VOLC:R, VOLE:T, VOLC:T and LC:R. This is evidence that the tooth had a larger crown relative to the root when compared to all other teeth. All measured parameters had high correlation with BW with the highest correlations in crown and root length. This is consistent with reports of canine crown length in mammalian carnivores showing an allometric relationship with body size (Pollock et al., 2021). This allometric relationship is also reported between various measures of crown size and equally variable measures of body size in many mammalian species (Creighton, 1980; Gingerich et al., 1982; Van Valkenburgh et al., 1987). However, this scaling effect is not true for all species of mammals (Copes & Schwartz, 2010). To the authors knowledge this is the first report to show possible allometric relationships between measures of tooth size and BW in the domestic dog. It would be of interest to investigate allometry across numerous dog breeds in a larger prospective study.
4.6. Enamel Thickness
To the author’s knowledge, this is the first study to provide a comprehensive report of the enamel thickness in the dog canine tooth. Individual canine tooth mean enamel thickness was previously reported to most often be less that 0.3 mm in the dog (Crossley, 1995). However, the methods were not clear and measurements seem to have been taken in only a few locations and not necessarily consistent between teeth (Crossley, 1995). Considering only the mean enamel thickness of the entire crown, our results (range of means 0.35-0.44 mm) are consistent with this previous report. Efforts to report mean enamel thickness for the entire tooth surface is of limited use when considering the relationship between form and function. Knowledge of the distribution of enamel thickness over the entire surface of the tooth provides a better understanding of the functional role of enamel (Berkovitz & Shellis, 2018b). To that end, we have reported enamel thickness at key surfaces along the length of the crown and the tip. We noted a drop in enamel thickness at the crown tip. We suspect this may be an artifact due to dental wear from functional use and that the enamel in this region may be thicker immediately after completion of odontogenesis. However, further investigation is needed to investigate this. Our results show that median enamel thickness as a function of differing surfaces (i.e., mesial surface vs oral surface) and as a function of all surface locations vs ridge locations was always higher than 0.4 mm. The enamel thickness was highly variable with regions near the CEJ being quite thin (~0.05-0.15 mm) and regions near the cusp up to 7x thicker (~0.4-0.72 mm). Our results also show that the enamel is thickest along the distal and mesial ridges; in the coronal half of the tooth; and along the buccal wall. These locations likely correspond with areas that are more susceptible to abrasive wear (Kono, 2004; P. W. Lucas, 2004; Shellis et al., 1998). The enamel thickness in the occlusal region of more herbivorous animals and primates, including ancient and modern hominids, where dietary habits require grinding of foodstuffs, approaches 2-4 mm (Crossley, 1995). It is in these regions where heavy occlusal loads are encountered and abrasive wear is likely to occur (Berkovitz & Shellis, 2018b; Kono, 2004; P. Lucas et al., 2008; P. W. Lucas, 2004; Shellis et al., 1998). On the other hand, studies have shown that the enamel of extinct and modern pinnipeds (seals, walrus, sea lion, etc.), that feed heavily on hard objects, is thinner (0.15-0.45 mm) than most hominids and non-human primates (Constantino et al., 2011). Therefore, the functional requirements of enamel thickness appear to be quite variable and dependent on other morphological features that act in concert to help achieve balance between optimal function while minimizing failure risk. This is also balanced with the energy requirements needed to produce enamel during odontogenesis.
Beyond being informative as enamel thickness pertains to structure-function relationships in canine teeth, the data reported here will likely also inform how variation in enamel thickness may affect outcomes of downstream mechanical analyses like finite element modeling.
4.7. Limitations
Our sample size was small and only included a few different dog breeds. While our results suggested variance in morphology of the canine tooth within this small population, larger studies are needed to verify the presence and magnitude of this variance. The presence of tooth wear, while minimal, did have measured influence on some outcomes, namely enamel thickness at the tooth tip. Some inherent limitations in image resolution and image processing were present that may have limited our ability to accurately model teeth. Accuracy of image segmentation and model building is highly dependent on image resolution. While we achieved very good resolution with the polychromatic bench-top μ-CT systems used in this study, excellent resolution could have been achieved with a monochromatic radiation source (e.g., Synchrotron). In addition, beam hardening artifacts using a polychromatic radiation source are inevitable. Beam hardening can result in sub-optimal resolution at the enamel boundaries. While we took measures to minimize beam hardening artifacts, use of a monochromatic radiation source could have removed them entirely. However, inherent accessibility issues precluded its use. Image segmentation was performed via automated and manual processes. It is possible that limitations in the manual refinement process could result in models that were not exact duplicates of the teeth. However, we believe the models were realistic representations of the teeth in the study and results were not significantly impacted by these inherent limitations.
5. Conclusions
We have achieved our study aims of characterizing and objectively quantifying the morphology of the canine tooth and showing preliminary evidence of variance across individual dogs of Canis lupus familiaris. In addition, we have shown that key morphological features are highly correlated with body weight (BW). The following conclusions can be made. Morphological variation is seen between dogs, particularly major diameter (D2); minor diameter (D1); second moment of area around minor axis (Imin); second moment of area around major axis(Imax); section modulus around minor axis (Smin); section modulus around major axis(Smax); aspect ratio (AR); cross-sectional area (CSA); distal and mesial ridge sharpness; and volume and length ratios. Imin and Smin seems to be optimized at the base of the tooth to resist deflection and increase resistance to fracture in the disto-mesial plane. Sharpness is optimized at the cusp and the distal ridge to aid penetration of tough materials. Distal and mesial ridge ellipticity varies minimally between dogs and is a highly repeatable method to measure the tooth curvature. Tooth AR is optimized to balance fracture resistance and puncturing ability. Enamel thickness appears to be optimized to protect underlying dentin in areas susceptible to abrasion, distribute loads and contribute to lateral stiffness. D1; D2; Imin; Imax; Smin; Smax; CSA; crown, root, enamel and dentin volume; crown and root length; and enamel thickness scale with BW.
Supplementary Material
Acknowledgements and Funding:
This project was supported by funding from the Institutional Clinical and Translational Science Award UL1 TR002373 and by the University of Wisconsin Carbone Cancer Center Support Grants P30 CA014520 and NCI P30 CA014520.
We would like to thank and acknowledge the intellectual and technical contributions of the UW-Madison Small Animal Imaging and Radiotherapy Facility.
The authors wish to sincerely thank those who donated their bodies to science so that anatomical research could be performed. Results from such research can potentially improve patient care and increase mankind's overall knowledge. Therefore, these donors and their families deserve our highest gratitude.
Footnotes
Conflict of Interest Statement:
The authors declare that they have no known competing financial interests or personal relationships that could have appeared to influence the work reported in this paper.
References
- Barani A, Keown AJ, Bush MB, Lee JJW, & Lawn BR (2012). Role of tooth elongation in promoting fracture resistance. Journal of the Mechanical Behavior of Biomedical Materials, 8, 37–46. 10.1016/j.jmbbm.2011.11.014 [DOI] [PubMed] [Google Scholar]
- Berkovitz B, & Shellis P (2018a). Carnivora. In Berkovitz B & Shellis P (Eds.), The Teeth of Mammalian Vertebrates (Issue 2009, pp. 267–304). Elsevier Inc. 10.1016/B978-0-12-802818-6.00015-6 [DOI] [Google Scholar]
- Berkovitz B, & Shellis P (2018b). Mammalian Tooth Structure and Function. In Berkovitz B & Shellis P (Eds.), The Teeth of Mammalian Vertebrates (pp. 25–46). Elsevier Inc. 10.1016/b978-0-12-802818-6.00002-8 [DOI] [Google Scholar]
- Christiansen P, & Adolfssen JS (2005). Bite forces, canine strength and skull allometry in carnivores (Mammalia, Carnivora). Journal of Zoology, 266(2), 133–151. 10.1017/S0952836905006643 [DOI] [Google Scholar]
- Christiansen PER (2007). Canine morphology in the larger Felidae: implications for feeding ecology. Biological Journal of the Linnean Society, 91(4), 573–592. 10.1111/j.1095-8312.2007.00819.x [DOI] [Google Scholar]
- Cleuren SGC, Hocking DP, & Evans AR (2021). Fang evolution in venomous snakes: Adaptation of 3D tooth shape to the biomechanical properties of their prey. Evolution; International Journal of Organic Evolution, 75(6), 1377–1394. 10.1111/evo.14239 [DOI] [PubMed] [Google Scholar]
- Constantino PJ, Lee JJ-W, Morris D, Lucas PW, Hartstone-Rose A, Lee W-K, Dominy NJ, Cunningham A, Wagner M, & Lawn BR (2011). Adaptation to hard-object feeding in sea otters and hominins. Journal of Human Evolution, 61(1), 89–96. 10.1016/j.jhevol.2011.02.009 [DOI] [PubMed] [Google Scholar]
- Copes LE, & Schwartz GT (2010). The scale of it all: postcanine tooth size, the taxon-level effect, and the universality of Gould’s scaling law. Paleobiology, 36(2), 188–203. 10.1666/08089.1 [DOI] [Google Scholar]
- Creighton GK (1980). Static allometry of mammalian teeth and the correlation of tooth size and body size in contemporary mammals. Journal of Zoology, 191(4), 435–443. https://doi.org/ 10.1111/j.1469-7998.1980.tb01475.x [DOI] [Google Scholar]
- Crofts SB, Smith SM, & Anderson PSL (2020). Beyond Description: The Many Facets of Dental Biomechanics. Integrative and Comparative Biology, 60(3), 594–607. 10.1093/icb/icaa103 [DOI] [PubMed] [Google Scholar]
- Crossley DA (1995). Tooth enamel thickness in the mature dentition of domestic dogs and cats--preliminary study. Journal of Veterinary Dentistry, 12(3), 111–113. 10.1177/089875649501200302 [DOI] [PubMed] [Google Scholar]
- Doube M, Klosowski MM, Arganda-Carreras I, Cordelières FP, Dougherty RP, Jackson JS, Schmid B, Hutchinson JR, & Shefelbine SJ (2010). BoneJ: Free and extensible bone image analysis in ImageJ. Bone, 47(6), 1076–1079. 10.1016/j.bone.2010.08.023 [DOI] [PMC free article] [PubMed] [Google Scholar]
- Dumont ER (1995). Enamel Thickness and Dietary Adaptation among Extant Primates and Chiropterans. Journal of Mammalogy, 76(4), 1127–1136. 10.2307/1382604 [DOI] [Google Scholar]
- Evans AR, Pollock TI, Cleuren SGC, Parker WMG, Richards HL, Garland KLS, Fitzgerald EMG, Wilson TE, Hocking DP, & Adams JW (2021). A universal power law for modelling the growth and form of teeth, claws, horns, thorns, beaks, and shells. BMC Biology, 19(1), 1–14. 10.1186/s12915-021-00990-w [DOI] [PMC free article] [PubMed] [Google Scholar]
- Evans AR, & Sanson GD (1998). The effect of tooth shape on the breakdown of insects. Journal of Zoology, 246(4), 391–400. 10.1017/S0952836998009832 [DOI] [Google Scholar]
- Frazzetta TH (1966). Studies on the morphology and function of the skull in the Boidae (Serpentes). II. Morphology and function of the jaw apparatus in Phython sebae and Python molurus. Journal of Morphology, 118(2), 217–295. 10.1002/jmor.1051180206 [DOI] [PubMed] [Google Scholar]
- Freeman PW (1992). Canine teeth of bats (Microchiroptera): size, shape and role in crack propagation. Biological Journal of the Linnean Society, 45(2), 97–115. 10.1111/j.1095-8312.1992.tb00634.x [DOI] [Google Scholar]
- Freeman PW, & Lemen C (2006). Puncturing ability of idealized canine teeth: Edged and non-edged shanks. Journal of Zoology, 269(1), 51–56. 10.1111/j.1469-7998.2006.00049.x [DOI] [Google Scholar]
- Freeman PW, & Lemen C (2007a). An experimental approach to modeling the strength of canine teeth. Journal of Zoology, 271(2), 162–169. 10.1111/j.1469-7998.2006.00194.x [DOI] [Google Scholar]
- Freeman PW, & Lemen CA (2007b). The trade-off between tooth strength and tooth penetration: Predicting optimal shape of canine teeth. Journal of Zoology, 273(3), 273–280. 10.1111/j.1469-7998.2007.00325.x [DOI] [Google Scholar]
- Freeman PW, & Weins WN (1997). Pucturing ability of bat canine teeth: The tip. Special Publication The Museum of Southwestern Biology, 3(December), 226–231. [Google Scholar]
- Gingerich PD, Smith BH, & Rosenberg K (1982). Allometric scaling in the dentition of primates and prediction of body weight from tooth size in fossils. American Journal of Physical Anthropology, 58(1), 81–100. 10.1002/ajpa.1330580110 [DOI] [PubMed] [Google Scholar]
- Gioso MA, Shofer F, Barros PS, & Harvey CE (2001). Mandible and mandibular first molar tooth measurements in dogs: relationship of radiographic height to body weight. Journal of Veterinary Dentistry, 18(2), 65–68. 10.1177/089875640101800202 [DOI] [PubMed] [Google Scholar]
- Goldschmidt S, Collins CJ, Hetzel S, Ploeg H-L, & Soukup JW (2016). The influence of axial grooves on dislodgment resistance of prosthetic metal crowns in canine teeth of dogs. Journal of Veterinary Dentistry, 33(3). 10.1177/0898756416676558 [DOI] [PubMed] [Google Scholar]
- Goldschmidt S, Zimmerman C, Collins C, Hetzel S, Ploeg H-L, & Soukup JW (2017). The influence of force direction on the fracture pattern and fracture resistance of canine teeth in dogs. Journal of Veterinary Dentistry, 34(1). 10.1177/0898756417705229 [DOI] [PubMed] [Google Scholar]
- Hanford R, & Linder DE (2021). Impact of Obesity on Quality of Life and Owner’s Perception of Weight Loss Programs in Cats. Veterinary Sciences, 8(2). 10.3390/vetsci8020032 [DOI] [PMC free article] [PubMed] [Google Scholar]
- Hocking DP, Marx FG, Fitzgerald EMG, & Evans AR (2017). Ancient whales did not filter feed with their teeth. Biology Letters, 13(8). 10.1098/rsbl.2017.0348 [DOI] [PMC free article] [PubMed] [Google Scholar]
- Kay RF (1981). The nut-crackers – a new theory of the adaptations of the Ramapithecinae. American Journal of Physical Anthropology, 55(2), 141–151. https://doi.org/ 10.1002/ajpa.1330550202 [DOI] [Google Scholar]
- Kono RT (2004). Molar enamel thickness and distribution patterns in extant great apes and humans: new insights based on a 3-dimensional whole crown perspective. Anthropological Science, 112(2), 121–146. 10.1537/ase.03106 [DOI] [Google Scholar]
- Lawn BR, Bush MB, Barani A, Constantino PJ, & Wroe S (2013). Inferring biological evolution from fracture patterns in teeth. Journal of Theoretical Biology, 338, 59–65. 10.1016/j.jtbi.2013.08.029 [DOI] [PubMed] [Google Scholar]
- Lawn BR, Chai H, Barani A, & Bush MB (2013). Transverse fracture of canine teeth. Journal of Biomechanics, 46(9), 1561–1567. 10.1016/j.jbiomech.2013.03.018 [DOI] [PubMed] [Google Scholar]
- le Brech C, Hamel L, le Nihouannen JC, & Daculsi G (1997). Epidemiological study of canine teeth fractures in military dogs. Journal of Veterinary Dentistry, 14(2), 51–55. 10.1177/089875649701400203 [DOI] [Google Scholar]
- Lucas P, Constantino P, Wood B, & Lawn B (2008). Dental enamel as a dietary indicator in mammals. BioEssays : News and Reviews in Molecular, Cellular and Developmental Biology, 30(4), 374–385. 10.1002/bies.20729 [DOI] [PubMed] [Google Scholar]
- Lucas PW (2004). Dental Functional Morphology. University Press. [Google Scholar]
- Mech LD, Smith DW, & MacNulty DR (2015). Wolves on the Hunt: The Behavior of Wolves Hunting Prey (Mech LD, Smith DW, & MacNulty DR, Eds.). University of Chicago Press. [Google Scholar]
- Pilkey W (2002). Analysis and Design of Elastic Beams: Computational Methods (Pilkey WD, Ed.). John Wiley and Sons. [Google Scholar]
- Pollock TI, Hocking DP, & Evans AR (2021). The killer’s toolkit: remarkable adaptations in the canine teeth of mammalian carnivores. Zoological Journal of the Linnean Society, 1–18. 10.1093/zoolinnean/zlab064 [DOI] [Google Scholar]
- Pollock TI, Panagiotopoulou O, Hocking DP, & Evans AR (2022). Taking a stab at modelling canine tooth biomechanics in mammalian carnivores with beam theory and finite-element analysis. Royal Society Open Science, 9(10). 10.1098/rsos.220701 [DOI] [PMC free article] [PubMed] [Google Scholar]
- Popowics TE, & Fortelius M (1997). On the cutting edge: Tooth blade sharpness in herbivorous and faunivorous mammals. Annales Zoologici Fennici, 34(2), 73–88. [Google Scholar]
- Popowics TE, Rensberger JM, & Herring SW (2001). The fracture behaviour of human and pig molar cusps. 46, 1–12. [DOI] [PubMed] [Google Scholar]
- Scherer E, Hetzel S, & Snyder CJ (2019). Assessment of the Role of the Mandibular First Molar Tooth in Mandibular Fracture Patterns of 29 Dogs. Journal of Veterinary Dentistry, 36(1), 32–39. 10.1177/0898756419846183 [DOI] [PMC free article] [PubMed] [Google Scholar]
- Schofield RMS, Choi S, Coon JJ, Goggans MS, Kreisman TF, Silver DM, & Nesson MH (2016). Is fracture a bigger problem for smaller animals? Force and fracture scaling for a simple model of cutting, puncture and crushing. Interface Focus, 6(3). 10.1098/rsfs.2016.0002 [DOI] [PMC free article] [PubMed] [Google Scholar]
- Shellis RP, Beynon AD, Reid DJ, & Hiiemae KM (1998). Variations in molar enamel thickness among primates. Journal of Human Evolution, 35(4–5), 507–522. 10.1006/jhev.1998.0238 [DOI] [PubMed] [Google Scholar]
- Soukup JW, Collins C, & Ploeg H-L (2015). The influence of crown height to diameter ratio on the force to fracture of canine teeth in dogs. Journal of Veterinary Dentistry, 32(3). 10.1177/089875641503200302 [DOI] [PMC free article] [PubMed] [Google Scholar]
- Soukup JW, Hetzel SJ, Stone DS, Eriten M, Ploeg H, & Henak CR (2022). Structure-function relationships in dog dentin. Journal of Biomechanics, 141(July), 111218. 10.1016/j.jbiomech.2022.111218 [DOI] [PMC free article] [PubMed] [Google Scholar]
- Soukup JW, Snyder CJ, Karls TL, & Riehl J (2011). Achievable convergence angle and the effect of preparation design on the clinical outcome of full veneer crowns in dogs. Journal of Veterinary Dentistry, 28(2). [DOI] [PMC free article] [PubMed] [Google Scholar]
- Van Valkenburgh B (1988). Incidence of tooth breakage among large, predatory mammals. The American Naturalist, 131(2), 291–302. 10.1126/science.26.678.918 [DOI] [Google Scholar]
- Van Valkenburgh B, & Ruff CB (1987). Canine tooth strength and killing behaviour in large carnivores. Journal of Zoology, London, 212, 379–397. 10.1111/j.1469-7998.1987.tb02910.x [DOI] [Google Scholar]
- Van Valkenburgh B, Ruff CB, van Valkenburgh B, & Ruff CB (1987). Canine tooth strength and killing behaviour in large carnivores. Journal of Zoology, 212(3), 379–397. 10.1111/j.1469-7998.1987.tb02910.x [DOI] [Google Scholar]
Associated Data
This section collects any data citations, data availability statements, or supplementary materials included in this article.