

Abstract

The methanolic fraction (M-F) of the total extract (TE) of Plumeria obtusa L. aerial parts showed promising antibacterial effects against the MDR (multidrug-resistant) gram-negative pathogens Klebsiella pneumoniae and Escherichia coli O157:H7 [Shiga toxin-producing E. coli (STEC)]. In addition, M-F had a synergistic effect (in combination with vancomycin) against the MDR gram-positive strains MRSA (methicillin-resistant Staphylococcus aureus) and Bacillus cereus. After treating the K. pneumoniae- and STEC-infected mice with M-F (25 mg/kg, i.p.), the level of IgM and TNF-α was decreased and the severity of pathological lesions were reduced better than that observed after administration of gentamycin (33 mg/kg, i.p.). Thirty-seven compounds including 10 plumeria-type iridoids and 18 phenolics, 7 quinoline derivatives, 1 amino acid, and 1 fatty acid were identified in TE using LC/ESI-QToF. Furthermore, five compounds; kaempferol 3-O-rutinoside (M1), quercetin 3-O-rutinoside (M2), glochiflavanoside B (M3), plumieride (M4), and 13-O-caffeoylplumieride (M5) were isolated from M-F. M5 was active against K. pneumoniae (MIC of 64 μg/mL) and STEC (MIC of 32 μg/mL). These findings suggested that M-F and M5 are promising antimicrobial natural products for combating MDR K. pneumoniae and STEC nosocomial infections.
1. Introduction
Inadequate control of infections and inappropriate use of antibiotics have led to the emergence and spread of resistant pathogens, and most antibiotics become less effective. Such situation is a serious threat to public health, society, and the global economy.1,2
Several multidrug-resistant (MDR) pathogens such as Klebsiella pneumoniae, Escherichia coli O157:H7 [Shiga toxin-producing E. coli (STEC)], methicillin-resistant Staphylococcus aureus (MRSA), and Bacillus cereus have been identified as causes of nosocomial (hospital-acquired) infections. These strains are among the most critical MDR bacteria in the recently published WHO list of antibiotic-resistant priority pathogens.3−6 Although Escherichia coli (E. coli) is a common natural flora of humans, its strains may cause enteric diseases; others may colonize the urinary tract or cause other extraintestinal infections, such as septicemia and meningitis.7 MRSA may also lead to enteric infections, skin sepsis, postoperative wound infections, septicemia, and pneumoniae.8B. cereus is usually regarded as an environmental contaminant in hospitals but may cause a life-threatening lung infection.
In Egypt, a 2 year prospective study of nosocomial infections in a number of university hospitals revealed that almost 90% of the gram-negative and staphylococcal isolates collected were MDR strains and the possibility of exposure to infectious diseases at hospitals is substantial.9 Unfortunately, current treatment options of infections caused by these pathogens are limited.10−12 Such observations indicate that MDR is a great challenge, particularly in developing countries. Accordingly, developing potent antimicrobial agents for MDR pathogens are urgently needed.
Research attempts to develop new and effective natural or synthetic antimicrobial agents against resistant infections were reported.13,14 Halicin, a promising broad-spectrum antimicrobial agent, was discovered through repurposing of huge number of FDA-approved drugs,15 while darobactin, a novel peptide from luminescent Bacillus was found effective against a number of resistant gram-negative pathogens,16 and piperine, the alkaloid isolated from black pepper, demonstrated promising anti-TB activity.17
Plants of genus Plumeria (Fam. Apocynaceae) are lactiferous shrubs or small trees with fragrant flowers and are widely cultivated all over the world for ornamental purposes. Plumeria plants are characterized by the presence of essential oil, triterpenes, iridoids, alkaloids, flavonoids, and phenolic acids, most of which demonstrate antibacterial, antifungal, and antiviral activities.18,19Plumeria obtusa L. is one of the most common species20 and is traditionally used for the treatment of diabetes mellitus, wound healing, and skin disease.21 Crude extracts of P. obtusa flowers as well as different fractions showed in vitro antimicrobial activities against both gram-positive and gram-negative organisms.22−24 However, activities in infected animals were not evaluated, and the chemical profile of the bioactive extract/fraction or compounds responsible for the said activities was not clarified yet.
In the present study, the antimicrobial activities of the extract of P. obtusa aerial parts were evaluated in a bioassay-guided approach (in vitro and in vivo) against a number of MDR pathogens. Furthermore, the chemical profile of the active extract was identified using LC-DAD-QToF, and several compounds were isolated and tested for their antimicrobial effects against the selected pathogens. The future perspective is to shed light on potential natural products that could be utilized to combat antimicrobial-resistant pathogens.
2. Results
2.1. Chemical Characterization of the Total Extract of P. obtusa L. Aerial Parts Analysis of TE by LC/ESI-QToF
The chemical profile of the TE was clarified using liquid chromatography diode array detector-quadrupole time-of-flight mass spectrometry (LC-DAD-QToF) and MS/MS (Figure 1 and Table 1). Examination of the mass spectra in both negative and positive modes led to the identification of 37 compounds including 10 plumeria-type iridoids and 18 phenolics (eight quinic acid derivatives, six flavonoids, three phenolic acids, and one coumarin), 7 quinoline derivatives, 1 amino acid, and 1 fatty acid. The most prominent compounds were monocaffeoylquinic acids (peak # 9), flavonoid glycosides (peaks # 17, 18, 21 and 22), and iridoids (peaks # 28, 29, 30 and 31).
Figure 1.

LC-DAD-QToF chromatograms of P. obtusa aerial parts: (A, B) QToF-MS base peak chromatograms in negative and positive modes and (C–E) DAD chromatograms at 254, 280, and 330 nm, respectively.
Table 1. Tentative Identification and Characterization of Phytochemical Compounds in P. obtusa Aerial Parts Using LC-QToF in Positive and Negative Ionization Modes.
| # | RT (min) | compound name | mol. formula | exact mass [M] | [M + H]+ | fragment ions | [M – H]− | fragment ions |
|---|---|---|---|---|---|---|---|---|
| 1 | 2.00 | quinaldic acid | C10H7NO2 | 173.0477 | 174.0554 (174.0550) | 143.0342 [M + H – CH3O]+ | 172.0404(172.0404)* | 128.0488 [M – H – CO2]− |
| 2 | 2.40 | plumerianine/plumericidine | C13H13NO3 | 231.0895 | 232.0967 (232.0968) | 186.0903 [M + H – CH2O2]+, 170.0593 [M + H – CH2O2 – CH4]+, 142.0643 [M + H – CH2O2 – CH4 – CO]+, 130.0645 [M + H – CH2O2 – CH4 – C – CO]+ | ||
| 3 | 3.05 | |||||||
| 4 | 2.64 | phenylalanine | C9H11NO2 | 165.0790 | 166.0858 (166.0863) | 120.0477 [M + H – C2H6O]+ | 164.0717(164.0717) | |
| 5 | 3.52 | dehydroplumeridoid A | C14H14O7 | 294.0740 | 295.0811 (295.0812) | 277.0705 [M + H – H2O]+, 231.0654 [M + H – 2H2O – CO]+ | 293.0667(293.0667) | 275.0559 [M – H – H2O]−, 231.0661 [M – H – H2O – CO2]−, 213.0558 [M – H – 2H2O – CO2]− |
| 6 | 4.14 | hydroxyquinoline | C9H7NO | 145.0528 | 146.0605 (146.0600) | 144.0457(144.0455) | ||
| 7 | 4.73 | chlorogenic acid/ neochlorogenic acid | C16H18O9 | 354.0951 | 355.1031 (355.1024) | 163.0390 [M + H – C7H12O6]+ | 353.0881 | 191.0564 (quinic acid) |
| 8 | 5.03 | |||||||
| 9 | 6.30 | |||||||
| 10 | 4.73 | quinic acid | C7H12O6 | 192.0634 | 191.0561 | |||
| 11 | 5.65 | gentisic acid | C7H6O4 | 154.0266 | 155.0341 (155.0339) | 153.0194(153.0193) | 109.0297 [M – H – CO2]− | |
| 12 | 6.00 | dihydroxycoumarin | C9H6O4 | 178.0266 | 179.0328 (179.0339) | 177.0196(177.0193) | 149.0243 [M – H – CO]−, 133.0297 [M – H – CO2]−, 121.0295 [M – H – 2CO]−, 105.0348 [M – H – CO2 – CO]− | |
| 13 | 6.60 | coumaroylquinic acid | C16H18O8 | 338.1002 | 339.1074 (339.1074) | 193.0491 [M + H – C6H10O4]+, 165.0541 [M + H – C6H10O4 – CO]+, 147.0437 [M + H – C6H10O4 – CO – H2O]+ | 337.0945(337.0929) | 191.0556 [M – H – C6H10O4]− |
| 14 | 7.48 | plumericin/iso | C15H14O6 | 290.0790 | 291.0869 (291.0863) | 263.0913 [M + H – CO]+, 245.0806 [M + H – CO – H2O]+, 231.0650 [M + H – CO – H2O – CH2]+, 213.0545 [M + H – CO – 2H2O – CH2]+, 203.0608 [M + H – 2CO – H2O – CH2]+ | 289.0725(289.0718) | |
| 15 | 7.61 | |||||||
| 16 | 7.55 | 4-O-(3’-O-α-d-glucopyranosyl)-caffeoyl quinic acid | C22H28O14 | 516.1479 | 515.1410(515.1406) | 191.0564 | ||
| 17 | 9.14 | quercetin rutinoside/rutin | C27H30O16 | 610.1534 | 611.1611 (611.1609) | 465.1026 [M + H – C6H10O4]+, 303.0493 [M + H – C6H10O4 – C6H10O5]+ | 609.1489(609.1461) | 300.0291 [M – H – C12H21O9]− |
| 18 | 9.30 | |||||||
| 19 | 9.78 | quercetin-3-O-pentosyl-pentoside | C27H22O18 | 566.1272 | 567.1341 (567.1344) | 303.0510 | 565.1197(565.1199) | 301.0351 |
| 20 | 9.85 | plumenoside | C20H24O11 | 440.1319 | 439.1243(439.1246) | 259.0609 [M – H – C6H12O6]−, 215.0714 [M – H – C6H12O6 – CO2]− | ||
| 21 | 10.3 | kaempferol rutinoside | C27H30O15 | 594.1585 | 595.1659 (595.1657) | 287.0550 | 593.1517(593.1512) | 284.0330, 285.0393 |
| 22 | 11.0 | |||||||
| 23 | 11.1 | ferulic acid | C10H10O4 | 194.0574 | 193.0511(193.0506) | 178.0265 [M – H – CH3]−, 149.0599 [M – H – CO2]−, 134.0376 [M – H – CH3 – CO2]− | ||
| 24 | 11.2 | glochiflavanoside B | C24H30O12 | 510.1737 | 509.1671(509.1664) | 347.1134, 179.0345 | ||
| 25 | 12.91 | dicaffeoylquinic acids | C25H24O12 | 516.1268 | 515.1192(515.1195) | 353.0883 [M – H – C9H6O3]−, 191.0561[M – H – 2C9H6O3]−, 173.0460 [M – H – 2C9H6O3 – H2O]− | ||
| 26 | 15.2 | |||||||
| 27 | 14.0 | hydroxybenzoic acid | C7H6O3 | 138.0317 | 137.0145 (137.0244) | 93.0291 [M – H – CO2]− | ||
| 28 | 14.6 | protoplumericin A | C36H42O19 | 778.2320 | 796.2664 (796.2658) [M + NH4]+ | 361.1280 [M + H – C17H22O12]+, 147.0440 [M + H – C17H22O12 – C10H14O5]+ | 777.2245(777.2248) | 615.1715 [M – H – C6H10O5]−, 343.1399 [M – H – C6H10O5 – C14H8O6]−, 163.0401 [M – H – C6H10O5 – C14H8O6 – C7H16O5]− |
| 29 | 15.15 | |||||||
| 30 | 17.90 | 13-O-caffeoylplumieride | C30H32O15 | 632.1741 | 633.1816 (633.1814) | 471.1287 [M + H – C6H10O5]+, 325.0923 [M + H – C6H10O5 – C9H6O2]+, 291.0864 [M + H – C6H10O5 – C9H6O2 – H2O]+, 231.0655 [M + H – C6H10O5 – C9H6O2 – H2O – C2H4O2]+, 163.0388 [M + H – C6H10O5 – C9H6O2 – H2O – C2H4O2 – C4H4O]+ | 631.1686(631.1688) | 469.1142 [M – H – C6H10O5]−, 289.0714 [M – H – C6H10O5 – C9H6O2 – H2O]−, 213.0548 [M – H – C6H10O5 – C9H6O2 – H2O – C2H4O3]−, 179.0350 [M – H – C6H10O5 – C9H6O2 – H2O – C6H6O2]−, 135.0446 [M – H – C6H10O5 – C9H6O2 – H2O – C6H6O2 – CO2]− |
| 31 | 20.2 | 13-O-coumaroylplumieride | C30H32O14 | 616.1792 | 617.1863 (617.1865) | 455.1332 [M + H – C6H10O5]+, 437.1233 [M + H – C6H10O5 – H2O]+, 309.0960 [M + H – C6H10O5 – H2O – C9H4O]+, 291.0858 [M + H – C6H10O5 – 2H2O – C9H4O]+, 231.0643 [M + H – C6H10O5 – 2H2O – C9H4O – C2H4O2]+, 147.0430 [M + H – C6H10O5 – 2H2O – C9H4O – C2H4O2 – C4H4O2]+ | 615.1725(615.1719) | 445.1145 [M – H – C8H10O4]−, 163.0410 [C9H8O3 – H]− |
| 32 | 21.6 | trihydroxy-octadecadienoic acid | C18H32O5 | 328.2250 | 327.2181(327.2177) | |||
| 33 | 24.4 | HQNO (4-hydroxy-2-heptylquinoline-N-oxide) | C16H21NO2 | 259.1572 | 260.1649 (260.1645) | 184.0758, 172.0751, 159.0677 | ||
| 34 | 24.8 | C9:1-NHQ (2-nonenyl-4-hydroxyquinoline) | C18H23NO | 269.178 | 270.1850 (270.1852) | 184.0756, 172.0754, 159.0679 | ||
| 35 | 24.87 | NHQ (2-nonyl-4-hydroxyquinoline) | C18H25NO | 271.1936 | 272.2008 (272.2009) | 184.0755, 172.0755, 159.0678 | ||
| 36 | 25.2 | C11:1-UHQ (2-undecenyl-4-hydroxyquinoline) | C20H27NO | 297.2093 | 298.2170 (298.2165) | 184.0757, 172.0757, 159.0679 | ||
| 37 | 25.8 |
In addition, 10 metabolites were identified in the aerial parts of P. obtusa and genus Plumeria for the first time: two amino acid/derivatives (peaks # 1 and 4), six quinoline derivatives (peaks # 6, 33, 34, 35, 36, and 37), a trihydroxyfatty acid (peak # 32), and a dihydroxycoumarin (peak #12) (Table 1).
2.1.1. Iridoids
The peaks # 2 and 3 were identified as plumerianine (2) and plumericidine (3), two iridoid alkaloids previously isolated from the leaf of P. acutifolia(25) and flower of P. rubra L. cv. Acutifolia,(26) respectively. Peak # 3 was reported to possess potent anti-inflammatory activity against the carrageenan-induced paw edema in rat model.
Meanwhile, peak # 5 was identified as the dehydro derivative of plumeridoid A, a plumeiride-type iridoid previously isolated from the stem bark of P. rubra L.27 However, its dehydro derivative (5) was identified here from P. obtusa for the first time.
Both peaks 14 and 15 gave the same molecular ion peak at m/z 291.0869 [M + H]+, compatible with the molecular formula C15H15O6, which was attributed to plumericin (14) or isoplumericin (15), and both were previously isolated from the root of P. obtusa.(28) Important fragments were observed also at m/z 263.0913 [(M + H) – CO]+ and m/z 231.0650 [M + H – CO – H2O – CH2]+. Plumericin (14) was found to demonstrate strong antimicrobial activities against pathogenic bacterial strains.28,29
Peaks # 28 and 29 were identified as the p-O-glucosylcoumaroyl derivative of plumieride (M4), known as protoplumiericin A, previously isolated from P. obtusa flowers30 and P. alba L. bark and leaves.31 Both compounds were strongly active against Candida albicans.(31)
Of the plumeria-type iridoids, peaks # 20, 28, 29, 30, and 31 were for plumieride glycosides. Their molecular ion peaks were detected in both ion modes with corresponding MS2 fragments for the loss of glucosyl moieties (see Table 1). Peak # 30 was identified as the caffeoyl ester of plumieride,32,33 with molecular ion peaks at m/z 633.1816 [M + H]+ and 631.1686 [M – H]− and MS2 fragments at m/z 471.1287 [M + H – C6H10O5]+ (for the loss of a glucosyl moiety) and at m/z 179.035 [C9H8O4 – H]− for the caffeoyl moiety. For peak # 31, the MS2 fragment at m/z 455.1332 [M + H – C6H10O5]+ is for the loss of a glucosyl moiety, and that at m/z 163.0410 [C9H8O3 – H]− is for the coumaroyl moiety. Accordingly, peak # 31 was identified as 13-O-coumaroylplumieride, previously isolated from the heartwood of P. rubra.(34)
2.1.2. Phenolics
2.1.2.1. Phenolic Acids
The peaks # 11, 23, and 27 were identified as gentisic acid, ferulic acid, and hydroxybenzoic acid (molecular ion peaks displayed at m/z 153.0194 [M – H]−, 193.0511 [M – H]−, and 137.0145 [M – H]−, respectively, and MS2 fragments at m/z 109.0297, 149.0599, and 93.0291, respectively, for the loss of carboxyl moiety (−44 Da). These compounds were identified in P. obtusa flowers35 and were reported to exhibit antimicrobial activities.36,37
2.1.2.2. Quinic Acid and Derivatives
Three peaks (7, 8, and 9) with the same molecular ion peaks; m/z 355.1031 (M + H]+ and m/z 353.0881 [M – H]− (in positive and negative modes, respectively), were identified as monocaffeoylquinic acids—chlorogenic acid and neochlorogenic acid (previously detected in the P. rubra flowers.35,38 Furthermore, a protonated MS2 fragment at m/z 163.0390 [M + H – C7H12O6]+ indicated the loss of caffeic acid, and a deprotonated moiety at m/z 191.0564 is indicative for quinic acid, as was for peak # 10 (Table 1).
Similarly, peak 13 was tentatively annotated as a mono coumaroylquinic acid with a molecular ion peak at m/z 337.0945 [M – H]− and a fragment ion at m/z 191.0564. Peak 16 was identified as a glucosyl derivative of caffeoylquinic acid.
The occurrence of quinic acid derivatives in the genus Plumeria has also been reported.35,38
2.1.2.3. Dicaffeoylquinic Acids
Two peaks (25 and 26) were identified as dicaffeoylquinic acid isomers (m/z [M – H]− at 515.1192) (Table 1). Both exhibited the same MS2 fragment ion at m/z 353.0883 for a caffeoylquinic acid moiety and indicates the loss of a caffeoyl moiety. Further fragmentation of the precursor ion gave a fragment at m/z 191.0561 representing the quinic acid moiety and a fragment at m/z 173.0460 for its dehydrated product.
Similarly, peak 13 was tentatively annotated as a mono coumaroylquinic acid with a molecular ion peak at m/z 337.0945 [M – H]− and a fragment ion at m/z 191.0564. Peak 16 was identified as glucosyl derivative of caffeoylquinic acid.
The occurrence of quinic acid derivatives in the genus Plumeria has also been reported.35,38
2.1.2.4. Flavonoid Glycosides
The presence of several flavonoids has been reported in P. obtusa leaves and P. rubra flowers.20,38 In accordance with these studies, peaks # 17, 18, and 19 were identified as quercetin 3-O-rutinoside35 and quercetin-3-O-pentosyl-pentoside,39 respectively, and 21 and 22 were identified as kaempferol rutinoside.38 Compound 24 was identified as glochiflavanoside B.40
Their identification was based on the fragmentation behavior in the MS2 experiments. Peaks # 17 and 18 showed the same molecular ion peaks at m/z 611.1611[M + H]+ and 609.1489 [M – H]−. A prominent fragment ion was seen at m/z 303.0493 [M + H – C6H10O4 – C6H10O5]+ for the aglycone after the loss of a rutinosyl moiety (308 Da) and was therefore assigned to quercetin 3-O-rutinoside. However, the loss of two pentosyl moieties (264 Da) from peak # 19 (m/z 567.1341 [M + H]+) identified its nature as quercetin-3-O-pentosyl-pentoside, while MS2 fragmentation of the molecular ion peak at m/z 595.1659 [M + H]+ for 21 and 22 yielded a prominent fragment at m/z 287.0550 for the aglycone kaempferol after the loss of a rutinosyl moiety.
2.1.3. Quinoline Derivatives
The peak # 1 was identified as a 2-quinolinecarboxylic acid (known as quinaldic acid) (Figure 1 and Table 1). The molecular ions at m/z 174.0554 [M + H]+ and 172.0404 [M – H]−, in positive and negative ion modes, respectively, confirmed its nature as a nitrogen-containing compound. The ion peak at m/z 128.0488 [M – H – CO2]− confirmed the presence of a carboxyl group.
Furthermore, a bundle of 5 peaks (33–37) was for derivatives of 4-hydroxy-2-alkylquinolines (HAQs) based on their respective molecular ion peaks (in the positive mode) and the (almost) identical fragmentation pattern for all (m/z 184.0758, 172.0751, at 159.0677 Da). HAQs are frequently found in various strains of Pseudomonas spp. and were found to exert antibacterial activity41 and inhibit hyphal growth induction of Candida albicans.(42) Also, HQNO (33) and its alkyl homologues are major secondary metabolites produced by Pseudomonas aeruginosa and were found to inhibit most of the methicillin-resistant and pseudomonic acid-resistant S. aureus.(43)
2.1.4. Trihydroxyfatty Acid
Peak # 32 was identified as trihydroxyoctadecadienoic acid, a fatty acid previously isolated from the Bryonia alba L. roots40 and Corchorus olitorus L. leaves,44 and reported to inhibit LPS-induced NO production in cultured macrophages and exhibit antiatherogenic activity in vivo.
2.1.5. Isolation of Compounds M1-M5 from the Bioactive Fraction
Repeated column chromatography of the bioactive fraction (M-F) from the Diaion-HP20 column of the TE of P. obtusa aerial parts led to the isolation of five compounds (Figure 2). Their chemical structures were identified as kaempferol 3-O-rutinoside (M1),45 quercetin 3-O-rutinoside (M2),35 glochiflavanoside B (M3),46 plumieride (M4),47 and 13-O-caffeoylplumieride (M5)48 by comparing their 1H and 13C NMR data (see experimental) with those reported in the literature.
Figure 2.

Chemical structure of compounds isolated (M1–M5) from the 100% methanolic fraction (M-F) of P. obtusa L. total extract.
2.2. Antibacterial Activity of Extract, Fractions, and Isolated Compounds
In this study, the antibacterial activities of TE, DCM-F, MW-F, M-F, and the compounds isolated thereof (M1–M5) against MDR K. pneumoniae, STEC, MRSA, and MDR B. cereus were evaluated using the disc diffusion method.
2.2.1. Disc Diffusion
The four bacterial isolates tested here were resistant to TE and DCM-F (inhibition zones ranging from 5–8 and 2–7 mm, respectively) (Tables 2 and 3). Similarly, the bacterial isolates were resistant to MW-F (inhibition zones from 7–11 mm) but was moderately active against STEC (inhibition zone of 15 mm) (Table 2). M-F showed an antibacterial effect (of inhibition zone = 19 ± 1 and 12.66 ± 0.577 mm against the gram-negative bacteria (STEC and K. pneumoniae, respectively) (Table 2) but was ineffective against the gram-positive isolates MRSA and MDR B. cereus. On the other hand, MDR K. pneumoniae isolate was gentamycin (GEN)-resistant.
Table 2. Inhibition Zone of Antibiotics and Extract/Fractions of P. obtusa Aerial Parts on MDR Gram-Negative Bacteria (E. coli O157:H7 and MDR K. pneumoniae)a.
| zone of
inhibition (mean ± SD) |
||
|---|---|---|
| sample | E. coli O157:H7 | MDR K. pneumoniae |
| DMSO | 0.0 ± 0.0c# | 0.0 ± 0.0c# |
| NEO | 0.0 ± 0.0c# | 0.0 ± 0.0c# |
| GEN | 20.66 ± 0.577di@ | 11.0 ± 1.00dnj# |
| TE | 9.66 ± 0.577a# | 10.0 ± 0.0a# |
| DCM-F | 7.66 ± 0.577b# | 6.66 ± 0.577b# |
| MW-F | 15.0 ± 0.0g@ | 10.33 ± 0.577jflmn# |
| M-F | 19.0 ± 1.0fj@ | 12.66 ± 0.577e# |
| NEO+ TE | 10.66 ± 0.577a# | 7.33 ± 0.577ab# |
| NEO+ DCM-F | 7.66 ± 0.577b# | 7.66 ± 0.577ab# |
| NEO+ MW-F | 15.0 ± 1.732g# | 10.5 ± 1.00n# |
| NEO+ M-F | 21.0 ± 1.00dfi# | 12.0 ± 0.577dm# |
| GEN+ TE | 18.33 ± 1.15ej@ | 11.66 ± 0.577de# |
| GEN+ DCM-F | 17.0 ± 0.0e@ | 11.33 ± 1.154df# |
| GEN+ MW-F | 15.33 ± 1.527g@ | 12.0 ± 1.00dlmn# |
| GEN+ M-F | 30.66 ± 1.527h@ | 18.0 ± 1.00k@ |
DMSO, dimethyl sulfoxide; NEO, neomycin; GEN, gentamycin; TE, total methanolic extract; DCM-F, dichloromethane fraction; MW-F, 50% methanolic fraction; M-F, 100% methanolic fraction. There are significance differences between means having different letters at p ≤ 0.05. @ Sensitive. #Resistant.
Table 3. Inhibition Zone of Antibiotics and Extract/Fractions of P. obtusa Aerial Parts on MDR Gram-Positive Bacteria (MRSA and MDR B. cereus)a.
| zone of
inhibition (mean ± SD) |
||
|---|---|---|
| sample | MRSA | MDR B. cereus |
| DMSO | 0.0 ± 0.0c# | 0.0 ± 0.0bc# |
| PEN | 0.0 ± 0.0c# | 0.0 ± 0.0c# |
| VAN | 19.66 ± 0.577df@ | 18.66 ± 0.577e@ |
| TE | 4.33 ± 1.154ag# | 6.0 ± 0.0ajkn# |
| DCM-F | 3.0 ± 1.732ab# | 3.0 ± 1.00abcho# |
| MW-F | 8.0 ± 1.00i# | 7.33 ± 0.577bjk# |
| M-F | 11.0 ± 1.00j# | 8.33 ± 0.577k# |
| VAN +TE | 21.0 ± 1.00de@ | 20.33 ± 0.577ef# |
| VAN +DCM-F | 19.0 ± 0.0fl@ | 18.0 ± 0.0e# |
| VAN +MW-F | 17.33 ± 0.577l@ | 19.66 ± 0.577ef@ |
| VAN +M-F | 22.33 ± 2.516e@ | 23.33 ± 2.309f@ |
| PEN+TE | 5.66 ± 0.577g# | 6.33 ± 0.577ahjk# |
| PEN +DCM-F | 2.33 ± 0.577b# | 16.66 ± 10.115e# |
| PEN +MW-F | 7.66 ± 1.154i# | 7.0 ± 0.0ahko# |
| PEN +M-F | 10.0 ± 1.00j# | 8.33 ± 1.154njk |
DMSO; dimethyl sulfoxide, TE; total methanolic extract, DCM-F; dichloromethane fraction, MW-F; 50% methanolic fraction, M-F; 100% methanolic fraction, PEN; Penicillin, VAN; Vancomycin. There are significance differences between means having different letters at p ≤ 0.05. @Sensitive. #Resistant.
In the case of E. coli O157:H7, the known antibiotic GEN showed strong antibacterial activity (inhibition zone of 20.66 ± 0.577 mm), while neomycin (NEO) was almost inactive. Interestingly, a better activity was observed by the combination of M-F with any of the antibiotics GEN and NEO (inhibition zone of 30.66 ± 1.527 and 21.0 ± 1.00 mm, respectively) (Figure 3 and Table 2). The lowest zones of inhibition were observed for TE or DCM-F (inhibition zone of 9.66 ± 0.577 and 7.66 ± 0.577 mm, respectively). E. coli O157:H7 was sensitive to MW-F, M-F, and GEN, and a synergistic antibacterial effect of their combination was evident (Table 2).
Figure 3.
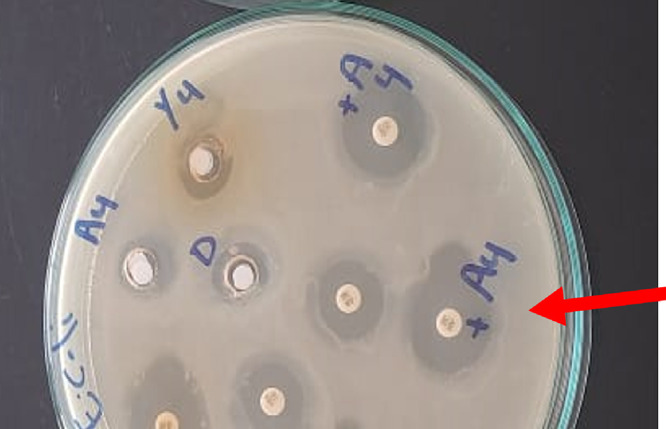
Highest zone diameter observed against E. coli O157:H7 after combination of 100% methanolic fraction (M-F) of P. obtusa and gentamycin (GEN).
As for the MDR K. pneumoniae, although the isolate was totally resistant to GEN, NEO, and tested fractions, it was sensitive to the combination of M-F and GEN (inhibition zone of 18.0 ± 1.00 mm) (Table 2).
For both the MDR strains, MRSA and B. cereus, the combination of M-F and vancomycin (VAN) showed a synergistic antibacterial effect as indicated by the increase in the zone of inhibition (from 19 mm to 22 mm and from 19 mm to 23 mm, respectively) (Table 3). However, the combination of M-F (as well as other fractions) with penicillin (PEN) was ineffective in reversing the resistance of both strains.
2.2.2. Minimum Inhibitory Concentration
The MIC values of TE, DCM-F, MW-F, and M-F against the tested Enterobacteriaceae ranged from 256 to 2048 μg/mL (for E. coli O157:H7) and 512 to >2048 μg/mL (for MDR K. pneumoniae) (Table 4). The samples tested showed variable antibacterial activities on gram-positive strains (Table 4). The MIC values for compounds M1, M2, M3, M4, and M5 (Table 5) ranged from 512 to 32 and 64–512 μg/mL (for E. coli and K. pneumoniae, respectively), where M4 and M5 were the most active. Although M1, M2, and M3 were almost inactive (MIC > 2048 μg/mL) against gram-positive bacteria, M4 and M5 showed MIC values against MRSA of 512 and 1024 μg/mL, respectively (Table 5).
Table 4. MIC of Extract/Fractions of P. obtusa Aerial Parts on MDR E. coli O157:H7, MDR K. pneumoniae, MRSA, and B. cereussa.
| MIC (μg/mL) |
||||
|---|---|---|---|---|
| sample | E. coli O157:H7 | MDR K. pneumoniae | MRSA | MDR B. cereus |
| TE | 2048 | >2048 | >2048 | >2048 |
| DCM-F | 1024 | 2048 | >2048 | >2048 |
| MW-F | 1024 | 1024 | >2048 | >2048 |
| M-F | 256 | 512 | >2048 | >2048 |
| GEN | 2 | 10 | ||
| VAN | 2 | 1 | ||
GEN, gentamycin; TE, total methanolic extract; DCM-F, dichloromethane fraction; MW-F, 50% methanolic fraction; M-F, 100% methanolic fraction; VAN, vancomycin.
Table 5. MIC of the Isolated Compounds from M-F on MDR E. coli O157:H7, K. pneumoniae, MRSA and B. cereusa.
| MIC (μg/mL) |
||||
|---|---|---|---|---|
| sample | E. coli O157:H7 | MDR K. pneumoniae | MRSA | MDR B. cereus |
| M1 | 256 (430.86*) | 512 (861.72*) | >2048 | >2048 |
| M2 | 512 (839.13*) | 512 (839.13*) | >2048 | >2048 |
| M3 | 128 (250.73*) | 256 (501.46*) | >2048 | >2048 |
| M4 | 64 (136.12*) | 128 (272.25*) | 512 (1089.03*) | >2048 |
| M5 | 32 (50.61*) | 64 (101.23*) | 1024 (1619.80*) | >2048 |
| GEN | 2 | 10 | ||
| VAN | 2 | 1 | ||
GEN, gentamycin; M1, kaempferol 3-O-rutinoside; M2, quercetin 3-O-rutinoside; M3, glochiflavanoside B; M4, plumieride; M5, 13-O-caffeoylplumieride; VAN, vancomycin. *μM.
2.3. In Vivo Assessment of the Antibacterial Activity of M-F
Both positive control groups died before the end of the experiment. Postmortem testing confirmed that all mice were infected with high CFU loads, indicating that death was caused by infection.
2.3.1. Biomarkers TNF-α and IgM
The levels of tumor necrosis factor-alpha (TNF-α) and immunoglobulin M (IgM) were assessed to determine whether E. coli and K. pneumoniae strains elicited a proinflammatory environment and to compare between positive control groups that were untreated and the groups treated with either GEN or M-F. All mice treated with M-F showed normal values of TNF-α (Figure 4) and IgM (Figure 5).
Figure 4.

Tumor necrosis factor-alpha (TNF-α, pg/mL) levels in model of mice infected by MDR K. pneumoniae (A) and E. coli O157:H7 (B) and then treated with 100% methanolic fraction (M-F) of P. obtusa and gentamycin (GEN). Results are expressed as mean ± SD. Statistical analysis was carried out by one-way ANOVA. aSignificant difference from normal control group at p < 0.05. bSignificant difference from positive infected group at p < 0.05. abSignificant difference from normal control group and positive infected group at p < 0.05.
Figure 5.

Immunoglobulin M (IgM, ng/mL) levels in model of mice infected by MDR K. pneumoniae (A) and E. coli O157:H7 (B) and then treated with 100% methanolic fraction (M-F) of P. obtusa and gentamycin (GEN). Results are expressed as mean ± SD. Statistical analysis was carried out by one-way ANOVA. aSignificant difference from normal control group at p < 0.05. bSignificant difference from positive infected group at p < 0.05. abSignificant difference from the normal control group and positive infected group at p < 0.05.
2.3.2. Histopathological Examination
The lungs infected with K. pneumoniae (Figure 6a–d) positive control showed multifocal to diffuse pathological alterations of lung tissue, mainly dilated pulmonary blood vessels, and moderate to severe hemorrhages in the interstitial tissue that extends occasionally inside some alveoli. Thickening on interalveolar septa with histiocytes and polymorphonuclear cells was also observed along with focal emphysema of some alveoli. Meanwhile, lungs of mice infected with K. pneumoniae and then treated with M-F showed congestion of interalveolar capillaries and moderate infiltration of inflammatory cells as well as emphysema of pulmonary alveoli. The lungs of mice infected with K. pneumoniae and then treated with GEN showed mild inflammatory cell infiltration in the pulmonary tissue, congestion perivascular edema of peribronchial blood vessels, and focal emphysema (Figure 6). Scoring of histopathological lesions (Table 6) revealed pronounced improvement of lung tissue after treatment of both infected groups.
Figure 6.

Histological sections of lung stained with H & E and scoring of pulmonary lesions in model mice infected with MDR K. pneumoniae. (a) Negative control (X 400), (b) mice infected with K. pneumoniae (X 200), (c) mice infected with K. pneumoniae and then treated by gentamycin (GEN) (X 200), and (d) mice infected with K. pneumoniae and then treated with 100% methanolic fraction of P. obtusa (M-F) (X 400).
Table 6. Scoring of Pulmonary Lesionsa.
| a | b | c | d | |
|---|---|---|---|---|
| hemorrhage | – | +++ | – | – |
| thickened interalveolar septa | – | +++ | + | + |
| RBCs in alveolar lamina | – | +++ | – | – |
| perivascular edema | – | ++++ | + | – |
(+++) Severe, (+) moderate, (−) not present. (a) Negative control, (b) mice infected with K. pneumoniae, (c) mice infected with K. pneumoniae and then treated with gentamycin (GEN), and (d) mice infected with K. pneumoniae and then treated with 100% methanolic fraction of P. obtusa (M-F).
After 24 h of K. pneumoniae inoculation, the mice showed signs of faster respiration, lower activity, disordered bristle or coat, and increased secretion around the eyes. These symptoms were accelerated after 48 h of inoculation and mice began to die; all mice died within 168 h (7 days) in the model group (Figure 6), indicating that KNP inoculation induces a severe pulmonary inflammatory response, while in the M-F treated group, pulmonary hemorrhage and interalveolar thickness were remarkably reduced.
In the kidney of mice infected with E. coli O157:H7 (Figure 7a–d) (positive control group), severe degeneration of renal tubules along with extensive tubular necrosis with karyopyknotic nuclei and focal peritubular mononuclear cell infiltrations were observed. However, the kidney of mice infected with E. coli and then treated with M-F showed moderate focal interstitial nephritis along with focal necrosis of some renal tubules and peritubular mononuclear cell infiltrations. Similarly, kidney of mice infected with E. coli and then treated with GEN revealed focal inflammatory cell infiltration in the renal interstitial tissue and mild degenerative changes of the renal tubular epithelium (Figure 7). Scoring of histopathological lesions (Table 7) revealed that mice treated with M-F showed no subcapsular hemorrhage, interstitial hemorrhage, necrobiotic changes of tubular epithelium, no interstitial inflammatory cells infiltration, and no renal cast.
Figure 7.

Histological sections of kidney stained with H&E and scoring of renal lesions in model mice infected with E. coli O157:H7. (a) Normal control (X 400), (b) Mice infected with E. coli O157:H7 (X 400), (c) mice infected with E. coli O157:H7 and then treated with gentamycin (GEN) (X 200), and (d) mice infected with E. coli O157:H7 and then treated with 100% methanolic fraction of P. obtusa (M-F) (X 200).
Table 7. Scoring of Renal Lesionsa.
| a | b | c | d | |
|---|---|---|---|---|
| subcapsular hemorrhage | – | ++ | – | – |
| interstitial hemorrhage | – | +++ | – | – |
| necrobiotic changes of tubular epithelium | – | +++ | + | + |
| interstitial inflammatory cells infiltration | – | +++++ | + | – |
| renal cast | – | ++ | + | – |
(++++/ +++) Severe, (+) moderate, (−) not present. (a) Negative control, (b) mice infected with E. coli O157:H7, (c) mice infected with E. coli O157:H7 and then treated with gentamycin (GEN), and (d) mice infected with E. coli O157:H7 and then treated with 100% methanolic fraction of P. obtusa (M-F).
2.3.3. Quantification of Bacterial Shedding and Bacterial Colonization in Kidney and Lungs
The fecal count of E. coli O157:H7 in mice feces was reduced from 2 × 10⁷ to 3 × 101 after 10 days of treatment with M-F, while that of GEN-treated mice was reduced from 1 × 10⁷ to 4 × 10³ (Figure S1 and S2). On the other hand, M-F and GEN could reduce the bacterial load of K. pneumoniae from 23 × 106 to 6 × 10² and from 30 × 106 to >300 × 102, respectively (Table 8). Counting of colonizing K. pneumoniae in lungs and the kidneys revealed a massive reduction in bacterial count to 5 × 101 in lungs and total eradication in kidneys.
Table 8. Quantification of Bacterial Loads of E. coli O157:H7 and K. pneumoniae Shedding in Feces and Bacterial Colonization in Kidney and Lungsa.
|
E. coli O157:H7 (CFU/g feces) |
K. pneumoniae (CFU/g feces) |
|||||||
|---|---|---|---|---|---|---|---|---|
| negative control | positive controlE. coli O157:H7 | E. coli then M-F | E. coli then GEN | negative control | positive control K. pneumoniae | K. pneumoniae then M-F | K. pneumoniae then GEN | |
| day zero | 2 × 10⁴ | 3 × 10⁶ | 4 × 10⁴ | 4 × 10⁶ | 36 × 101 | 22 × 102 | 16 × 102 | 36 × 102 |
| day 4 (before challenge and after treatment by streptomycin) | 2 × 101 | 1 × 10² | 0 | 1 × 101 | 10 × 101 | 1 × 10² | 1 × 101 | 1 × 101 |
| day 7 (after challenge) | 2 × 101 | 4 × 10⁹ | 2 × 10⁷ | 1 × 10⁷ | 10 × 106 | 18 × 107 | 23 × 106 | 30 × 106 |
| day 10 (after 3 successive days of treatment by GEN i.p. once daily) | 2 × 101 | 33 × 1010 | 10 × 103 | 4 × 10³ | 7 × 10⁸ | 25 × 109 | 12 × 104 | Over 300 × 102 |
| day 17 (after treatment of 7 successive days by M-F i.p. once daily) | 2 × 101 | 9 × 10¹¹ | 3 × 101 | NA | NA | NA | 6 × 10² | NA |
| kidney | 0 | 2 × 10³ | 0 | 1 × 101 | NA | NA | NA | NA |
| lung | NA | NA | NA | NA | 0 | >300 × 103 | 5 × 101 | 6 × 10² |
NA, not applicable.
3. Discussion
The World Health Organization (WHO) has made fighting antimicrobial resistance (AMR) a priority and identified K. pneumoniae and E. coli as an example of critical high-priority pathogens.49 Although both are representing normal part of the human bacteria, they can easily develop AMR.
In fact, K. pneumoniae has been identified as the most common cause of pneumonia in healthcare settings, but it can also lead to serious infections in the urinary tract and bloodstream.50,51
Also, the Shiga toxin-producing E. coli O157:H7 (STEC) is the most common foodborne pathogen and is of big concern to global food safety and public health,52,53 primarily for persons at high risk such as newborns, infants, and immunocompromised individuals in the ICU.54,55 Treatment of their infections is challenged by the alarming increase in resistance to most of the commonly used antibiotics.56
Preliminary antimicrobial activities of the different organs of P. obtusa were previously reported; essential oil, chloroform, and ethyl acetate fractions of P. obtusa flowers were active against gram-positive bacteria.23,57 Moreover, the petroleum ether, ethyl acetate, and isobutanol fractions of P. obtusa leaves were reported to demonstrate antimicrobial activities against different microbial species.22
In the present study, the antimicrobial activity of P. obtusa aerial parts against MDR bacterial strains was investigated in a bioactivity-guided manner. The total extract (TE) and its fractions (DCM-F, MW-F, and M-F) were all screened for their antibacterial activities against four MDR bacterial strains in vitro, and five major compounds (M1–M5) were isolated from the bioactive fraction (M-F) and similarly tested. On the other hand, the active fraction (M-F) demonstrated in vivo antibacterial activities in mice infected with MDR gram-negative bacteria STEC and MDR K. pneumoniae. Among the compounds isolated from M-F, 13-O-caffeoylplumieride (M5) demonstrated moderate antibacterial activity against STEC and MDR K. pneumoniae with MIC values of 32.0 and 64.0 μg/mL, respectively. While all P. obtusa-tested fractions and compounds were almost inactive against the MDR gram-positive strains tested except for plumieride (M4), which was moderately active.
We suggest that the plumieride-type iridoids M4 and M5 are the compounds responsible, at least in part, for the antibacterial activity of M-F and the total extract. Previously, variable antimicrobial activities of different extracts from genus Plumeria were reported.27
Several compounds identified in the extract of P. obtusa aerial parts such as gentisic acid (11), plumericin (14), ferulic acid (23), and hydroxybenzoic acid (27) were reported to demonstrate strong antimicrobial activities.22 Also, the HQNO and alkyl analogues identified (peaks # 33 to 37) are quorum-sensing inhibitors of the growth of MARSA and other members of the ESKAPE group.44
When M-F was evaluated in vivo, it effectively lowered the severity of renal lesions and signs of hemolytic–uremic syndrome (HUS) caused by STEC. In positive control STEC, death was likely due to translocation of Shiga toxin (Stx) into the systemic circulation after intestinal tissue damage, which stimulates proinflammatory cytokines such as TNF-α and IgM,58 and increases sensitivity of endothelial cells to Stx.59 However, treatment with M-F significantly (P ≤ 0.05) decreased the level of TNF−α and IgM, which also reflects a decrease in interstitial inflammatory cells infiltration, interstitial/subcapsular hemorrhage, and renal cast. These observations strongly guarantee the efficacy of M-F in competing for STEC and HUS if taken at the right time before it becomes irreversible.
Regarding bacterial shedding and colonization, the results presented herein collectively demonstrate that M-F effectively inhibited STEC and K. pneumoniae infection in mice. Furthermore, this is the first report on the role of M-F in the treatment of E. coli O157:H7 and MDR K. pneumoniae.
4. Conclusions
In this study, the methanolic fraction (M-F) of the total extract of P. obtusa L. (aerial parts) showed potential antimicrobial activities (in vitro and in vivo), mainly against two of the MDR gram-negative pathogens; K. pneumoniae and Shiga toxin-producing E. coli O157:H7. Also, the combined use of M-F with GEN was found to be effective in attenuating the MDR of the tested pathogens. The chemical profile of M-F was identified and plumieride-type iridoids [plumieride (M4) and 13-O-caffeoylplumieride (M5)] were isolated from M-F and demonstrated moderate antimicrobial activities against the MDR gram-negative pathogens tested. These findings suggested that M-F is a promising alternative to conventional antibiotics against MDR K. pneumoniae and Shiga toxin-producing E. coli O157:H7 (STEC) nosocomial infections. Further studies are underway in our laboratories to investigate the effect of these natural products against different MDR strains either alone or in combination with other existing antibiotics.
5. Materials and Methods
5.1. Plant Material
P. obtusa L. aerial parts were collected from the Mazhar Botanical Garden, Giza, Egypt, in October 2020. The plant material was kindly identified by Ms. Therese Labib, a Botanical Specialist and Consultant at the Orman Botanic Garden. A voucher specimen (no. 3-07-2022) was deposited at the Herbarium of Pharmacognosy, Faculty of Pharmacy, Cairo University, Cairo, Egypt. The aerial parts were washed with tap water to remove debris, dust, and solid materials and left to dry in shade. The dried aerial parts were powdered and sieved to 80 mesh, and the powder was stored in a sealed container till use.
5.2. Solvents
Solvents used in extraction and isolation procedures were supplied by Piochem Company (Cairo, Egypt) and were of analytical grade.
5.3. Chromatographic Material
Silica gel plates (Kieselgel 60, F254, 20 × 20 cm, and RP-18F254) (Merck, Darmstadt, Germany) were used for thin-layer chromatography (TLC). The spots were visualized by exposure to UV light and after spraying first with p-anisaldehyde reagent, followed by heating at 100 °C for 10 min. Flash chromatography was carried out with a PuriFlash 4100 system (Interchim, Montluçon, France).
5.4. Spectral Analysis
1H NMR and 13C NMR spectra were recorded at 400 and 100 MHz, respectively, in MeOH-d4 and DMSO-d6 using a Bruker high-performance digital NMR spectrometer (Karlsruhe, Germany) with tetramethylsilane (TMS) as the internal standard, and the chemical shifts were given in parts per million (ppm) relative to TMS.
5.5. Liquid Chromatography Diode Array Detector–Quadrupole Time-of-Flight Mass Spectrometry
5.5.1. Sample Preparation
The extract was prepared in HPLC-grade methanol, filtered, and placed into LC vials prior to analysis. The solvents used—acetonitrile, methanol, and formic acid—are of HPLC grade, and water was purified using a Milli-Q system (Millipore, Bedford, MA, USA).
5.5.2. Instrumentation
The liquid chromatographic system was an Agilent Series 1290 was used for analysis. The separation of the compounds was achieved on an Acquity UPLC HSS C18 column (100 mm × 2.1 mm I.D., 1.8 μm). The mobile phase used consisted of water with 0.1% formic acid (A) and acetonitrile with 0.1% formic acid (B) at a flow rate of 0.23 mL/min. Analysis was performed using the following gradient elution: 90% A/10% B to 35% B in 20 min, in the next 5 min to 100% B, and finally to 100% B in the next 2 min. Each run was followed by a 3 min wash with 100% B and an equilibration period of 5 min with 95% A/5% B. Two microliters of sample were injected, and the temperature of column was maintained at 40 °C.
The LC system was coupled to a QToF-MS–MS (model #G6545B, Agilent Technologies, Santa Clara, CA, USA) fitted with an electrospray ionization source (ESI) enhanced with a jet stream technology ion source (AJS) using nitrogen as the drying gas at a flow of 13 L/min and 300 °C. Nebulizer pressure was maintained at 30 psig with sheath gas at 12 L/min and 400 °C. Source voltages were set as follows: capillary voltage, 4000 V; nozzle, 0 V; skimmer, 65 V; Oct RF, 750 V; and fragmentor, 150 V. Agilent MassHunter Acquisition Software ver. A.10.1 and Mass Hunter Qualitative Analysis Software ver. B.10.00 were used to control instrument operation, data acquisition, analysis, and processing of data. Both positive and negative ion mass spectra as well as all-ion mass spectra were obtained over the range of m/z = 50 to 1700. All-ion MS data was obtained at a collision energy of 0 eV for experiment 1 and at 45 eV for experiment 2. Measured accurate masses were determined using references for positive ion MS of protonated purine (m/z = 121.0509) and HP-921; protonated hexakis (1H,1H,3H-tetrafluoropropoxy) phosphazine (m/z = 992.0098). For negative ion mass, references were deprotonated trifluoroacetic acid-TFA (m/z = 112.9856) and TFA adducted HP-921 (m/z = 1003.9881).60
5.6. Extraction and Fractionation
A sample (3.0 kg) of the powdered plant material was extracted by MeOH (3 × 7 L) using an Ultra Turrax T50 homogenizer (Germany) at room temperature for 72 h. The collected extract was filtered and evaporated under reduced pressure to give 300 g of dry residue (TE).
A part of the residue (100 g) was suspended in water (250 mL) and fractionated between dichloromethane (3 × 750 mL). The dichloromethane layer was evaporated under reduced pressure to yield a dichloromethane fraction (DCM-F, 56 g), while the water layer was applied on a column of Diaion HP-20 (80 g) and eluted with distilled water (1 L), 50% methanol–water (1.5 L), and 100% methanol (1.5 L), and fractions were evaporated under reduced pressure to yield water fraction (W-F, 15 g), 50% methanol–water fraction (MW-F, 12 g), and methanol fraction (M-F,11 g).
5.7. Isolation of Bioactive Compounds from the Methanol Fraction
Part (5.0 g) of the M-F was chromatographed on a PuriFlash column (RP-18) 4100 system (Interchim, Montlucon, France) consisting of a mixing HPLC quaternary pump, A PDA-UV–vis detector (190–840 nm), a fraction collector, and a sample loading module, and Interchim software 5.0 was used for system controlling and process monitoring. The sample was dissolved in methanol and introduced into the column via dry load. The run was started using a mixture of acetonitrile–H2O (7:3 v/v) to yield 156 test tubes (each of 10 mL). The similar subfractions were combined, evaporated, and tested by TLC to yield amorphous powders of three major compounds; kaempferol-3-O-rutinoside (M1, 64 mg) was obtained from fractions 69–75, quercetin 3-O-rutinoside (M2, 50 mg) was from fractions 55–64, and glochiflavanoside B (M3, 45 mg) was obtained from fractions 78–83. The fractions (112–124) were combined and evaporated to dryness. The residue (115 mg) was chromatographed on a PuriFlash column of silica HP using a mixture of CHCl3-MeOH (6:4 v/v), the test tubes from 23 to 33 (each of 5 mL) were combined and evaporated, and the residue (55 mg) was again purified on a Puriflash RP-18 column using H2O-MeOH (6:4 v/v) to yield a pure compound identified as plumieride (M4, 20 mg). Similarly, subfractions 138–149 were combined and evaporated, and the residue (110 mg) was again chromatographed on a PuriFlash column of RP-18 using a mixture of acetonitrile–H2O (7:3 v/v) to yield a pure amorphous powder of 13-O-caffeoyl plumieride (M5, 40 mg).
5.8. Spectral Data of the Isolated Compounds
5.8.1. Kaempferol-3-O-rutinoside (M1)
1H NMR (MeOH-d4, 400 MHz): δ 1.08 (3H, d, J = 6.0 Hz, Rha H-6), 3.29–3.84 (sugar protons), 4.87 (1H, brs, Rha H-1), 5.12 (1H, d, J = 7.5 Hz, Glc H-1), 6.22 (1H, d, J = 1.8 Hz, H-6), 6.41 (1H, d, J = 1.8 Hz, H-8), 6.88 (2H, d, J = 8.8 Hz, H-3′,5′), and 7.66 (2H, d, J = 8.4 Hz, H-2′,6′). 13C NMR (MeOH-d4, 100 MHz): δ 157.9 (C-2), 144.4 (C-3), 178.0 (C-4), 163.0 (C-5), 98.5 (C-6), 164.6 (C-7), 93.4 (C-8), 157.0 (C-9), 104.2 (C-10), 122.1 (C-1′), 134.2 (C-2′, C-6′), 116.2 (C-3′, C-5′), 103.3 (C-1″), 72.5 (C-2″), 75.8 (C-3″), 70.0 (C-4″), 76.7 (C-5″), 67.1 (C-6″), 101.0 (C-1″′), 70.9 (C-2″′), 71.2 (C-3″′), 74.3 (C-4″′), 68.3 (C-5″′), 16.5 (Rha-C-6″′). 161.5 (C-4′).
5.8.2. Quercetin-3-O-rutinoside (M2)
1H NMR (MeOH-d4, 400 MHz): δ 1.14 (3H, d, J = 6.0 Hz, Rha H-6), 3.28–3.89 (sugar protons), 4.50 (1H, brs, Rha H-1), 5.13 (1H, d, J = 6.84, Glc H-1), 6.20 (1H, d, J = 1.8 Hz, H-6), 6.40 (1H, d, J = 1.8 Hz, H-8), 7.00 (1H, d, J = 8.0 Hz, H-5′), 7.80 (1H, brd, J = 8.0 and 1.8 Hz, H-6′), 8.01 (1H, d, J = 1.8 Hz, H-2′). 13C NMR (MeOH-d4, 100 MHz): δ 158.0 (C-2), 131.0 (C-3), 177.99 (C-4), 161.5 (C-5), 98.6 (C-6), 164.6 (C-7), 93.5 (C-8), 157.1 (C-9), 104.2 (C-10), 121.3 (C-1′), 116.0 (C-2′), 146 (C-3′), 160.0 (C-4′), 116.0 (C-5′), 121.3 (C-6′), 103.2 (C-1″), 74.3 (C-2″), 75.8 (C-3″), 70.7 (C-4″), 76.7 (C-5″), 67.1 (C-6″), 101.0 (C-1″′), 70.9 (C-2″′), 72.5 (C-3″′), 73.5 (C-4″′), 68.3 (C-5″′), 16.5 (C-6″′).
5.8.3. Glochiflavanoside B (M3)
1H NMR (DMSO-d6, 400 MHz): δ 3.95 (1H, d, J = 6, H-3), 2.50 (1H, dd, J = 9.0, 16.0 Hz, H-4a), 2.90 (1H, dd, J = 6.0, 16.0 Hz, H-4b), 6.29 (1H, d, J = 1.6 Hz, H-6), 6.37 (1H, d, J = 1.4 Hz, H-8), 6.65 (2H, s, H-2′ and H-6′), 3.75 (3H, s, C5-OMe), 3.93 (6H, s, C3′-OMe and C5′-OMe). 13C NMR (DMSO-d6, 100 MHz): δ 82.3 (C-2), 66.3 (C-3), 28.9 (C-4), 156.7 (C-5), 94.9 (C-6), 159.3 (C-7), 94.8 (C-8), 155.5 (C-9), 103.5 (C-10), 129.5 (C-1′), 105.7 (C-2′), 148.1 (C-3′), 135.8 (C-4′), 148.1 (C-5′), 105.7 (C-6′), 101.1 (C-1″), 73.76 (C-2″), 77.1 (C-3″), 70.3 (C-4″), 77.5 (C-5″), 61.2 (C-6″), 56.0 (C5-OMe), and 56.4 (C3′ and C5′-OMe).
5.8.4. Plumieride (M4)
1H NMR (MeOH-d4, 400 MHz): δ 5.28 (1H, d, J = 6.0 Hz, H-1), 7.52 (1H, d, J = 1.2 Hz, H-3), 3.95 (1H, dd, J = 1.6, 9.5 Hz, H-5), 6.48 (1H, dd, J = 2, 6.0 Hz, H-6), 5.54 (1H, dd, J = 1.9,7.5 Hz, H-7), 7.39 (1H, d, J = 2.0 Hz, H-10), 4.86 (s, H-1′), 4.54 (dd, J = 2.0, 6.0 Hz, H-13), 3.88 (1H, d, H-6′). 3.69 (3H, s, C16-Me), 3.37 (1H, dd, J = 6.0, 9.1 Hz, H-9), 2.93–3.33 (H-2′ to H-5′, m), 1.41 (3H, d, J = 6.5, C14-Me). 13C NMR (MeOH-d4, 100 MHz): 92.4 (C-1), 151.4 (C-3),109.5 (C-4), 40.5 (C-5), 140.0 (C-6), 151.4 (C-7), 96.2 (C-8), 49.0 (C-9), 148.8 (C-10), 137.8 (C-11), 170.9 (C-12), 61.6 (C-13), 22.7 (C-14), 166.6 (C-15), 51.7 (C-16), 98.7 (C-1′), 73.4 (C-2′),77.7 (C-3′), 70.2 (C-4′), 76.8 (C-5′), 61.3 (C-6′).
5.8.5. 13-O-Caffeoylplumieride (M5)
1H NMR (DMSO-d6, 400MHz): δ 5.59 (1H, d, J = 5.6 Hz, H-1), 7.53 (1H, d, J = 3.4 Hz, H-3), 3.88 (td, J = 7.2 and 1.8 Hz, H-5), 6.41 (dd, J = 5.0 and 2.2 Hz, H-6), 5.20 (1H, dd, J = 5.0, 1.9 Hz, H-7), 3.04 (1H, brd, H-9), 8.43 (1H, s, H-10), 1.47 (1H, d, J = 6.6 Hz, H-14), 3.69 (3H, s, C16-Me), 5.36 (1H, d, J = 7.5 Hz, Glu-H-1′), 3.97–4.38 (sugar protons, m). Caffeoyl protons: δ 7.48 (1H, d, J = 1.0 Hz, H-2′), 7.07 (1H, s, H-5′),7.00 (1H, d, J = 7.8 Hz, H-6′), 7.58 (1H, d, J = 15.5 Hz, H-7′), 6.70 (1H, d, J = 15.5 Hz, H-8′). 13C NMR (DMSO-d6, 100 MHz): δ 92.6 (C-1), 151.9 (C-3), 109.0 (C-4), 40.4 (C-5), 141. (C-6), 128.9 (C-7), 96.8 (C-8), 49.4 (C-9), 151.1 (C-10), 132.7 (C-11), 170.1 (C-12), 64.3 (C-13), 19.4 (C-14), 166.7 (C-15), 51.8 (C-16), 98.7 (C-1′), 73.6 (C-2′), 76.8 (C-3′), 70.5 (C-4′), 77.8 (C-5′), 61.5 (C-6′). Caffeoyl moiety: δ 125.6, 113.6, 149.4, 146.4, 115.2, 122.1, 146.2, 116.2, 166.1.
5.9. Biological Assays
5.9.1. In Vitro Studies
5.9.1.1. Bacterial Strains and Growth Conditions
The bacterial strains used in the biological assay were multidrug-resistant Shiga toxin-producing (STEC) E. coli O157:H7, methicillin-resistant S. aureus previously phenotypically and genotypically identified,56 multidrug-resistant B. cereus, and multidrug-resistant K. pneumoniae isolated from the intensive care unit of a tertiary care hospital in Cairo. Agarose gel photo documentation of conventional PCR on genetic material extracted from MRSA isolate as a molecular typing for detection of mecA gene using forward primer: GTA GAA ATG ACT GAA CGT CCG ATA A and reverse primer: CCA ATT CCA CAT TGT TTC GGT CTA A were done (Figure S3).56 Furthermore, agarose gel photo documentation of conventional PCR on genetic material extracted from STEC isolate as a molecular typing for detection of blaSHV gene using forward primer: TCGCCTGTGTATTATCTCCC and reverse primer: CGCAGATAAATCACCACAATG were done (Figure S4). All laboratory works were performed according to CLSI guidelines (CLSI. 2014, 2014).
5.10. Culture Media
Nutrient agar containing bromocresol purple was used to activate B. cereus, while nutrient agar was used for other bacteria. For the agar diffusion experiments, Sabouraud Dextrose Agar (Oxoid) was employed. The Mueller Hinton Agar (MHA) medium (Biolab) was used for disc diffusion assay, while the Mueller Hinton broth containing 0.05% phenol red and supplemented with 10% glucose was used for the minimal inhibition concentration (MIC).61 TBX chromogenic agar media and Mackonkey agar were used for the fecal counts of E. coli O157:H7 and K. pneumoniae, respectively.
5.11. Screening for Multidrug-Resistant Bacteria
All bacterial cultures were first grown on 5% blood agar plates at 37 °C for 18–24 h before inoculation onto the MHA. Few colonies (3 to 5) of similar morphology to the respective bacteria were transferred with a sterile inoculating loop to a liquid medium until adequate growth of turbidity with McFarland in 0.5. The bacterial suspension was then streaked onto MHA plates using a sterile swab in such a way as to ensure thorough coverage of the plates and a uniform thick lawn of growth following incubation. The susceptibilities of clinical isolates were tested by using the MHA impregnated with a range of antimicrobial agents. Dilutions of overnight broth cultures were inoculated onto antibiotic-containing plates to yield final inoculums of approximately 106 CFU per spot according to CLSI protocol guidelines for Enterobacteriaceae. Selected multidrug-resistant strains, K. pneumoniae and E. coli, were screened for their resistance for more than two different classes of antibiotics following the disk diffusion method protocol (as in the CLSI guidelines) and WHO recommendations.
5.12. Antibacterial Assay
5.12.1. Agar Disc-Diffusion Method
Antimicrobial activities of TE, DCM-F, MW-F, and M-F were first screened for their inhibitory zone by the agar disc-diffusion method.62 Standard commercial antibiotic discs, gentamycin (10 μg) (GEN) and neomycin (30 μg) (NEO) for gram-negative bacteria and vancomycin (30 μg) and amikacin (30 μg) for gram-positive bacteria, were used as a positive control, while a disc impregnated with 0.2% DMSO was used as the negative control. To test the synergistic or antagonistic effect between our tested samples and traditional antibiotics, gentamycin, neomycin, vancomycin, and penicillin discs were impregnated with plant samples. The assay was repeated using plant extract alone, antibiotics alone, or a combination between them by the disk diffusion method.62−64 The results were recorded by measuring the zone of growth inhibition (mm) surrounding the discs. The plates were incubated at 37 °C for 24 h, after which zones of inhibition around the discs were observed and measured. The tests were performed in triplicates and repeated twice (CLSI, 2018, 2020).
5.12.2. Minimum Inhibitory Concentration
The minimum inhibitory concentration (MIC), the lowest concentration of the sample that inhibits the visible growth of a microbe, was determined by the microbroth dilution method.65,66 TE, DCM-F, MW-F, and M-F were dissolved in DMSO to obtain a concentration of 2 mg/mL (2000 μg /mL), and then different concentrations were prepared by two-fold serial dilution to give 12 dilutions from 4096 to 2 μg/mL. Positive controls (gentamycin or vancomycin) were serially diluted from 64 to 0.12 μg/mL. According to the results of MIC, if MIC < 100 μg/mL, the compound is considered significantly active; if MIC < 625 μg /mL, the compound is moderately active; and if MIC ≥ 625 μg/mL, then the compound is weakly active.65,66
5.13. In Vivo Study
5.13.1. Acute Toxicity Study
Twenty-four adult Swiss albino mice weighting 20–25 g were divided into four groups to estimate the acute toxicity at different methanol fraction concentrations (12.5, 25, and 50 mg/kg b. wt., i.p.). The animals were observed for 10 days. No dead mice were observed along the experimental period, indicating that the extract is safe. Therefore, we selected a dose of 25 mg/kg b. wt. for the in vivo study.
5.13.2. Mouse Model of Infection
We implemented a previously described oral infection model for E. coli O157:H7,67 and the i.p. infection model for K. pneumoniae was performed as previously described68 with minor modification. Briefly, six groups of 6- to 8-week-old CD-1 male mice (6 mice/group) were fed orally by a stomach gavage with an infection dose of 108 CFU of E. coli and injected intraperitoneally with an infection dose of 106 CFU K. pneumoniae suspended in LB broth containing 20% sucrose in addition to a control group given LB broth with no bacterial cells. The mice were housed in an air-conditioned room with a 12 h light/12 h dark cycle. All animal experiments were performed in accordance with the Ethics Committee of the Faculty of Pharmacy, Ahram Canadian University, Egypt (REC0722).
5.14. In Vivo Assessment of the Antibacterial Activity of M-F
For our knowledge, this was the first in vivo assessment of M-F antibacterial activity, so we followed references with modifications and prolonged the treatment period by M-F to be able to compare its efficacy and monitor bacterial loads by quantification of fecal count for both gentamycin and M-F.
Animals were fed a commercial rodent diet with free access to drinking water. Mice were divided into seven groups, each with six mice: Group 1, negative control (received no bacterial infection and no treatment and received 0.4 mL saline instead); Group 2, positive control infected by K. pneumoniae and received no treatment; Group 3, positive control infected by E. coli O157:H7 and received no treatment; Group 4, infected by K. pneumoniae and then treated with M-F (25 mg/kg); Group 5, infected by K. pneumoniae and then treated with GEN (33 mg/kg); Group 6, infected by E. coli O157:H7 and then treated with M-F (25 mg/kg, i.p.); and finally, Group 7, infected by E. coli O157:H7 and then treated with GEN (33 mg/kg, i.p.). Experimental infection of Groups 2, 4, and 5 were by K. pneumoniae, while groups 3,6 and 7 were infected by E. coli O157:H7 once daily for 3 days,69 and then cages 4 and 6 received M-F (25 mg/kg, i.p.) for 10 days. Cages 5 and 7 were treated with gentamycin for 3 days. All mice were euthanized 14 days post-infection. Four mice from each group were dissected, and kidneys and large intestines were isolated from cages 1, 3, 6, and 7, while lungs were isolated from cages 1, 2,4 and 5. All organs were subjected to further histopathological examination.70 Organs were examined and compared to the control group. They were scored according to the extent of different pathological features.
5.15. Assessment of Cytokine TNF-α and IgM Serum Levels
Serum samples were stored at −80 °C until they were processed for cytokine analysis. Levels of tumor necrosis factor-alpha (TNF-α) and immunoglobulin M (IgM) were quantified using fluorescent-labeled microspheres (Fluorokine MAP System; R&D Systems, Wiesbaden-Nordenstadt, Germany) and a Luminex 100 instrument (Luminex BV, Oosterhout, the Netherlands). All procedures closely followed the manufacturer’s instructions.
5.16. Quantification of Bacterial Shedding of K. pneumoniae
To quantify bacterial shedding, mice were removed from their housing and placed into isolation containers. Fecal pellets (0.02 g; approximately 2 pellets) were collected and placed into a 2 mL screw-cap tube (Fisherbrand; 02-682-558) along with at least two glass beads (BioSpec; 11,079,127). Samples were diluted 1:10 (weight/volume) in PBS. A Bead Mill 24 homogenizer (Fisherbrand) was used to homogenize the fecal pellets (2.1 power setting, 1 min). Afterward, the tubes were spun in a mini-centrifuge (Thermo Scientific; MySpin 6) to pellet out larger debris. Ten-fold serial dilutions were plated from the supernatant on appropriate antibiotic plates and incubated overnight at 30 °C. Bacterial shedding was calculated in CFU per gram of feces by platting on MacConkey agar media.
5.17. Quantification of Bacterial Shedding of STEC
This procedure followed the standard method of ISO 16649-2: 2001. The preparation of test samples, initial suspension and dilution were performed according to ISO 6887 (ISO, 2003). Two sterile Petri dishes were prepared for each dilution. Then, 1 mL of the test sample was added to the center of each dish. This procedure was repeated with the further dilutions using a sterile pipette to inoculate each dilution. From TBX medium, 15 mL (at 44–47 °C) were poured into each dish. The time elapsing between the end of the preparation of the initial suspension (or of the 10–1 dilution if the product was liquid) and the moment when the medium was poured into the dishes did not exceed 15 min. Finally, the inoculum was carefully mixed with the medium, and the mixture was allowed to solidify before the prepared dishes were inverted and incubated in the incubator set at 44 °C for 18–24 h.
5.18. Enumeration
The typical blue colonies (less than 150 CFU) and less than 300 total (typical and non-typical) CFU was counted.
5.18.1. Expression of Results
The number of E. coli O157:H7 per milliliter or per gram, N, was calculated using the following equation:
Σc is the sum of the characteristic colonies counted on all the dishes retained, n1 is the number of dishes retained in the first dilution, n2 is the number of dishes retained in the second dilution, and d is the dilution factor corresponding to the first dilution.
5.19. Statistical Analysis
Means ± the standard deviation of the mean (SD) were calculated, and ANOVA/Newman–Keuls post-hoc tests were performed using GraphPad Prism software (version 6.01; Graph-Pad Software Inc., San Diego, CA, USA). Results with p values of <0.05 were considered significant.
Acknowledgments
The authors are grateful to Dr. Fatma M. Darwish, Veterinary Pathology Department, Animal and Health Research Institute, Egypt for conducting the histopathology experiment, to Professor Amina A. Dessouki, Faculty of Veterinary Medicine, Suez Canal University, Ismailia, Egypt for revising the histopathology results and for critical comments, and to Dr. Asmaa F. Aboul Naser, Therapeutic Chemistry Department, National Research Centre, Egypt for conducting the acute toxicity assay of M-F.
Supporting Information Available
The Supporting Information is available free of charge at https://pubs.acs.org/doi/10.1021/acsomega.2c06803.
(Figure S1) Quantification of E. coli O157:H7 on TBX media; (Figure S2) quantification of K. pneumoniae on MacConkey agar media; (Figures S3 and S4) agarose gel photo documentation of conventional PCR on genetic material extracted from MRSA isolate and E. coli O157:H7 strains, respectively (PDF)
The authors declare no competing financial interest.
Supplementary Material
References
- Kraker M. E. A. D. Burden of disease associated with antimicrobial resistance. J. Antimicrob. Chemother. 2011, 66, 398–407. [DOI] [PubMed] [Google Scholar]
- Atanasov A. G.; Zotchev S. B.; Dirsch V. M.; Supuran C. T. Natural products in drug discovery: advances and opportunities. Nat. Rev. Drug Discovery 2021, 20, 200–216. 10.1038/s41573-020-00114-z. [DOI] [PMC free article] [PubMed] [Google Scholar]
- Sellera F. P.; Da Silva L. C.; Lincopan N. Rapid spread of critical priority carbapenemase-producing pathogens in companion animals: a One Health challenge for a post-pandemic world. J. Antimicrob. Chemother. 2021, 76, 2225–2229. 10.1093/jac/dkab169. [DOI] [PubMed] [Google Scholar]
- Al Salman J.; Al Dabal L.; Bassetti M.; Alfouzan W. A.; Al Maslamani M.; Alraddadi B.; Elhoufi A.; Enani M.; Khamis F. A.; Mokkadas E.; et al. Management of infections caused by WHO critical priority Gram-negative pathogens in Arab countries of the Middle East: a consensus paper. Int. J. Antimicrob. Agents 2020, 56, e106104 10.1016/j.ijantimicag.2020.106104. [DOI] [PubMed] [Google Scholar]
- Fawazy N. G.; Panda S. S.; Mostafa A.; Kariuki B. M.; Bekheit M. S.; Moatasim Y.; Kutkat O.; Fayad W.; El-Manawaty M. A.; Soliman A.; et al. Development of spiro-3-indolin-2-one containing compounds of antiproliferative and anti-SARS-CoV-2 properties. Sci. Rep. 2022, 12, 1–21. 10.1038/s41598-022-17883-9. [DOI] [PMC free article] [PubMed] [Google Scholar]
- Srour A. M.; Dawood D. H.; Nossier E. S.; El-Shiekh R. A.; Mahmoud A. E.; Hussien A. G.; Omran M. M.; Ali M. M. Design, Synthesis and Molecular Docking Simulation of Oxindole-Based Derivatives with Dual VEGFR-2 and Cholinesterase Inhibitory Activities. J. Mol. Struct. 2023, 1271, e134130 10.1016/j.molstruc.2022.134130. [DOI] [Google Scholar]
- Alves H.; Cruz F.; de Assis P.; Pessoa J.; Trevelin L. C.; de O. Leal A. M.; de Sousa C. Antibiotic resistance among Escherichia coli: Isolates and novel approaches to the control of E. coli infections. Recent Advances on Physiology, Pathogenesis and Biotechnological Applications. Intech Open; London (UK) 2017, 99–122. 10.5772/67400. [DOI] [Google Scholar]
- Tigabu A.; Getaneh A. Staphylococcus aureus, ESKAPE bacteria challenging current health care and community settings: a literature review. Clin. Lab. 2021, 67, 10–7754. 10.7754/Clin.Lab.2020.200930. [DOI] [PubMed] [Google Scholar]
- Hamam S. S.; Sakr A. A.; Zahran W. A.; El Kholy R. M.; Kasemy Z. A.; Ibrahem R. A.; Sakr M. A.; Younis F. E. Health care-associated infections at an Egyptian tertiary care hospital: A 2-year prospective study. MMJ 2021, 34, 514–520. 10.4103/mmj.mmj_455_20. [DOI] [Google Scholar]
- Venmugil P.; Kumar M. S. Healthcare Associated Infection in Paediatric Intensive Care Unit-A Tertiary Care Hospital Experience. JCDR 2018, 12, SC10–SC13. 10.7860/JCDR/2018/30245.11215. [DOI] [Google Scholar]
- Deep A.; Ghildiyal R.; Kandian S.; Shinkre N. Clinical and microbiological profile of nosocomial infections in the pediatric intensive care unit (PICU). Indian Pediatr. 2004, 41, 1238–1246. [PubMed] [Google Scholar]
- Al Bshabshe A.; Al-Hakami A.; Alshehri B.; Al-Shahrani K. A.; Alshehri A. A.; Al Shahrani M. B.; Assiry I.; Joseph M. R.; Alkahtani A.; Hamid M. E. Rising Klebsiella pneumoniae infections and its expanding drug resistance in the intensive care unit of a tertiary Healthcare Hospital, Saudi Arabia. Cureus 2020, 12, e10060 10.7759/cureus.10060. [DOI] [PMC free article] [PubMed] [Google Scholar]
- Gootz T. D. Discovery and development of new antimicrobial agents. Clin. Microbiol. Rev. 1990, 3, 13–31. 10.1128/CMR.3.1.13. [DOI] [PMC free article] [PubMed] [Google Scholar]
- Moellering R. C. Jr. Discovering new antimicrobial agents. Int. J. Antimicrob. Agents 2011, 37, 2–9. 10.1016/j.ijantimicag.2010.08.018. [DOI] [PubMed] [Google Scholar]
- Stokes J. M.; Yang K.; Swanson K.; Jin W.; Cubillos-Ruiz A.; Donghia N. M.; MacNair C. R.; French S.; Carfrae L. A.; Bloom-Ackermann Z.; Tran V. M.; Chiappino-Pepe A.; Badran A. H.; Andrews I. W.; Chory E. J.; Church G. M.; Brown E. D.; Jaakkola T. S.; Barzilay R.; Collins J. J. A deep learning approach to antibiotic discovery. Cell 2020, 180, 688–702.e13. 10.1016/j.cell.2020.01.021. [DOI] [PMC free article] [PubMed] [Google Scholar]
- Hart E. M.; Mitchell A. M.; Konovalova A.; Grabowicz M.; Sheng J.; Han X.; Rodriguez-Rivera F. P.; Schwaid A. G.; Malinverni J. C.; Balibar C. J.; Bodea S.; Si Q.; Wang H.; Homsher M. F.; Painter R. E.; Ogawa A. K.; Sutterlin H.; Roemer T.; Black T. A.; Rothman D. M.; Walker S. S.; Silhavy T. J. A small-molecule inhibitor of BamA impervious to efflux and the outer membrane permeability barrier. PNAS 2019, 116, 21748–21757. 10.1073/pnas.1912345116. [DOI] [PMC free article] [PubMed] [Google Scholar]
- Hegeto L. A.; Caleffi-Ferracioli K. R.; Perez de Souza J.; Almeida A. L. d.; Nakamura de Vasconcelos S. S.; Barros I. L. E.; Canezin P. H.; Campanerut-Sá P. A. Z.; Scodro R. B. d. L.; Siqueira V. L. D.; Teixeira J. J. V.; Cardoso R. F. Promising antituberculosis activity of piperine combined with antimicrobials: a systematic review. MDR 2019, 25, 120–126. 10.1089/mdr.2018.0107. [DOI] [PubMed] [Google Scholar]
- Razak N. I. A.; Hassan S. S. S.; Nasir N. A. H. A.. Ethnobotanical Study on Flowering Plants Along with Phytochemicals and Antioxidants Analysis on Selected Plumeria Species. In Charting the Sustainable Future of ASEAN in Science and Technology, Springer, 2020; pp. 227–235. [Google Scholar]
- Van Den Berghe D.; Ieven M.; Mertens F.; Vlietinck A. Screening of higher plants for biological activities. II. Antiviral activity. Lloydia 1978, 41, 463–471. [PubMed] [Google Scholar]
- Bihani T.; Mhaske N. Evaluation of in vivo wound healing activity of Plumeria obtusa L.(Champa) spray in rats. Wound Med. 2020, 28, 100176. 10.1016/j.wndm.2019.100176. [DOI] [Google Scholar]
- Wong S. K.; Lim Y. Y.; Abdullah N. R.; Nordin F. J. Antiproliferative and phytochemical analyses of leaf extracts of ten Apocynaceae species. Pharm. Res. 2011, 3, 100–106. 10.4103/0974-8490.81957. [DOI] [PMC free article] [PubMed] [Google Scholar]
- Nasir A.; Dawood A.; Jehan B.; Shahen S.; Farman U. Antimicrobial activity of leaves extracted samples from medicinally important Plumeria obtusa. J. Med. Plant Res. 2013, 7, 1146–1153. [Google Scholar]
- Ali N.; Junaid M.; Ahmad D.; UrRahman M.; Ali N.; Katzenmeier G. Antibacterial and antifungal activity of solvent extracts from Plumeria obtusa Linn. Trop. Biomed. 2014, 31, 607–615. [PubMed] [Google Scholar]
- Talpade M. Anti-Microbial Activity of Ixora alba, Plumeria obtusa and Psidium guajava. Int. J. Microbiol. ISSN 2015, 0975–5276. [Google Scholar]
- Hassan E. M.; Shahat A. A.; Ibrahim N. A.; Vlietinck A. J.; Apers S.; Pieters L. A new monoterpene alkaloid and other constituents of Plumeria acutifolia. Planta Med. 2008, 74, 1749–1750. 10.1055/s-0028-1088317. [DOI] [PubMed] [Google Scholar]
- Ye G.; Li Z. X.; Xia G. X.; Peng H.; Sun Z. L.; Huang C. G. A new iridoid alkaloid from the flowers of Plumeria rubra L. cv. acutifolia. Helv. Chim. Acta 2009, 92, 2790–2794. 10.1002/hlca.200900222. [DOI] [Google Scholar]
- Kuigoua G. M.; Kouam S. F.; Ngadjui B. T.; Schulz B.; Green I. R.; Choudhary M. I.; Krohn K. Minor secondary metabolic products from the stem bark of Plumeria rubra Linn. displaying antimicrobial activities. Planta Med. 2010, 76, 620–625. 10.1055/s-0029-1240611. [DOI] [PubMed] [Google Scholar]
- Sharma G.; Chahar M. K.; Dobhal S.; Sharma N.; Sharma T. C.; Sharma M. C.; Joshi Y. C.; Dobhal M. P. Phytochemical constituents, traditional uses, and pharmacological properties of the genus Plumeria. Chem. Biodiversity 2011, 8, 1357–1369. 10.1002/cbdv.201000159. [DOI] [Google Scholar]
- Saengsai J.; Kongtunjanphuk S.; Yoswatthana N.; Kummalue T.; Jiratchariyakul W. Antibacterial and antiproliferative activities of plumericin, an iridoid isolated from Momordica charantia vine. Evidence-Based Complementary Altern. Med. 2015, 2015, 823178. 10.1155/2015/823178. [DOI] [PMC free article] [PubMed] [Google Scholar]
- Boonclarm D.; Sornwatana T.; Arthan D.; Kongsaeree P.; Svasti J. β-Glucosidase catalyzing specific hydrolysis of an Iridoid β-glucoside from Plumeria obtusa. ABBS 2006, 38, 563–570. 10.1111/j.1745-7270.2006.00196.x. [DOI] [PubMed] [Google Scholar]
- Afifi M. S.; Salama O. M.; Gohar A. A.; Marzouk A. M. Iridoids with antimicrobial activity from plumeria alba L. J. Pharm. Sci. Assiut 2006, 29, 215–223. 10.21608/bfsa.2006.65194. [DOI] [Google Scholar]
- Patil C. D.; Patil S. V.; Borase H. P.; Salunke B. K.; Salunkhe R. B. Larvicidal activity of silver nanoparticles synthesized using Plumeria rubra plant latex against Aedes aegypti and Anopheles stephensi. Parasitol. Res. 2012, 110, 1815–1822. 10.1007/s00436-011-2704-x. [DOI] [PubMed] [Google Scholar]
- Siddiqui B. S.; Naeed A.; Begum S.; Siddiqui S. Minor iridoids from the leaves of Plumeria obtusa. Phytochemistry 1994, 37, 769–771. 10.1016/S0031-9422(00)90355-8. [DOI] [Google Scholar]
- Hamburger M. O.; Cordell G. A.; Ruangrungsi N. Traditional medicinal plants of Thailand XVII Biologically active constituents of Plumeria rubra. J. Ethnopharmacol. 1991, 33, 289–292. 10.1016/0378-8741(91)90091-Q. [DOI] [PubMed] [Google Scholar]
- Kaisoon O.; Siriamornpun S.; Weerapreeyakul N.; Meeso N. Phenolic compounds and antioxidant activities of edible flowers from Thailand. J. Funct. Foods 2011, 3, 88–99. 10.1016/j.jff.2011.03.002. [DOI] [Google Scholar]
- Khadem S.; Marles R. J. Monocyclic phenolic acids; hydroxy-and polyhydroxybenzoic acids: occurrence and recent bioactivity studies. Molecules 2010, 15, 7985–8005. 10.3390/molecules15117985. [DOI] [PMC free article] [PubMed] [Google Scholar]
- Vandal J.; Abou-Zaid M. M.; Ferroni G.; Leduc L. G. Antimicrobial activity of natural products from the flora of Northern Ontario, Canada. Pharm Biol. 2015, 53, 800–806. 10.3109/13880209.2014.942867. [DOI] [PubMed] [Google Scholar]
- Mohamed Isa S. S. P.; Ablat A.; Mohamad J. The antioxidant and xanthine oxidase inhibitory activity of Plumeria rubra flowers. Molecules 2018, 23, 400. 10.3390/molecules23020400. [DOI] [PMC free article] [PubMed] [Google Scholar]
- Negri G.; Santi D.; Tabach R. Chemical composition of hydroethanolic extracts from Siparuna guianensis, medicinal plant used as anxiolytics in Amazon region. Rev. Bras. Farmacogn. 2012, 22, 1024–1034. 10.1590/S0102-695X2012005000034. [DOI] [Google Scholar]
- Orekhov A.; Panossian A. Trihydroxyoctadecadienoic acids exhibit antiatherosclerotic and antiatherogenic activity. Phytomedicine 1994, 1, 123–126. 10.1016/S0944-7113(11)80029-2. [DOI] [PubMed] [Google Scholar]
- Lépine F.; Milot S.; Déziel E.; He J.; Rahme L. G. Electrospray/mass spectrometric identification and analysis of 4-hydroxy-2-alkylquinolines (HAQs) produced by Pseudomonas aeruginosa. JASMS 2004, 15, 862–869. 10.1016/j.jasms.2004.02.012. [DOI] [PubMed] [Google Scholar]
- Kim H.; Hwang J.-Y.; Chung B.; Cho E.; Bae S.; Shin J.; Oh K.-B. 2-Alkyl-4-hydroxyquinolines from a marine-derived Streptomyces sp. inhibit hyphal growth induction in Candida albicans. Mar. Drugs 2019, 17, 133. 10.3390/md17020133. [DOI] [PMC free article] [PubMed] [Google Scholar]
- Machan Z. A.; Taylor G. W.; Pitt T. L.; Cole P. J.; Wilson R. 2-Heptyl-4-hydroxyquinoline N-oxide, an antistaphylococcal agent produced by Pseudomonas aeruginosa. J. Antimicrob. Chemother. 1992, 30, 615–623. 10.1093/jac/30.5.615. [DOI] [PubMed] [Google Scholar]
- Yoshikawa M.; Murakami T.; Shimada H.; YOSHIZUMI S.; SAKA M.; YAMAHARA J.; MATSUDA H. Medicinal foodstuffs. XIV. On the bioactive constituents of moroheiya.(2): New fatty acids, corchorifatty acids A, B, C, D, E, and F, from the leaves of Corchorus olitorius L.(Tiliaceae): Structures and inhibitory effect on NO production in mouse peritoneal macrophages. Chem. Pharm. Bull. 1998, 46, 1008–1014. 10.1248/cpb.46.1008. [DOI] [PubMed] [Google Scholar]
- Zhao M.; Liang Z.; Xie Z.; Yang D.; Xu X. Separation and purification of 15-demethylplumieride, cerberic acid B, and kaempferol-3-rutinoside from plumeria rubra ‘acutifolia’by high-speed counter-current chromatography. Sep. Sci. Technol. 2015, 50, 2360–2366. 10.1080/01496395.2015.1056357. [DOI] [Google Scholar]
- Akhtar N.; Saleem M.; Riaz N.; Ali M. S.; Yaqoob A.; Jabbar A. Isolation and characterization of the chemical constituents from Plumeria rubra. Phytochem. Lett. 2013, 6, 291–298. 10.1016/j.phytol.2013.03.007. [DOI] [Google Scholar]
- Coppen J. J.; Cobb A. L. The occurrence of iridoids in Plumeria and Allamanda. Phytochemistry 1983, 22, 125–128. 10.1016/S0031-9422(00)80071-0. [DOI] [Google Scholar]
- Abe F.; Chen R.-F.; Yamauchi T. Minor iridoids from the roots of Plumeria acutifolia. Chem. Pharm. Bull. 1988, 36, 2784–2789. 10.1248/cpb.36.2784. [DOI] [Google Scholar]
- Freitas L. C.; de Sordi M. R. L.; Malavasi M. M. S.; de Freitas H. C. L.. Avaliação educacional: caminhando pela contramão; Editora Vozes Limitada, 2017. [Google Scholar]
- Martin R. M.; Bachman M. A. Colonization, infection, and the accessory genome of Klebsiella pneumoniae. Front. Cell. Infect. Microbiol. 2018, 8, 4. 10.3389/fcimb.2018.00004. [DOI] [PMC free article] [PubMed] [Google Scholar]
- Khairy R. M.; Mahmoud M. S.; Shady R. R.; Esmail M. A. M. Multidrug-resistant Klebsiella pneumoniae in hospital-acquired infections: Concomitant analysis of antimicrobial resistant strains. Int. J. Clin. Pract. 2020, 74, e13463 10.1111/ijcp.13463. [DOI] [PubMed] [Google Scholar]
- Scott M. E.; Mbandi E.; Buchanan S.; Abdelmajid N.; Gonzalez-Rivera C.; Hale K. R.; Jacobsen L.; Webb J.; Green J.; Dolan P. Salmonella and Shiga toxin–producing Escherichia coli in products sampled in the food safety and inspection service raw pork baseline study. J. Food Prot. 2020, 83, 552–559. 10.4315/0362-028X.JFP-19-360. [DOI] [PubMed] [Google Scholar]
- Toval F.; Köhler C.-D.; Vogel U.; Wagenlehner F.; Mellmann A.; Fruth A.; Schmidt M. A.; Karch H.; Bielaszewska M.; Dobrindt U. Characterization of Escherichia coli isolates from hospital inpatients or outpatients with urinary tract infection. J. Clin. Microbiol. 2014, 52, 407–418. 10.1128/JCM.02069-13. [DOI] [PMC free article] [PubMed] [Google Scholar]
- Guerrant R. L.; Van Gilder T.; Steiner T. S.; Thielman N. M.; Slutsker L.; Tauxe R. V.; Hennessy T.; Griffin P. M.; DuPont H.; Bradley Sack R. Practice guidelines for the management of infectious diarrhea. Clin. Infect. Dis. 2001, 32, 331–351. 10.1086/318514. [DOI] [PubMed] [Google Scholar]
- Bhatta D. R.; Hosuru Subramanya S.; Hamal D.; Shrestha R.; Gauchan E.; Basnet S.; Nayak N.; Gokhale S. Bacterial contamination of neonatal intensive care units: How safe are the neonates?. Antimicrob Resist Infect Control 2021, 10, 1–6. 10.1186/s13756-021-00901-2. [DOI] [PMC free article] [PubMed] [Google Scholar]
- Elshimy R.; Zedan H.; Elmorsy T. H.; Khattab R. A. A Study on Multidrug-Resistant Escherichia coli Clinical Isolates from Different Hospitals in Greater Cairo. MDR 2021, 27, 1420–1432. 10.1089/mdr.2020.0521. [DOI] [PubMed] [Google Scholar]
- Sulaiman S. F.; Yaacob S. S.; Tan M.; Tengku Muhammad T. Chemical components of the essential oils from three species of Malaysian Plumeria L. and their effects on the growth of selected microorganisms. J. Biosci. 2008, 19, 1–7. [Google Scholar]
- Pearson J. S.; Hartland E. L. The inflammatory response during enterohemorrhagic Escherichia coli infection. Enterohemorrhagic Escherichia coli and Other Shiga Toxin-Producing E. coli. Microbiol. Spectr. 2015, 321–339. 10.1128/9781555818791.ch16. [DOI] [PubMed] [Google Scholar]
- Ergonul Z.; Hughes A. K.; Kohan D. E. Induction of apoptosis of human brain microvascular endothelial cells by Shiga toxin 1. J. Infect. Dis. 2003, 187, 154–158. 10.1086/345861. [DOI] [PubMed] [Google Scholar]
- Avula B.; Cohen P. A.; Wang Y.-H.; Sagi S.; Feng W.; Wang M.; Zweigenbaum J.; Shuangcheng M.; Khan I. A. Chemical profiling and quantification of monacolins and citrinin in red yeast rice commercial raw materials and dietary supplements using liquid chromatography-accurate QToF mass spectrometry: Chemometrics application. J. Pharm. Biomed. Anal. 2014, 100, 243–253. 10.1016/j.jpba.2014.07.039. [DOI] [PubMed] [Google Scholar]
- Baron E. J. Rapid identification of bacteria and yeast: summary of a National Committee for Clinical Laboratory Standards proposed guideline. Clin. Infect. Dis. 2001, 33, 220–225. 10.1086/321816. [DOI] [PubMed] [Google Scholar]
- Bauer A. Antibiotic susceptibility testing by a standardized single disc method. Am. J. Clin. Pathol. 1966, 45, 149–158. [PubMed] [Google Scholar]
- Angela M. d. S.; Lorene A.; Francis J. Z. M.; Laura L. C.; Cristina L. B. M.; Mrcia d. R. D.; Obdulio G. M.; Marilis D. M. In vitro effects of Eugenia pyriformis Cambess., Myrtaceae: Antimicrobial activity and synergistic interactions with Vancomycin and Fluconazole. Afr. J. Pharm. Pharmacol. 2014, 8, 862–867. 10.5897/AJPP2014.4100. [DOI] [Google Scholar]
- Rosato A.; Piarulli M.; Corbo F.; Muraglia M.; Carone A.; Vitali M.; Vitali C. In vitro synergistic action of certain combinations of gentamicin and essential oils. Curr. Med. Chem. 2010, 17, 3289–3295. 10.2174/092986710792231996. [DOI] [PubMed] [Google Scholar]
- Purkait S.; Bhattacharya A.; Bag A.; Chattopadhyay R. Synergistic antibacterial, antifungal and antioxidant efficacy of cinnamon and clove essential oils in combination. Arch. Microbiol. 2020, 202, 1439–1448. 10.1007/s00203-020-01858-3. [DOI] [PubMed] [Google Scholar]
- Wiegand I.; Hilpert K.; Hancock R. Agar and broth dilution methods to determine the minimal inhibitory concentration (MIC) of antimicrobial substances. Nat. Protoc. 2007, 3, 163–175. 10.1038/nprot.2007.521. [DOI] [PubMed] [Google Scholar]
- Myhal M.; Laux D.; Cohen P. Relative colonizing abilities of human fecal and K 12 strains ofEscherichia coli in the large intestines of streptomycin-treated mice. Eur. J. Clin. Microbiol. 1982, 1, 186–192. 10.1007/BF02019621. [DOI] [PubMed] [Google Scholar]
- Toledo P. V. M.; Aranha Junior A. A.; Arend L. N.; Ribeiro V.; Zavascki A. P.; Tuon F. F. Activity of antimicrobial combinations against KPC-2-producing Klebsiella pneumoniae in a rat model and time-kill assay. Antimicrob. Agents Chemother. 2015, 59, 4301–4304. 10.1128/AAC.00323-15. [DOI] [PMC free article] [PubMed] [Google Scholar]
- Hosseinzadeh H.; Fazly Bazzaz B.; Haghi M. M. Antibacterial activity of total extracts and essential oil of Nigella sativa L. seeds in mice. Pharmacologyonline 2007, 2, 429–435. [Google Scholar]
- Bancroft J.; Suvarna S.; Layton C.. Bancroft’s Theory and Practice of Histological Techniques. Edition 7th. British, Churchill Livingstone Elsevier Ltd; 2013. [Google Scholar]
Associated Data
This section collects any data citations, data availability statements, or supplementary materials included in this article.