Abstract
In the present paper, nanocrystalline samples of NiCrFeO4 were synthesized by the combustion method using different fuels such as glycine, urea, and poly(vinyl alcohol) and subjected to heat treatment at different temperatures of 600, 700, 800, and 1000 °C for 6 h. The formation of phases with highly crystalline structures was confirmed by XRD and Rietveld refinement analysis. The optical band gap of NiCrFeO4 ferrites lies in the visible range, making them suitable photocatalysts. BET analysis reveals that the surface area of the phase synthesized using PVA is much higher than that synthesized using other fuels at each sintering temperature. In addition, there is a significant decrease in the surface area with sintering temperature for the catalysts prepared using the fuels PVA and urea, while it almost remains constant in the case of glycine. Magnetic studies demonstrate the dependence of saturation magnetization on the nature of the fuel and on the sintering temperature; moreover, the coercivity and squareness ratio confirm the single domain nature of all the synthesized phases. We have also performed photocatalytic degradation of the highly toxic Rhodamine B (RhB) dye by employing all the prepared phases as photocatalysts using the mild oxidant H2O2. It is observed that the photocatalyst prepared using PVA as the fuel exhibited the best photocatalytic activity at all sintering temperatures. All the three photocatalysts prepared using different fuels showed a decrease in the photocatalytic activity with increasing sintering temperature. From the chemical kinetic point of view, the degradation of RhB by all the photocatalysts was found to follow pseudo-first-order kinetics.
1. Introduction
Nowadays, not only human health but also the environment is seriously threatened by the utility of hazardous chemical substances in industries. Effluents from various types of industries such as paper, leather, textiles, and pharmaceuticals have been constantly polluting the water sources by discharging different organic/inorganic hazardous wastes. Dyes are used worldwide mainly in the textile, printing, and leather industries. The wastewater from these industries encompasses several numbers of pigments.1 Extreme water pollution has a negative impact on the human health, other living organisms, and the natural environment, so problems related to the deterioration of usable water are notoriously noticeable.2,3 A look at the organic dyes often employed in industries demonstrates how their effluents play a critical role in polluting water sources. Most recently, some different methods and advanced techniques such as ozonization, adsorption, biodegradation, chemical oxidation, and photocatalysis have been considered to solve the problem of elimination of highly toxic organic dyes and hazardous pollutants from water sources.4 However, all these methods except photocatalysis are not so widely used due to their high cost, low skill, and sludge generation, but heterogeneous photocatalysis is a commonly used technique for hazardous effluent disposal.5 Therefore, photocatalytic nanomaterials are the best candidates for degrading hazardous pollutants, as they can fully mineralize them into CO2 and H2O without any byproducts.6 Semiconductor catalysts have commonly been used for the degradation of dyes from wastewater, e.g., metal oxides/sulfides/nitrides, etc.7 Among these semiconducting materials, metals and metal oxides have been the most attractive for several reasons.8 In addition to the simple metallic oxides, many researchers have reported that noble metal nanoparticles are excellent catalysts due to the presence of surface plasmon-driven catalysis, which can be further developed as suggested by various co-workers.9−11 However, the use of noble metal nanoparticles as catalysts is not yet economically enough. In particular, ferrites have proven to be potential photocatalysts for the exclusion of organic dyes, pigments, and other harmful pollutants due to their advantageous properties such as large surface area with better stability, narrow optical band gaps, high surface-to-volume ratio, and adsorption behavior.12 In general, ferrites have been broadly categorized into spinel ferrite, garnet ferrite, hexaferrite, and orthoferrite. Spinel ferrites are very frequently attractive magnetic nanoparticles owing to their distinctive benefits such as simple chemical composition and easy and eco-friendly synthetic techniques, where they can be utilized in different types of applications including data storage devices, biomedicine, gas sensor, magnetic drug delivery, catalysis, and photocatalysis for wastewater treatment13,14 The physical and chemical features of ferrites may be altered or enhanced by suitable doping of various magnetic and nonmagnetic ions into their crystal lattice. The improvement in their properties can be attributed to the distribution of divalent and trivalent ions in the tetrahedral (A) and octahedral (B) sites of the spinel ferrite structure.15 In addition to this, various synthesis techniques and heat treatment at different temperatures also led to improvement in the physical and chemical properties of ferrites. Different synthetic methods have been proposed to synthesize nanocrystalline spinel ferrites, such as aerosol route, ball milling, coprecipitation, hydrothermal, microwave, mechanochemical, reverse micelle, sol–gel, citrate precursor, solvothermal, and combustion methods,16 while the combustion process is of great value due to its potential benefits siuch as fast production rate, low manufacturing cost, and simple synthesis procedure. Moreover, the most significant means to achieve the desired size and single-phase nanoparticles is to heat-treat the synthesized nanoparticles at higher sintering temperatures. The most likely merits of the sintering process are the exclusion of impurities or impure phases, the increase in crystallite size, and an increase in the densities of nanoparticles, which can improve the various physical and chemical properties of the ferrites.
Nickel ferrite (NiFe2O4) has attracted the attention of the whole scientific community due to its potential properties such as high magnetocrystalline anisotropy and magnetic saturation, lower optical band gap, enhanced catalysis and photocatalysis, etc.17 High magnetic saturation has been displayed by NiFe2O4 nanoparticles due to their large surface area and small crystallite size.18 The lower values of direct and indirect optical band gaps (1.55 and 1.7 eV, respectively) were observed for nickel ferrite nanoparticles exhibiting nano-octahedron morphology with higher magnetic saturation.19 There are several reports on the influence of sintering temperature on different properties of ferrites. Magnetization saturation, coercivity, and magnetic remanence of NiFe2O4 nanoparticles synthesized by the coprecipitation method increase with increasing sintering temperature.20 On heating Ni0.5Zn0.5Fe2O4 from 700 to 1000 °C, there is a decrease in the optical band gap, while magnetic saturation shows an increase with increasing crystallite size.21 The magnetic saturation and coercivity of NiFe2O4 primarily increase with an increase in the calcination temperature from 400 to 700 °C and then decrease at last with an increase from 700 to 800 °C due to transition from a single domain to a multidomain structure.22 Various magnetic parameters were tuned by employing a heat treatment at higher temperatures, where the magnetization saturation and remanence show an increasing trend with increasing temperature, depending on the crystallite size, while the coercivity shows an increase in the beginning and then starts decreasing.23,24 Aisida et al.25 showed the impact of both the calcination temperature and different fuels on the microstructural and magnetic properties of ZnFe2O4. Moreover, the doping of Cr3+ ions causes a significant change in the structural, magnetic, and optical properties of NiFe2O4 nanoparticles. The saturation magnetization in NiCrxFe2–xO4 (x = 0.1 and 0.2) increases as the grain size increases with a decrease in the number of pores.26 Furthermore, the increase in the chromium concentration appreciably lowers the optical band gap in NiCrxFe2–xO4 (x = 0.0, 0.1, 0.2, 0.3, 0.4, and 0.5), while a decrease was observed in the magnetic saturation values.27 As the spinel ferrites are proven to be in demand for treating various types of organic pollutants due to their numerous fascinating properties therefore, they have been explored by a number of researchers. Despite the same composition, there are large differences in the photocatalytic activity of NiFe2O4, as reported by Dhiman et al.28 The authors described that the ability to degrade the organic dye is strongly dependent on the morphology, surface area, and band gap. Liu et al.29 have utilized nickel ferrite nanoparticles as photocatalysts in oxalic acid-assisted degradation of rhodamine B and found the photocatalyst to be very stable, highly active, and easy separable from the reaction mixture. Moreover, there are a number of reports on the effect of sintering temperature on photocatalytic degradation of various organic dyes, and it was observed that the photodegradation efficiency decreases with an increase in the sintering temperature. With an increase in the annealing temperature, the photocatalytic efficiency in CuFe2O4, CoFe2O4, and ZnFe2O4 decreases, as explained on the basis of surface area, band gap, and crystallite size.14,30,31 In contrast, Swathi et al.32 confirmed that the photocatalytic activity of CoFe2O4 toward methylene blue first increases from 300 to 400 °C and then decreases with increasing sintering temperature, which can be explained based on the surface area and band gap.
To the best of our knowledge, we did not find any report on ferrite nanoparticles dealing with the effect of different fuels and sintering temperature on the photodegradation of organic dyes. Moreover, the photocatalytic activity of ferrite nanoparticles can further be improved by doping Cr3+ at the Fe3+ site, as Cr3+ promotes the conversion of Fe3+ to Fe2+ and eventually, Fe2+ causes a photo-Fenton-type reaction, which is responsible for photodegradation. With this in mind, a systematic study is done on the influence of different sintering temperatures on different properties of Ni-Cr ferrites synthesized with different fuels. The present work deals with the effect of different fuels and sintering temperatures on the structural, optical, magnetic, and photocatalytic properties of NiCrFeO4 ferrites. For the photocatalytic degradation, the dye RhB is used as a model pollutant. The comparative effect of the prepared phases on photocatalytic degradation is studied on the basis of surface area, PL spectroscopy, and optical band gap.
2. Experimental Section
2.1. Materials and Instruments
For the synthesis of NiCrFeO4 nanoparticles, all the chemicals used were analytical grade. Various metal nitrates such as iron nitrate nonahydrate (Fe(NO3)3·9H2O), chromium nitrate nonahydrate (Cr(NO3)3·9H2O), and nickel nitrate hexahydrate (Ni(NO3)2·6H2O) and different fuels such as glycine (NH2CH2COOH), urea (NH2CONH2), and poly(vinyl alcohol) (PVA) (C2H4O) have been used. For the purpose of photocatalytic activity, Rhodamine B (C28H31N2O3Cl) and hydrogen peroxide (H2O2, 27% w/w) were used. All of the chemicals were bought from Alfa Aesar and used as received with no additional purification. The structure of the synthesized phases was characterized using an X-ray diffractometer (Rigaku Smart Lab 9kW rotating X-ray diffractometer) in the range of 10–100°. FTIR spectra were recorded with a Shimadzu Prestige-21 spectrophotometer by employing pressed KBr pellets. Morphological (FESEM) and elemental analyses (EDX) were performed on a Zeiss GeminiSEM. BET studies were performed to determine the specific surface area using an instrument (BELSORP MINIX) after preheating the samples at 100 °C for 5 h. To examine the optical behavior of the prepared samples, photoluminescence emission spectra were obtained at room temperature using a fluorescence spectrophotometer (Hitachi, F-4700) equipped with an Xenon lamp as an excitation source. To explore the magnetic response of the prepared samples, M vs H measurements were done at room temperature using a Lake Shore 7410-series VSM. DRS spectra for determination of the optical band gap and time-dependent spectra of RhB dye degradation were recorded by UV–vis spectroscopy using a UV-vis-NIR spectrophotometer (PerkinElmer, model Lambda 1050+).
2.2. Fabrication of NiCrFeO4 Nanoparticles Using Combustion Synthesis
The fabrication of Ni-Cr ferrites was done using the combustion method; the details have been described in our earlier reported work.33 Briefly, different reactants Ni(NO3)2, Fe(NO3)3, and Cr(NO3)3 and fuels were taken in a molar ratio of 1:1:1:x, where x = 4, 4.44, and 6.66 for PVA, glycine, and urea, respectively. The metal nitrates and fuels were dissolved in distilled water in two separate beakers and then stirred individually on a magnetic stirrer for about 30 min. The two solutions were mixed together and stirred further for 1 h until a homogeneous solution was formed. The resulting solution was then placed on a hot plate preheated at 100–120 °C for the creation of a gel. The resulting gel was heated in an oven at 250 °C for the combustion reaction to take place, resulting in a bulky and voluminous mass in the beaker. The ferrites produced in this way were then subjected to a heat treatment in a muffle furnace at 600, 700, 800, and 1000 °C for 6 h in each case. Finally, the sintered ferrites were ground into a fine powder in an agate mortar and pestle. The Ni-Cr ferrite nanoparticles synthesized with glycine were named as NCFG-1, NCFG-2, NCFG-3, and NCFG-4 according to their sintering temperatures of 600, 700, 800, and 1000 °C, respectively. In the same way, ferrite nanoparticles synthesized with urea and PVA were named as NCFU-1, NCFU-2, NCFU-3, and NCFU-4 and NCFP-1, NCFP-2, NCFP-3, and NCFP-4, respectively. The prepared Ni-Cr ferrites were called collectively as NCFPs, NCFUs, and NCFGs in the cases of the fuels PVA, urea, and glycine, respectively.
2.3. Procedure for Photo-Fenton Degradation of Rhodamine B
The photocatalytic degradation of Rhodamine B was carried out in a self-designed UV–visible reactor chamber using all the prepared nanoparticles under a 250 W visible lamp. To do this, 100 mL of the RhB dye solution (15 mg/L) was placed in a 400 mL beaker. To achieve the adsorption–desorption equilibrium, 100 mg of the photocatalyst was added, and the solution was then stirred in the dark for 1 h. Additionally, 1 mL of H2O2 was added to the above-mentioned solution, followed by visible light irradiation. After fixed time intervals, 3 mL of sample solution was taken from the reaction mixture and immediately centrifuged to remove any catalyst. Any changes in the RhB concentration were noted using an UV–visible spectrophotometer.
3. Results and Discussion
3.1. XRD Characterization
The raw X-ray diffraction data sets of the powdered samples collected at room temperature are shown in Figure 1. The presence of the (111), (220), (311), (222), (400), (422), (511), and (440) planes in the XRD of all samples confirmed the formation of a cubic spinel structure, which can be found in the space group Fd3̅m. No traces of any secondary phases were noticed in the XRD patterns of NiCrFeO4 powder at all sintering temperatures. The broad nature of the peaks in the XRD pattern of nanosamples indicated the finely divided nature of the powders. As the sintering temperature increases, the reflection peaks of the samples become sharper and narrower, suggesting the enhancement of crystallinity. Moreover, to better understand the structure of the fabricated phases, Rietveld refinement was performed using GSAS-EXPGUI software.34 The Rietveld refinement plots of the NCFP samples are displayed in Figure 2, while those of NCFUs and NCFGs are given in Figures S1 and S2 of the Supporting Information, respectively. The linearity of difference in the measured and calculated XRD patterns confirms that the observed and calculated diffraction patterns correlate well. The various structural parameters obtained from the Rietveld refinement such as goodness of fit (χ2), reliability factors (Rwp and Rp), and oxygen positional parameter (O) are listed in Table 1.
Figure 1.
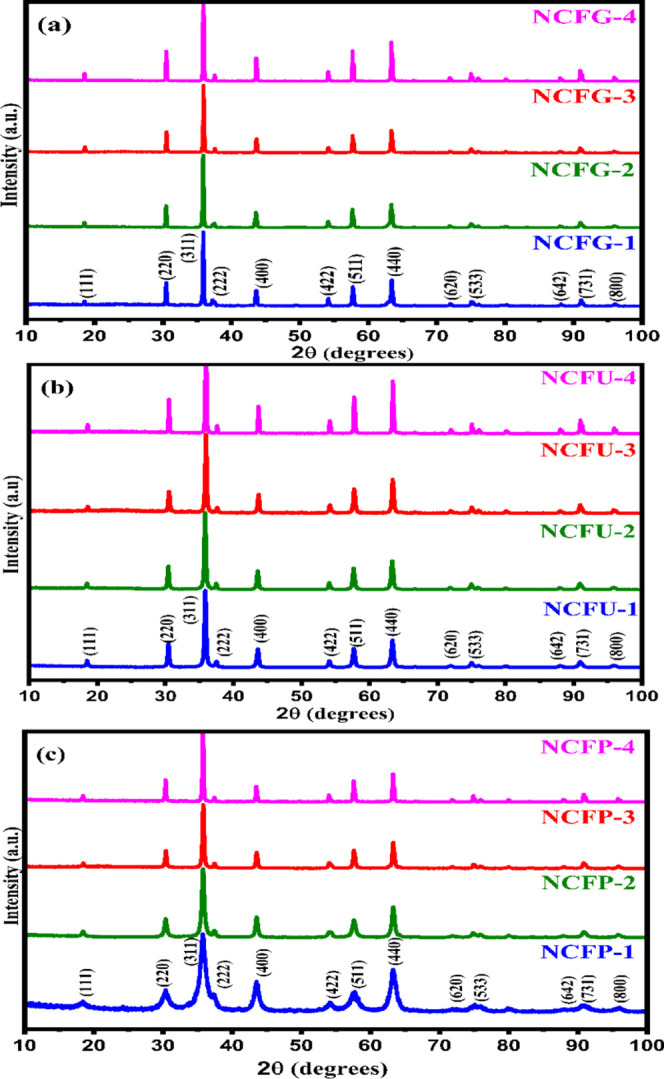
XRD diffractograms of NiCrFeO4 sintered at different temperatures. (a) NCFGs, (b) NCFUs, and (c) NCFPs.
Figure 2.
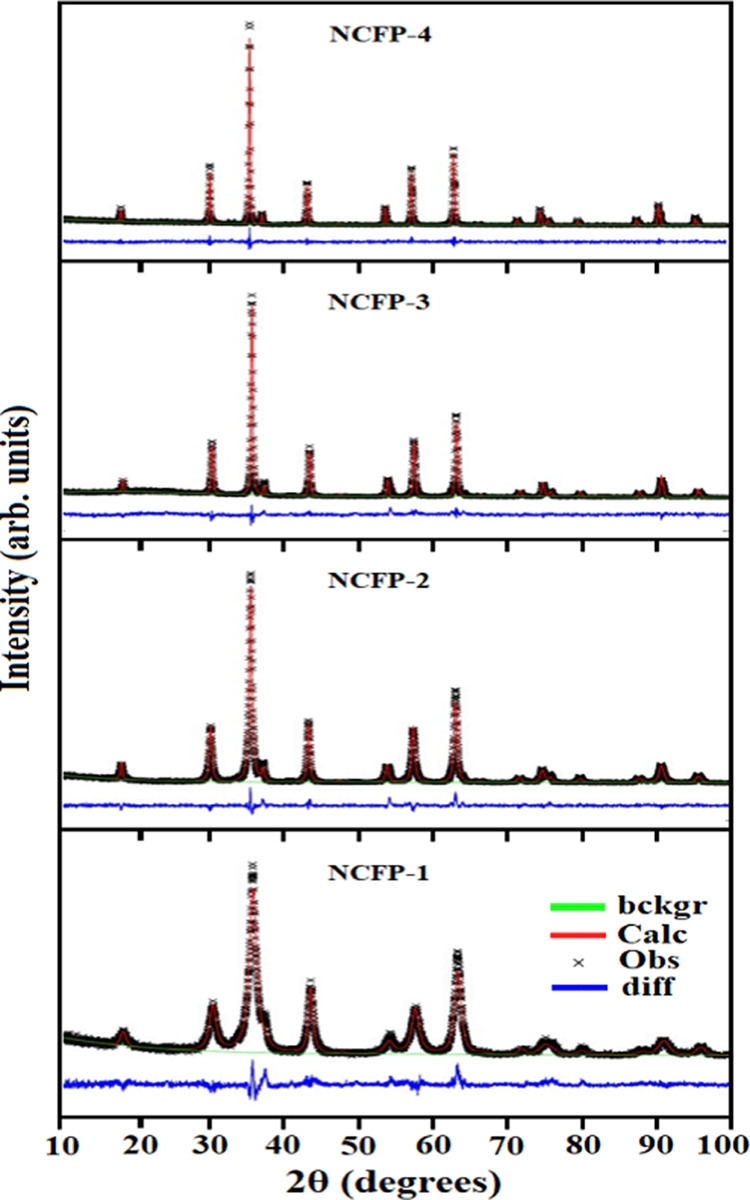
Rietveld refinement plot of NCFPs sintered at different temperatures.
Table 1. Structural Parameters Obtained from Rietveld Refinements and Crystallite Size of Ni-Cr Ferrite Nanoparticles Sintered at Different Temperatures.
| samples | a (Å) | O | V (Å3) | Rwp | Rp | χ2 | D (nm) |
|---|---|---|---|---|---|---|---|
| NCFG-1 | 8.2901(2) | 0.2516(6) | 569.74(2) | 0.2474 | 0.1768 | 4.30 | 51.1 |
| NCFG-2 | 8.2950(1) | 0.2531(4) | 570.75(1) | 0.2638 | 0.1708 | 4.85 | 53.3 |
| NCFG-3 | 8.2991(1) | 0.2532(3) | 571.60(1) | 0.1744 | 0.1305 | 2.28 | 54.8 |
| NCFG-4 | 8.2971(1) | 0.2529(2) | 571.19(1) | 0.1674 | 0.1180 | 1.96 | 62.1 |
| NCFP-1 | 8.3040(4) | 0.2528(3) | 572.61(5) | 0.1156 | 0.1535 | 1.79 | 09.2 |
| NCFP-2 | 8.3038(2) | 0.2539(3) | 572.57(2) | 0.1854 | 0.1183 | 2.49 | 18.4 |
| NCFP-3 | 8.3058(2) | 0.2531(4) | 572.99(2) | 0.1828 | 0.1271 | 2.63 | 31.2 |
| NCFP-4 | 8.3047(1) | 0.2532(3) | 572.76(1) | 0.1580 | 0.1138 | 1.35 | 45.0 |
| NCFU-1 | 8.3010(1) | 0.2540(2) | 571.99(1) | 0.1629 | 0.1080 | 1.91 | 28.8 |
| NCFU-2 | 8.3041(1) | 0.2537(2) | 572.63(1) | 0.1562 | 0.1058 | 1.90 | 31.3 |
| NCFU-3 | 8.3001(1) | 0.2533(4) | 571.81(1) | 0.1812 | 0.1344 | 2.26 | 35.4 |
| NCFU-4 | 8.2942(1) | 0.2527(3) | 570.59(1) | 0.1824 | 0.1366 | 2.24 | 54.10 |
It can be noticed that all Rietveld-refined parameters have values in a range justifying the pure crystal structure of samples. The values of lattice constant a (Table 1) acquired from the Rietveld refinement of all samples do not show a regular trend, which may be related to the different cationic distributions at different sintering temperatures and different fuels used.
The crystallite size (D) evaluation was also performed to observe the effect of different fuels and sintering temperatures. The crystallite size was calculated from the broadening of the most intense peak (311) by adopting the classical Debye–Scherrer equation35
| 1 |
where D is the crystallite size of the nanosamples, λ is the wavelength of the X-ray used (1.54 Å), θ is the angle of diffraction, and β is the full width half maxima. The value of β can be calculated using the relation given below because the Braggs peak width is an integration of the sample and instrument-dependent effects.36
| 2 |
The values of the calculated crystallite size are listed in Table 1. The variation in crystallite size can be explained by two considerations:
-
(i)
Influence of the sintering temperature: With increasing sintering temperature, the crystallite size of all samples synthesized using different fuels increases. This enhancement in crystallite size is attributed to the coalescence of smaller grains, and the activation energy required for nucleation is lowered at higher temperatures.37,38 In addition, the increase in crystallite size with sintering temperature of samples made with urea and PVA is quite significant compared to that of the samples made with glycine (Table 1).
-
(ii)
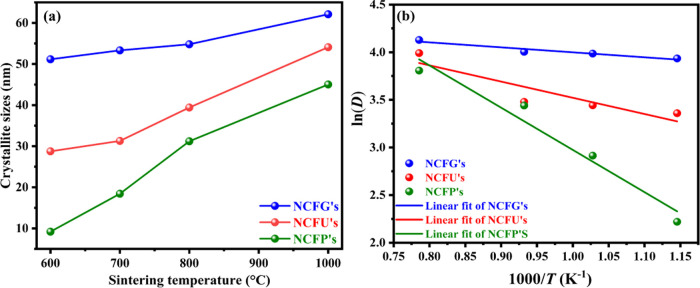
Effect of the fuel type: Different fuels play different roles in the synthesis process, and hence, the crystallite sizes change accordingly. In our study, the crystallite size at the same sintering temperature using different fuels increases in the order PVA < urea < glycine. This change in crystallite size may be attributed to the different decomposition temperatures of the fuels. Figure 3a displays the variation of crystallite size with different fuels and different sintering temperatures.
Figure 3.
(a) Variation of crystallite sizes with different fuels and different sintering temperatures and (b) Arrhenius plot of ln D against 1/T for Ni-Cr ferrites.
The activation energy for crystal growth could be determined by the Arrhenius equation39
| 3 |
where Ea is the activation energy, C is the specific reaction rate constant, T is the absolute temperature, and R is the ideal gas constant. The logarithmic form of eq 3 can be written as follows
| 4 |
The variation of ln D versus 1/T is shown in Figure 3b. A good linear correlation was attained between them, and hence, the crystallite growth activation energy for all the Ni-Cr ferrites was computed from the straight line fit of the slope of the ln D vs 1/T plot, and its values were found to be 36.87, 14.16, and 4.34 kJ/mol for NCFPs, NCFUs, and NCFGs, respectively. It is well known that the higher the activation energy, the higher the crystal growth. In our case, the highest activation energy was observed for NCFPs, reflecting the significant crystal growth upon sintering, and the results are in accordance with the crystallite size obtained from XRD.
3.2. FTIR Analysis
To confirm the formation of the ferrite phase shown by the XRD results, a FTIR study was carried out. Table 2 lists the IR absorption frequencies determined from the FTIR spectra (Figure 4) of all the Ni-Cr ferrites sintered at different temperatures.
Table 2. Infrared Parameters for Ni-Cr Ferrites Sintered at Different Temperatures.
| IR parameters |
||
|---|---|---|
| samples | v1 (cm–1) | v2 (cm–1) |
| NCFG-1 | 603.28 | 471.95 |
| NCFG-2 | 606.83 | 473.05 |
| NCFG-3 | 615.59 | 480.15 |
| NCFG-4 | 618.67 | 481.29 |
| NCFU-1 | 609.43 | 471.95 |
| NCFU-2 | 615.59 | 482.21 |
| NCFU-3 | 620.72 | 483.24 |
| NCFU-4 | 623.25 | 484.67 |
| NCFP-1 | 615.59 | 471.95 |
| NCFP-2 | 618.72 | 471.95 |
| NCFP-3 | 620.77 | 477.08 |
| NCFP-4 | 626.88 | 478.89 |
Figure 4.
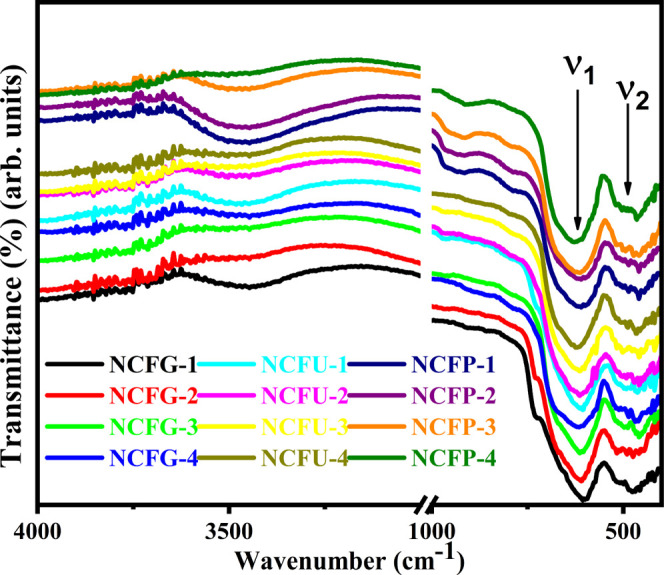
FTIR spectra of Ni-Cr ferrites.
In general, there are two main characteristic absorption regions in the FTIR spectra of the spinel ferrite, i.e., v1 and v2 in the frequency range 700–340 cm–1, which are related to intrinsic stretching vibrations of the oxygen bonds with metal cations in A (tetrahedral) and B (octahedral) sites.40 In the present study, the higher frequency band v1 is observed in the range of 603–627 cm–1, which arises due to the tetrahedral Mn+–O2– stretching vibrations, while the lower frequency band v2 is noticed in the range of 470–483 cm–1, which may be attributed to Mn+–O2– occupying the octahedral site of the cubic spinel structure. According to Table 2, an increase in the values of v1 and v2 was seen for NCFGs, NCFUs, and NCFPs, which can be ascribed to advancements in the crystallinity, preparation process, grain size, and heat treatment. In addition, the FTIR spectra also showed wide absorption bands in the range of 3200–3600 cm–1 corresponding to the valence vibrations of the surface-adsorbed OH group.40 Furthermore, Figure 4 also demonstrates that the intensity of the OH group characteristic bands decreased significantly for samples as the sintering temperature increased from 600 to 1000 °C for all Ni-Cr ferrites.
3.3. Morphology, Shape, and Purity of the Ni-Cr Ferrites
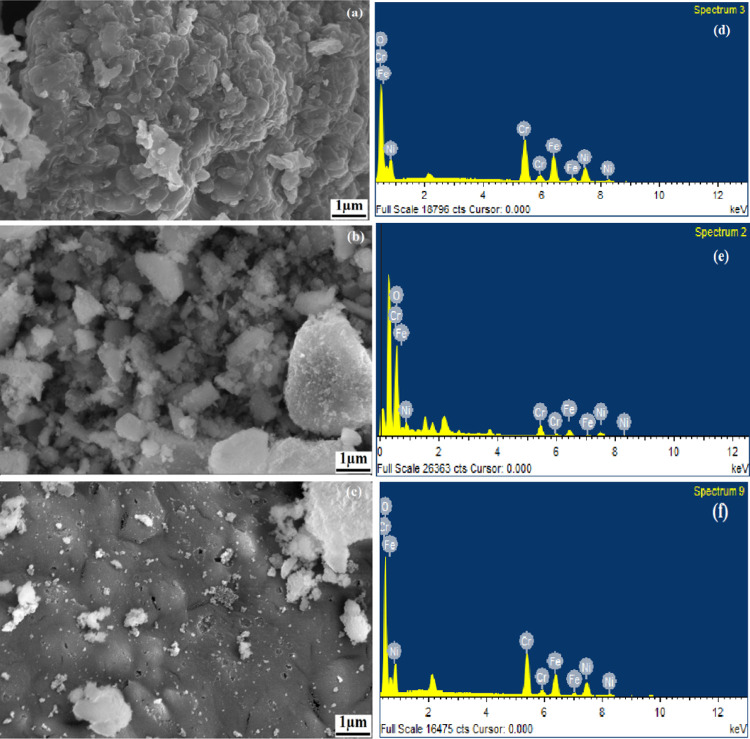
The morphology of the synthesized Ni-Cr ferrites sintered at 600 °C was examined by FESEM, and their micrographs are shown in Figure 5a–c. The FESEM images of NCFG-1 show a highly agglomerated and dense spongy structure. A porous structure with small cavities in the surface can also be seen in NCFP-1. Similar to NCFG-1, the FESEM images of NCFU-1 show a dense structure, in which the small crystallites are well connected, indicating the formation of nanocrystalline products. It is noticeable that the FESEM images showed the existence of small voids and pores in all samples sintered at 600 °C. The appearance of voids and pores might be attributed to the release of enormous volumes of gases such as carbon dioxide, water, and nitrogen during the combustion reaction.41 The elemental composition of Ni-Cr ferrite nanoparticles sintered at 600 °C was determined utilizing energy dispersive spectroscopy (EDX). The EDX spectra offer information on the chemical composition of the elements present from the surface to the inside of the solid and serve to establish the homogeneity of the samples under consideration. The obtained EDX spectra of Ni-Cr ferrite nanoparticles are shown in Figure 5d–f. The EDX spectra clearly provide evidence of the presence of Ni, Cr, Fe, and O elements in the phases and ensure the absence of any peak corresponding to impurity elements.
Figure 5.
FESEM micrographs and EDX profiles for NCFG-1 (a, d), NCFP-1 (b, e), and NCFU-1 (c, f), respectively.
3.4. BET Surface Area
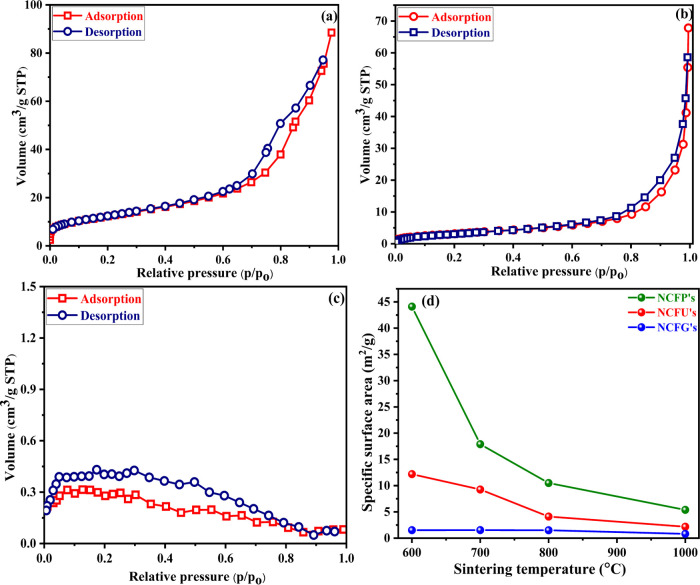
The BET specific surface area of Ni-Cr ferrite nanoparticles sintered at different temperatures was evaluated by the N2 adsorption–desorption method. All the ferrite nanoparticles except NCFGs displayed type-IV isotherm, which is believed to be a typical trait of mesoporous structures.42Figure 6 displays the N2 adsorption–desorption isotherm for the samples sintered at 600 °C, i.e., NCFP-1, NCFU-1, and NCFG-1, while the isotherms for samples sintered at 700, 800, and 1000 °C are given in Figures S3–S5, respectively, of the Supporting Information. The values the of specific surface area, mean pore diameter, and total pore volume obtained from BET analysis are tabulated in Table 3.
Figure 6.
N2 adsorption–desorption isotherms for (a) NCFP-1, (b) NCFU-1, (c) NCFG-1, and (d) comparison of the specific surface area of Ni-Cr ferrites.
Table 3. BET Surface Area, Total Pore Volume, and Mean Pore Diameter of the Ni-Cr Ferrite Nanoparticles Sintered at Different Temperatures.
| samples | specific surface area (m2/g) | total pore volume (cm3/g) | mean pore diameter (nm) |
|---|---|---|---|
| NCFG-1 | 1.52 | 1.0 × 10⁻⁴ | 0.333 |
| NCFG-2 | 1.53 | 6.0 × 10⁻⁵ | 0.167 |
| NCFG-3 | 1.50 | 1.0 × 10⁻⁴ | 3.269 |
| NCFG-4 | 0.82 | 2.0 × 10⁻⁴ | 1.313 |
| NCFP-1 | 44.1 | 1.7 × 10⁻¹ | 12.409 |
| NCFP-2 | 17.9 | 1.4 × 10⁻¹ | 36.012 |
| NCFP-3 | 10.50 | 1.0 × 10⁻² | 3.925 |
| NCFP-4 | 5.39 | 3.9 × 10⁻³ | 2.901 |
| NCFU-1 | 12.2 | 7.4 × 10⁻² | 24.365 |
| NCFU-2 | 9.27 | 7.2 × 10⁻² | 31.170 |
| NCFU-3 | 4.12 | 3.0 × 10⁻⁴ | 3.509 |
| NCFU-4 | 2.18 | 3.0 × 10⁻⁴ | 1.709 |
A significant influence of the sintering temperature and different fuels was found in the prepared ferrite nanoparticles. With increasing sintering temperature, the specific surface area of NCFP ferrites decreases significantly from 44.1 to 5.39 m2/g, which could be due to the progressive aggregation of tiny crystallites to form larger particles. A similar trend despite being less significant was observed in the case of NCFUs with increasing sintering temperature, but it almost remained constant in the case of NCFGs (Table 3). This behavior may be due to the fine particle size of NCFGs, which almost remains constant during sintering, as evident from Table 1. Moreover, at the same sintering temperature, the surface area follows the order NCFPs > NCFUs > NCFGs (Figure 6d), which could be explained on the basis of their crystallite size. Another factor for the higher surface area of NCFPs is the fuel PVA, which reduces agglomeration due to its hydrophilic potential.25 With these results, control over the surface area and pore size can be achieved by adjusting the sintering temperature and using different fuels.
3.5. Optical Properties
3.5.1. Optical Band Gap
To estimate the optical band gap of samples prepared using different fuels and sintered at different temperatures, DRS spectra in the range of 250–1100 nm were recorded at room temperature, which are displayed in Figure S6 of the Supporting Information. In general, the band structure of spinel ferrites can be described taking O-2p and Fe-3d as valence and conduction bands, respectively.43 Therefore, the DRS response of ferrite materials may be attributed to the transition of electrons from the valence band to the conduction band, and the energy required for such an electronic transition is directly proportional to the band gap of ferrites.44 In general, the Kubelka–Munk function, which is mostly employed for analyzing powder samples, has been applied to DRS spectra to convert it into an equivalent absorption coefficient. Thus, the Kubelka–Munk function F(R) is related to the absorption coefficient as follows45
| 5 |
where F(R), α, and R are the Kubelka–Munk function, absorption coefficient, and reflectance, respectively. The Tauc plot shows a relationship between α and Eg
| 6 |
α is replaced by F(R), and therefore, eq 6 can be written as follows46
| 7 |
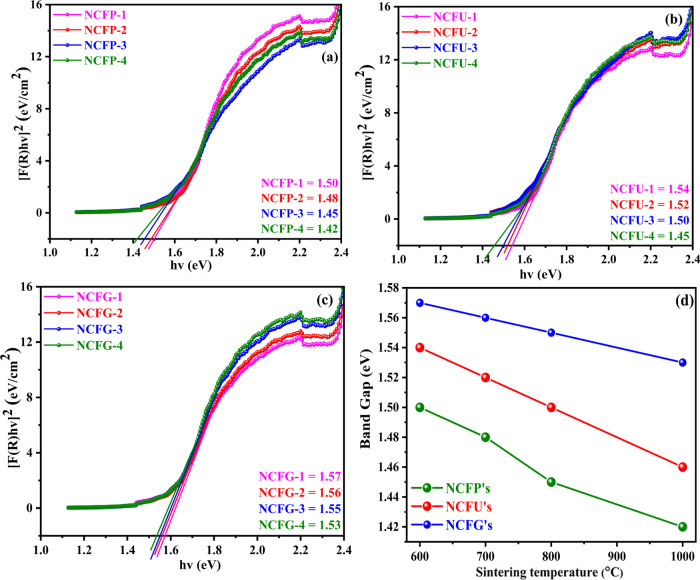
where h, A, v, and Eg are Planck’s constant, proportionality constant, photon energy frequency, and optical band gap, respectively. Here, n denotes the type of transition taking place, which can have a value of 2 or 1/2 depending on the type of transition. Generally, n = 2 for indirectly allowed and n = 1/2 for directly allowed transition. Since it has been extensively discussed in the literature that spinel ferrites are materials with a direct band gap,47 the value of n is therefore assumed to be 1/2 in our case. The band gap values for the direct transition of Ni-Cr ferrites were calculated by plotting a graph between [F(R)hv]2 and energy hv utilizing an extrapolation technique until [F(R)hv]2 tends to zero (Figure 7). The variation of the estimated values of the optical band gap (Eg) of Ni-Cr ferrites as a function of the sintering temperature is given in Figure 7. The results clearly show that the values of Eg decrease with sintering temperature because of the increase in crystallite size. These values decrease linearly from 1.50 to 1.42 eV for NCFPs, from 1.54 to 1.45 eV for NCFUs, and from 1.57 to 1.53 eV for NCFGs. Surprisingly, at the same sintering temperature using different fuels, a reverse trend is observed, i.e., there is an increase in band gap energy values with an increase in crystallite size, such that NCFPs have a lower band gap than that of NCFUs at the same sintering temperature, which in turn is smaller than the band gap values of NCFGs. Such a reverse trend of band gap values for different sintering temperatures and different fuels can be explained by considering two factors: (i) quantum confinement effects (ii) surface and interfacial effects. Several studies have examined that a material’s band gap is determined by quantum confinement and surface and interfacial effects, where quantum confinement induces a blue shift (increase) with decreasing crystallite size, while the surface and interface induce a red shift (decrease) with decreasing crystallite size.48,49 In our case, when the sintering temperature increases, it increases the crystallite size, and thus, a decrease in the band gap is observed due to the quantum confinement effect. If the particle size of a nanomaterial is less than or equal to the exciton Bohr radius, there are discrete energy levels and electrons and holes are confined at the nanolevel, so quantum confinement occurs.50 In addition, at a particular temperature, the order of crystallite size is NCFPs < NCFUs <NCFGs, and it is the same for the order of band gaps, which is due to the dominancy of the surface and interfacial effects. Figure 7d shows the variation of the optical band gap with different sintering temperatures and different fuels used.
Figure 7.
Optical band gap of Ni-Cr ferrite nanoparticles annealed at different temperatures. (a) NCFPs, (b) NCFUs, and (c) NCFGs. (d) Comparison of band gap Vs sintering temperature for Ni-Cr ferrites.
3.5.2. Photoluminescence Studies
Photoluminescence (PL) spectroscopy is an excellent technique to learn about the energy and dynamics of charge carriers created during visible light exposure. In addition to this, the PL behavior of spinel ferrite nanoparticles also provides information about the nature of the emitting states. In our study, PL spectroscopy was performed to investigate the charge carrier transfer, shifting, and recombination processes.51 It is well known that the lower the intensity of PL, the lower the recombination rate of the photogenerated electron–hole pairs and hence the higher the photocatalytic activity of the semiconductor.52 The room temperature PL spectra were recorded with an excitation wavelength of 325 nm for all the synthesized samples and are shown in Figure 8. The PL intensity can be considered variable for different samples, although the position of the peaks did not change significantly with the peak position around 653 nm in the visible region. Furthermore, the PL intensity of all Ni-Cr ferrites increased with increasing sintering temperature from 600 to 1000 °C, which may be attributed to the reduction of defect sites, for which photogenerated electrons and holes (ecb–/hvb) migrate less, and therefore, the recombination process increases with increasing temperature, and thus, the PL intensity increases.53,54 However, a slight decrease in the PL intensity for NCFPs was observed when the sintering temperature was increased from 700 to 800 °C, which can be explained on the basis of surface defects, morphology, particle size, and quenching of the photogenerated ecb–/hvb pairs, leading to a decrease in PL intensity.
Figure 8.
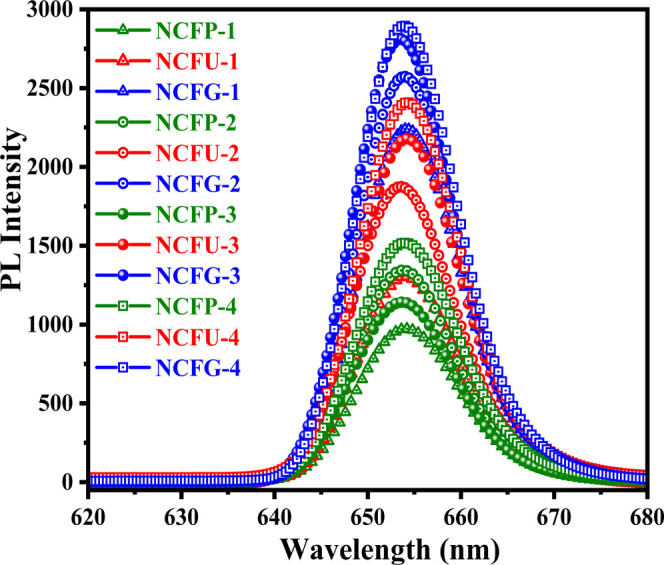
Room temperature PL spectra of Ni-Cr ferrite nanoparticles sintered at different temperatures.
In addition, at the same sintering temperature using different fuels, the PL intensity of Ni-Cr ferrites follows the order NCFPs < NCFUs < NCFGs. The observed results demonstrate the lower recombination rate of the photogenerated ecb–/hvb pairs for NCFPs, which may enhance their photocatalytic activity.
3.6. Magnetic Studies
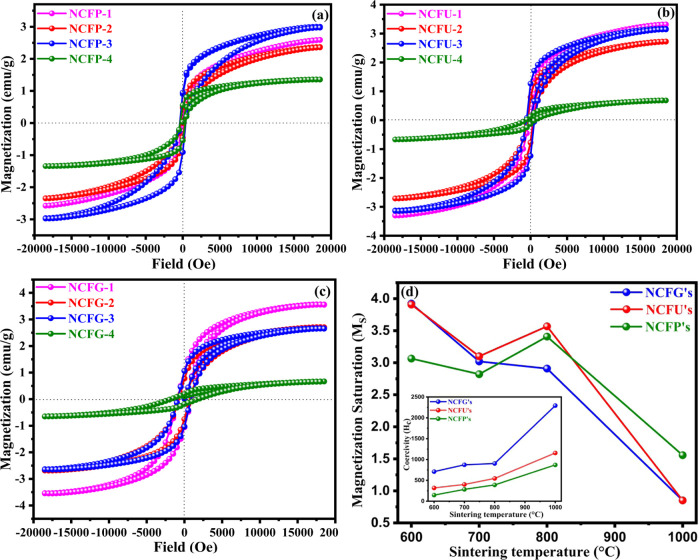
Magnetic characterization of NiCrFeO4 nanocrystalline samples was performed by VSM at room temperature with an applied field of −20 to 20 kOe. Different magnetic parameters such as saturation magnetization (Ms), coercivity (Hc), magnetic remanence (Mr), and squareness ratio (Mr/Ms) were obtained from the hysteresis curve (Figure 9), and their values are tabulated in Table 4. It can be depicted from Figure 9 that the saturation of magnetization could not be reached even with an applied field of 20 kOe. Therefore, the saturation magnetization values of all the samples were determined from the plot of M and 1/H in the high-field region. The obtained saturation magnetization for NCFGs shows a regular but decreasing trend with increasing sintering temperature, which is in contrast to recent studies of magnetic properties of ferrites, in which an increase in Ms with increasing sintering temperature was noticed.24,55 However, both NCFPs and NCFUs showed a similar but irregular trend with respect to sintering temperature as displayed in Figure 9d. In addition, at a particular sintering temperature, the effect of different fuels on the magnetic saturation of Ni-Cr ferrites can be seen, but no regular trend has been observed (Figure 9d). The observed results for saturation magnetization, in general, can be explained on the basis of particle size and distribution of cations between A and B sites due to thermal treatment.56,57
Figure 9.
Room temperature hysteresis loops M vs H of Ni-Cr ferrites. (a) NCFPs, (b) NCFUs, and (c) NCFGs. (d) Comparison of Ms with different sintering temperatures for Ni-Cr ferrites, (inset showing the comparison of Hc with different sintering temperatures for Ni-Cr ferrites).
Table 4. Magnetic Parameters of Ni-Cr Nanoparticles Sintered at Different Temperatures.
| samples | saturation magnetization (Ms) (emu/g) | remanence (Mr) (emu/g) | coercivity (Hc) (Oe) | squareness ratio (S = Mr/Ms) |
|---|---|---|---|---|
| NCFG-1 | 3.9235 | 1.08 | 709.53 | 0.2752 |
| NCFG-2 | 3.0198 | 0.79 | 872.77 | 0.2635 |
| NCFG-3 | 2.9088 | 1.06 | 903.78 | 0.3656 |
| NCFG-4 | 0.8505 | 0.26 | 2292.38 | 0.3057 |
| NCFP-1 | 3.0645 | 0.27 | 145.46 | 0.0881 |
| NCFP-2 | 2.8210 | 0.48 | 284.54 | 0.1714 |
| NCFP-3 | 3.4075 | 0.95 | 390.33 | 0.2795 |
| NCFP-4 | 1.5574 | 0.77 | 870.22 | 0.4944 |
| NCFU-1 | 3.9077 | 0.78 | 318.06 | 0.2004 |
| NCFU-2 | 3.1013 | 0.79 | 401.82 | 0.2567 |
| NCFU-3 | 3.5672 | 1.29 | 546.28 | 0.3616 |
| NCFU-4 | 0.8509 | 0.25 | 1156.79 | 0.2939 |
In the present case, it was observed that with increasing sintering temperature, the coercivity increases in all cases. A ferromagnetic material’s domain structure determines the size dependency of its magnetic behavior. It is well known that a large magnetic particle has a multidomain structure with domain walls separating the regions of uniform magnetization. When the energy required to form the domain wall is less than the difference between the magnetostatic energies of the single domain and multidomain states, the formation of the domain wall is energetically favored.58
Thus, the contribution of various energy terms to the total energy of a ferromagnetic material changes as the dimensions of the particle get smaller. As a result, the domain wall’s surface energy becomes more important than the magnetostatic energy. Also, it takes more energy to build a domain wall below a certain size, known as the critical diameter, than it does to favor the magnetostatic energy of the single domain state.59
Therefore, when the size of a material is reduced below its critical diameter, it becomes a single domain. The general trend of coercivity versus particle size can be summarized: as the particle size is reduced, coercivity increases to the maximum and then decreases to zero after the critical diameter of the particle. Hence, in our case, with increasing sintering temperature, the particle size increases and so does coercivity, which is due to the single domain structure of our samples.
A point is to be noted here that even at 1000 °C, the particle size is still not greater than the critical diameter, which is the reason for the increase in coercivity with increasing particle size.60 It was also found that under identical sintering conditions, i.e., at the same sintering temperature, the coercivity follows the order NCFGs > NCFUs > NCFPs, shown as an inset of Figure 9d. In addition, the squareness ratio (S = Mr/Ms) was also calculated from the hysteresis loop, which is used to find out inter- and intraexchange interactions between grains.61 Stoner and Wohlfarth proposed that the squareness ratio S = 0.5 for noninteracting randomly oriented particles and S < 0.5 for particles interacting through magnetostatic interactions.62 In the present study, S < 0.5 for all samples, indicating that the interactions are magnetostatic. The lower values of S also confirm the single domain nature of our samples, which in turn supports the increasing trend in coercivity with increasing particle size. In summary, it may be concluded that magnetic parameters of the ferrites vary strongly depending upon the particle size, sintering temperature, and distribution of cations between tetrahedral and octahedral sites due to sintering.49,63
3.7. Photocatalytic Activity
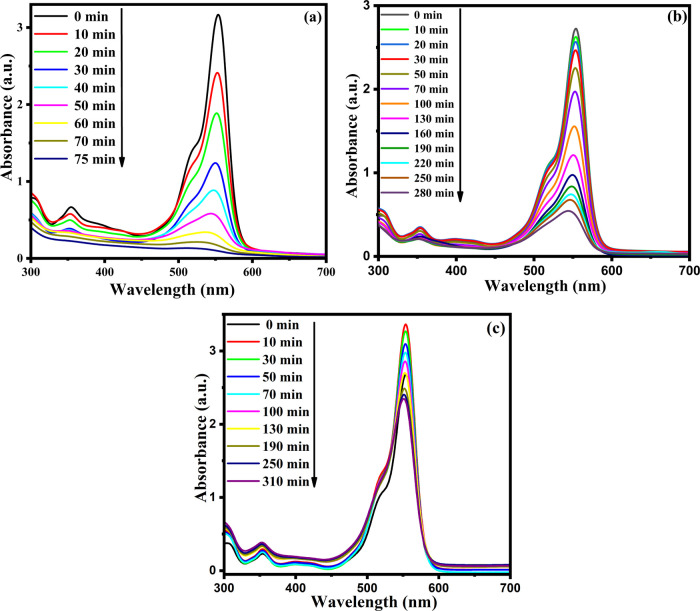
The photocatalytic efficiency of the Ni-Cr ferrites and the effect of sintering temperature and different fuels on RhB dye degradation were studied. When the reactions were carried out, a hypochromic shift was observed with the passage of time, indicating the decrease in the concentration of RhB. Therefore, any change in the concentration of RhB dye and hence degradation efficiency can be calculated using the formula64
| 8 |
where A0 is the initial absorption intensity of the dye solution and At is the absorption intensity at time ‘t’. The time-dependent degradation spectra of the RhB dye using NCFP-1, NCFU-1, and NCFG-1 are presented in Figure 10, while those for other catalysts are given in Figures S7–S9 of the Supporting Information.
Figure 10.
Time-dependent UV-vis spectra of degradation of RhB in the presence of (a) NCFP-1, (b) NCFU-1, and (c) NCFG-1 as photocatalysts.
The spectra show that the complete degradation of the RhB dye was achieved in 75, 100, and 80 min, respectively, using the catalysts NCFP-1, NCFP-2, and NCFP-3 (Figure 11).
Figure 11.
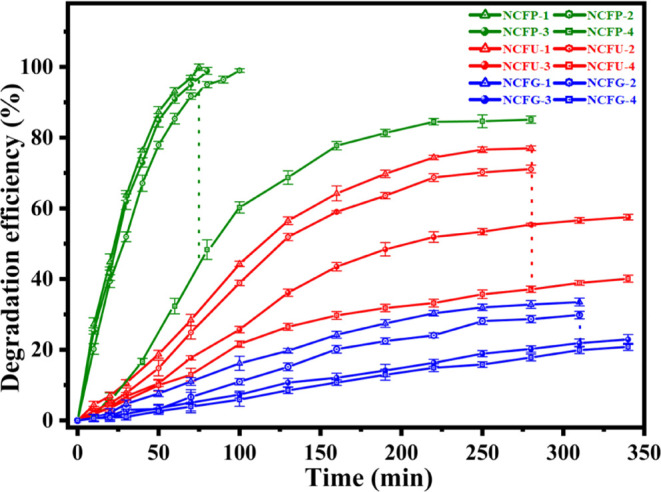
Comparison of degradation efficiency vs time vs sintering temperature of Ni-Cr ferrites synthesized with different fuels (the error bars were obtained after repeating the tests three times).
However, the degradation of the RhB dye did not become complete and remained constant at 85% in 270 min for NCFP-4. The results show that the degradation decreases with sintering temperature except at 800 °C. The decreasing trend with sintering temperature was also observed for NCFU photocatalysts (Figure 11). It is interesting to see that none of the NCFU photocatalysts showed complete degradation, which becomes constant after a particular interval of time. When the reaction was carried out with NCFU-1, the degradation was 77% in 340 min, and a further decrease was observed when NCFU-2 was used as a catalyst (71% in 340 min). Upon further examination, the ability of NCFU-3 was also not significant, resulting in 57% dye degradation in 340 min, while NCFU-4 yielded only 40% in 340 min. Surprisingly, NCFGs showed comparatively much smaller degradation, which did not even exceed the 50% mark in RhB clearance (Figure 11). NCFG-1, NCFG-2, NCFG-3, and NCFG-4 showed degradation efficiencies of 32, 29, 21, and 19% in the same time interval of 340 min, respectively.
3.7.1. Active Species and Possible Mechanism for the Photocatalytic Degradation of RhB by Ni-Cr Ferrites
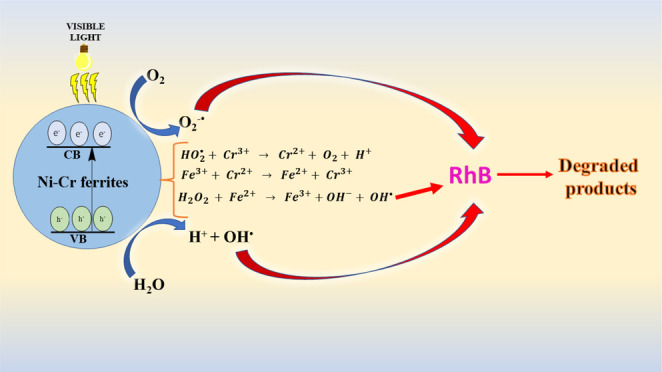
The radical trapping studies were carried out to recognize the chief involvement of reactive species in the photocatalytic degradation of the RhB dye. Benzoquinone (BQ) and isopropyl alcohol (IPA) were used in these tests as a scavenger of O2–• and OH•, respectively. As shown in Figure 12, when RhB was photocatalytically degraded in the presence of BQ, the degradation efficiency decreased marginally to 80 from 99%; however, the addition of IPA to the process effectively reduces the degradation efficiency to 32 from 99%. This finding shows that while both O2 and OH• are accountable for the degradation of the RhB dye, OH• plays a key part in the photocatalytic degradation using Ni-Cr ferrites. From the above-discussed results, the RhB dye was found to be degraded by the Ni-Cr ferrites; hence, it is quite interesting to look inside the mechanism through which the degradation of RhB occurs. It can be concluded that the overall degradation of RhB occurs via combination of Fenton (in the presence Fe3+ and H2O2)- and photo-Fenton (due to visible light irradiation)-type reactions. Initially, Fe3+ ions present in the Ni-Cr ferrites may combine with H2O2 and reduce to Fe2+.
Figure 12.
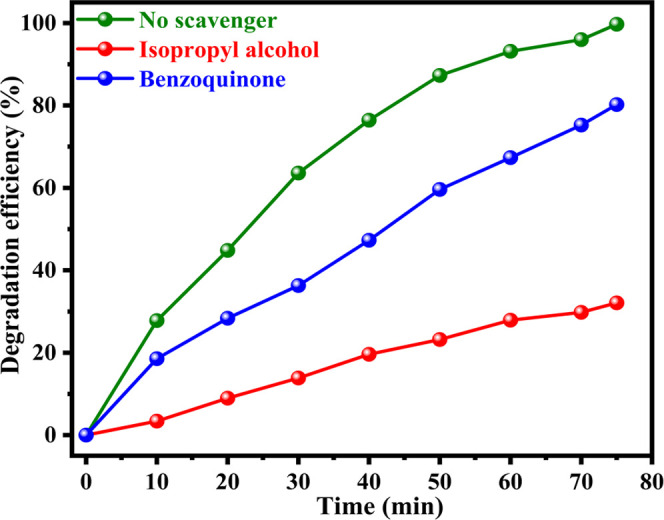
Effect of radical scavengers on the photocatalytic degradation of RhB.
These active Fe2+ ions then reacted with H2O2 to form the stronger oxidizing agent OH•, which is responsible for the degradation of RhB (eqs 9–11)
| 9 |
| 10 |
| 11 |
In addition to this, visible light (photo-Fenton type) also plays an important role in the photocatalytic degradation of RhB. When the visible light gets absorbed by the photocatalyst, the generation of photogenerated electron–hole (ecb–/hvb) pairs occurs. On being excited by the visible light, the photogenerated electrons get migrated to the conduction band, leaving behind the holes in the valence band.65 The photogenerated electrons in the conduction band can combine with the absorbed O2 to form O2–•, which can itself attack the dye molecules or react with the H2O2 molecules to form the stronger oxidizing agent OH• to breakdown the RhB dye.66 On the other hand, the photogenerated hvb in the valence band may react with water molecules to form OH•, which is responsible for degrading RhB (eqs 12–17).
| 12 |
| 13 |
| 14 |
| 15 |
| 16 |
| 17 |
Moreover, in addition to the visible light-driven photocatalysis of RhB, the degradation is also greatly enhanced due to the presence of Cr3+. The Cr3+ ion first reduces to Cr2+, which in turn reduces Fe3+ to Fe2+ as given in eqs 18–21.67 It is the Fe2+ that is mainly responsible for initiating the Fenton-type reaction for the degradation of RhB.
| 18 |
| 19 |
| 20 |
| 21 |
3.7.2. Comparative Effect of Ni-Cr Ferrites on the Photodegradation of Rhodamine B
The influence of sintering temperature on the photocatalytic degradation of RhB by Ni-Cr ferrites is shown in Figure 11. It can be seen that photocatalytic degradation of RhB decreases with sintering temperature for all the three catalysts prepared using different fuels. This can be explained on the basis of four factors: (i) surface area, (ii) PL intensity, (iii) optical band gap, and (iv) surface-OH groups of Ni-Cr ferrites. The value of the band gap decreases with sintering temperature in the case of all the three catalysts, but the change is not significant, and therefore, the decrease in the photocatalytic degradation of RhB with sintering temperature can be explained on the basis of the factors (i) the increase in PL intensity, which increases the recombination rate of the photogenerated electron–hole pairs, (ii) the decrease in surface area, and (iii) the decrease in the number of surface hydroxyl groups with sintering temperature, as evidenced by the FTIR spectra. Furthermore, it is well known that the number of hydroxyl groups in ferrites influences the adsorption of various pollutants.40 Therefore, the loss of surface hydroxyl groups with increasing sintering temperature could lead to the decrease of the photocatalytic activity of Ni-Cr ferrites.
On comparing the degradation results among Ni-Cr ferrites, it was found that NCFPs showed the best results and the photocatalytic degradation of RhB follows the order NCFPs > NCFUs > NCFGs at the same sintering temperatures, as can be seen in Figure 10. These results could be explained on the basis of (i) the decrease in surface area, (ii) the increase in PL intensity, and (iii) the increase in the band gap energy. A comparison of our catalyst with some of the earlier reports is given in Table 5. To study the leaching of metal ions, especially Cr3+, during the degradation process, EDX was also conducted for the most active catalyst NCFP-1 after use. The EDX results of NCFP-1 before and after use are given in Table S1, which suggest that there is almost no change in the mass percentage of various elements present in the phase, thereby confirming the reusability of the catalyst.
Table 5. Comparison of Our Catalyst with Some of the Other Reported Photocatalysts.
| s. no | catalyst | sintering temperature (°C) | degradation time(min)/degradation (%) | reference |
|---|---|---|---|---|
| 1 | CuFe2O4 | 500 | 120/92.54 | (30) |
| 600 | 120/89.48 | |||
| 2 | CoFe2O4 | 500 | 270/90.60 | (31) |
| 600 | 270/67.60 | |||
| 700 | 270/51.60 | |||
| 800 | 270/42.80 | |||
| 3 | CoFe2O4 | 300 | 60/55 | (32) |
| 400 | 60/74 | |||
| 500 | 60/61 | |||
| 4 | NiFeCrO4 (NCFP’s) | 600 | 75/99 | this work |
| 700 | 75/93.40 | |||
| 800 | 75/97.93 | |||
| 1000 | 75/43.31 |
3.7.3. Chemical Kinetics
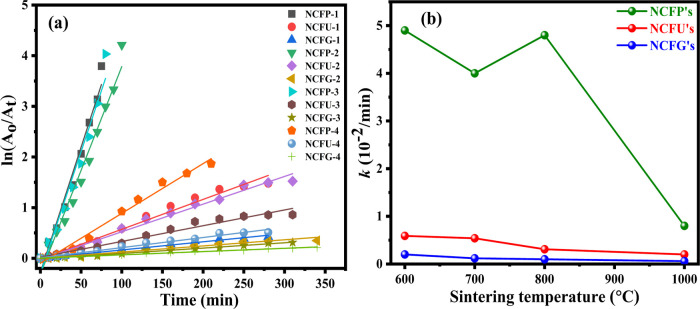
The photocatalytic degradation of the RhB dye using Ni-Cr ferrites has been found to follow the pseudo-first-order kinetics, and the rate constants can be calculated using the equation28
| 22 |
It is well known that in UV–visible spectra, the absorbance of a dye solution is proportional to its concentration in reaction medium; consequently, the ratio of the absorbance at any time t (At) to that at time t = 0 (A0) is proportional to the ratio of concentration at any time = t (Ct) to that at time t = 0 (C0), so the first-order rate equation takes the form as
| 23 |
Figure 13a shows the linear kinetic fit plots of ln(A0/At) vs k(t) for RhB photodegradation, and the regression correlation coefficient (R2) values were found to be in the range of 0.95–0.99 and are given in Table 6. The quite good linear fits as evident from the values of R2 indicate that photodegradation follows pseudo-first-order kinetics. The values of rate constants calculated from the slopes of the linear fits are listed in Table 6, and their variation with sintering temperature for different catalysts is shown in Figure 13b. It can be depicted from Figure 13b that the rate constants in the case of NCFPs are much higher than those of NCFUs and NCFGs at the same sintering temperature, thus showing the higher capability of NCFPs for degrading RhB dye compared to other catalysts. Furthermore, the rate constant decreases with increasing sintering temperature in the case of all the three catalysts prepared using different fuels, which is understandable. However, an increase in the rate constant has been observed at 800 °C in the case of NCFPs, which is consistent with the PL results.
Figure 13.
(a) Plots of ln (A0/At) versus reaction time t (min), with different Ni-Cr ferrites. Experimental conditions: Rhodamine B = 15 mg/L (100 mL), catalyst = 1 g/L, and H2O2 = 10 mL/L. (b) Variation of the pseudo-first-order rate constant with different sintering temperatures.
Table 6. Calculated Pseudo-First-Order Rate Constant (k) and Regression Correlation Coefficient (R2) of Ni-Cr Nanoparticles Sintered at Different Temperatures.
| NCFP’s |
NCFU’s |
NCFG’s |
||||
|---|---|---|---|---|---|---|
| sintering temperature (°C) | k (10–2/min) | R2 | k (10–2/min) | R2 | k (10–2/min) | R2 |
| 600 | 4.9 | 0.9712 | 0.59 | 0.9802 | 0.2 | 0.9871 |
| 700 | 4.0 | 0.9707 | 0.54 | 0.9851 | 0.12 | 0.9518 |
| 800 | 4.8 | 0.9688 | 0.31 | 0.9689 | 0.10 | 0.9846 |
| 1000 | 0.8 | 0.9845 | 0.20 | 0.9795 | 0.06 | 0.9849 |
4. Conclusions
In the present study, we have investigated the influence of different fuels and sintering temperature on the structural, optical, magnetic, and photocatalytic properties of NiCrFeO4 nanoparticles. The heat treatment at different temperatures of 600, 700, 800, and 1000 °C exerts a significant effect on the different properties of the synthesized phases despite the same composition. Both the crystallite size and surface area varied with the type of the fuel used and sintering temperature, but a more prominent change was observed in the case of NCFPs. Magnetic measurements revealed that the saturation magnetization of NCFGs decreases as a function of the sintering temperature, but no regular trend was observed in the case of NCFPs and NCFUs. The photocatalytic degradation of the highly toxic RhB dye was successfully performed using all photocatalysts, where NCFPs showed the best results at all sintering temperatures due to their high surface area and low band gap. A steady decrease in the photocatalytic activity with sintering temperature was observed in the case of all Ni-Cr ferrites synthesized using different fuels, and the interpretation can be made on the basis of the decrease in the surface area, the increase in the PL intensity, and the loss of the number of surface hydroxyl groups. Better photocatalytic degradation was shown by NCFPs; thus, the highest rate constant was also recorded for NCFPs.
Acknowledgments
The authors greatly acknowledge the AMRC IIT Mandi for P-XRD studies and Director, IIC, IIT Roorkee, for carrying out FE-SEM, EDX, and VSM studies. The authors would also like to thank the Department of Chemistry, University of Jammu, Jammu, and funding agencies for instruments such as BET (DST-PURSE phase-II), PL (DST-PURSE phase-II), and UV-vis-NIR spectrophotometer (RUSA 2.0). The authors also gratefully acknowledge the CSIR, New Delhi, India, for JRF (09/100(0237)/2019-EMR-I).
Supporting Information Available
The Supporting Information is available free of charge at https://pubs.acs.org/doi/10.1021/acsomega.2c06249.
Rietveld refinement plots of Ni-Cr ferrite nanoparticles, N2 adsorption–desorption isotherm of all the nanocatalysts, diffuse reflectance spectra of Ni-Cr ferrite nanoparticles, Time-dependent UV–vis spectra for the degradation of Rhodamine B catalyzed by Ni-Cr ferrites, and EDX analysis of NCFP-1 before and after use (PDF)
The authors declare no competing financial interest.
Supplementary Material
References
- El Mragui A.; Zegaoui O.; da Silva J. C. E. Elucidation of the photocatalytic degradation mechanism of an azo dye under visible light in the presence of cobalt doped TiO2 nanomaterials. Chemosphere 2021, 266, 128931 10.1016/j.chemosphere.2020.128931. [DOI] [PubMed] [Google Scholar]
- Tang C.; Yi Y.; Yang Z.; Cheng X. Water pollution risk simulation and prediction in the main canal of the South-to-North Water Transfer Project. J. Hydrol. 2014, 519, 2111–2120. 10.1016/j.jhydrol.2014.10.010. [DOI] [Google Scholar]
- Miao X.; Tang Y.; Wong C. W. Y.; Zang H. The latent causal chain of industrial water pollution in China. Environ. Pollut. 2015, 196, 473–477. 10.1016/j.envpol.2014.11.010. [DOI] [PubMed] [Google Scholar]
- Kumar A.; Kumar A.; Sharma G.; Ala’a H.; Naushad M.; Ghfar A. A.; Guo C.; Stadler F. J. Biochar-templated g-C3N4/Bi2O2CO3/CoFe2O4 nano-assembly for visible and solar assisted photo-degradation of paraquat, nitrophenol reduction and CO2 conversion. Chem. Eng. J. 2018, 339, 393–410. 10.1016/j.cej.2018.01.105. [DOI] [Google Scholar]
- Nguyen T. K. A.; Pham T. T.; Nguyen-Phu H.; Shin E. W. The effect of graphitic carbon nitride precursors on the photocatalytic dye degradation of water-dispersible graphitic carbon nitride photocatalysts. Appl. Surf. Sci. 2020, 537, 148027 10.1016/j.apsusc.2020.148027. [DOI] [Google Scholar]
- Rashid M.; Ikram M.; Haider A.; Naz S.; Haider J.; Ul-Hamid A.; Shahzadi A.; Aqeel M. Photocatalytic, dye degradation, and bactericidal behavior of Cu doped ZnO nanorods and its molecular docking analysis. Dalton Trans. 2020, 49, 8314–8330. 10.1039/D0DT01397H. [DOI] [PubMed] [Google Scholar]
- Subramanyam K.; Sreelekha N.; Reddy D. A.; Ramanadha M.; Poornaprakash B.; Reddy K. C.; Vijayalakshmi R. P. Influence of transition metals co-doping on CeO2 magnetic and photocatalytic activities. Ceram. Int. 2020, 46, 5086–5097. 10.1016/j.ceramint.2019.10.252. [DOI] [Google Scholar]
- Karimi-Maleh H.; Fakude C. T.; Mabuba N.; Peleyeju G. M.; Arotiba O. A. The determination of 2-phenylphenol in the presence of 4-chlorophenol using nanoFe3O4/ionic liquid paste electrode as an electrochemical sensor. J. Colloid Interface Sci. 2019, 554, 603–610. 10.1016/j.jcis.2019.07.047. [DOI] [PubMed] [Google Scholar]
- Sun M.; Xu H. A novel application of plasmonics: Plasmon-driven surface-catalyzed reactions. Small 2012, 8, 2777–2786. 10.1002/smll.201200572. [DOI] [PubMed] [Google Scholar]
- Cui L.; Wang P.; Fang Y.; Li Y.; Sun M. A plasmon-driven selective surface catalytic reaction revealed by surface-enhanced Raman scattering in an electrochemical environment. Sci. Rep. 2015, 5, 11920 10.1038/srep11920. [DOI] [PMC free article] [PubMed] [Google Scholar]
- Duan S.; Wang R. Au/Ni12P5 core/shell nanocrystals from bimetallic heterostructures: In situ synthesis, evolution and supercapacitor properties. NPG Asia Mater. 2014, 6, e122 10.1038/am.2014.65. [DOI] [Google Scholar]
- Moradnia F.; Fardood S. T.; Ramazani A.; Gupta V. K. Green synthesis of recyclable MgFeCrO4 spinel nanoparticles for rapid photodegradation of direct black 122 dye. J. Photochem. Photobiol. A 2020, 392, 112433 10.1016/j.jphotochem.2020.112433. [DOI] [Google Scholar]
- Mandal B.; Panda J.; Paul P. K.; Sarkar R.; Tudu B. MnFe2O4 decorated reduced graphene oxide heterostructures: Nanophotocatalyst for methylene blue dye degradation. Vacuum 2020, 173, 109150 10.1016/j.vacuum.2019.109150. [DOI] [Google Scholar]
- Oliveira T. P.; Marques G. N.; Castro M. A. M.; Costa R. C. V.; Rangel J. H. G.; Rodrigues S. F.; dos Santos C. C.; Oliveira M. M. Synthesis and photocatalytic investigation of ZnFe2O4 in the degradation of organic dyes under visible light. J. Mater. Res. Technol. 2020, 9, 15001–15015. 10.1016/j.jmrt.2020.10.080. [DOI] [Google Scholar]
- Atrak K.; Ramazani A.; Fardood S. T. Eco-friendly synthesis of Mg0.5Ni0.5AlxFe2-xO4 magnetic nanoparticles and study of their photocatalytic activity for degradation of direct blue 129 dye. J. Photochem. Photobiol. A 2019, 382, 111942 10.1016/j.jphotochem.2019.111942. [DOI] [Google Scholar]
- Phadatare M. R.; Salunkhe A. B.; Khot V. M.; Sathish C. I.; Dhawale D. S.; Pawar S. H. Thermodynamic, structural and magnetic studies of NiFe2O4 nanoparticles prepared by combustion method: Effect of fuel. J. Alloys Compd. 2013, 546, 314–319. 10.1016/j.jallcom.2012.08.092. [DOI] [Google Scholar]
- Jadhav S. A.; Khedkar M. V.; Somvanshi S. B.; Jadhav K. M. Magnetically retrievable nanoscale nickel ferrites: An active photocatalyst for toxic dye removal applications. Ceram. Int. 2021, 47, 28623–28633. 10.1016/j.ceramint.2021.07.021. [DOI] [Google Scholar]
- Babu Naidu K. C.; Madhuri W. Hydrothermal synthesis of NiFe2O4 nano-particles: Structural, morphological, optical, electrical and magnetic properties. Bull. Mater. Sci. 2017, 40, 417–425. 10.1007/s12034-017-1374-4. [DOI] [Google Scholar]
- Rafique M. Y.; Ellahi M.; Iqbal M. Z.; Javed Q. u. a.; Pan L. Gram scale synthesis of single crystalline nano-octahedron of NiFe2O4: Magnetic and optical properties. Mater. Lett. 2016, 162, 269–272. 10.1016/j.matlet.2015.10.025. [DOI] [Google Scholar]
- Joshi S.; Kumar M.; Chhoker S.; Srivastava G.; Jewariya M.; Singh V. N. Structural, magnetic, dielectric and optical properties of nickel ferrite nanoparticles synthesized by co-precipitation method. J. Mol. Struct. 2014, 1076, 55–62. 10.1016/j.molstruc.2014.07.048. [DOI] [Google Scholar]
- Kannan Y. B.; Saravanan R.; Srinivasan N.; Ismail I. Sintering effect on structural, magnetic and optical properties of Ni0.5Zn0.5Fe2O4 ferrite nano particles. J. Magn. Magn. Mater. 2017, 423, 217–225. 10.1016/j.jmmm.2016.09.038. [DOI] [Google Scholar]
- Taha T. A.; Azab A. A.; Sebak M. A. Glycerol-assisted sol-gel synthesis, optical, and magnetic properties of NiFe2O4 nanoparticles. J. Mol. Struct. 2019, 1181, 14–18. 10.1016/j.molstruc.2018.12.075. [DOI] [Google Scholar]
- Amer M. A.; Meaz T. M.; Mostafa A. G.; El-Ghazally H. F. Annealing effect on the structural and magnetic properties of the CuAl0.6Cr0.2Fe1.2O4 nano-ferrites. Mater. Res. Bull. 2015, 67, 207–214. 10.1016/j.materresbull.2015.03.031. [DOI] [Google Scholar]
- Gharagozlou M. Synthesis, characterization and influence of calcination temperature on magnetic properties of nanocrystalline spinel Co-ferrite prepared by polymeric precursor method. J. Alloys Comp. 2009, 486, 660–665. 10.1016/j.jallcom.2009.07.025. [DOI] [Google Scholar]
- Aisida S. O.; Ahmad I.; Ezema F. I. Effect of calcination on the microstructural and magnetic properties of PVA, PVP and PEG assisted zinc ferrite nanoparticles. Phys. B 2020, 579, 411907 10.1016/j.physb.2019.411907. [DOI] [Google Scholar]
- El-Ghazzawy E. H.; Alamri S. N. NiCrxFe2–xO4 ferrite nanoparticles and their composites with polypyrrole: Synthesis, characterization and magnetic properties. Bull. Mater. Sci. 2015, 38, 915–924. 10.1007/s12034-015-0938-4. [DOI] [Google Scholar]
- Bushkova V. S.; Yaremiy I. P. Magnetic, electric, mechanical, and optical properties of NiCrxFe2–xO4 ferrites. J. Magn. Magn. Mater. 2018, 461, 37–47. 10.1016/j.jmmm.2018.04.025. [DOI] [Google Scholar]
- Dhiman M.; Goyal A.; Kumar V.; Singhal S. Designing different morphologies of NiFe2O4 for tuning of structural, optical and magnetic properties for catalytic advancements. New J. Chem. 2016, 40, 10418–10431. 10.1039/C6NJ03209E. [DOI] [Google Scholar]
- Liu S. Q.; Feng L. R.; Xu N.; Chen Z. G.; Wang X. M. Magnetic nickel ferrite as a heterogeneous photo-Fenton catalyst for the degradation of rhodamine B in the presence of oxalic acid. Chem. Eng. J. 2012, 203, 432–439. 10.1016/j.cej.2012.07.071. [DOI] [Google Scholar]
- Samson V. A. F.; Bernadsha S. B.; Mahendiran M.; Lawrence K. L.; Madhavan J.; Raj M.; Prathap S. Impact of calcination temperature on structural, optical, and magnetic properties of spinel CuFe2O4 for enhancing photocatalytic activity. J. Mater. Sci.: Mater. Electron. 2020, 31, 6574–6585. 10.1007/s10854-020-03213-0. [DOI] [Google Scholar]
- To Loan N. T.; Hien Lan N. T.; Thuy Hang N. T.; Quang Hai N.; Tu Anh D. T.; Thi Hau V.; Van Tan L.; Van Tran T. CoFe2O4 nanomaterials: Effect of annealing temperature on characterization, magnetic, photocatalytic, and photo-Fenton properties. Processes 2019, 7, 885. 10.3390/pr7120885. [DOI] [Google Scholar]
- Swathi S.; Yuvakkumar R.; Kumar P. S.; Ravi G.; Velauthapillai D. Annealing temperature effect on cobalt ferrite nanoparticles for photocatalytic degradation. Chemosphere 2021, 281, 130903 10.1016/j.chemosphere.2021.130903. [DOI] [PubMed] [Google Scholar]
- Singh S.; Sharma S.; Manhas U.; Qadir I.; Atri A. K.; Singh D. Different fuel-adopted combustion syntheses of nano-structured NiCrFeO4: A highly recyclable and versatile catalyst for reduction of nitroarenes at room temperature and photocatalytic degradation of various organic dyes in unitary and ternary solutions. ACS Omega 2022, 7, 19853–19871. 10.1021/acsomega.2c01616. [DOI] [PMC free article] [PubMed] [Google Scholar]
- Larson A. C.; Von Dreele R. B.. General Structure Analysis System (GSAS), Los Alamos National Laboratory Report LAUR, 2004; pp 86–748.
- Aisida S. O.; Paul A.; Ishaq A.; Maaza M.; Fabian I. E. Influence of PVA, PVP and PEG doping on the optical, structural, morphological and magnetic properties of zinc ferrite nanoparticles produced by thermal method. Phys. B 2019, 571, 130–136. 10.1016/j.physb.2019.07.001. [DOI] [Google Scholar]
- Khorsand Zak A.; Majid W. A.; Abrishami M. E.; Yousefi R. X-ray analysis of ZnO nanoparticles by Williamson-Hall and size-strain plot methods. Solid State Sci. 2011, 13, 251–256. 10.1016/j.solidstatesciences.2010.11.024. [DOI] [Google Scholar]
- Prabhakaran T.; Hemalatha J. Chemical control on the size and properties of nano NiFe2O4 synthesized by sol-gel autocombustion method. Ceram. Int. 2014, 40, 3315–3324. 10.1016/j.ceramint.2013.09.103. [DOI] [Google Scholar]
- Nabiyouni G.; Fesharaki M. J.; Mozafari M.; Amighian J. Characterization and magnetic properties of nickel ferrite nanoparticles prepared by ball milling technique. Chin. Phys. Lett. 2010, 27, 126401 10.1088/0256-307X/27/12/126401. [DOI] [Google Scholar]
- Massoudi J.; Smari M.; Nouri K.; Dhahri E.; Khirouni K.; Bertaina S.; Bessais L.; Hlil E. K. Magnetic and spectroscopic properties of Ni-Zn-Al ferrite spinel: from the nanoscale to microscale. RSC Adv. 2020, 10, 34556–34580. 10.1039/D0RA05522K. [DOI] [PMC free article] [PubMed] [Google Scholar]
- Ivanets A.; Prozorovich V.; Roshchina M.; Kouznetsova T.; Budeiko N.; Kulbitskaya L.; Hosseini-Bandegharaei A.; Masindi V.; Pankov V. A comparative study on the synthesis of magnesium ferrite for the adsorption of metal ions: Insights into the essential role of crystallite size and surface hydroxyl groups. Chem. Eng. J. 2021, 411, 128523 10.1016/j.cej.2021.128523. [DOI] [Google Scholar]
- Pourgolmohammad B.; Masoudpanah S. M.; Aboutalebi M. R. Effects of the fuel type and fuel content on the specific surface area and magnetic properties of solution combusted CoFe2O4 nanoparticles. Ceram. Int. 2017, 43, 8262–8268. 10.1016/j.ceramint.2017.03.158. [DOI] [Google Scholar]
- Luadthong C.; Itthibenchapong V.; Viriya-empikul N.; Faungnawakij K.; Pavasant P.; Tanthapanichakoon W. Synthesis, structural characterization, and magnetic property of nanostructured ferrite spinel oxides (AFe2O4, A= Co, Ni and Zn). Mater. Chem. Phys. 2013, 143, 203–208. 10.1016/j.matchemphys.2013.08.052. [DOI] [Google Scholar]
- Dom R.; Chary A. S.; Subasri R.; Hebalkar N. Y.; Borse P. H. Solar hydrogen generation from spinel ZnFe2O4 photocatalyst: Effect of synthesis methods. Int. J. Energy Res. 2015, 39, 1378–1390. 10.1002/er.3340. [DOI] [Google Scholar]
- Chaturvedi S.; Das R.; Poddar P.; Kulkarni S. Tunable band gap and coercivity of bismuth ferrite-polyaniline core-shell nanoparticles: The role of shell thickness. RSC Adv. 2015, 5, 23563–23568. 10.1039/C5RA00933B. [DOI] [Google Scholar]
- Shirsath S. E.; Patange S. M.; Kadam R. H.; Mane M. L.; Jadhav K. M. Structure refinement, cation site location, spectral and elastic properties of Zn2+ substituted NiFe2O4. J. Mol. Struct. 2012, 1024, 77–83. 10.1016/j.molstruc.2012.05.014. [DOI] [Google Scholar]
- Baykal A.; Güner S.; Demir A.; Esir S.; Genç F. Effects of Zinc substitution on magneto-optical properties of Mn1–xZnxFe2O4/SiO2 nanocomposites. Ceram. Int. 2014, 40, 13401–13408. 10.1016/j.ceramint.2014.05.059. [DOI] [Google Scholar]
- Bharathi K. K.; Noor-A-Alam M.; Vemuri R. S.; Ramana C. V. Correlation between microstructure, electrical and optical properties of nanocrystalline NiFe1.925Dy0.075O4 thin films. RSC Adv. 2012, 2, 941–948. 10.1039/C1RA00161B. [DOI] [Google Scholar]
- Yuan Z.-h.; Wei Y.; Jun-hui J.; Li-de Z. Optical absorption red shift of capped ZnFe2O4 nanoparticle. Chin. Phys. Lett. 1998, 15, 535–537. 10.1088/0256-307X/15/7/024. [DOI] [Google Scholar]
- Chandekar K. V.; Shkir M.; AlFaify S. Tuning the optical band gap and magnetization of oleic acid coated CoFe2O4 NPs synthesized by facile hydrothermal route. Mater. Sci. Eng. B 2020, 259, 114603 10.1016/j.mseb.2020.114603. [DOI] [Google Scholar]
- Brus L. E. Electron-electron and electron-hole interactions in small semiconductor crystallites: The size dependence of the lowest excited electronic state. J. Chem. Phys. 1984, 80, 4403–4409. 10.1063/1.447218. [DOI] [Google Scholar]
- Martha S.; Reddy K. H.; Parida K. M.; Satapathy P. K. Enhanced photocatalytic activity over N-doped Ga, Zn mixed oxide under visible light irradiation. Intern. J. Hydrogen Energy 2012, 37, 115–124. 10.1016/j.ijhydene.2011.09.068. [DOI] [Google Scholar]
- Yu J.; Dai G.; Xiang Q.; Jaroniec M. Fabrication and enhanced visible-light photocatalytic activity of carbon self-doped TiO2 sheets with exposed {001} facets. J. Mater. Chem. 2011, 21, 1049–1057. 10.1039/C0JM02217A. [DOI] [PubMed] [Google Scholar]
- Sinha A.; Anirban S.; Bandyopadhyay S.; Dutta A.. Effect of Sintering Temperature on Structural, Optical and Electrical Relaxation Properties of Gd-doped Nickel-ferrites, AIP Conference Proceedings, 2017; p 110021.
- Pattnaik S. P.; Behera A.; Martha S.; Acharya R.; Parida K. Synthesis, photoelectrochemical properties and solar light-induced photocatalytic activity of bismuth ferrite nanoparticles. J. Nanoparticle Res. 2018, 20, 10. 10.1007/s11051-017-4110-5. [DOI] [Google Scholar]
- Kumar V.; Kumar N.; Das S. B.; Singh R. K.; Sarkar K.; Kumar M. Sol-gel assisted synthesis and tuning of structural, photoluminescence, magnetic and multiferroic properties by annealing temperature in nanostructured zinc ferrite. Mater. Today: Proc. 2021, 47, 6242–6248. 10.1016/j.matpr.2021.05.215. [DOI] [Google Scholar]
- Da Dalt S.; Takimi A.; Volkmer T. M.; Sousa V.; Bergmann C. Magnetic and Mössbauer behavior of the nanostructured MgFe2O4 spinel obtained at low temperature. Powder Technol. 2011, 210, 103–108. 10.1016/j.powtec.2011.03.001. [DOI] [Google Scholar]
- Williams G. V. M.; Prakash T.; Kennedy J.; Chong S. V.; Rubanov S. Spin-dependent tunnelling in magnetite nanoparticles. J. Magn. Magn. Mater. 2018, 460, 229–233. 10.1016/j.jmmm.2018.04.017. [DOI] [Google Scholar]
- Gubin (Ed.) S. P. Magnetic Nanoparticles; Wiley-VCH Verlag: Weinheim, Germany, 2009. [Google Scholar]
- Lu A. H.; Salabas E. L.; Schut F. Magnetic nanoparticles: Synthesis, protection, functionalization, and application. Angew. Chem., Int. Ed. 2007, 46, 1222–1244. 10.1002/anie.200602866. [DOI] [PubMed] [Google Scholar]
- Houshiar M.; Zebhi F.; Razi Z. J.; Alidoust A.; Askari Z. Synthesis of cobalt ferrite (CoFe2O4) nanoparticles using combustion, coprecipitation, and precipitation methods: A comparison study of size, structural, and magnetic properties. J. Magn. Magn. Mater. 2014, 371, 43–48. 10.1016/j.jmmm.2014.06.059. [DOI] [Google Scholar]
- Saha M.; Mukherjee S.; Kumar S.; Dey S.; Gayen A. Albumin matrix assisted wet chemical synthesis of nanocrystalline MFe2O4 (M = Cu, Co and Zn) ferrites for visible light driven degradation of methylene blue by hydrogen peroxide. RSC Adv. 2016, 6, 58125. 10.1039/C6RA04825K. [DOI] [Google Scholar]
- Stoner E. C.; Wohlfarth E. P. A mechanism of magnetic hysteresis in heterogeneous alloys. Philos. Trans. R. Soc., A 1948, 240, 599–642. 10.1098/rsta.1948.0007. [DOI] [Google Scholar]
- Wu L.; Olivier J. P.; David B.; Wayne I.; Alshakim N.; Huiyuan Z.; Sen Z.; Shouheng S. Monolayer assembly of ferrimagnetic CoxFe3–xO4 nanocubes for magnetic recording. Nano Lett. 2014, 14, 3395–3399. 10.1021/nl500904a. [DOI] [PubMed] [Google Scholar]
- Hu L.; Li M.; Cheng L.; Jiang B.; Ai J. Solvothermal synthesis of octahedral and magnetic CoFe2O4-reduced graphene oxide hybrids and their photo-Fenton-like behavior under visible-light irradiation. RSC Adv. 2021, 11, 22250–22263. 10.1039/D1RA03103A. [DOI] [PMC free article] [PubMed] [Google Scholar]
- Zhang D.; Wang Q.; Wang L.; Zhang L. Magnetically separable CdFe2O4/graphene catalyst and its enhanced photocatalytic properties. J. Mater. Chem. A 2015, 3, 3576–3585. 10.1039/C4TA05419A. [DOI] [Google Scholar]
- Fardood S. T.; Atrak K.; Ramazani A. Green synthesis using tragacanth gum and characterization of Ni-Cu-Zn ferrite nanoparticles as a magnetically separable photocatalyst for organic dyes degradation from aqueous solution under visible light. J. Mater. Sci.: Mater. Electron. 2017, 28, 10739–10746. 10.1007/s10854-017-6850-5. [DOI] [Google Scholar]
- Magalhães F.; Pereira M. C.; Botrel S. E. C.; Fabris J. D.; Macedo W. A.; Mendonca R.; Lago R. M.; Oliveira L. C. A. Cr-containing magnetites Fe3–xCrxO4: The role of Cr3+ and Fe2+ on the stability and reactivity towards H2O2 reactions. Appl. Catal. A 2007, 332, 115–123. 10.1016/j.apcata.2007.08.002. [DOI] [Google Scholar]
Associated Data
This section collects any data citations, data availability statements, or supplementary materials included in this article.


