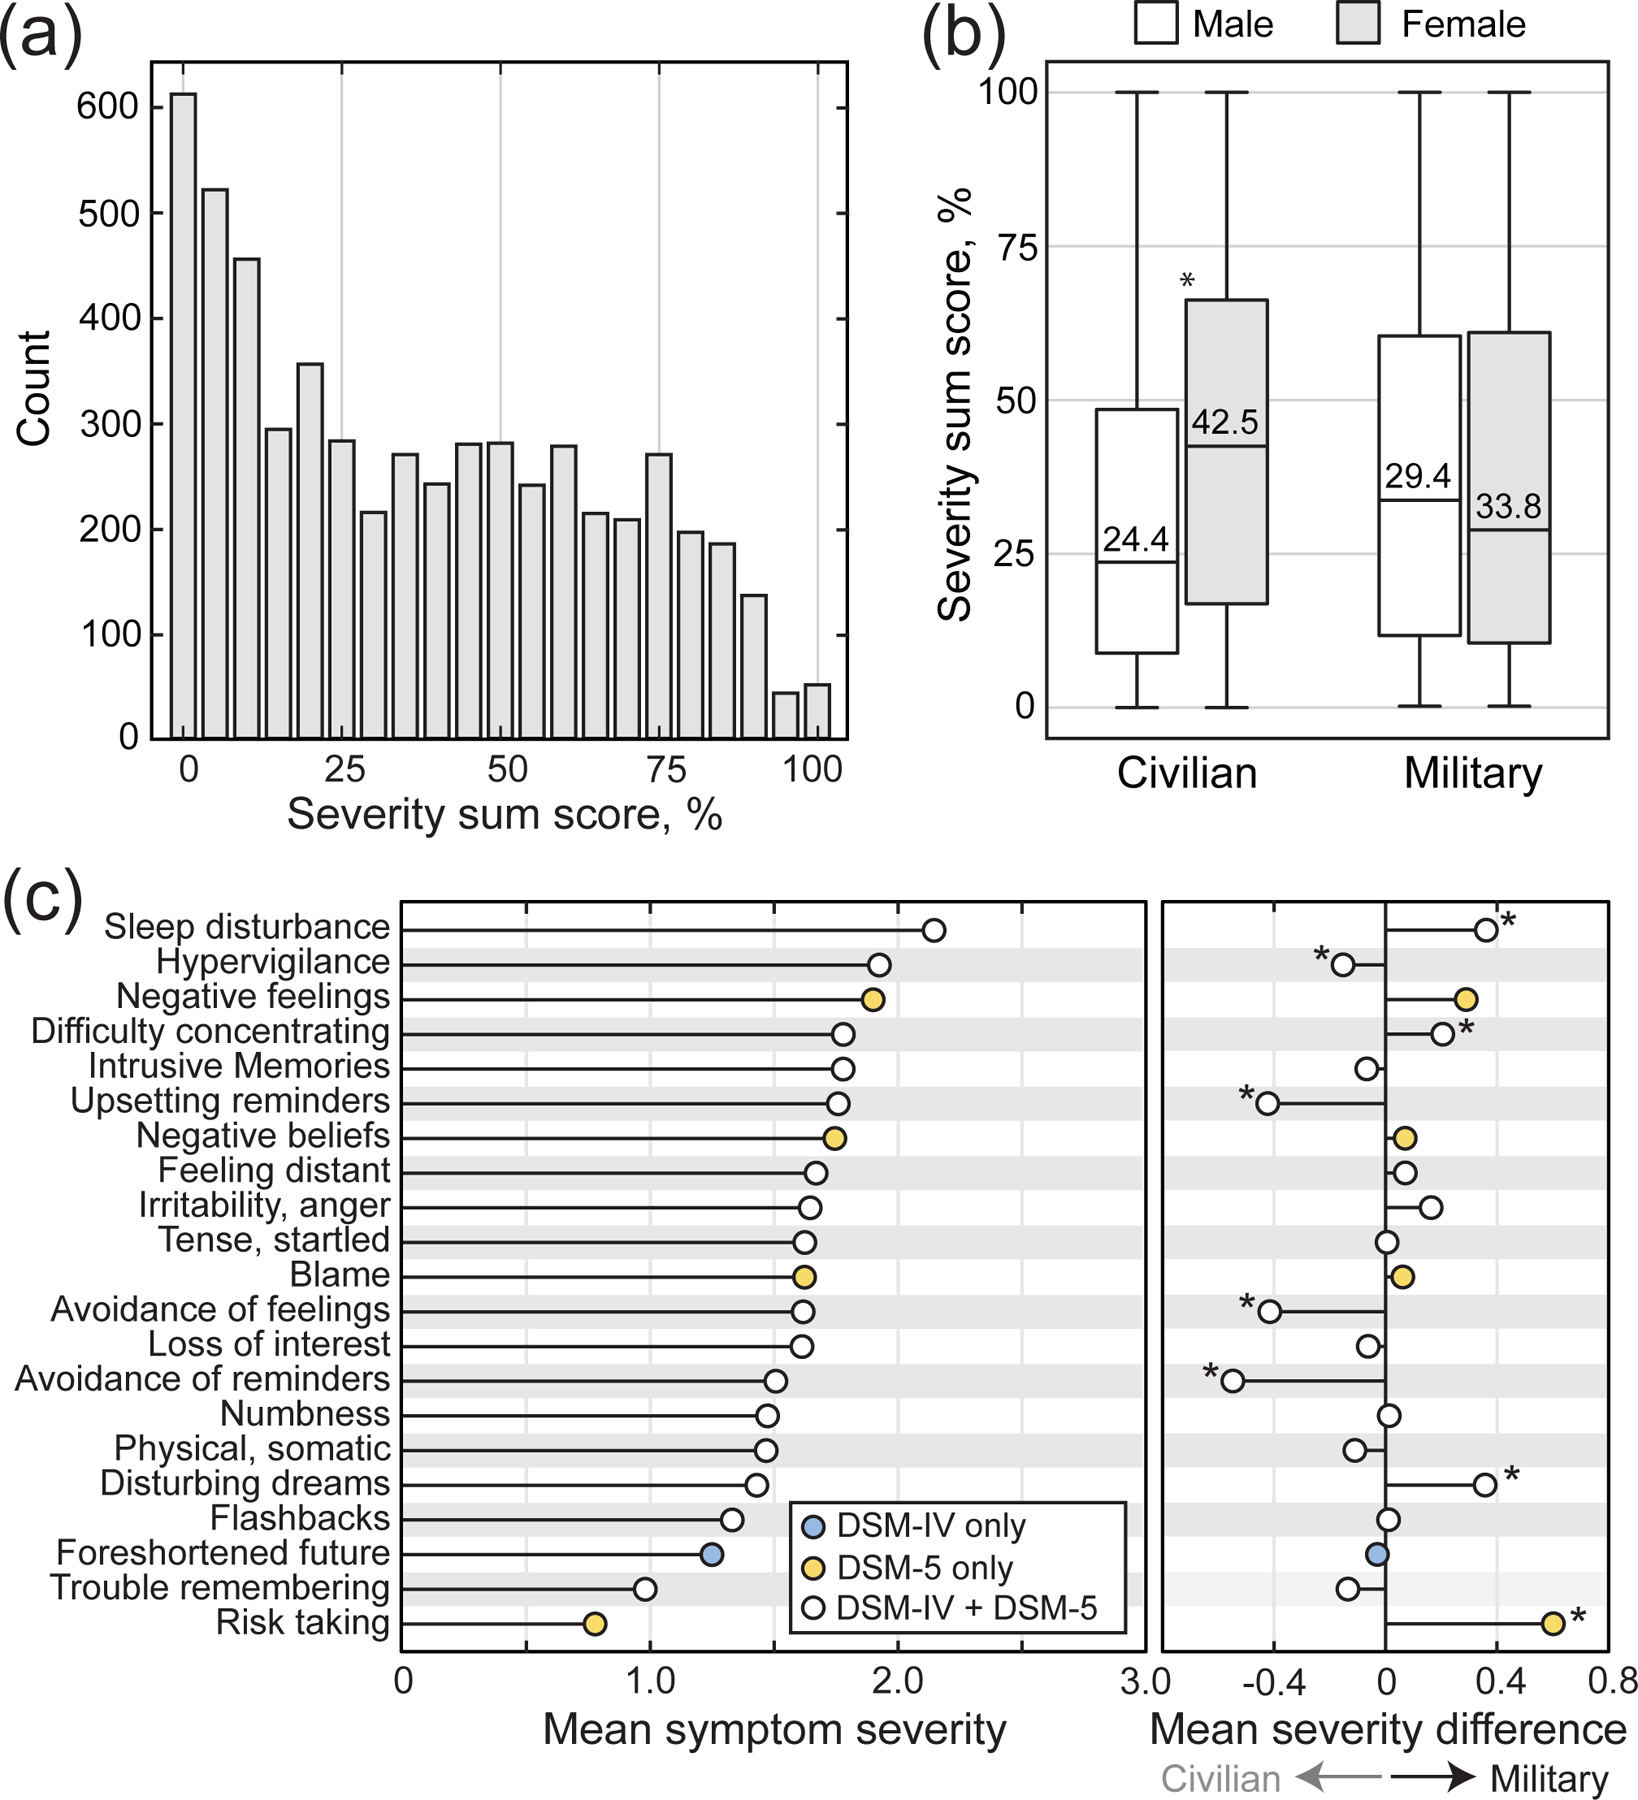
Figure 1: Summary of PTSD symptom reporting across all datasets.

(a) A histogram illustrates the distribution of all raw percentage severity sum scores. (b) Percentage severity sum scores are shown broken out as boxplots by military status and sex/gender. (c) A stem plot shows the mean severity reported for each item. (c, right) The average differences between military and civilian severity scores are shown for each item. (* indicates significance at p<0.05 after q correction for multiple comparisons).
