

Abstract
Abstract
During the coronavirus epidemic, food supply chains have been affected by disruptions of this epidemic. Having an overview and considering food-related factors such as energy, waste, and water make the design of the supply chain more effective. In this study, a multi-objective model for a sustainable food supply chain is presented based on the prevalence of coronavirus by considering the food-energy-water-waste nexus. There are dual-channel sales including online and in-person channels, which their demand functions depend on products price in every channel, as well as the prevalence of coronavirus in high-risk or low-risk areas. Distribution centers, located in high-risk regions, require the disinfection of products to minimize coronavirus spread. Indeed, the proposed mathematical model has three objective functions that the first objective maximizes the profit of the food supply under COVID-19 conditions. The other two objectives minimize not only the environmental impact of transportation, but also the delivery time. In order to solve this multi-objective model, the epsilon constraint method, as an efficient technique, is employed. To validate the proposed model, the model is finally implemented in a two-channel supply chain in Iran. The results show that the food supply chain has a close relationship with the energy-water-waste nexus COVID-19 and can also affect customers' behavior. Moreover, the model shows when the prevalence of COVID-19 increases, people tend to buy from online shops, affecting product prices that can change by nearly 50%.
Graphical abstract

Keywords: Food supply chain, Nexus, COVID-19, Sustainability
Introduction
The food supply chain (FSC) has constantly been challenged by various events or crises like food safety and health (Mu et al., 2021); the COVID-19 pandemic has shown FSC fragility (Sarkis et al., 2020). Due to the COVID-19 epidemic worldwide, many countries started to adopt some preventive policies for restricting the epidemic and trying to control the current situation, while such restrictions have disrupted the national and international supply chains. Moreover, about 90% of jobs have been affected by supply chain disruptions because of the COVID-19 outbreak (Grida, Mohamed, and Zaied 2020).
Coronavirus has affected FSCs from two perspectives: First is the food supply and demand (Rowan & Galanakis, 2020), and the second problem comes from the restrictions on transportation, such as closing national and international borders and changing consumer behavior (Barman et al., 2021). The consciences of these issues have affect different aspects of the world, for example, a loss of demand in the agricultural industry for farmers, so a severe economic crisis has happened (De Vito and Gómez 2020). The COVID-19 effects lead to other problems as well, such as food security (Rowan & Galanakis, 2020). FSCs consist of many levels, such as farmers, manufacturers, distributions, and stores (Astill et al., 2019); if any member or level in FSC becomes unhealthy, the whole community is at risk (Staniforth, 2020). Thus, the need for studying the food supply and food security is an essential subject for countries (Manzini & Accorsi, 2013).
The food supply chain is the second most prioritized matter after medicine for the period of the COVID-19 pandemic (Chitrakar et al., 2021). After the COVID-19 outbreak, a constrained food supply chain has happened because panic purchasing led to empty shelves (Njomane & Telukdarie, 2022). Food security and supplying food are affected by COVID-19 which reduced production rates because of restrictions to manage it; however, the main challenge is the consumers' ability to access food (Deconinck et al., 2020). The food supply chain should be agile and react to the shocks of COVID-19 while controlling food price increases due to uncertainty and scarcity (Aday & Aday, 2020). Moreover, the other effect of COVID-19 on the food supply chain is the reduced speed of food movement (O'Hara & Toussaint, 2021).
As shown in Fig. 1, the link between food, energy, water, and waste (FEWW) is investigated as an important issue (Garcia et al., 2019; Kibler et al., 2018). The FEWW nexus can be defined as an approach to estimating, developing, and implementing policies that consider optimal conditions for each segment in the nexus. Nexus provides a conceptual and analytical approach to socio-environmental systems and offers a framework for coordinating segments and managing natural resources (Costa, 2015). Many elements in the FEWW nexus interact with each other, and also they associate with various environmental, social, and economic factors (Smith et al., 2014). For example, the COVID-19 outbreak has affected energy consumption; restrictions like curfews have reduced fuel consumption (De Vos, 2020). Moreover, since people prefer to stay home, demand for residential electricity has increased. On the other hand, regarding the closure of industrial and commercial units, the amount of electricity loads in these sectors has significantly decreased (Senthilkumar et al., 2020). Additionally, coronavirus affects the water sources since severe acute respiratory syndrome coronavirus-2 (SARS-CoV-2) has been diagnosed in untreated wastewater (Vickers, 2017). Moreover, water consumption in residential areas has slightly increased, but commercial and industrial consumption declined during the COVID-19 pandemic (Kalbusch et al., 2020).
Fig. 1.
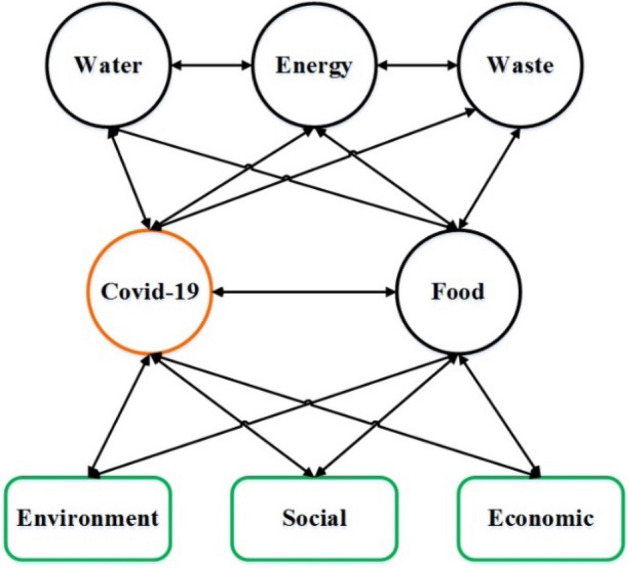
The impact of coronavirus epidemic on FEWW nexus in sustainable conditions
Medical personnel and people have to use personal protective equipment, such as face masks or shields and hand gloves, to prevent the transmission of COVID-19, so medical and healthcare wastes significantly increase (Organization, 2006). On the other hand, burning these kinds of wastes have threatened human and the environment (Chowdhury et al., 2022). Furthermore, COVID-19 increased the quantity of household food waste (Everitt et al., 2021), and also it has affected agricultural products (Cariappa et al., 2021). Additionally, COVID-19 has impacted sustainability, society, the environment, and the economy; the effects of COVID-19 on society often have adverse effects such as decrement in the communities' general health, increased depression, closed educational centers, and adjusted labor force (Akat & Karataş, 2020; Haleem et al., 2020). On the other hand, due to changes in people's lifestyles, it has often had positive impacts on the environment; for example, the decrement in air and noise pollution and the decrement in greenhouse gas emissions (Verma & Prakash, 2020).
Food is considered a valuable commodity, but it turns into waste and affects the environment (Lioutas & Charatsari, 2020). Decreasing food waste is recognized as a critical lever for lowering the environmental effects of FSC (Read et al., 2020). Moreover, energy and water have crucial roles in the life cycle of a food product, from farmers to use at final consumption. By and large, FSC consumes about 30% of the world's total energy, and agriculture is the largest water consumer globally, consuming about 70% of the total freshwater resources (Hoff, 2011). Furthermore, it is predicted that water supply costs will increase by about 50% in developing countries and 18% in developed countries by 2025 (Garcia & You, 2016). It is worth noting that food contributes 31% of the EU's total greenhouse gas emissions (Zhu et al., 2018).
This study designs the sustainable FSC which is affected by COVID-19. As shown in Fig. 2, areas are considered into two categories, high risk and low risk, based on the average of their level of coronavirus prevalence during a certain time. In high-risk areas, distributors are required to disinfect products because of food safety in order to minimize the spread of the virus and pay attention to social issues. This shows a connection between the water and waste sectors in the nexus.
Fig. 2.

Food supply chain under the coronavirus
Distributors cover certain stores in each region and send the products to them, but they can supply their products from all the suppliers which are located everywhere. Stores also have dual sales channels, online and in-person sales, because of the condition of the coronavirus. Another important point in this model is the demand function, which is defined separately for both in-person and online sales, and they depend on the prevalence of coronavirus in the regions and the price of products. In this problem, the type of vehicles is also considered for the movement of products from suppliers to distributors and from distributors to stores. Vehicles have certain capacities and speeds; based on them, the delivery time of products is minimized. Overall, this study presents a multi-objective mathematical model for the FEWW nexus in a sustainable FSC during the COVID-19 pandemic. The objective functions of the problem are maximization of profit, minimization of supply chain impacts on the environment, and minimization of delivery time. Some of the innovations of this research are as follows:
Designing a sustainable FSC with respect to the link among FEWW during the COVID-19 pandemic.
Considering the COVID-19 effects and separation of areas into high risk and low risk, as well as considering disinfection of products and food safety.
Analyzing dual-channel sales including online and in-person channels.
Optimization of the prices of products in each channel according to the demand functions, which depends on the prevalence of coronavirus in each region and the price of products.
Considering different vehicles to move products as well as minimizing shipping time.
The remainder of this paper is organized as follows. Section 2 reviews the relevant literature. In Sect. 3, the mathematical model is presented, and Sect. 4 depicts a solution strategy to solve the multi-objective model, which is the epsilon constraint. Section 5 describes a case study that proves the mathematical model function. Section 6 shows sensitive analyses that depict critical variables and parameters. Finally, Sect. 7 describes the results and gives some managerial insights.
Literature review
Food supply chains have always been a popular subject of study given the fundamental need of society for food and have been studied in various domains, especially its links with sustainability aspects and other subjects such as water, waste, and energy. In recent years, due to COVID-19 and its problems, much research has been done to address these problems. This section describes some outstanding research relating to this issue.
Food supply chain and COVID-19 pandemic
The management of food supply chains before and during COVID-19 has been paid attention to tackle some related problems. For instance, Bottani et al. (2019) addressed designing a resilient FSC that provided a two-objective mixed-integer programming model in order to maximize the total profit and minimize the total supply chain lead time. In a study, Nakandala and Lau (2018) investigated the properties of supply and demand in FSC strategies in the real world. This study discussed how retailers adopted a wide range of systems to meet the specific needs of consumers and local producers.
Furthermore, the effects of COVID-19 on FSC have received vast attention, and various articles have addressed this issue. Nandi et al. (2021) provided a report on the coronavirus epidemic for flexibility, transparency, and supply chain stability. According to this study, the supply chain needs to develop localization, agility, and digitalization features. Mahajan and Tomar (2021) have addressed the disruptions in FSC and the economic impact of COVID-19 in India. They evaluated one of the largest online food retailers for surveying the effects of inventory and product prices. Coluccia et al. (2021) have carried out research to survey the price and flexibility of food products against the epidemic coronavirus. The results indicated that fresh and perishable products, which were produced or harvested during the first wave of COVID-19, were affected by price changes, while storable products were not significantly impacted. Aday and Aday (2020) provided recommendations for decreasing and controlling the effects of the coronavirus epidemic by surveying the impacts of COVID-19 on agriculture and food. Dominici et al. (2021) surveyed the factors which increase the likelihood of buying food online. Wu et al. (2021) made a decision model with greenhouse gas emissions according to the online stores and their suppliers.
Food supply chain nexus
The FEWW nexus has been studied, and their relationship with food supply chains is modeled in many papers. Qu et al. (2021) discussed the food-energy nexus in the marine environment and provided an economic analysis of energy production from wind. Moreover, Gao et al. (2021) provided a two-stage stochastic programming approach to understand and manage the food-energy-water (FEW) nexus under uncertainty in the water supply. In the other study, Yue et al. (2021) suggested a fuzzy optimization approach for FEW nexus, and climate changes in order to promote economic and social developments, livelihood, and minimization of carbon dioxide emissions. Wang et al. (2018) developed a FEW nexus model to evaluate the sustainability of a food supply chain. This model has been used to analyze FSC in China, and its results indicated that the sustainable food supply chain in China was relatively low in efficiency in 2005. Afshar et al. (2022) considered not only the relationship among nexus parts, but also the internal interaction among subsystems. They used a simulation approach to find valuable insight into the nexus' internal and external relationships.
In terms of the energy and water as parts of the nexus, Esmaeilion et al. (2022a, 2022b) presented the multi-objective particle swarm optimization algorithm in order to optimize conditions for sustainable energy resources. In another study, Esmaeilion et al., (2022a, 2022b) paid attention to economic and environmental features of an energy system and air pollution social cost. Moreover, Esmaeilion et al. (2021) evaluated the possibility of using renewable energy to tackle the shortage of freshwater. Furthermore, Esmaeilion (2020) provided information about both energy and water to mitigate climate change.
In a study, Taghikhah et al. (2021) modeled the interaction between consumer preferences and various social and environmental issues related to agriculture and food production. Parashar et al. (2020) offered holistic and practical insights for stakeholders to improve the effectiveness and reduce food wastage and carbon emissions. Tan and Aviso (2021) surveyed the limitations of the food life cycle and then suggested a comprehensive optimization method for maximizing the system's environmental performance.
As above mentioned, a large number of articles have been published on FSC. Table 1 compares some articles to identify research gaps in such a domain better:
Table 1.
Review of previous literature and research
| Reference | Year | Model | Objective function | Distribution | Sustainability | Lead time | Nexus | COVID-19 | Dual-Channel | Objectives | Case study | |
|---|---|---|---|---|---|---|---|---|---|---|---|---|
| Single | Multi | |||||||||||
| Chen et al | 2016 | EOQ / EPQ | * | * | Minimization the total cost of the agricultural supply chain | – | ||||||
| Bortolini et al | 2016 | LP | * | * | * | * | Optimization operating cost, carbon footprint and delivery time | Fruits and vegetables / Italy | ||||
| Li et al | 2017 | Game theory | * | * | * | * | Optimal price and quoted delivery lead time decisions | – | ||||
| Chen et al | 2018 | Game theory | * | * | * | * | Optimization prices | – | ||||
| Nguyen et al | 2019 | MIP | * | * | * | Optimization vehicle routing problems | – | |||||
| Accorsi et al | 2019 | MIP | * | * | * | Maximization the profit and minimization the carbon emissions | – | |||||
| Sharma et al | 2020 | MCDM | * | * | * | Assessed risks of agricultural supply chain under COVID-19 | India | |||||
| Zhao and You | 2021 | MIP | * | * | * | * | Minimization the total cost | Garbage in New York | ||||
| Al-Saidi and Hussein | 2021 | – | * | * | * | Analyzing the interaction among FEW and COVID-19 | - | |||||
| Achmad et al | 2021 | MINLP | * | * | * | Maximization demand satisfaction and minimization total cost | Rice supply chain | |||||
| Yin et al | 2022 | – | * | * | * | Introducing actions to recover the FEW nexus under COVID-19 | – | |||||
| This study | MINLP | * | * | * | * | * | * | * | Optimization FEWW nexus in designing a sustainable food supply chain model under COVID-19 | Chain stores in Iran | ||
The effects of COVID-19 on the FSC as well as the relationship between FEWW and sustainability are known as an important subject. According to the literature review, it is clear that the previous studies have not considered FEWW nexus, FSC, and COVID-19 simultaneously. In addition, in this study, the FSC is designed according to the status and prevalence of coronavirus in different areas, which are considered high-risk and low-risk areas. Disinfection of products is done by distributors in high-risk areas with considering water consumption and waste management. Another important point in this study is the demand function in the dual-channel sales of stores; demands are affected by the prevalence of coronavirus in each area and also the price of products in each channel. Moreover, considering the vehicles, the amount of energy, environmental effects, as well as the time of delivery of products are considered.
Mathematical model
The details of the multi-objective mathematical optimization model are provided in this section. The objectives of the present model are to optimize the relationship among water, waste, energy, and food regarding the sustainability in which the impact of the COVID-19 pandemic on FSC is considered. The model description is shown below before presenting its mathematical model.
Objective functions:
Profit maximization = revenue from the sale of products via both online and in-person channels – costs (product supply costs + transportation costs and costs of compliance with health protocols and disinfection of products + fixed costs of establishment + costs of waste generation + water consumption costs)
Environmental impact minimization = carbon emissions from transportation + carbon emissions from operations
Product transfer time minimization = delay penalty × (expected time of product delivery – real time of product delivery)
Subject to:
Determination of product demand and price
Capacity limits of facilities
Balance the flow of goods in the network between facilities
Specifying constraints on the possibility of delivery from one facility to another
Consideration of the type, capacity, and quantity of vehicles
Determination of the delivery time of products according to the type of vehicle and the distance between facilities
Non-negativity and binary constraints on decision variables
As seen in the above description, the model includes three objectives that cover the optimization of FSC by considering the link among water, waste, energy, and food regarding sustainability and the COVID-19 pandemic. The indicators, parameters, and variables used to formulate the problem mathematically are described in the following.
| Index | ||
|---|---|---|
| Collection of manufacturers | ||
| Collection of distributors | ||
| Collection of disinfection and sterilization centers | ||
| Collection of stores | ||
| Collection of customer regions (Sales) | ||
| Collection of products | ||
| A set of modes of transport or a set of vehicles |
| Parameter | |
|---|---|
| Transportation distance (km) from manufacturer m to distribution center d | |
| Transportation distance (km) from distribution center d to store r | |
| Transportation distance (km) from store r to region c | |
| Preventive cost of health protocols and transportation cost per kilometer for product j from manufacturer m to distribution center d by vehicle v | |
| Preventive cost of health protocols and transportation cost per kilometer for product j from distribution center d to store r by vehicle v | |
| Preventive cost of health protocols and transportation cost as unit per kilometer for product j from store r to region c by vehicle v | |
| Cost of supply and purchase of product j from supplier m | |
| Cost of water consumption and disinfection of product j by disinfection and sterilization center a | |
| Production of sanitary wastes in product disinfection j | |
| Cost of collection and disposal of sanitary wastes for the product j | |
| Maximum production capacity, manufacturer m for product j | |
| Maximum capacity of distribution center d for product j | |
| Maximum disinfection and sterilization capacity of disinfection and sterilization center a for product j | |
| Maximum retail supply capacity r for product j | |
| Maximum vehicle capacity v | |
| Maximum vehicle speed v | |
| Fixed cost of purchasing a vehicle v | |
| Fixed cost of construction of distribution center d | |
| Fixed cost of construction of a disinfection and sterilization center a | |
| Fixed cost of construction of a retail center r | |
| Carbon emission costs due to transportation by vehicle v per kilometer | |
| Operating carbon emission costs for the product j | |
| Delay cost of delivery of product j | |
| Expected time of delivery of product j from manufacturer m to distribution centers d | |
| Expected time to delivery product j from distribution center d to store r | |
| Disinfection time of product j in distribution center d in disinfection and sterilization center a | |
| Expected time to delivery product j from disinfection and sterilization center a to store r | |
| Expected time to delivery product j from store r to region c in online sales | |
| It is equal to 1 if delivery from manufacturer m to distribution center d is allowed, otherwise it is 0 | |
| It is equal to 1 if delivery from distribution center d to store r is allowed, otherwise it is 0 | |
| It is equal to 1 if the disinfection center a in warehouse d is active, otherwise it is 0 | |
| It is equal to 1 if delivery from disinfection center a to store r is allowed, otherwise it is 0 | |
| It is equal to 1 if delivery from store r to region c is allowed, otherwise it is 0 | |
| In-person purchase market elasticity for product demand j in region c | |
| Online shopping market elasticity for the demand of product j in region c | |
| The rate of change in the purchase of product j in region c due to the COVID-19 pandemic | |
| COVID-19 pandemic status in region c (range 0 to 1) | |
| Price significance coefficient on in-person demand of product j | |
| Coefficient of price importance on online demand of product j | |
| Percentage of tolerance that the price of in-person sales of a product can differ from the cost of supply | |
| Percentage tolerance that the price of the online sales of a product can differ from the cost of supply | |
| Big number |
| Variable | |
|---|---|
| The quantity of product j delivered from manufacturer m to distribution center d by vehicle v | |
| The quantity of product j delivered from the distribution center d to the store r by vehicle v | |
| The quantity of product j disinfected in the distribution center d in the disinfection and sterilization center a | |
| The quantity of product j delivered from the disinfection and sterilization center a to the store r | |
| The quantity of product j delivered from the store r in region c by vehicle v (online sales) | |
| The quantity of product j sold at the store r in region c (in-person sales) | |
| It is equal to 1 if the distribution center d is constructed, otherwise it is 0 | |
| It is equal to 1 if the disinfection center a is constructed, otherwise it is 0 | |
| It is equal to 1 if the store center r is constructed, otherwise it is 0 | |
| It is equal to 1 if a v-type vehicle is used, otherwise it is 0 | |
| The number of v-type vehicles used | |
| Online sales price of the product j | |
| In-person sales price of the product j | |
| Online demand for product j by region c and store r | |
| In-person demand for product j by region c and store r | |
| Delivery time of product j from manufacturer m to distribution center d | |
| Delivery time of product j from distribution center d to store r | |
| Delivery time of product j from disinfection and sterilization center a to store r | |
| Delivery time of product j from store r to region c in online sales |
The FEWW nexus food supply chain influenced by the COVID-19 pandemic is formulated in the following sections.
Objective functions
Objective functions of the mathematical model consist of three objective functions.
The first objective function
The first objective function is related to maximizing the profit of food supply chain which contributes to retailers addressing the financial problems due to the COVID-19 pandemic; it is expressed in Eq. (6). The profit is calculated from the difference between the amounts of product sales in both in-person and online channels shown in Eq. (1) and the chain costs shown in Eq. (2). It is notable to mention that this problem also considers online sales due to the widespread advertising of online shopping and social distancing during the COVID-19 pandemic (Barman et al., 2021).
| 1 |
| 2 |
It should be mentioned that the costs of complying with health protocols and disinfecting products added a heavy burden to FSC during the COVID-19 pandemic (Sharma, Tyagi, and Bhardwaj 2021). The use of health products such as masks and disinfectants in warehouses, stores, and delivery times has increased (Singh et al., 2021). In this model, transportation costs () are calculated by considering the costs of complying with health protocols, according to the distance () and the number of shipped products (). In this way, the model minimizes the spread of COVID-19 by considering programs such as establishing health conditions and monitoring and disinfecting products and facilities (Rizou et al., 2020). Moreover, a product disinfection center () shall be established for distribution centers located in contaminated regions to disinfect products before entering the store. Although this disinfection has cost (), it minimizes the transmission of COVID-19 infection.
With the increase in health product use, the environment has been affected by the waste generated and water used for washing and disinfection, contaminating drinking water (Bhowmick et al., 2020). It is required to pay attention to this important part in the form of costs of waste products resulting from compliance with health protocols () and costs of disinfection of centers, equipment, and products ().
The second objective function
Given the impact of the COVID-19 pandemic on logistics, processes, and freight, the second objective function is formulated to reduce the environmental impact of transportation in Eq. (3) and operations on goods in Eq. (4); the sum of these two equations forms the second objective function and is shown in Eq. (7).
| 3 |
| 4 |
The third objective function
Product freshness is another issue in FSC, especially during the COVID-19 because of barriers to transportation. Customers request newly produced products (Sebatjane & Adetunji, 2020). It is required in food to minimize the transportation time to maintain the freshness of the products (Bortolini et al., 2016). The third objective function is formulated in Eq. (5) and (8) regarding the constraints created by the COVID-19 pandemic and its potential impacts on the supply chain to maintain product quality and reduce delivery time. In this regard, the maximum expected delivery time () is reduced from the real delivery time (). According to the product type and its sensitivity, a penalty is considered in case of delay for each product.
| 5 |
According to the above description, the ultimate objective functions are defined as follows:
| 6 |
| 7 |
| 8 |
Price and demand constraints
Since supply and demand in food products have been affected, shortages and surpluses have happened in different places (Barman et al., 2021). Moreover, supply reduction is known as a factor that increases product prices, so the balance between supply and demand is one of the important issues. The COVID-19 pandemic potentially affects customer demand and the price of each product (Hobbs, 2020). Hence, constraints (9) and (10) show the demand level through in-person () and online () sales, respectively. Some products during the COVID-19 pandemic, particularly many products prescribed for the treatment of this disease, altered consumer demand () (Aman & Masood, 2020), so these changes in demand affected FSC. The demand of customer for product is affected by the price of the product () and the prevalence status of COVID-19 in the residential region of customer (), all of which affect the market elasticity for each product in every region () in online and in-person sales. As known, the price factor negatively impacts both in-person and online sales approaches. Through in-person sales, the higher the prevalence of COVID-19 in the region, the negative impact it has on in-person sales, but on the contrary, it increases online sales. The demand function of dual-channel has been investigated in many studies such as (Maleki, Yaghoubi, and Fander 2022). Based on the literature and assumptions, constraints (11) and (12) indicate how much the online and in-person prices of products can change compared to the supply price.
| 9 |
| 10 |
| 11 |
| 12 |
Capacity constraints
Another problem that COVID-19 has imposed on the FSC is the impact on the capacity of production, distribution, and sales centers (Stephens et al., 2020). For example, labor shortage, telecommuting, and social distance can be effective factors. The capacities of manufacturers, distributors, disinfection centers, and stores affected by the COVID-19 pandemic are expressed in constraints (13) to (16). It is noteworthy that the production capacity of each type of product is unique, and in other cases, the capacities can be converted according to the production methods and technologies.
| 13 |
| 14 |
| 15 |
| 16 |
Product flow balance constraints
High-risk and low-risk regions are identified based on the prevalence of COVID-19 in the distribution regions (Shen and Bar-Yam). Products from low-risk regions are transferred directly to the stores. Constraint (17) indicates the flow of products from the manufacturer to the low-risk distribution center and from there to the store ; and if the distributor is a high-risk region, the products are delivered from there to the disinfection center .
| 17 |
Programs should be implemented to reduce the effects of COVID-19 on food staff, such as creating hygienic conditions, and cleaning and disinfecting facilities (Control and Prevention 2020). Therefore, products distributed to stores from high-risk regions need to be disinfected in disinfection center before being sent to store . Constraint (18) indicates the flow of products from the high-risk distribution center to the disinfection center and from there to the store .
| 18 |
Constraint (19) indicates that the number of products that reach store must be balanced with the amount of store sales through both in-person () and online () channels.
| 19 |
Constraint (20) indicates the equality of store outputs with customers' demand for each product through each sales channel to estimate demand.
| 20 |
Constraints of product delivery permission
In this type of issue, the decision-maker has made allocations according to the distances between manufacturers, distributors, and stores as well as different delivery policies before starting to solve the model. Constraints (21) to (26) are used to prevent posting to unauthorized links. Constraint (21) indicates that it is not allowed to supply some products from some suppliers for each distributor .
| 21 |
| 22 |
| 23 |
| 24 |
| 25 |
| 26 |
Constraint (22) indicates that each distribution center has its own stores that are only allowed to deliver () to them. There is also a hypothesis for distribution centers in the contaminated region is required to disinfect the products () in the disinfection section before sending the products to their own stores () (Nakat & Bou-Mitri, 2021); these matters are guaranteed in constraints (23) and (24). Finally, constraints (25) and (26) indicate that each store covers its own region through online and in-person stores respectively.
Vehicle constraints
Considering the importance of environmental issues, special attention is paid to sustainability in this model, for which constraints (27) to (30) indicate vehicle constraints that directly affect carbon emissions (Khalili et al., 2019). Constraints (27) to (30) describe that the product flow rate between different facilities depends on the vehicle capacity, type of vehicle, and product quantity in each route.
| 27 |
| 28 |
| 29 |
| 30 |
Product delivery time constraints
As the abovementioned, issues such as the COVID-19 pandemic and problems in the supply and distribution of products cause delays in delivery time, so one of the objectives of the proposed model is to minimize the difference between the delivery time and the expected time of receipt. Constraints (31) to (34) are presented to determine the product's delivery time according to the distance, speed, and type of vehicle selected on each route (Song & Ko, 2016).
| 31 |
| 32 |
| 33 |
| 34 |
It is also required to observe all decision variables of constraints (35) and (36).
| 35 |
| 36 |
Solution strategy
Various methods have been developed to solve multi-objective problems. This study employs the epsilon constraint method to convert three objectives into a single one. In this approach, although the number of objective functions is decreased, the number of constraints is raised. The epsilon constraint approach considers the primary objective function and an upper bound (epsilon value) for other objective functions as a new constraint added to the mathematical model. Therefore, the proposed model is rewritten:
| 37 |
| 38 |
| 39 |
| 40 |
Thus, the mathematical model of this problem has been rewritten, and it has one objective function, Eq. (37), and 30 constraints, Eqs. (9)-(36), (38) and (39). In the following section, the case study is evaluated according to this mathematical model.
Case study
In this section, the optimization model presented for the Daily Market chain stores in Iran is implemented according to real data during the COVID-19 pandemic. The Daily Market chain stores have eight distribution centers, which are shown in Table 2, each covering its own provincial distribution centers and stores. In general, this chain store has branches in thirty-three cities in Iran, which are supplied by these distribution centers, which is shown in Fig. 3. It should be noted that the desired products are delivered from suppliers to distribution centers and from there to stores. These chain stores have divided their products into four main categories.
Table 2.
Product categories
| Symbol | Product type | Example |
|---|---|---|
| j1 | Snacks and drinks | Cakes, drinks, biscuits, chips |
| j2 | Fast-moving consumer goods (FMCG; goods with a low expiration date) | Meat, eggs, dairy |
| j3 | Cosmetics | Paper towels, dish detergent, disinfectant |
| j4 | Essential products | Rice, oil, tea, sugar |
Fig. 3.

High-risk provinces for COVID-19 outbreak and location of suppliers, distribution centers, and stores
The same four categories are considered in this study. Each category includes many products, but common features, such as market demand elasticity, expiration date, the importance of delivery time and suppliers., are in one category.
In this study, three types of delivery vehicles are considered; trucks with higher capacity that are used to move high-volume products between suppliers to distribution centers and the distance between distribution centers and stores. Another type of vehicle is intended, which is only for online shopping and is used to deliver products from stores to customers. For each of these vehicles, feature such as the initial cost of purchasing the vehicle, capacity, speed, and the value of carbon dioxide emissions are considered. The cost of carbon dioxide emissions in Iran is used based on (Khodad et al., 2016). All required parameters, including capacity of manufacturers, warehouses, stores, and the distance between centers and costs, are taken from the company. In this study, the distance between centers and the price of diesel fuel is a criterion for calculating logistics costs. Other logistical costs calculated in this model are the cost of following the health protocol and the initial investment cost.
The Daily Market chain stores emphasize the concept of a secure supply chain intending to provide a sustainable supply chain for various products, fulfill the community's food demands, reduce food waste, and adapt the supply chain to the prevalence of COVID-19 to minimize its effects and increase food safety. In this study, twenty provinces of Iran (based on data from March 2021 to March 2022) are considered high-risk regions, which are identified in Table 3. Table 3 presents the provinces in which the warehouses are located. It is noteworthy that the COVID-19 pandemic has affected FSC in all regions. Still, product management and food safety are particularly important to society in high-risk regions.
Table 3.
High-risk provinces of COVID-19 pandemic and location of suppliers, distributions, and stores
| Province | High-Risk zone | Warehouse | Covered zone | Province | High-Risk zone | Warehouse | Covered zone |
|---|---|---|---|---|---|---|---|
| Alborz | – | Razavi Khorasan | – | – | |||
| Ardabil | – | – | South Khorasan | – | – | ||
| East Azerbaijan | – | – | – | Khuzestan | – | – | – |
| West Azerbaijan | – | – | Kohgiluyeh and Boyer-Ahmad | – | |||
| Bushehr | Kurdistan | – | – | ||||
| Chahar Mahaal and Bakhtiari | – | Lorestan | – | – | |||
| Fars | – | – | Markazi | – | – | ||
| Gilan | – | Mazandaran | – | ||||
| Golestan | Qazvin | – | |||||
| Hamadan | – | – | – | Qom | – | ||
| Hormozgān | Semnan | – | |||||
| Ilam | Sistan and Baluchestan | ||||||
| Isfahan | – | – | – | Tehran | – | – | – |
| Kerman | – | – | Yazd | – | |||
| Kermanshah | – | – | Zanjan | – | |||
| North Khorasan | – | – |
Figure 3 shows the information on zoning for the prevalence of COVID-19 and the location of the facilities. The high-risk provinces are highlighted in red and other provinces that are at lower risk are highlighted in green. In addition, suppliers with green triangles, distribution centers with yellow squares, and stores with blue circles are shown.
The optimization problem in GAMS 24.1.2 (Brooke et al., 1988) is coded, and the formulated problem is solved using BARON 19.7.13 (Tawarmalani & Sahinidis, 2005) that is able to solve a nonlinear and non-convex problem. Twenty repetitions are repeated for the epsilon constraint method.
Numerical results
This section describes the numerical simulation results for the proposed model. As shown in Fig. 3, out of eight distribution centers, five distribution centers are in high-risk regions that need to establish a disinfection center. As high-risk regions increase, the supply chain needs to spend more to maintain and secure products. These disinfection centers are designed to disinfect products received from suppliers in distribution centers and then distribute them to stores. This is to minimize the COVID-19 outbreak in stores and maintain product safety.
Some products, such as health products and some foods, faced increased demand during the COVID-19 pandemic (Jayaweera, Reyes, and Joseph 2019; Meszaros, 2020). The supply of these products requires special attention to make products available and fulfill the customers' demands. In the presented model, the demand for products in various regions depends on price and the intensity of COVID-19. Product prices are affected by the COVID-19 pandemic. As the abovementioned, increasing the demand for some products or disrupting the supply of some products in this period can affect the product prices. Figure 4 shows the prices of products in online and in-person sales.
Fig. 4.

Prices of products in online and in-person sales
According to Fig. 4, the price of the fourth category products is more effective than the conditions, and its price is higher than other products. The products of the first and third groups have a higher price in their online sales with a slight difference, but unlike them, the products of the second group have lower online sales prices than in-person sales.
Demand for different categories of products in thirty-three cities in each of the sales channels is as follows; the online shopping demand in Fig. 5 and the in-person shopping demand in Fig. 6.
Fig. 5.

Demands of products via online sales in cities that a product j1, b product j2, c product j3, d product j4
Fig. 7.

The flow of products from suppliers to distribution centers
Demand in different regions is affected by various factors such as the level of market purchase elasticity for the product, the product price in online and in-person sales, as well as the level of COVID-19 outbreak in the region; all of which determine the demand rate for products online or purchases from stores.
As seen in Figs. 5 and 6, the first category products (j1) are most in-demand in both in-person and online sales channels; the second category products (j2) are in the second place in both channels; and the third (j3) and fourth (j4) category products are different in each channel. In in-person sales, the demand for fourth category products is higher than the third category products. In contrast, in online sales, the demand for third category products is higher.
Fig. 6.

Demand of products via in-person sales in cities that a product j1, b product j2, c product j3, d product j4
It should be noted that in any region where the risk of the COVID-19 outbreak is higher, online sales of the product in that region are higher than sales of the product in-person stores; in other words, the demand for online products increases with the COVID-19 outbreak.
The studied supply chain with the available constraints optimally supplies products from suppliers. In this study, five key product supply points were selected as suppliers that fulfill the demands of all eight distribution centers. The flow of products from suppliers to stores can be seen in Fig. 7.
In Figure 7, the number of products that moved can be observed by distinguishing product type as well as the vehicle used for delivery. After supplying products from suppliers, if the distribution center is in a high-risk region, the disinfection centers are active in these regions, and the products will be disinfected before being delivered to stores. It should be noted that this affects the delivery time of goods in high-risk regions. Finally, the products are delivered from eight distribution centers to 33 covered cities. Each distribution center covers a certain number of cities. The flow of products from distributors to stores can be seen in Fig. 8.
Fig. 8.

The flow of products from distribution centers to stores
Ultimately, the products can be offered through in-person and online sales channels. Like the abovementioned, the delivery of the products is intended for online shopping using one type of vehicle. In general, the vehicles used to move between different centers can be shown in Fig. 9.
Fig. 9.
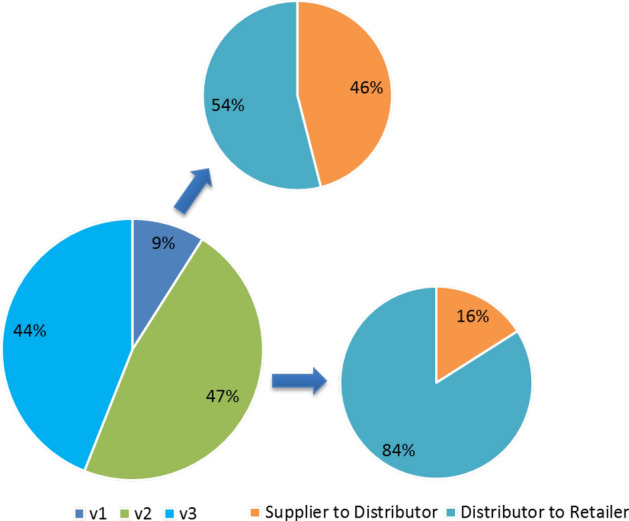
Percentage of vehicles used on each route
These vehicles are optimally calculated by considering the initial purchase cost, capacity, speed, and carbon dioxide emissions to minimize transportation costs and delivery time.
One of the objectives of this research model is to minimize the time of delivery of products between different centers. The present study calculates the delivery time of different goods according to their sensitivity to time given the distance between cities, the vehicle type, and whether the distribution center is in a region with high risk in terms of COVID-19 or not. Considering the centers' capacity, in practice, the time of receipt of products is clear and whether late delivery or early delivery has a penalty, which is also considered in the model. Information about suppliers' delivery time to distribution centers can be seen in Table 4.
Table 4.
Duration of delivery products from suppliers to distribution centers
| Origin | Destination | Time (hour) | Origin | Destination | Time (hour) | Origin | Destination | Time (hour) |
|---|---|---|---|---|---|---|---|---|
| Hamadan | Kerman | 11.8 | Tehran | Kerman | 11.8 | Tehran | Kerman | 12.3 |
| Tehran | 9.0 | Tehran | 14.5 | Tehran | 14.3 | |||
| Mashhad | 11.2 | Mashhad | 15.3 | Mashhad | 11.1 | |||
| Ahvaz | 16.6 | Ahvaz | 15.1 | Ahvaz | 15.1 | |||
| Hamadan | 13.4 | Hamadan | 16.2 | Hamadan | 11.3 | |||
| Isfahan | 8.8 | Isfahan | 15.2 | Isfahan | 7.3 | |||
| Shiraz | 14.5 | Shiraz | 14.0 | Shiraz | 10.8 | |||
| Tabriz | 8.5 | Tabriz | 8.7 | Tabriz | 13.2 | |||
| Shiraz | Kerman | 11.0 | Ahvaz | Kerman | 7.3 | |||
| Tehran | 16.1 | Tehran | 13.8 | |||||
| Mashhad | 16.1 | Mashhad | 12.4 | |||||
| Ahvaz | 11.5 | Ahvaz | 10.9 | |||||
| Hamadan | 15.6 | Hamadan | 12.0 | |||||
| Isfahan | 11.4 | Isfahan | 9.9 | |||||
| Shiraz | 15.4 | Shiraz | 18.2 | |||||
| Tabriz | 16.4 | Tabriz | 7.4 |
Table 5 also shows the delivery time of products from distribution centers to stores.
Table 5.
Duration of delivery products from distribution centers to stores
| Origin | Destination | Time (hour) | Origin | Destination | Time (hour) | Origin | Destination | Time (hour) |
|---|---|---|---|---|---|---|---|---|
| Kerman | Mahan | 3.9 | Mashhad | Torbat | 7.3 | Ahvaz | Hamidiyeh | 13.9 |
| Chatroud | 5.2 | Birjand | 6.7 | Susangerd | 14.9 | |||
| Tehran | Chalus | 12.0 | Quchan | 3.3 | Isfahan | Isfahan | 17.2 | |
| Amol | 13.3 | Mashhad | 5.9 | Fooladshahr | 14.4 | |||
| Manjil | 16.7 | Neyshabur | 2.9 | Varzaneh | 16.4 | |||
| Anzali | 18.7 | Bojnord | 4.9 | Shiraz | Somashahr | 1.6 | ||
| Tehran | 12.1 | Hamadan | Kermanshah | 16.9 | Shiraz | 5.0 | ||
| Karaj | 15.0 | Nahavand | 16.1 | Tabriz | Urmia | 16.0 | ||
| Saveh | 19.0 | Sanandaj | 14.0 | Tabriz | 17.1 | |||
| Qom | 14.4 | Qorveh | 14.9 | Ardabil | 14.6 | |||
| Borujerd | 13.9 | Sarab | 15.6 | |||||
| Arak | 16.9 |
As observed, the delivery time from distribution centers in high-risk regions affected by COVID-19 is longer than the delivery time from distribution centers in regions less affected by COVID-19 due to the time spent disinfecting and cleaning products. Figure 10 shows the costs separately and also the sales amount. The difference between income and costs is the first objective function of the model and indicates the profit value. Figure 10 shows the sale of products from both online and in-person channels with wide columns, and the costs are presented separately with narrow columns.
Fig. 10.

The total optimal separation of costs and revenue from the sale of products through dua1-channel
The initial costs of the facilities accounted for 55% of total costs which are a big portion of costs in the supply chain. Moreover, about 25% of the costs came from transportation costs. The supply chain also incurs a percentage of disinfecting and cleaning product costs due to the spread of the COVID-19 pandemic. Despite the high cost of setting up disinfection centers and the costs associated with consuming water and waste products for the supply chain, these costs are required to maintain food and product safety and reduce the COVID-19 prevalence.
Sensitivity analysis
Sensitivity analyzes are performed in this study to determine the effects of parameter deviation. The key parameter in this study is the parameter of the level of COVID-19 outbreak and its level of risk in each region (), which affects other variables due to the effectiveness of this parameter. The COVID-19 outbreak parameter in each region affects online and in-person demand, resulting in price changes. Changes in product demand and prices cause other variables to change across the supply chain in this study. In other words, while examining the effects of changing this parameter, the entire FEWW nexus is re-optimized for updated values to achieve maximum profit, minimum carbon emissions, and minimize transmission time.
As shown in Fig. 11, the online demand increased with the COVID-19 outbreak in different regions, while the demand for in-person purchases decreased.
Fig. 11.

Sensitivity analysis on the effect of COVID-19 outbreak on online and in-person demand
On the other hand, considering the relationship between product prices and demand, the sensitivity analysis related to the parameter of the COVID-19 outbreak in the regions and its impact on product prices in online and in-person sales is shown in Fig. 12.
Fig. 12.

Sensitivity analysis on the effect of COVID-19 outbreak on product prices in online and in-person sales
As shown in Fig. 12, the price of products is related to the level of demand; as the COVID-19 outbreak increased in regions, product prices increased slightly in the online channel. On the other hand, in the case of in-person sales, it is obvious that the price of products decreased slightly.
In the next analysis, the demand and price of products in the whole country are examined: in the first case, when all the provinces were severely involved in the coronavirus as high-risk areas, and in contrast, when all the provinces were considered low-risk areas. The results related to the amount of demand by product type in two cases are shown in Fig. 13.
Fig. 13.

Demand for products if all provinces were high risk or low risk
As can be seen, if all provinces were low risk and the threat of coronavirus was less, in-person demand for products would be much higher than online demand for all products. On the other hand, if all provinces were infected with the coronavirus and considered high-risk areas, the demand for in-person stores would fall sharply, while online demand would increase. This review is also performed on the price of products and can be seen in Fig. 14.
Fig. 14.

Prices of products if all provinces were high risk or low risk
Since the demand and price of products are directly related to each other, it is clear that if all provinces were low risk, in-person purchase prices would be higher than online to balance the two sales channels. In other words, in this situation, the online channel has to offer products at a lower price in order to remain in a competitive environment with in-person stores. But if all the provinces were involved in the coronavirus, the situation would be quite the opposite. Given the desire of people to shop online, in this case, the market is in the hands of online stores, and they can set the price. As shown in Fig. 14, in the case of all high-risk provinces, the price of all products except one of them is higher online than in-person.
Managerial insight 1: As it is known, with the increase in the prevalence of COVID-19, people's attention is drawn to online shopping, and the demand for buying goods from the Internet increases, while the demand for buying from shops in-person decreases. Therefore, supply chain managers must pay special attention to online sales by increasing the prevalence of coronavirus in each region.
Managerial insight 2: Due to the impact of COVID-19 on product prices, managers should pay attention to inventory control and product supply issues in order to be able to perform well in the face of price fluctuations and demand.
Managerial insight 3: Given the impact of demand and prices under certain conditions, such as an outbreak of a virus, food companies need to be prepared to increase their resilience to dealing with disruptions.
The subsequent analysis is related to the impact of the water consumption cost as well as sanitary waste management costs on profit margins, environmental costs, and delivery delays. In order to investigate these effects, the model is solved at different costs, and the outputs are shown in Fig. 15.
Fig. 15.

The effect of water consumption and sanitary waste management costs on objective functions; a third objective function, b second objective function, c first objective function
Increasing the cost of water consumption and disinfection of products, as well as the collection and management of sanitary waste, reduces profits, which can be seen in Fig. 15c. Figure 15b shows that these costs also affect the second objective function and increase environmental costs. It can also be concluded from Fig. 15a that water and waste costs also change the third objective function, which is less than the other two-objective functions.
Managerial insight 4: Given the importance of water and waste and the costs associated with them, managers must be sensitive to these elements in order to fulfill their social and environmental mission while maintaining their profits.
Managerial insight 5: Given the harmful effects of COVID-19 on societies and businesses, spending to prevent the spreading of COVID-19 may seemingly reduce profits, but the long-term effects of this are essential for businesses. Therefore, it is recommended that companies fulfill their mission concerning social and health issues in this situation.
Conclusion
In this study, the mathematical model was presented to optimize FEWW and sustainability in FSC as multi-objective functions while considering the different effects of the COVID-19 outbreak. This model had special features for the effects of the COVID-19 outbreak, such as establishing the disinfection centers and disinfecting the products; considering the amount of water consumed and sanitary waste to disinfect products; the delivery time of products to reduce the production loss due to the COVID-19 pandemic; online channel sale to maintain social distance and to reduce the prevalence of coronavirus as much as possible. Online and in-person shopping demand variability and their determination regarding the COVID-19 outbreak in each region by product type was another feature of the model. In addition, the product price was considered variable according to these factors.
This study considered sustainability in the mathematical model, including costs of carbon dioxide emissions and transportation. In addition, considering different vehicles and selecting their type according to capacity, speed and costs was another advantage that helped to have a sustainable FSC. The case study of chain stores was analyzed in Iran to show the application of the proposed mathematical model which was solved by the epsilon constraint method. This case study considered the situation of different provinces in terms of the risk of the COVID-19 outbreak. Eventually, the analysis showed some critical results:
Analysis of maps and flow levels of products provided a complete perspective of how and how much the products were moving.
The increased risk of COVID-19 in any region would increase the online demand for products in that region and reduce in-person purchases, which is due to the desire for more people to shop online during the COVID-19 pandemic.
Because of the changing demands of each channel, the price of products in channels also changed to remain in a competitive environment.
Disinfecting products before entering stores from the contaminated region reduces public health concerns and the COVID-19 outbreak, despite the cost as well as the production of sanitary waste and water consumption.
In terms of limitations during this study, gathering data for studying a real case of the food supply chain during the COVID-19 pandemic was one of the difficulties. For future research, it is suggested that due to the constant change of regions in terms of coronavirus prevalence, researchers can examine the FSC by considering uncertainties of parameters such as coronavirus prevalence and demand that is prone to change due to various factors. Furthermore, considering the importance of the safety and health of food products, the study of the implementation of the blockchain platform in this supply chain can be examined in order to monitor the entire production process and food safety in critical situations. Moreover, considering different periods and analyzing the rate of price and demand by track of time change can be examined.
Data availability
Either no data are used in this study or all data used are included in the main text or supplemental materials.
Declarations
Conflict of interest
The authors declare that they have no known competing financial interests or personal relationships that could have appeared to influence the work reported in this paper. All co-authors have seen and agree with the contents of the manuscript and there is no financial interest to report. We certify that the submission is original work and is not under review at any other publication.
Footnotes
Publisher's Note
Springer Nature remains neutral with regard to jurisdictional claims in published maps and institutional affiliations.
Contributor Information
Marziye Seif, Email: marziyeh_seif@ind.iust.ac.ir.
Saeed Yaghoubi, Email: yaghoubi@iust.ac.ir.
Mohammad Reza Khodoomi, Email: m_khodoomi@ind.iust.ac.ir.
References
- Accorsi, R., Emilio, F, Riccardo, M. (2019). Modeling inclusive food supply chains toward sustainable ecosystem planning. Sustainable Food Supply Chains, pp. 1–21. Elsevier.
- Achmad AL, Hakim DC, Perdana T. Designing a food supply chain strategy during COVID-19 pandemic using an integrated Agent-Based Modelling and Robust Optimization. Heliyon. 2021;7(11):e08448. doi: 10.1016/j.heliyon.2021.e08448. [DOI] [PMC free article] [PubMed] [Google Scholar]
- Aday S, Aday MS. Impact of COVID-19 on the food supply chain. Food Quality and Safety. 2020;4(4):167–180. doi: 10.1093/fqsafe/fyaa024. [DOI] [Google Scholar]
- Afshar A, Soleimanian E, Variani HA, Vahabzadeh M, Molajou A. The conceptual framework to determine interrelations and interactions for holistic Water, Energy, and Food Nexus. Environment, Development and Sustainability. 2022;24(8):10119–10140. doi: 10.1007/s10668-021-01858-3. [DOI] [Google Scholar]
- Akat, M., Kasım, K. (2020). Psychological effects of COVID-19 pandemic on society and its reflections on education. Electronic Turkish Studies 15 (4).
- Al-Saidi M, Hussein H. The water-energy-food nexus and COVID-19: Towards a systematization of impacts and responses. Science of the Total Environment. 2021;779:146529. doi: 10.1016/j.scitotenv.2021.146529. [DOI] [PMC free article] [PubMed] [Google Scholar]
- Aman, F., Sadia M. (2020). How Nutrition can help to fight against COVID-19 Pandemic. Pakistan Journal of Medical Sciences 36 (COVID19-S4):S121. [DOI] [PMC free article] [PubMed]
- Astill J, Dara RA, Campbell M, Farber JM, Fraser EDG, Sharif S, Yada RY. Transparency in food supply chains: A review of enabling technology solutions. Trends in Food Science & Technology. 2019;91:240–247. doi: 10.1016/j.tifs.2019.07.024. [DOI] [Google Scholar]
- Barman A, Das R, De PK. Impact of COVID-19 in food supply chain: Disruptions and recovery strategy. Current Research in Behavioral Sciences. 2021;2:100017. doi: 10.1016/j.crbeha.2021.100017. [DOI] [PMC free article] [PubMed] [Google Scholar]
- Bhowmick GD, Dhar D, Nath D, Ghangrekar MM, Banerjee R, Das S, Chatterjee J. Coronavirus disease 2019 (COVID-19) outbreak: Some serious consequences with urban and rural water cycle. NPJ Clean Water. 2020;3(1):1–8. doi: 10.1038/s41545-020-0079-1. [DOI] [Google Scholar]
- Bortolini M, Faccio M, Ferrari E, Gamberi M, Pilati F. Fresh food sustainable distribution: Cost, delivery time and carbon footprint three-objective optimization. Journal of Food Engineering. 2016;174:56–67. doi: 10.1016/j.jfoodeng.2015.11.014. [DOI] [Google Scholar]
- Bottani E, Murino T, Schiavo M, Akkerman R. Resilient food supply chain design: Modelling framework and metaheuristic solution approach. Computers & Industrial Engineering. 2019;135:177–198. doi: 10.1016/j.cie.2019.05.011. [DOI] [Google Scholar]
- Brooke AKD, Meeraus A, Rosenthal RE. GAMS: A user’s guide: Course Technology. GAMS Development Corporation; 1988. [Google Scholar]
- Cariappa, A.G., Adeeth, K.K.A., Chaitanya, A.A., Sendhil, R., Ramasundaram, P. (2021). COVID-19 induced lockdown effects on agricultural commodity prices and consumer behaviour in India–Implications for food loss and waste management. Socio-Economic Planning Sciences p. 101160.
- Chen J, Di Wu, Li P. Research on the pricing model of the dual-channel reverse supply chain considering logistics costs and consumers’ awareness of sustainability based on regional differences. Sustainability. 2018;10(7):2229. doi: 10.3390/su10072229. [DOI] [Google Scholar]
- Chen W, Li J, Jin X. The replenishment policy of agri-products with stochastic demand in integrated agricultural supply chains. Expert Systems with Applications. 2016;48:55–66. doi: 10.1016/j.eswa.2015.11.017. [DOI] [Google Scholar]
- Chitrakar B, Zhang M, Bhandari B. Improvement strategies of food supply chain through novel food processing technologies during COVID-19 pandemic. Food Control. 2021;125:108010. doi: 10.1016/j.foodcont.2021.108010. [DOI] [PMC free article] [PubMed] [Google Scholar]
- Chowdhury T, Hemal Chowdhury Md, Rahman S, Hossain N, Ahmed A, Sait SM. Estimation of the healthcare waste generation during COVID-19 pandemic in Bangladesh. Science of the Total Environment. 2022;811:152295. doi: 10.1016/j.scitotenv.2021.152295. [DOI] [PMC free article] [PubMed] [Google Scholar]
- Coluccia B, Agnusdei GP, Miglietta PP, De Leo F. Effects of COVID-19 on the Italian agri-food supply and value chains. Food Control. 2021;123:107839. doi: 10.1016/j.foodcont.2020.107839. [DOI] [PMC free article] [PubMed] [Google Scholar]
- Control, Centers for Disease, and Prevention. (2020). "COVID-19 critical infrastructure sector response planning."
- Costa, D.E. (2015). Conceptual frameworks for understanding the water, energy and food security nexus. working paper. United Nations Economics and Social Commission for Western Asia.
- De Vito A, Gómez JP. Estimating the COVID-19 cash crunch: Global evidence and policy.". Journal of Accounting and Public Policy. 2020;39(2):106741. doi: 10.1016/j.jaccpubpol.2020.106741. [DOI] [Google Scholar]
- De Vos J. The effect of COVID-19 and subsequent social distancing on travel behavior. Transportation Research Interdisciplinary Perspectives. 2020;5:100121. doi: 10.1016/j.trip.2020.100121. [DOI] [PMC free article] [PubMed] [Google Scholar]
- Deconinck K, Avery E, Jackson LA. Food supply chains and covid-19: Impacts and policy lessons. EuroChoices. 2020;19(3):34–39. doi: 10.1111/1746-692X.12297. [DOI] [Google Scholar]
- Dominici A, Boncinelli F, Gerini F, Marone E. Determinants of online food purchasing: The impact of socio-demographic and situational factors. Journal of Retailing and Consumer Services. 2021;60:102473. doi: 10.1016/j.jretconser.2021.102473. [DOI] [Google Scholar]
- Esmaeilion F. Hybrid renewable energy systems for desalination. Applied Water Science. 2020;10(3):1–47. doi: 10.1007/s13201-020-1168-5. [DOI] [Google Scholar]
- Esmaeilion F, Ahmadi A, Hoseinzadeh S, Aliehyaei M, Makkeh SA, Garcia DA. Renewable energy desalination; a sustainable approach for water scarcity in arid lands. International Journal of Sustainable Engineering. 2021;14(6):1916–1942. doi: 10.1080/19397038.2021.1948143. [DOI] [Google Scholar]
- Esmaeilion F, Soltani M, Nathwani J. Assessment of a novel solar-powered polygeneration system highlighting efficiency, exergy, economic and environmental factors. Desalination. 2022;540:116004. doi: 10.1016/j.desal.2022.116004. [DOI] [Google Scholar]
- Esmaeilion F, Soltani M, Nathwani J, Al-Haq A. Design, analysis, and optimization of a novel poly-generation system powered by solar and wind energy. Desalination. 2022;543:116119. doi: 10.1016/j.desal.2022.116119. [DOI] [Google Scholar]
- Everitt, H., Paul van der W., Jamie, A. S., Alexander, W., Jason, A. G. (2021). The quantity and composition of household food waste during the COVID-19 pandemic: A direct measurement study in Canada. Socio-Economic Planning Sciences p. 101110. [DOI] [PMC free article] [PubMed]
- Gao J, Xiangyang Xu, Cao G, Ermoliev YM, Ermolieva TY, Rovenskaya EA. Strategic decision-support modeling for robust management of the food–energy–water nexus under uncertainty. Journal of Cleaner Production. 2021;292:125995. doi: 10.1016/j.jclepro.2021.125995. [DOI] [Google Scholar]
- Garcia DJ, Lovett BM, You F. Considering agricultural wastes and ecosystem services in food-energy-water-waste nexus system design. Journal of Cleaner Production. 2019;228:941–955. doi: 10.1016/j.jclepro.2019.04.314. [DOI] [Google Scholar]
- Garcia DJ, You F. The water-energy-food nexus and process systems engineering: A new focus. Computers & Chemical Engineering. 2016;91:49–67. doi: 10.1016/j.compchemeng.2016.03.003. [DOI] [Google Scholar]
- Grida M, Mohamed R, Zaied AN. Evaluate the impact of COVID-19 prevention policies on supply chain aspects under uncertainty. Transportation Research Interdisciplinary Perspectives. 2020;8:100240. doi: 10.1016/j.trip.2020.100240. [DOI] [PMC free article] [PubMed] [Google Scholar]
- Haleem A, Javaid M, Vaishya R. Effects of COVID-19 pandemic in daily life. Current Medicine Research and Practice. 2020;10(2):78. doi: 10.1016/j.cmrp.2020.03.011. [DOI] [PMC free article] [PubMed] [Google Scholar]
- Hobbs JE. Food supply chains during the COVID-19 pandemic. Canadian Journal of Agricultural Economics/revue Canadienne D'agroeconomie. 2020;68(2):171–176. doi: 10.1111/cjag.12237. [DOI] [Google Scholar]
- Hoff, Holger. 2011. "Understanding the nexus."
- Islamic Republic News Agency (IRNA), Corona coloring of the country’s cities. https://en.irna.ir/
- Jayaweera JA, Sampath A, Reyes M, Joseph A. Retracted article: Childhood iron deficiency anemia leads to recurrent respiratory tract infections and gastroenteritis. Scientific Reports. 2019;9(1):1–8. doi: 10.1038/s41598-019-49122-z. [DOI] [PMC free article] [PubMed] [Google Scholar] [Retracted]
- Kalbusch A, Henning E, Brikalski MP, Vieira F, de Luca, and Andrea Cristina Konrath. Impact of coronavirus (COVID-19) spread-prevention actions on urban water consumption. Resources, Conservation and Recycling. 2020;163:105098. doi: 10.1016/j.resconrec.2020.105098. [DOI] [PMC free article] [PubMed] [Google Scholar]
- Khalili S, Rantanen E, Bogdanov D, Breyer C. Global transportation demand development with impacts on the energy demand and greenhouse gas emissions in a climate-constrained world. Energies. 2019;12(20):3870. doi: 10.3390/en12203870. [DOI] [Google Scholar]
- Khodad KF, Akaberi TM, Mousavi JY, Khosravinejad A. Calculating the social costs of carbon dioxide emissions in different provinces of Iran. Energy Planning and Policy Research. 2016;2(2):77–110. [Google Scholar]
- Kibler KM, Reinhart D, Hawkins C, Motlagh AM, Wright J. Food waste and the food-energy-water nexus: A review of food waste management alternatives. Waste Management. 2018;74:52–62. doi: 10.1016/j.wasman.2018.01.014. [DOI] [PubMed] [Google Scholar]
- Li Y-B, Lin C-P, Tung-Ju Wu, Chen J-L. The study on price and lead time decisions in retailer-dominated dual-channel supply chain. Journal of Interdisciplinary Mathematics. 2017;20(3):805–819. doi: 10.1080/09720502.2017.1358869. [DOI] [Google Scholar]
- Lioutas ED, Charatsari C. Smart farming and short food supply chains: Are they compatible? Land Use Policy. 2020;94:104541. doi: 10.1016/j.landusepol.2020.104541. [DOI] [Google Scholar]
- Mahajan K, Tomar S. COVID-19 and supply chain disruption: Evidence from food markets in India. American Journal of Agricultural Economics. 2021;103(1):35–52. doi: 10.1111/ajae.12158. [DOI] [PMC free article] [PubMed] [Google Scholar]
- Maleki, F., Saeed, Y., Atieh, F. (2022). Organic level vs. sales effort in coordination of green food supply chain for deteriorating items. Environment, Development and Sustainability:pp. 1–33. [DOI] [PMC free article] [PubMed]
- Manzini R, Accorsi R. The new conceptual framework for food supply chain assessment. Journal of Food Engineering. 2013;115(2):251–263. doi: 10.1016/j.jfoodeng.2012.10.026. [DOI] [Google Scholar]
- Meszaros, L. (2020). How to boost your immune system during the COVID-19 pandemic. Intern Med.
- Mu W, van Asselt ED, Van der Fels-Klerx HJ. Towards a resilient food supply chain in the context of food safety. Food Control. 2021;125:107953. doi: 10.1016/j.foodcont.2021.107953. [DOI] [Google Scholar]
- Nakandala, D., Lau, H.C. (2018) Innovative adoption of hybrid supply chain strategies in urban local fresh food supply chain. Supply Chain Management: An International Journal.
- Nakat Z, Bou-Mitri C. COVID-19 and the food industry: Readiness assessment. Food Control. 2021;121:107661. doi: 10.1016/j.foodcont.2020.107661. [DOI] [PMC free article] [PubMed] [Google Scholar]
- Nandi S, Sarkis J, Hervani AA, Helms MM. Redesigning supply chains using blockchain-enabled circular economy and COVID-19 experiences. Sustainable Production and Consumption. 2021;27:10–22. doi: 10.1016/j.spc.2020.10.019. [DOI] [PMC free article] [PubMed] [Google Scholar]
- Nguyen, C., Zhané, G., Riccardo, A. (2019). Mathematical modeling of food and agriculture distribution. In: Sustainable Food Supply Chains, pp. 145–158. Elsevier.
- Njomane L, Telukdarie A. Impact of COVID-19 food supply chain: Comparing the use of IoT in three South African supermarkets. Technology in Society. 2022;71:102051. doi: 10.1016/j.techsoc.2022.102051. [DOI] [PMC free article] [PubMed] [Google Scholar]
- O'Hara S, Toussaint EC. Food access in crisis: Food security and COVID-19. Ecological Economics. 2021;180:106859. doi: 10.1016/j.ecolecon.2020.106859. [DOI] [Google Scholar]
- Organization, World Health. (2006). Healthcare waste management (HCWM)." Some Basic Information on Healthcare Waste.
- Parashar S, Sood G, Agrawal N. Modelling the enablers of food supply chain for reduction in carbon footprint. Journal of Cleaner Production. 2020;275:122932. doi: 10.1016/j.jclepro.2020.122932. [DOI] [Google Scholar]
- Qu Y, Tara Hooper J, Swales K, Papathanasopoulou E, Austen MC, Yan X. Energy-food nexus in the marine environment: A macroeconomic analysis on offshore wind energy and seafood production in Scotland. Energy Policy. 2021;149:112027. doi: 10.1016/j.enpol.2020.112027. [DOI] [Google Scholar]
- Read QD, Brown S, Cuéllar AD, Finn SM, Gephart JA, Marston LT, Meyer E, Weitz KA, Muth MK. Assessing the environmental impacts of halving food loss and waste along the food supply chain. Science of the Total Environment. 2020;712:136255. doi: 10.1016/j.scitotenv.2019.136255. [DOI] [PMC free article] [PubMed] [Google Scholar]
- Rizou M, Galanakis IM, Aldawoud TMS, Galanakis CM. Safety of foods, food supply chain and environment within the COVID-19 pandemic. Trends in Food Science & Technology. 2020;102:293–299. doi: 10.1016/j.tifs.2020.06.008. [DOI] [PMC free article] [PubMed] [Google Scholar]
- Rowan NJ, Galanakis CM. Unlocking challenges and opportunities presented by COVID-19 pandemic for cross-cutting disruption in agri-food and green deal innovations: Quo Vadis? Science of the Total Environment. 2020;748:141362. doi: 10.1016/j.scitotenv.2020.141362. [DOI] [PMC free article] [PubMed] [Google Scholar]
- Sarkis J, Cohen MJ, Dewick P, Schröder P. A brave new world: Lessons from the COVID-19 pandemic for transitioning to sustainable supply and production. Resources, Conservation, and Recycling. 2020;159:104894. doi: 10.1016/j.resconrec.2020.104894. [DOI] [PMC free article] [PubMed] [Google Scholar]
- Sebatjane M, Adetunji O. A three-echelon supply chain for economic growing quantity model with price-and freshness-dependent demand: Pricing, ordering and shipment decisions. Operations Research Perspectives. 2020;7:100153. doi: 10.1016/j.orp.2020.100153. [DOI] [Google Scholar]
- Senthilkumar VS, Reddy KS, Subramaniam U. COVID-19: Impact analysis and recommendations for power and energy sector operation. Applied Energy. 2020;279:115739. doi: 10.1016/j.apenergy.2020.115739. [DOI] [PMC free article] [PubMed] [Google Scholar]
- Sharma, J., Mohit, T, Arvind, B. (2021). Exploration of COVID-19 impact on the dimensions of food safety and security: a perspective of societal issues with relief measures. Journal of Agribusiness in Developing and Emerging Economies.
- Sharma, R, Anjali, S., Sachin, K., Angappa, G., Amine, B. (2020). Agriculture supply chain risks and COVID-19: mitigation strategies and implications for the practitioners. International Journal of Logistics Research and Applications: pp. 1–27.
- Shen, C., Yaneer, B-Y. Color zone pandemic response version 2. New England Complex Systems Institute 2.
- Singh S, Kumar R, Panchal R, Tiwari MK. Impact of COVID-19 on logistics systems and disruptions in food supply chain. International Journal of Production Research. 2021;59(7):1993–2008. doi: 10.1080/00207543.2020.1792000. [DOI] [Google Scholar]
- Smith KF, Goldberg M, Rosenthal S, Carlson L, Chen J, Chen C, Ramachandran S. Global rise in human infectious disease outbreaks. Journal of the Royal Society Interface. 2014;11(101):20140950. doi: 10.1098/rsif.2014.0950. [DOI] [PMC free article] [PubMed] [Google Scholar]
- Song BD, Ko YD. A vehicle routing problem of both refrigerated-and general-type vehicles for perishable food products delivery. Journal of Food Engineering. 2016;169:61–71. doi: 10.1016/j.jfoodeng.2015.08.027. [DOI] [Google Scholar]
- Staniforth, J. (2020). COVID-19 update: Worker health, absenteeism present largest risks to US food supply chain. Food Quality and Safety. Available online: . foodqualityandsafety. com/article/covid-19-update-worker-health-and-absenteeism-present-largest-risk-to-us-food-supply-chain/(accessed on 15 March 2020).
- Stephens EC, Martin G, van Wijk M, Timsina J, Snow V. Impacts of COVID-19 on agricultural and food systems worldwide and on progress to the sustainable development goals. Agricultural Systems. 2020;183:102873. doi: 10.1016/j.agsy.2020.102873. [DOI] [PMC free article] [PubMed] [Google Scholar]
- Taghikhah F, Voinov A, Shukla N, Filatova T, Anufriev M. Integrated modeling of extended agro-food supply chains: A systems approach. European Journal of Operational Research. 2021;288(3):852–868. doi: 10.1016/j.ejor.2020.06.036. [DOI] [PMC free article] [PubMed] [Google Scholar]
- Tan RR, Aviso KB. On life-cycle sustainability optimization of enhanced weathering systems. Journal of Cleaner Production. 2021;289:125836. doi: 10.1016/j.jclepro.2021.125836. [DOI] [Google Scholar]
- Tawarmalani M, Sahinidis NV. A polyhedral branch-and-cut approach to global optimization. Mathematical Programming. 2005;103(2):225–249. doi: 10.1007/s10107-005-0581-8. [DOI] [Google Scholar]
- Verma AK, Prakash S. Impact of covid-19 on environment and society. Journal of Global Biosciences. 2020;9(5):7352–7363. [Google Scholar]
- Vickers NJ. Animal communication: When i’m calling you, will you answer too? Current Biology. 2017;27(14):R713–R715. doi: 10.1016/j.cub.2017.05.064. [DOI] [PubMed] [Google Scholar]
- Wang Q, Li S, He G, Li R, Wang X. Evaluating sustainability of water-energy-food (WEF) nexus using an improved matter-element extension model: A case study of China. Journal of Cleaner Production. 2018;202:1097–1106. doi: 10.1016/j.jclepro.2018.08.213. [DOI] [Google Scholar]
- Wu Y, Ronghua Lu, Yang J, Feng Xu. Low-carbon decision-making model of online shopping supply chain considering the O2O model. Journal of Retailing and Consumer Services. 2021;59:102388. doi: 10.1016/j.jretconser.2020.102388. [DOI] [Google Scholar]
- Yin, C., Paulo, P., Ting, H., Yanxu, L., Jing, Z., Wenwu, Z. (2022). Recover the food-energy-water nexus from COVID-19 under SDG acceleration actions. Science of The Total Environment: p. 153013. [DOI] [PMC free article] [PubMed]
- Yue Q, Zhang F, Wang Y, Zhang X, Guo P. Fuzzy multi-objective modelling for managing water-food-energy-climate change-land nexus towards sustainability. Journal of Hydrology. 2021;596:125704. doi: 10.1016/j.jhydrol.2020.125704. [DOI] [Google Scholar]
- Zhao N, You F. Food-energy-water-waste nexus systems optimization for New York State under the COVID-19 pandemic to alleviate health and environmental concerns. Applied Energy. 2021;282:116181. doi: 10.1016/j.apenergy.2020.116181. [DOI] [Google Scholar]
- Zhu Z, Chu F, Dolgui A, Chu C, Zhou W, Piramuthu S. Recent advances and opportunities in sustainable food supply chain: A model-oriented review. International Journal of Production Research. 2018;56(17):5700–5722. doi: 10.1080/00207543.2018.1425014. [DOI] [Google Scholar]
Associated Data
This section collects any data citations, data availability statements, or supplementary materials included in this article.
Data Availability Statement
Either no data are used in this study or all data used are included in the main text or supplemental materials.