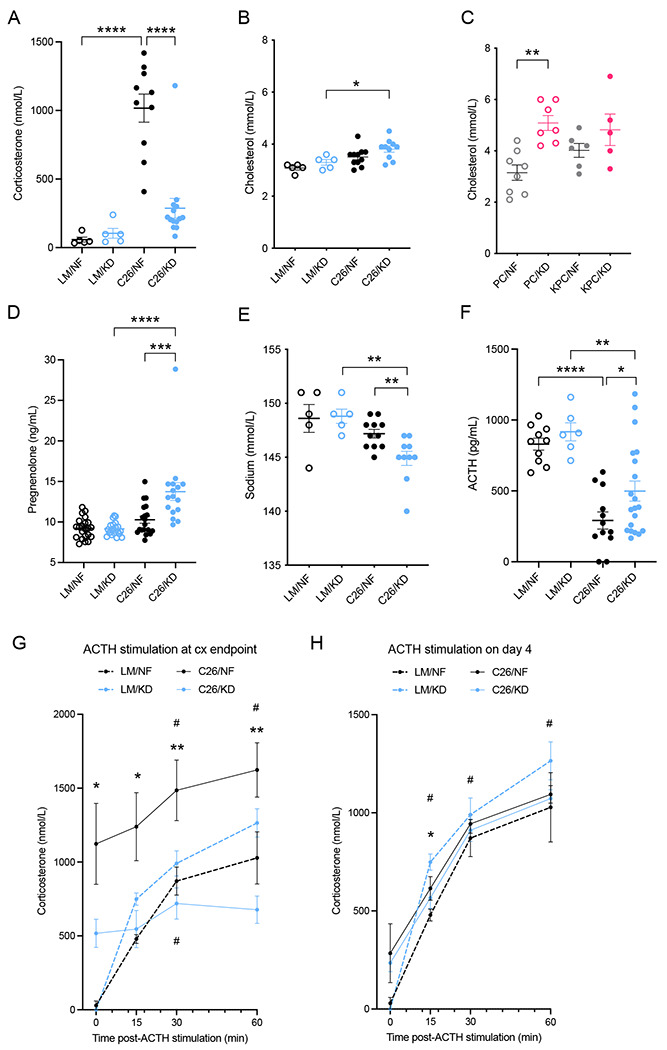
Figure 3. Ketogenic diet induces relative corticosterone deficiency in C26-tumor bearing mice.

(A) Corticosterone hormone levels in plasma of cachectic C26 tumor-bearing mice and littermate controls fed KD or NF diets (n=5 LM, n=10-14 C26). (B-C) Plasma cholesterol levels in cachectic C26-tumor bearing mice and littermate controls (n=5 LM, n=10-11 C26) (B), and in cachectic KPC tumor-bearing mice and PC controls (n=5-8) (C) fed KD or NF diet. (D) Pregnenolone hormone levels in plasma of cachectic C26 tumor-bearing mice and littermate controls on KD or NF diets (n=16-22). (E) Sodium levels in plasma of cachectic C26-tumor bearing mice and littermate controls on KD or NF diets (n=5 LM, n=10-11 C26). (F) Levels of adrenocorticotropic hormone (ACTH) in plasma of cachectic C26 tumor-bearing mice and littermate controls fed KD or NF (n=6-10 LM, n=12-20 C26). (G-H) Synacthen test and quantification of corticosterone response at baseline and 15, 30 and 60 minutes after ACTH stimulation in cachectic C26 tumor-bearing mice and littermate controls (endpoint) (G), or only 4 days after diet change (18 days after C26 cell injection) (n=5) (H).
Data are expressed as the mean ± SEM. One-way ANOVA with Tukey’s correction for post hoc testing was used in (A-D, F). Two-way ANOVA statistical tests with Tukey’s correction for post hoc comparisons were performed in (G-H). * p-value < 0.05, ** p-value < 0.01, *** p-value < 0.001, **** p-value < 0.0001, # p-value < 0.05 compared to time = 0.
