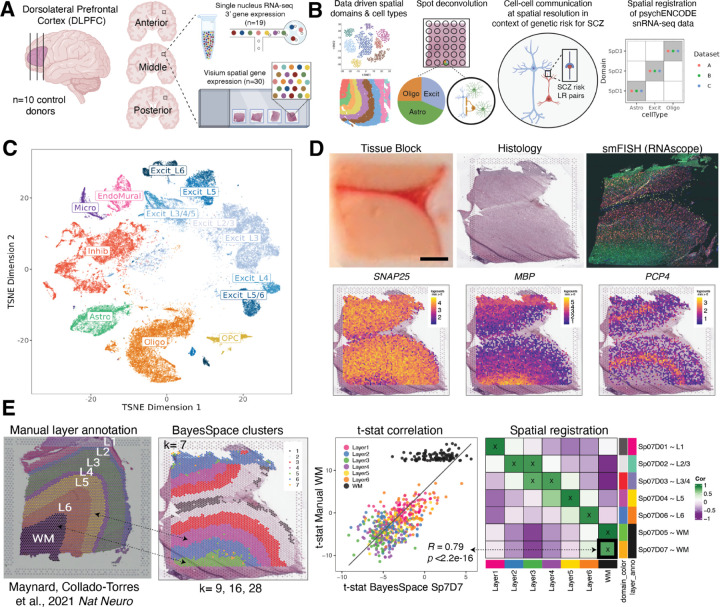
Figure 1. Study design to generate paired single nucleus RNA-sequencing (snRNA-seq) and spatially-resolved transcriptomic data across DLPFC.
(A) DLPFC tissue blocks were dissected across the rostral-caudal axis from 10 adult neurotypical control postmortem human brains, including anterior (Ant), middle (Mid), and posterior (Post) positions (n=3 blocks per donor, n=30 blocks total). The same tissue blocks were used for snRNA-seq (10x Genomics 3’ gene expression assay, n=1–2 blocks per donor, n=19 samples) and spatial transcriptomics (10x Genomics Visium spatial gene expression assay, n=3 blocks per donor, n=30 samples). (B) Paired snRNA-seq and Visium data were used to identify data-driven spatial domains (SpDs) and cell types, perform spot deconvolution, conduct cell-cell communication analyses, and spatially register companion PsychENCODE snRNA-seq DLPFC data. (C) t-distributed stochastic neighbor embedding (t-SNE) summarizing layer resolution cell types identified by snRNA-seq. (D) Tissue block orientation and morphology was confirmed by hematoxylin and eosin (H&E) staining and single molecule fluorescent in situ hybridization (smFISH) with RNAscope (SLC17A7 marking excitatory neurons in pink, MBP marking white matter (WM) in green, RELN marking layer (L)1 in yellow, and NR4A2 marking L6 in orange). Scale bar is 2mm. Spotplots depicting log transformed normalized expression (logcounts) of SNAP25, MBP, and PCP4 in the Visium data confirm the presence of gray matter, WM, and cortical layers, respectively (see also Fig S1-Fig S3). (E) Schematic of unsupervised SpD identification and registration using BayesSpace SpDs at k=7. Enrichment t-statistics computed on BayesSpace SpDs were correlated with manual histological layer annotations from (6) to map SpDs to known histological layers. The heatmap of correlation values summarizes the relationship between BayesSpace SpDs and classic histological layers. Higher confidence annotations (⍴ > 0.25, merge ratio = 0.1) are marked with an “X”.

