

Abstract
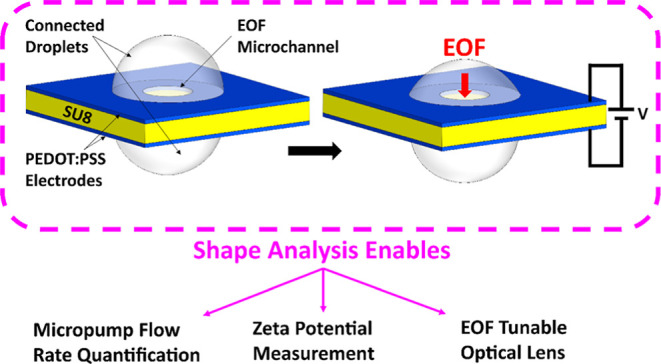
Thin electroosmotic flow (EOF) micropumps can generate flow in confined spaces such as lab-on-a-chip microsystems and implantable drug delivery devices. However, status quo methods for quantifying flow and other important parameters in EOF micropumps depend on microfluidic interconnects or fluorescent particle tracking: methods that can be complex and error-prone. Here, we present a novel connected droplet shape analysis (CDSA) technique that simplifies flow rate and zeta potential quantification in thin EOF micropumps. We also show that a pair of droplets connected by an EOF pump can function as a tunable convex lens system (TCLS). We developed a biocompatible and all polymer EOF micropump with an SU-8 substrate and poly(3,4-ethylenedioxythiophene) polystyrene sulfonate (PEDOT:PSS) electrodes. We microdrilled a channel through the electrode/SU-8/electrode layers to realize a monolithic EOF micropump. Then, we deposited a pinned droplet on each end of the microchannel so that it connected them. By controlling the EOF between the droplets and measuring the corresponding change in their shape, we quantified the nanoliter EOF rate and zeta potential at the interface of SU-8 with two liquids (deionized water and a l-glutamate neurotransmitter solution). When the droplet pair and pump were used as a TCLS, CDSA successfully predicted how the focal length would change when the pump drove fluid from one droplet to another. In summary, CDSA is a simple low-cost technique for EOF rate and zeta potential measurement, and a pair of droplets connected by an EOF micropump can function as a TCLS without any moving parts.
Introduction
Electroosmosis offers many advantages as a means of generating bulk liquid flow in microfluidic devices. It requires no moving parts, allows easy microfabrication, and can be actuated with electrodes that are integrated into the microchip substrate.1−3 Using electroosmotic flow (EOF), fluid can be manipulated inside a channel with dimensions ranging from a few hundred micrometers4 to a few nanometers.5 Since EOF velocity and pressure are controlled by the applied voltage, EOF provides a wide range of tunability with high resolution. Response latency between voltage application and observable fluid flow is on the order of a few milliseconds.6 EOF micropumps can be very thin,7−11 making them suitable for applications such as lab-on-a-chip and drug delivery devices. These applications demand precise quantification of the relationship between the applied voltage and flow rate and/or pressure. However, quantifying this relationship is challenging.7
Several techniques exist that can characterize flow in thin EOF devices. They fall into two categories: (1) volume measurement techniques and (2) velocity measurement techniques. In a volume measurement technique, the volume pumped is measured either by weighing it12 or by directing it into a narrow capillary containing an air/fluid interface and tracking the meniscus at this interface.8 These techniques require enclosing the thin EOF device in a chamber and channeling the bulk flow through fluidic interconnects into a vessel. Volume measurement works well in EOF devices with many parallel channels, but it becomes more challenging with a single microchannel because the flow rate is small, ranging from picoliters per second to a few microliters per second. Alternatively, velocity measurement involves tracking tracer particles dispersed in the fluid, typically with high-speed fluorescence microscopy.11,13 Since the EOF is driven by an electric field, the microparticles are also affected by this electric field, and prior knowledge of the dielectrophoretic properties14 (due to the particle’s surface charge) of the particles is required to compensate for this effect.15 Velocity measurement can be used in single microchannel EOF devices. However, if the microchannel is opaque or has thick sidewalls, observing fluorescent microparticles becomes challenging. Vogel et al. introduced a conceptual design of using droplets connected through a porous membrane for characterizing electrokinetic properties of the liquid and to demonstrate an interesting application of particle manipulation.16 They used densely packed silica frit contained in a custom fluidic chamber to generate EOF and nozzles to contain the droplets. However, a system to quantify single microchannel EOF micropumps without using any additional fluidic interconnects has not yet been presented in the literature. Furthermore, zeta potential must be measured to predict the EOF velocity and optimize the micropump since the zeta potential at the fluid and substrate interface of the device is unknown for novel fluid and device substrate combinations.
We present a connected droplet shape analysis (CDSA) method to quantify flow through thin single microchannel EOF micropumps. We deposited a sessile droplet (SD) on the upper opening of a liquid-filled microchannel and suspended a pendant droplet (PD) around the lower opening so that the EOF changed the shape of the droplets. Imaging and quantifying this shape change allowed us to quantify flow rates as low as 2.2 nL/s in a thin, all-polymer, biocompatible EOF device. This technique also quantifies the surface zeta potential, which we demonstrated by measuring the zeta potential between an SU-8 surface and an l-glutamate neurotransmitter solution. Finally, we showed that this arrangement of a thin transparent EOF pump with a vertical microchannel sandwiched between the SD and PD can function as a convex lens and the focal length of this lens can be varied using the EOF pump. Therefore, this device is a novel means of creating a miniature, electrically focused liquid lens.
Experimental Section
EOF Device Fabrication
Figure 1a–f summarizes the microfabrication process for the EOF device. More details can be found in the SI.2 section. Briefly, SU-8 passive structures were fabricated using a laser-based maskless pattern generator (μPG101, Heidelberg Instruments, Heidelberg, Germany). Polyethylene terephthalate (PET) attached to a borosilicate glass wafer was used as a sacrificial layer for releasing SU-8 microstructures from the wafer. SU-8 2035 (Kayaku Advanced Materials Inc., Westborough, MA) was spin-coated on the PET sheet to obtain a 158 μm thick SU-8 layer, and an area of 8 mm × 8 mm was exposed using the pattern generator. Softbake and post-exposure bake were performed according to the standard SU-8 baking protocol. The poor adhesion between SU-8 and the PET sheet allowed for the mechanical release of the developed microstructures by gently scraping with a sharp razor. Freshly developed microstructures were cleaned in a sequential bath of acetone, isopropanol, and deionized (DI) water and plasma-treated for 3 min before electrode layer coating.
Figure 1.

Schematical sequence showing the fabrication process of a complete EOF device used for CDSA. (a) SU-8 negative photoresist was spin-coated on a 2 in. glass wafer coated with a PET sheet and exposed using a laser writing system to crosslink an area of 8 × 8 mm dimensions and 155 μm thickness. (b) The exposed SU-8 was developed and mechanically released from the PET sheet using a razor blade to obtain the free standing SU-8 microstructures. (c) The SU-8 microstructures were held in self-closing forceps and dip-coated in the PEDOT:PSS liquid electrode polymer. The excess liquid was removed by spinning the microstructure on a spin coater to obtain a uniform electrode coating. The coated devices were baked for ∼6 h, and PEDOT:PSS layers from the sides of the SU-8 structure were removed by gently sanding the sides of the device. This step prevented shorting of the two electrodes. (d) The 50 μm diameter microchannel was drilled through the device using a 50 μm drill bit. (e) Spray-on hydrophobic coating was used to conformally coat the device to create a 1 mm diameter island for pinning the SD and PD. A part of the device was left uncoated to allow electrical contact between the pincers and the EOF device electrodes. Kapton tape was used as a mask where the coating was not required. (f) Schematic showing the complete EOF device with the location of the droplets and the dielectric coating.
The electrode layers on the SU-8 microstructure were deposited by dip coating the structures in a solution of poly(3,4-ethylenedioxythiophene) polystyrene sulfonate (PEDOT:PSS, Afga-Gevaert, Mortsel, Belgium) and dimethyl sulfoxide (DMSO, 5% vol in PEDOT:PSS). A uniform PEDOT:PSS coating was obtained by spinning the dip-coated structures on the spin coater. The coated structures were baked to remove solvents, and PEDOT:PSS was esterified by high-temperature annealing.17 During esterification, the coated structures were sandwiched between two flat weights to prevent warping. Subsequently, ethylene glycol treatment was performed to improve the conductivity and water stability of the PEDOT:PSS coating.18
The electrode coating thickness was quantified by measuring the step heights of the coated PEDOT:PSS using a contact profilometer (KLA-Tencor P7 Stylus Contact Profilometer, Milpitas, CA). The fabrication methodology presented here produces a consistent PEDOT:PSS coating around 1.04 ± 0.64 μm (s.d.) thick on SU-8. The procedure for the thin film characterization can be found in the SI.3 section. PEDOT:PSS coated structures were then microdrilled using a 50 μm diameter drill bit (Taiwan Microdrill, Taiwan) mounted on a CNC mill (CNC Mini-Mill/3 PRO, Minitech Machinery Corp), as shown in Figure 1d. This method results in a consistent, smooth, and well-defined microchannel. Laser drilling was also explored to create a microchannel in SU-8. However, the laser created nonuniform rough holes and charred the electrode and substrate material. Depending on the material and thickness of the substrate, a microchannel with a smaller diameter can be achieved using track etching,10 laser drilling, deep reactive ion etching,11 or focused ion beam milling.19 These fabrication methodologies provide a wide range of microchannel diameters and aspect ratios to tune the flow rate characteristics of the EOF device.
Following microdrilling, the microchannel openings were masked using a 1 mm diameter Kapton adhesive patch, and a rectangular portion of the electrode surface was also masked, as shown in Figure 1e. A thin layer of hydrophobic spray-on conformal coating (Turbo-Coat, Techspray, Kennesaw, GA) was used for creating a droplet pinning region (Figure 1f).
The current monitoring method (CMM)22 was used as an alternative zeta potential quantification technique. This method allowed for a comparison of the zeta potential of SU-8/glutamate between CDSA and the CMM. The EOF devices for the CMM were fabricated using 100 μm thick SUEX sheets (SUEX, DJ Microlaminates, Inc. Sudbury, MA, USA), and the complete fabrication procedure can be found in the SI.2 section. Briefly, a three-layered microfluidic device with a rectangular cross-section was fabricated on a clean borosilicate glass substrate (Figure 1a–d). Omnicoat (Microchem, Westborough, MA, USA) was used for adhesion and as a sacrificial layer. The first base layer was hot laminated on the wafer, and a 20 mm × 5 mm area was exposed using the pattern generator. Alignment marks were provided for subsequent layers. After laminating the second SUEX sheet, the channel layer was exposed, and the wafer was developed using the SU-8 developer. A third and final cover layer was hot laminated and exposed. After the final development, the structure was released from the wafer using the OmniCoat developer (Microposit MF 319, Microchem, Westborough, MA, USA). All three layers of SUEX were laminated using a hot roll laminator (AKILES Prolam, Mira Loma, CA, USA). A custom polydimethylsiloxane (PDMS) chip with two reservoirs on each side of the microchannel was prepared, which allowed mounting of the CMM EOF device between the two reservoirs.
The same range of l-glutamate concentrations (0.1, 0.5, and 1 mM) was used for both the CMM and CDSA. However, according to the measurement protocol in the CMM, the concentration differential of 10% was maintained for each l-glutamate concentration. One reservoir was filled with a 100% concentration of l-glutamate solution (say 1 mM), and the other reservoir and the microchannel were filled with a 90% concentration solution (0.90 mM).20 When a potential difference in the reservoir was applied using two tungsten probes (Figure S2e), the EOF displaced the low-concentration solution with the high-concentration solution, increasing the current in the circuit. The slope of the transient current was measured using a sourcemeter, and the EOF velocity (as well as zeta potential) was deduced.21,22
CDSA Experiments and Connected Droplet Dynamics
The complete experimental setup is shown in the SI.1 subsection, and a schematic is presented here in Figure 2a. A custom 3D printed pair of pincers with voltage supply electrodes was fabricated, and the EOF device was held by the jaws of the pincers. Using these pincers, the position of the EOF device could be adjusted with three degrees of freedom. This positioning allowed for a clear side view picture of the droplets. The pincers consisted of two electrical contact pads (copper tape) on each jaw, which was connected to a sourcemeter (Keithley 2611 A Sourcemeter, Keithley, Cleveland, OH). The duration and output voltage from the sourcemeter was controlled by a LabVIEW (National Instruments, Austin, TX) program. The EOF device and the pincers were enclosed within a custom humidifying chamber to reduce evaporation. An ultrasonic humidifier (Pureguardian H965AR, Guardian Technologies, Euclid, OH) supplied humid air. The device and the deposited droplets were viewed from the side from outside the chamber using a 5 MP digital camera (Moticam 5, Motic, Kowloon, Hong Kong) attached to a stereo microscope (SMZ 745 T, Nikon, Tokyo, Japan). All videos for CDSA experiments were captured at 25 frames per second. To observe the edge of the droplet with high contrast, a white background was created by a white LED flashlight with a diffuser. A green LED that was illuminated when voltage was applied was visible in the droplet images so that they could be synchronized with the voltage history (Figure 3a).
Figure 2.

Schematic of the experimental setup and close-up view of the connected SD and PD. (a) Schematic showing the experimental setup for CDSA. The EOF device consisted of an SU-8 microstructure (155 μm thick) sandwiched between two PEDOT:PSS electrode layers (1 μm thick) held in custom pincers with integrated copper electrodes for supplying voltage. The SD and PD were deposited near the openings of the 50 μm diameter microchannel. Voltage application was controlled by a LabVIEW program operating the sourcemeter. The EOF device and the pincers were housed inside a humidifying chamber to reduce droplet evaporation. Side view of the real-time SD and PD deflection was recorded using a 5 MP CMOS camera. (b) The SD and PD arrangement on an EOF device. The EOF device consisted of a passive SU-8 layer sandwiched between two PEDOT:PSS polymeric electrodes.
Figure 3.

Deflection of the droplet versus applied voltage and flow quantification methodology. (a) Frames showing the deflection of the SD and PD when 10 V is applied to the PEDOT:PSS electrodes for 15 s. The device outline is shown by the dotted orange line and the microchannel outline is shown by the red dotted line. A green LED is visible when the voltage is non-zero. (b) SD height vs time when 10 V is applied. (c) SD volume transient calculated from the height transient. The inset shows the initial portion of the transient where it is approximately linear (i.e., the flow rate is approximately constant).
To understand the droplet dynamics, we consider an EOF device with a single microchannel and two electrodes integrated on each surface of the passive structure as shown in Figure 2b. An SD is deposited on the top of the device, and a PD is deposited at the bottom. The droplet volumes (<0.5 μL each) are such that the surface tension forces are dominating and the effect of gravity can be neglected. This condition is achieved by maintaining the bond number (BO) ≪ 1. If BO ≈ 1, the weight needs to be accounted in a particular fluid with droplet height h and surface tension γ (eq 1).23
| 1 |
For the droplet heights used in this paper (h ≈ 0.5 mm) and considering a surface tension (γ) of 0.07 N/m and a density differential (Δρ) of 997 kg/m3 for the air/water interface, the resulting bond number BO is 0.035 at room temperature.
Using a spherical
drop approximation24 and the known surface
contact radii  and contact angles
  , the radii of the spheres (rs and rp) can be determined.
For a flow model where the SD and PD are connected by a single microchannel,
the fluid flow between the droplets is governed by the Young–Laplace
equation25−28 and can be represented by eq 2 as follows
, the radii of the spheres (rs and rp) can be determined.
For a flow model where the SD and PD are connected by a single microchannel,
the fluid flow between the droplets is governed by the Young–Laplace
equation25−28 and can be represented by eq 2 as follows
| 2 |
When the SD and PD are deposited such that their spherical radii are equal (rs = rp), no flow occurs, and the system is at equilibrium (or ΔP = Ps – Pp = 0). However, this equilibrium condition and the spherical radii can be affected by switching the EOF on (eq 6).
The growth of SD rs and simultaneous shrinking of the PD rp (for example) depends on the direction of the EOF from the PD to SD. Here, the surface contact radius (Rs) remains constant for both the SD and PD, i.e., the droplets are pinned. It should be noted that an alternate case is also possible where the contact angle remains constant for the droplets during switching. In such a case, Ps = Pp (assuming rs = rp), and the EOF will encounter no resistance while pumping fluid from the PD to SD (or vice versa). However, we will only analyze the pinned droplet condition in this paper.
Using trigonometric relations, ΔP(t) can be expressed in terms of heights (h) and contact radii (Rs) of the SD and PD, as shown in eq 3, and its derivation can be found in the SI.4 subsection.
 |
3 |
Since the volume of the fluid (ν) deposited is known, we can also establish a relationship between the SD and PD heights as follows
| 4 |
This mathematical treatment results in a cubic equation in terms of hs, as shown by eq 5, and eq 3 can be evaluated in closed form if the time-dependent SD or PD height [hs(t) or hp(t)] is known. For the analysis presented here, only the real and positive root is considered and verified against the numerical simulations and experiments. Additionally, eq 5 can be modified to obtain the hp when hs is known.
| 5 |
where c = Rss2 and  .
.
As shown in Figure 2a,b, EOF is generated by switching the electric
field between two
electrodes that are integrated with the passive structure containing
the microchannel. Due to the surface charges accumulating within the
SU-8 microchannel wall, free ions (of concentration c and valence z) within the fluid will screen the
inner wall up to an effective distance of  ≈ 30 nm, where ϵ is the product
of the liquid dielectric constant and permittivity of free space, kB is the Boltzmann constant, T is the temperature, e is the unit charge on an
electron, and Na is Avogadro’s
number.21,29 Assuming the microchannel radius a ≫ λD, the transient electroosmotic
velocity and flow rate can be simplified as follows
≈ 30 nm, where ϵ is the product
of the liquid dielectric constant and permittivity of free space, kB is the Boltzmann constant, T is the temperature, e is the unit charge on an
electron, and Na is Avogadro’s
number.21,29 Assuming the microchannel radius a ≫ λD, the transient electroosmotic
velocity and flow rate can be simplified as follows
| 6 |
In eq 6, u(r)t is the transient fluid velocity at a given radial location in the microchannel r, ζ is the zeta potential, η is the dynamic viscosity of the fluid, and L is the length of the microchannel. By integrating eq 6 over the radius of the microchannel, the transient flow rate Q(t) can be determined as
| 7 |
When
| 8 |
When the droplets are adjusted such that the radius of curvature of the SD is equal to that of the PD, no flow occurs (or ΔP = 0). During electroosmotic pumping of the fluid from the SD to PD (downward in Figure 2b), the radius of curvature of the SD increases, and conversely, the radius of curvature of the PD decreases. This change of shape continues to occur until the high pressure inside the PD is equal to the pressure generated by the electroosmotic pump for a given voltage. In this limiting case, when Q(t → ∞) = 0, the pump will reach its maximum pumping pressure to counter the inter droplet pressure differential. Using Q(t → ∞) = 0, eq 7 can be written as
| 9 |
It can be observed from eq 9 that the maximum pressure (or pump stall point) can be increased by either decreasing the radius of the EOF channel or increasing the applied potential difference.
Flow Rate and Zeta Potential Quantification Using CDSA
The SD and PD were deposited on the EOF device using a pipette (Finnpipette 0.2–2 μL, Thermo Fisher Scientific, Waltham, MA). The side view of the droplets can be seen in Figure 3a. A custom Matlab (MathWorks, Natick, MA) image analysis script tracked the transient height of the SD under voltage application. By using a zoom of 5× from the microscope, the height of the SD with respect to the baseline (EOF device surface) can be measured with a resolution of 1.5 μm/pixel.
Consider the droplet behavior during voltage application in Figure 3b from 0 to 15 s. The downward EOF generated in the microchannel transferred the fluid from the SD to the PD. This flow caused a height reduction of the SD and a corresponding height increase in the PD. Since the droplets were pinned, this height variation implied that the pressure inside the SD decreased while the pressure inside the PD increased. This phenomenon can be quantified by tracking the height of the SD (hs) with respect to the time, as shown in Figure 3b. When no voltage was applied, the SD height remained constant (−5 s < t < 0 s), and both the SD and PD remained in equilibrium. During the voltage application window (0 s < t < 15 s), the SD height continued to decrease until the voltage was turned off. For t > 15 s, the SD height started increasing again due to the backflow of fluid from the PD, which had Poiseuille’s flow characteristics.30 Since the dimensions of the droplet (rss and rs) were known from the calibrated video frames, the instantaneous flow rate was quantified from the slope of the tangent during the first second of voltage application.31 During this 1 s window, back pressure from the PD was negligible, as evidenced by the linear regime of droplet deflection and the corresponding constant flow rate generated by the EOF micropump, as shown in Figure 3c. Since the initial flow rate between 0 and 1 s was measured using the transient SD height, the change in the droplet volume due to the EOF could be determined, and eq 8 was used to quantify zeta potential by setting Δp = 0.
Numerical Simulation
The effect of the EOF on the SD and PD under a pulsed voltage application was predicted using a 2D axisymmetric numerical simulation in COMSOL Multiphysics 5.3. Electrostatics was solved using Gauss’ Law to determine the electric field distribution in the fluid and device domain. A laminar two-phase flow with a moving mesh was used to solve the flow problem. The effect of evaporation was not included. This multiphase flow model provided boundary conditions and surface tension values for the liquid/air interface. The moving mesh was constrained near the SU-8 domain to simulate the pinned droplet condition, whereas the mesh was allowed to slide along the axis of symmetry. An EOF boundary condition was provided in the microchannel walls, and the zeta potential value required for the boundary condition was found from the CDSA experiments. To obtain the dimensions of the SD and PD, the SU-8 thickness, and the microchannel diameter, a transient SD experiment from one of the EOF devices was utilized. The geometrical setup of the droplets and the complete list of boundary conditions and parameters used for simulations can be found in the Supporting Information.
Results and Discussion
Total Droplet Volume Affects the Transient SD Height Characteristics
The total volume (SD volume + PD volume) of the fluid deposited on the EOF device affects the transient response of the SD height, with lower volumes leading to more rapid responses. There is no change in SD droplet height before voltage is applied (Figure 4), indicating equilibrium (−5 s to 0 s) between the SD and PD. This is true for both high volume (HV) and low volume (LV) scenarios. When voltage is applied at 0 s, the droplets with a high deposited fluid volume have a more linear response, whereas low fluid volumes result in an asymptotic SD height trend that suggests that the system is approaching a new equilibrium. When the voltage returns to zero, the SD height returns to its initial value, and this transient is also faster in the LV scenario (Figure 4a). This phenomenon can be understood using the Young–Laplace equation (eq 2). For a condition where equal voltage is applied to both high and low fluid volumes, the EOF will transfer the same quantity of fluid, initially resulting in a higher rate of change in the spherical radii of the SD and PD in the LV case, thus increasing the rate of change in the pressure differential between the two droplets. The pixel resolution of the images for CDSA was quantified using a calibration loupe with 500 μm grids and was found to be 1.56 ± 0.01 μm/pixel (n = 16).
Figure 4.

Effect of droplet volume on SD height transient. (a) Transient response for HV (0.75 μL) and LV (0.5 μL) scenarios (N = 4 devices, n = 24 trials). (b) Box plot of droplet deflection at the end of voltage application at t = 15 s. The red line is the median, the box edges are the 25th and 75th percentiles, and the whiskers span the data points that do not appear to be outliers. (c) Side view of the representative HV droplet and (d) LV droplet. Both side view images were acquired at t = 0 s.
To determine the zeta potential of the SU-8 and DI water interface, eq 8 is used. The flow rate was found from the slope of the transient SD taken between 0 and 1 s.31 An average zeta potential of −43.8 mV (standard deviation = 30.57 mV) for SU-8 and DI water was obtained from 24 trials (N = 4 devices, n = 24 trials). Zeta potential for individual devices can be found in Table S3 in the Supporting Information.
CDSA requires a pinned droplet condition, wherein the change in the droplet volume occurs strictly due to the change in the radius of curvature of the droplet, viz., the spherical droplet approximation. We prevented the droplet from spreading by exposing the device to oxygen plasma, making it hydrophilic and also creating a hydrophobic perimeter composed of dielectric coating. This approach pinned the droplets (i.e., kept the contact radius constant) during the experiment. The smoothness of the hydrophobic perimeter depended on the smoothness of the Kapton mask used to create it. A more perfectly circular perimeter might improve the precision of the flow rate quantification and zeta potential measurement. Other potential sources of variability include mechanical vibration of the droplet, impurities blocking the microchannel, and electrical charges accumulating on the surface of the SD. The effect of these factors on the droplet deflection can be observed in Figure 4b.
Droplet Deflection and Flow Rate Depend on EOF Voltage
The applied voltage determines the rate of change of the SD height, which means that it determines the EOF flow rate (see the section Numerical Simulations for Predicting Connected Droplet Behavior). The amplitude of the SD deflection increases with increasing applied voltage (Figure 5a), as does the instantaneous flow rate at the time the voltage is applied (Figure 5b).
Figure 5.

Effect of voltage on the flow rate generated by the EOF device. (a) Representative figure showing the transient variation of SD height for different applied voltages (5, 10, and 15 V). (b) Flow rate generated at different voltages of 5, 10, and 15 V (N = 4 devices, n = 12 measurements per voltage). The features of the box plot are defined as described in the caption for Figure 4b.
Numerical Simulations for Predicting Connected Droplet Behavior
SD and PD droplet geometries obtained from the experiments conducted with one of the devices were constructed and analyzed using COMSOL Multiphysics simulation. Similar to the experiment, a voltage pulse was applied at t = 0 s, causing the SD height to decrease. After the voltage returned to 0 V at t = 15 s, the SD height returned to its original value. The zeta potential was parametrically applied in steps of −0.005 V to the numerical model and ranged from −0.038 to −0.072 in the HV case and −0.038 to −0.097 V in the LV case. The numerical model predicted experimental height transients better in the HV case than in the LV case (Figure 6a,b) when a zeta potential of −0.043 V is supplied to the model, similar to the experimentally found zeta potential of −0.0438 V. The rebound of the height after voltage returned to zero was faster in the experimental data than in the numerical model in the HV case. In the LV case, a faster rebound is observed and depression in the deflection is lower for the same zeta potential value in the experiment and COMSOL.
Figure 6.

Numerical simulation of droplet dynamics. Transient SD height characteristics found experimentally and by COMSOL simulation for device 1 in the (a) HV case and (b) LV case. The thin multicolor lines represent the droplet deflection predicted by COMSOL for zeta potential values ranging monotonically in steps of 0.005 V between the values stated on the charts, whereas the thick dashed line represents the averaged experimental data (n = 3 each) for HV and LV cases. (c) Flow rate comparison between experiments and numerical simulations shows similar transient flow rate characteristics when 10 V is applied for 15 s to drive the flow from the SD to PD. Flow rate from experimental trials (n = 3 each) from HV and LV cases are averaged and presented as solid red and black lines, respectively. (d) Flow profile in the microchannel at various times for an HV scenario.
Figure 6c shows the transient flow rate obtained from the simulation and experiment for different droplet volumes (HV and LV). The experimental flow rate was obtained by calculating the transient SD volume using the volume of the spherical cap (as the sphere radius, the contact radius, and the SD height are known) and taking the time derivative after piecewise smoothing. Transient flow in the numerical simulation was determined by integrating the flow profile at the microchannel center. The numerical model predicted the flow rate reasonably well for both the HV and LV cases. Figure 6d shows the fluid flow vectors inside the microchannel during the CDSA event. Initially, during the equilibrium between the SD and PD (t = −5 s), there is negligible flow due to a slight disparity between the SD and PD spherical radii. However, when the voltage is switched on at 0 s, the flow profile in the microchannel is predominantly electroosmotic (t = 10 s), meaning that the velocity vector is higher in magnitude near the surface than at the center of the microchannel. This flow results in a fluid transfer from the SD to PD, increasing the pressure inside the PD. At the end of the voltage application period (t = 15 s), the pressure inside the SD and pressure generated by the EOF counteract the pressure inside the PD. After the voltage is switched off, flow reverses and the flow profile has Poiseuille’s flow characteristics (t = 25 s).
Under voltage application, apart from the EOF changing the droplet shape, there could be a contribution from surface charges, resulting in the deformation of the water/air interface. This phenomenon is not included in the numerical model, and it tends to increase height changes beyond those due to the EOF. Therefore, it may explain differences between the experimental results and the model predictions, particularly in the LV case where this phenomenon would be more influential (Figure 6b). Theoretically, variability could be reduced by extending the experiment until the transient SD height approaches its asymptote and fitting to the asymptote instead of the current practice of fitting to the first second of the transient. However, in practice, this approach would increase the confounding effect of evaporation, which occurs despite the humidified environment.
Zeta Potential at the SU-8/l-Glutamate Amino Acid Interface Can Be Determined Using CDSA
CDSA can also determine the zeta potential at a fluid/solid interface. We chose a glutamate solution and an SU-8 surface to demonstrate this capability because this interface arises in neural stimulation applications and has not previously been characterized in the literature to our knowledge. The zeta potential for this interface is negative, and its magnitude decreases with increasing glutamate ion concentration (Figure 7). This trend occurs because the electrical double layer at the interface becomes more compact32 as the ion concentration increases, decreasing the mobility of the ions that drive the EOF. These measurements were validated by comparison to experimental measurements obtained using the CMM. The magnitudes of measurements obtained using both techniques are similar, but the trend is more linear for the CMM than it is for the CDSA technique.
Figure 7.
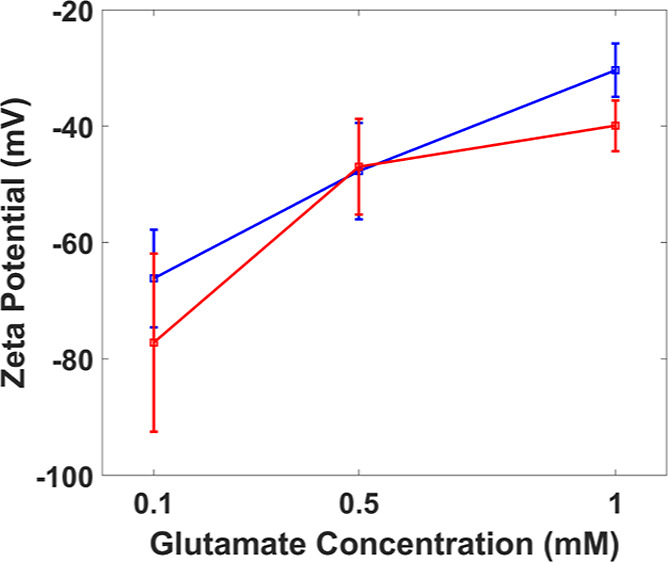
Comparison of SU-8/glutamate zeta potential measured using CDSA and the CMM. Zeta potential increases with decreasing glutamate concentration (for CDSA, N = 4 devices, n = 12 trials; for CMM, n ≥ 13). Red and blue solid lines are plotted through the averages for CDSA and CMM measurements, respectively.
This difference in trends (between CDSA and the CMM) can be attributed to the composition of the microchannel material. The microchannel for CMM experiments was fabricated using SUEX sheets (DJ Microlaminates, Sudbury, MA) compared to SU-8 2035 for CDSA devices. Since surface charges responsible for EOF and zeta potential primarily arise from the proprietary photoinitiator salts and solvents used in the SU-8 epoxy,20 the magnitudes of zeta potentials generated in SU-8 and SUEX will be slightly different. Furthermore, studies have observed interface charging when water droplets are in contact with solid, liquid, or gaseous substances.33,34
CDSA’s Application in Dynamic Optics
The arrangement of an SD, a transparent EOF micropump, and a PD can function as a tunable convex lens system (TCLS). The initial focus distance when both the SD and PD are in equilibrium [Figure 8a(i)] is around 1 mm (or 2f = 2 mm). When an object (80 μm dia. microsphere) is fixed at 2 mm below the EOF device, an inverted image is formed. At −50 V EOF [Figure 8a(ii)], the focal point moves away from the object (Figure 8e), causing a slight (yet negligible) decrease in the image size [Figure 8b(ii)] when compared to that of the image at equilibrium [Figure 8b(i)]. However, when +50 V EOF [Figure 8a(iii)] is applied, the focus distance increases, and the microsphere image is enlarged [Figure 8b(iii)]. Similarly, at lower voltages (20 V), a clear change in sharpness can be observed when a text (1 mm height) is focused (Figure 8c). The text is placed between f and 2f, resulting in a defocused image [Figure 8c(i)] initially, which is focused by applying a −20 V EOF, causing an increase in the sharpness [Figure 8c(ii)]. The dynamic response latency can be reduced by supplying a higher voltage. Higher voltages increase the EOF flow rate and accelerate droplet deflection. A maximum focus range of 350 μm is obtained when ±50 V is applied (Figure 8d,e).
Figure 8.

Optical application of CDSA for changing the magnification and sharpness of microscopic objects. (a) Montage of images showing side views of the SD and PD droplets when 0, −50, and 50 V are applied to the EOF device. [a(i)] SD and PD droplets at the equilibrium. [a(ii)] Fluid from the PD flows up into the SD when a −50 V is applied to the EOF device. [a(iii)] Reversing the EOF of fluid from the SD to PD. (b) Montage of images corresponding to the sequence in subplot (a) when an 80 μm diameter sphere (indicated by the white arrow) is viewed through the droplets from the top. [b(ii)] lower sharpness of the microsphere can be observed when −50 V is applied, whereas higher magnification can be observed in plot [b(iii)]. (c) Montage showing images of a PCB label (∼1 mm in height) being brought in and out of focus by controlling EOF voltage. (d) True size geometry of the droplet system showing the range of droplet deflection (solid lines) and a corresponding change in the focal point (+mark). The focal point is at the lowest (lightest gray color) when +50 V is applied, whereas the highest focal point (black color) is achieved when −50 V is applied. (e) Plot showing the measured dimensions of the SD and PD and the corresponding focus distances.
For miniaturized microscopy systems, the ability to change the focal length of a lens without any moving parts simplifies the construction of the microscope. Electrowetting lenses are well-established commercially available tools in which electrostatic forces manipulate the shape of the lens. Here, we used fluid flow rather than electrostatics to manipulate the shape of the droplet pair that functions as a convex lens. The thickness of the lens in the resulting TCLS can be manipulated by varying the fluid volume. However, it is important to note that the current prototype TCLS takes a few seconds to change focus, making it slower than an electrowetting lens,35 which can change focus in milliseconds.36,37 The response time could be improved by including multiple microchannels in parallel. The channels could be arranged near the perimeter of the droplet contact line rather than at the center to reduce aberrations in the image. Since the current TCLS is exposed to ambient humid air, evaporation control is challenging for a prolonged experimental duration (>1 min). However, immersing the TCLS in an immiscible oil medium could eliminate evaporation. This methodology is well established by electrowetting lenses and electrowetting on dielectric (EWOD) systems.38 This approach would also eliminate the confounding effect of evaporation on CDSA in flow rate and zeta potential measurements discussed in the previous paragraph.
Conclusions
In conclusion, using CDSA of two droplets deposited on either side of the 50 μm microchannel in the EOF device, the fluid flow rate and zeta potential were quantified. Monolithic EOF devices were microfabricated using SU8 and integrated electrodes made of PEDOT:PSS. A low flow rate in the order of 2.2 nL/s was detected, and a good corroboration for glutamate/SU8 zeta potential was found by using CDSA and the CMM. COMSOL Multiphysics numerical simulations predicted the experimental phenomenon fairly and can be employed as a tool for optimizing droplet dynamics due to EOF. Additionally, it was observed that the optical properties of the lens system formed by the connected droplets can act as a TCLS. An 80 μm diameter particle was magnified, and its image sharpness was enhanced by controlling the shape of the connected droplet system. By employing polymer materials such as SU8 and PEDOT:PSS used in this study, biocompatible micropumps can be realized. The proposed method is low-cost and does not require any specialized instruments for characterizing flow in thin electroosmotic micropumps and electrokinetic properties at the liquid/solid interface.
Acknowledgments
Authors would like to acknowledge the funding from the National Institutes of Health under Grant No. 5R21EB028069-02 and the Award for Graduate Research grant at University of Illinois at Chicago.
Supporting Information Available
The Supporting Information is available free of charge at https://pubs.acs.org/doi/10.1021/acs.langmuir.2c02875.
Additional description of the experimental setup, microfabrication details, additional mathematical development of the theory, numerical simulation details, and additional experimental results (PDF)
Author Contributions
S.S.K. conceived the idea. S.S.K. and J.D.F. designed the experiment and wrote the manuscript. P.K.R. microfabricated SU-8 devices. S.S.K. assisted P.K.R. with electrode coating and thickness characterization. Y.G. assisted with drilling the microchannel in EOF devices. J.X. provided the CNC mill for drilling microchannels in EOF devices.
The authors declare no competing financial interest.
Supplementary Material
References
- Wang X.; Cheng C.; Wang S.; Liu S. Electroosmotic pumps and their applications in microfluidic systems. Microfluid. Nanofluid. 2009, 6, 145–162. 10.1007/s10404-008-0399-9. [DOI] [PMC free article] [PubMed] [Google Scholar]
- Li L.; Wang X.; Pu Q.; Liu S. Advancement of electroosmotic pump in microflow analysis: A review. Anal. Chim. Acta 2019, 1060, 1–16. 10.1016/j.aca.2019.02.004. [DOI] [PubMed] [Google Scholar]
- Alizadeh A.; Hsu W.-L.; Wang M.; Daiguji H. Electroosmotic flow: From microfluidics to nanofluidics. Electrophoresis 2021, 42, 834–868. 10.1002/elps.202000313. [DOI] [PMC free article] [PubMed] [Google Scholar]
- Kang Y.; Li D.; Kalams S. A.; Eid J. E. DC-Dielectrophoretic separation of biological cells by size. Biomed. Microdevices 2008, 10, 243–249. 10.1007/s10544-007-9130-y. [DOI] [PubMed] [Google Scholar]
- Peng R.; Li D. Electroosmotic flow in single PDMS nanochannels. Nanoscale 2016, 8, 12237–12246. 10.1039/C6NR02937J. [DOI] [PubMed] [Google Scholar]
- Kare S. S.; Rountree C. M.; Troy J. B.; Finan J. D.; Saggere L. Neuromodulation Using Electroosmosis. J. Neural. Eng. 2021, 18, 046072. 10.1088/1741-2552/ac00d3. [DOI] [PMC free article] [PubMed] [Google Scholar]
- Bengtsson K.; Christoffersson J.; Mandenius C.-F.; Robinson N. D. A clip-on electroosmotic pump for oscillating flow in microfluidic cell culture devices. Microfluid. Nanofluid. 2018, 22, 27. 10.1007/s10404-018-2046-4. [DOI] [Google Scholar]
- Snyder J. L.; et al. High-performance, low-voltage electroosmotic pumps with molecularly thin silicon nanomembranes. Proc. Natl. Acad. Sci. U.S.A. 2013, 110, 18425–18430. 10.1073/pnas.1308109110. [DOI] [PMC free article] [PubMed] [Google Scholar]
- Wang C.; Wang L.; Zhu X.; Wang Y.; Xue J. Low-voltage electroosmotic pumps fabricated from track-etched polymer membranes. Lab Chip 2012, 12, 1710–1716. 10.1039/C2LC40059F. [DOI] [PubMed] [Google Scholar]
- Kwon K.; Park C.-W.; Kim D. High-flowrate, compact electroosmotic pumps with porous polymer track-etch membranes. Sens. Actuators, A 2012, 175, 108–115. 10.1016/j.sna.2011.12.050. [DOI] [Google Scholar]
- Branagan S. P.; Contento N. M.; Bohn P. W. Enhanced Mass Transport of Electroactive Species to Annular Nanoband Electrodes Embedded in Nanocapillary Array Membranes. J. Am. Chem. Soc. 2012, 134, 8617–8624. 10.1021/ja3017158. [DOI] [PubMed] [Google Scholar]
- Bengtsson K.; Robinson N. D. A large-area, all-plastic, flexible electroosmotic pump. Microfluid. Nanofluid. 2017, 21, 178. 10.1007/s10404-017-2017-1. [DOI] [Google Scholar]
- Jun I.-K.; Hess H. A Biomimetic, Self-Pumping Membrane. Adv. Mater. 2010, 22, 4823–4825. 10.1002/adma.201001694. [DOI] [PubMed] [Google Scholar]
- Yan D.; Nguyen N.-T.; Yang C.; Huang X. Visualizing the transient electroosmotic flow and measuring the zeta potential of microchannels with a micro-PIV technique. J. Chem. Phys. 2006, 124, 021103. 10.1063/1.2162533. [DOI] [PubMed] [Google Scholar]
- Devasenathipathy S.; Bharadwaj R.; Santiago J. G. Investigation of internal pressure gradients generated in electrokinetic flows with axial conductivity gradients. Exp. Fluids 2007, 43, 959–967. 10.1007/s00348-007-0366-3. [DOI] [Google Scholar]
- Vogel M. J.; Ehrhard P.; Steen P. H. The electroosmotic droplet switch: Countering capillarity with electrokinetics. Proc. Natl. Acad. Sci. U.S.A. 2005, 102, 11974–11979. 10.1073/pnas.0505324102. [DOI] [PMC free article] [PubMed] [Google Scholar]
- Cho N.; Diekhans J.; Steward M.; Bakr O. M.; Choi S. A facile micropatterning method for a highly flexible PEDOT:PSS on SU-8. Org. Electron. 2016, 34, 75–78. 10.1016/j.orgel.2016.04.004. [DOI] [Google Scholar]
- Wei T.-C.; Chen S.-H.; Chen C.-Y. Highly conductive PEDOT:PSS film made with ethylene-glycol addition and heated-stir treatment for enhanced photovoltaic performances. Mater. Chem. Front. 2020, 4, 3302–3309. 10.1039/D0QM00529K. [DOI] [Google Scholar]
- Haywood D. G.; Harms Z. D.; Jacobson S. C. Electroosmotic Flow in Nanofluidic Channels. Anal. Chem. 2014, 86, 11174–11180. 10.1021/ac502596m. [DOI] [PMC free article] [PubMed] [Google Scholar]
- Sikanen T.; Tuomikoski S.; Ketola R. A.; Kostiainen R.; Franssila S.; Kotiaho T. Characterization of SU-8 for electrokinetic microfluidic applications. Lab Chip 2005, 5, 888–896. 10.1039/B503016A. [DOI] [PubMed] [Google Scholar]
- Arulanandam S.; Li D.-D. Determining ζ Potential and Surface Conductance by Monitoring the Current in Electro-osmotic Flow. J. Colloid Interface Sci. 2000, 225, 421. 10.1006/jcis.2000.6783. [DOI] [PubMed] [Google Scholar]
- Sze A.; Erickson D.; Ren L.; Li D. Zeta-potential measurement using the Smoluchowski equation and the slope of the current-time relationship in electroosmotic flow. J. Colloid Interface Sci. 2003, 261, 402–410. 10.1016/S0021-9797(03)00142-5. [DOI] [PubMed] [Google Scholar]
- Javadi A.; Habibi M.; Taheri F. S.; Moulinet S.; Bonn D. Effect of wetting on capillary pumping in microchannels. Sci. Rep. 2013, 3, 1412. 10.1038/srep01412. [DOI] [PMC free article] [PubMed] [Google Scholar]
- Chatterjee J. Limiting conditions for applying the spherical section assumption in contact angle estimation. J. Colloid Interface Sci. 2003, 259, 139–147. 10.1016/S0021-9797(02)00198-4. [DOI] [PubMed] [Google Scholar]
- Ju J.; et al. Backward flow in a surface tension driven micropump. J. Micromech. Microeng. 2008, 18, 087002. 10.1088/0960-1317/18/8/087002. [DOI] [Google Scholar]
- Berthier E.; Beebe D. J. Flow rate analysis of a surface tension driven passive micropump. Lab Chip 2007, 7, 1475–1478. 10.1039/B707637A. [DOI] [PubMed] [Google Scholar]
- Javadi K.; Moezzi-Rafie H.; Goodarzi-Ardakani V.; Javadi A.; Miller R. Flow physics exploration of surface tension driven flows. Colloids Surf., A 2017, 518, 30–45. 10.1016/j.colsurfa.2016.12.030. [DOI] [Google Scholar]
- Shabani R.; Cho H. J. Active surface tension driven micropump using droplet/meniscus pressure gradient. Sens. Actuators, B 2013, 180, 114–121. 10.1016/j.snb.2012.05.058. [DOI] [Google Scholar]
- Hunter R. J.; Ottewill R. H.; Rowell R. L.. Zeta Potential in Colloid Science; Academic Press, 1981. [Google Scholar]
- Tokaty G. A.A History and Philosophy of Fluid Mechanics; Courier Corporation, 1994. [Google Scholar]
- Barz D. P. J.; Vogel M. J.; Steen P. H. Determination of the zeta potential of porous substrates by droplet deflection. I. The influence of ionic strength and pH value of an aqueous electrolyte in contact with a borosilicate surface. Langmuir 2009, 25, 1842–1850. 10.1021/la802949z. [DOI] [PubMed] [Google Scholar]
- Brown M. A.; Goel A.; Abbas Z. Effect of Electrolyte Concentration on the Stern Layer Thickness at a Charged Interface. Angew. Chem., Int. Ed. 2016, 55, 3790–3794. 10.1002/anie.201512025. [DOI] [PubMed] [Google Scholar]
- Díaz D.; et al. Charging of drops impacting onto superhydrophobic surfaces. Soft Matter 2022, 18, 1628–1635. 10.1039/D1SM01725J. [DOI] [PubMed] [Google Scholar]
- Nauruzbayeva J.; Sun Z.; Gallo A.; Ibrahim M.; Santamarina J. C.; Mishra H. Electrification at water-hydrophobe interfaces. Nat. Commun. 2020, 11, 1. 10.1038/s41467-020-19054-8. [DOI] [PMC free article] [PubMed] [Google Scholar]
- Chen L.; Ghilardi M.; Busfield J. J. C.; Carpi F. Electrically Tunable Lenses: A Review. Front. Robot. Artif. Intell. 2021, 8, 678046. 10.3389/frobt.2021.678046. [DOI] [PMC free article] [PubMed] [Google Scholar]; (accessed July 16, 2022) [Online]. Available: https://www.frontiersin.org/articles/10.3389/frobt.2021.678046
- Murade C. U.; van der Ende D.; Mugele F. High speed adaptive liquid microlens array. Opt. Express 2012, 20, 18180. 10.1364/OE.20.018180. [DOI] [PubMed] [Google Scholar]
- Watson A. M.; Dease K.; Terrab S.; Roath C.; Gopinath J. T.; Bright V. M. Focus-tunable low-power electrowetting lenses with thin parylene films. Appl. Opt. 2015, 54, 6224–6229. 10.1364/AO.54.006224. [DOI] [PubMed] [Google Scholar]
- Li J.; Kim C.-J. Current commercialization status of electrowetting-on-dielectric (EWOD) digital microfluidics. Lab Chip 2020, 20, 1705–1712. 10.1039/D0LC00144A. [DOI] [PubMed] [Google Scholar]
Associated Data
This section collects any data citations, data availability statements, or supplementary materials included in this article.