Abstract
Controlled and reproducible synthesis of tailored materials is essential in many fields of nanoscience. In order to control synthesis, there must be a fundamental understanding of nanostructure evolution on the length scale of its features. Growth mechanisms are usually inferred from methods such as (scanning) transmission electron microscopy ((S)TEM), where nanostructures are characterized after growth is complete. Such post mortem analysis techniques cannot provide the information essential to optimize the synthesis process, because they cannot measure nanostructure development as it proceeds in real time. This is especially true in the complex rheological fluids used in preparation of nanoporous materials. Here we show direct in situ observations of synthesis in a highly viscous lyotropic liquid crystal template on the nanoscale using a fluid stage in the STEM. The nanoparticles nucleate and grow to ~5 nm particles, at which point growth continues through the formation of connections with other nanoparticles around the micelles to form clusters. Upon reaching a critical size (>10–15 nm), the clusters become highly mobile in the template, displacing and trapping micelles within the growing structure to form spherical, porous nanoparticles. The final products match those synthesized in the lab ex situ. This ability to directly observe synthesis on the nanoscale in rheological fluids, such as concentrated aqueous surfactants, provides an unprecedented understanding of the fundamental steps of nanomaterial synthesis. This in turn allows for the synthesis of next generation materials that can strongly impact important technologies such as organic photovoltaics, energy storage devices, catalysis, and biomedical devices.
Keywords: Energy/hydrogen storage, mesoporous nanoparticles, surfactant template, porous palladium, in situ microscopy, lyotropic liquid crystal
Achieving precise and flexible control of nanostructure during synthesis is a paramount goal in many fields of nanoscience because the properties of such materials are directly determined by their nanoscale dimensions and morphology. This is certainly true in the fields of energy storage and generation,1,2 hydrogen storage,3 catalysis,4 semiconductors,5 magnetic materials,6 water purification,7 and biomedicine.8 The first step to finely controlling the synthesis, and thus properties, of a material is having a means to observe, measure and understand its growth mechanism in detail. Commonly, structures are grown and then characterized using various techniques, including electron microscopy. Growth models are then inferred based on those observations. However, these ex situ experimental techniques are limited in the sense that they follow the evolution of the average structure (or structure distribution, in the more detailed studies), but cannot observe the growth over time of an individual particle or specific structure. Because of this, one can expect that subtleties in the growth processes can be missed. To directly observe growth processes, an in situ nanoscale characterization method is necessary. Some insights have been gained from in situ gas studies in electron microscopes,9–11 but most nanostructure synthesis methods are performed in solution, or include a solution phase as one step of the process, so gas studies alone are not representative of the conditions of most nanostructure syntheses.
In situ liquid microscopy was initially developed to study copper electrodeposition from aqueous media,12–15 but has since expanded in application. In situ experiments have been performed to study the growth and motion of gold,16–18 lead sulfide,19 and platinum20 nanoparticles in aqueous solutions, as well as the metallic nanoparticle interactions with whole biological cells.21–23 However, no previous in situ liquid studies have involved fluids with complex rheology.
This study reports the first continuous in situ characterization of nanostructures developed during deposition within a phase-separated surfactant-solvent template. Characterization was accomplished by growing the nanostructures within an in situ liquid specimen holder in a (scanning) transmission electron microscope ((S)TEM) and observing the continuous growth in real time.
The experimental system investigated here involved mesoporous palladium nanoparticles with highly connected 2–3 nm diameter pores, formed by reduction of aqueous Pd salts within an organic lyotropic liquid crystal (LLC) surfactant template (Brij 56 surfactant).24,25 Ex situ synthesis of these nanoparticles has been performed at Sandia National Laboratories.24 Controlled growth using a LLC template has been a fruitful process for synthesis of mesoporous platinum films,26 mesostructured porous silica,27,28 and mesostructured CdS or CdSe semiconductors.29 In this process, solid structures are grown in the presence of a surfactant-solvent mixture that is phase separated on the nanoscale with a high degree of order.24,25 In the studies reported here, reduction is induced by the electron beam without or with a prior treatment with ascorbate, a chemical reducing agent. Previous studies of these Pd nanoparticles indicate favorable hydrogen storage properties, but the pore structure is not as ordered as the surfactant template.24,25 Ordered pores are expected to provide more thermal stability to the nanostructure.25,30 In order to synthesize more uniform mesoporous Pd structures using LLC surfactant templates, the synthesis growth mechanisms must be understood.
The in situ liquid specimen holder for the STEM (JEOL JEM-2100F spherical aberration corrected instrument at UC Davis) used in this study is currently commercially available from Hummingbird Scientific. In these in situ stages, liquid samples are enclosed between two thin silicon nitride membranes, and growth within the sample is generally induced by electron beam interactions. In our experiments the specimens were contained between two 50 nm thick silicon nitride membranes (on silicon supports) separated by 100 – 200 nm gold spacers.
Results and Discussion
Three different experiments have been performed. The first was a control, in which Pd nanoparticles were grown from an aqueous Pd salt within the liquid stage without the presence of the surfactant template and with in situ reduction provided by the STEM e-beam. In the second experiment, the aqueous Pd salt was dispersed within the surfactant template before the in situ e-beam reduction, allowing a comparison of growth rates and mechanism with and without the presence of the surfactant template. The final experiment was designed to obtain insight into the nanostructure growth dynamics when Pd growth was driven by chemical reduction with ascorbate. In this case, aqueous Pd salt and the surfactant template were mixed in the liquid stage with sufficient ascorbate to reduce roughly half of the Pd salt present. The liquid stage was set aside for sufficient time (2 hr) to exhaust the ascorbate, then the sample was transferred into the STEM. This experiment did not provide real time observation of growth during chemical reduction. However, the real time observation of the motion of Pd particles caught after partial reduction did provide information about the chemical reduction dynamics.
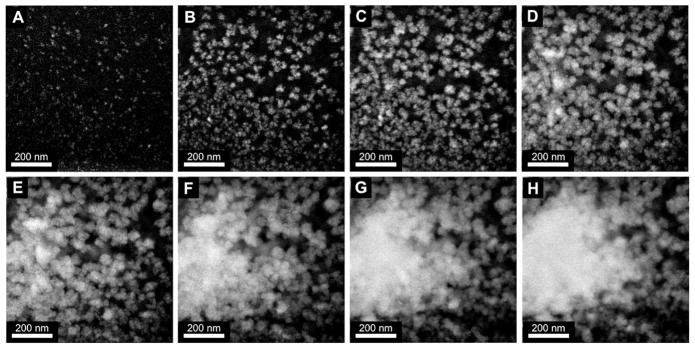
Figure 1 shows dark field (DF) STEM images over a 70 second interval of e-beam induced reduction of the pure aqueous Pd salt solution, with a 10-second interval between images (see also Supporting Movie 1). The e-beam was turned on just prior to the first image, capturing the Pd growth with no prior seed particles or prior growth in the viewed area.
Figure 1.
DF STEM images of metallic Pd growth by e-beam induced reduction of aqueous Pd-salt solution. 70-second total growth period with 10-second intervals between images. All images are at x200k magnification.
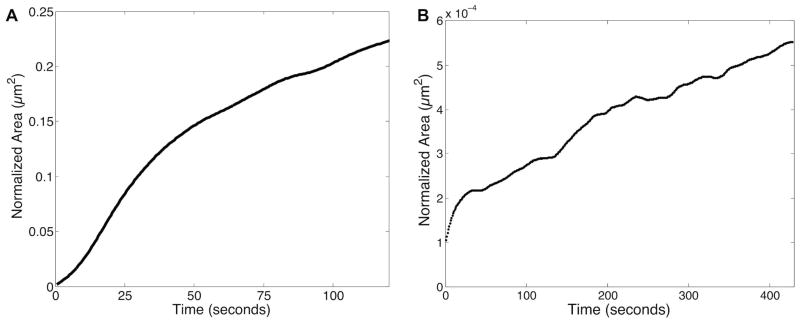
Initial growth from the aqueous Pd salt solution occurs by homogenous nucleation, where small seed particles appear throughout the entire area of illumination (figure 1A). With further reduction, nucleation of seed particles slows, while existing particles continue to grow from solution in a flower like geometry (figure 1B). As growth from solution continues by reduction of the Pd salts, nucleation stops, and growing particles begin to impinge and flocculate, forming larger, multigrained Pd particles (figure 1C–E). Flocculation continues as the particles keep growing from solution, until one large Pd particle is formed (figure 1F–H). This movie has been analyzed for growth rate, and normalized to an electron dose of 1 e−/Å2, as shown in figure 2A. Details of the Pd growth rate quantification and normalization are given in the Supporting Information. The growth curve can be broken up into three distinct sections, and closely resembles the JMAK growth model (Johnson-Mehl-Avrami-Kolmogorov).31 The growth rate (in area/second) during the second stage of growth (10–50 seconds) is ~1.3 times faster than the initial nucleation growth rate (0–10 seconds) and ~2.9 times faster than the final stage growth rate after nucleation has ceased and particles begin to overlap in the z-dimension (50–120 seconds).
Figure 2.
Normalized growth area vs. time plots for two different Pd synthesis conditions. (A) Metallic Pd growth in non-templated aqueous Pd salt solution (Figure 1, starting at Figure 1A over 120 seconds). (B) Metallic Pd growth in Pd salt/Brij 56 surfactant templated paste (Figure 3, starting at Figure 3D over 430 seconds). Area is normalized to 1 e−/Å2 dose in both plots for direct comparison.
The chemical reactions occurring during e-beam induced reduction can be very complex, as many different molecular species are generated from the interactions of the high-energy electron beam with the sample. As the electrons travel through the sample, solvent bonds are broken and highly reactive species are created. These include oxidizing species such as HO• and H2O2, and reducing species such as H•, H2 and solvated electrons. These go on to react with other species. Dissolved oxygen reacts with solvated electrons to form the reactive oxidant O2−•.32,33 Chloride in Pt salt solutions resembling our Pd salt solutions can yield Cl2−•, an oxidant.34, 35 Some electrons will undergo sufficient scattering events to become trapped within the sample as aqueous electrons, which are highly reactive reducers. The net effect of all these e-beam interactions with the Pd salt leads to its reduction to Pd metal, the same overall outcome as the chemical reduction with ascorbate used in gram-scale ex situ synthesis. However, fewer types and lower quantities of oxidizing species are present in the ascorbate reduction of the Pd salts, making the reaction less reversible: there is much less likelihood for metallic Pd to oxidize back into solution, as compared to reduction induced by e-beam interactions. Furthermore, the timescale of reduction is much faster in the e-beam experiment, so the ascorbate reduction approach stays closer to equilibrium with regard to concentration gradients of reactants and byproducts. These factors can lead to differences in Pd particle nucleation and growth rates and geometries, Pd diffusion speeds, and molecular species formed in the two different reduction mechanisms.
Heating effects from the e-beam interactions with the liquid and paste samples have been found to be negligible for all in situ imaging conditions used (ΔT < 2°C at the highest dose condition), and do not contribute to the probable differences between the reduction mechanisms. Heating calculations for the in situ imaging conditions used in this study are provided in the supporting information, and also in the supporting information of Ref. 18.
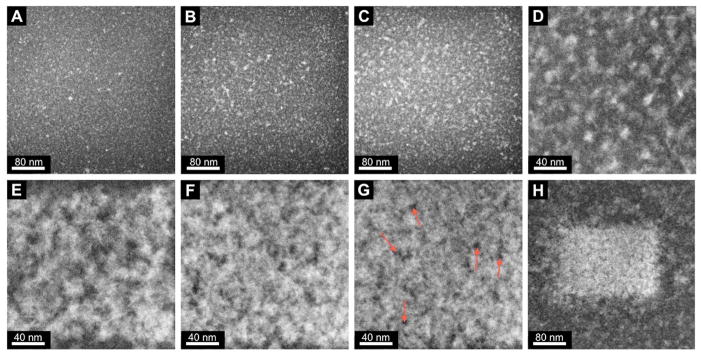
Figure 3 shows the effects of the LLC template on Pd growth as observed in the STEM liquid stage. Illustrated are the DF STEM images acquired over a 15-minute period of the Pd salt/Brij 56 templated paste (Supporting Movie 2). Once again, the beam was turned on just prior to the first image, capturing the growth process from the beginning without the presence of prior growth.
Figure 3.
DF STEM images of metallic Pd nanostructure growth by e-beam induced reduction of Pd salts within the Brij 56 organic surfactant template. 15 minute total growth period. Red arrows in G indicate areas of thinner Pd, presumably due to trapped micelles. Images A–C are at 45-second intervals, C-G are at 3-minute intervals, and G–H is at a 90-second interval. A–C and H are at x400k magnification, and D–G are at x800k magnification. The white rectangle of porous Pd in H shows the volume where growth was induced at x800k magnification.
Initial growth in the templated system proceeds in a very similar manner to the non-templated system, where homogeneous nucleation of seed particles occurs over the entire scanning area (figure 3A). After longer exposure (~45 seconds) to the scanning e-beam, nucleation begins to slow and stop while existing particles continue to grow larger in flower-like geometries by reduction of the Pd salts within the viewing area (figure 3B and C). Starting in figure 3C, the filamentous micelles of the Brij 56 surfactant (not visible here) begin to interfere with the continued growth of individual particles. As reduction progresses, particles cease to grow larger individually, presumably due to the physical constraints of the template. Instead, additional growth is manifest through the development of interparticle connections, forming a loose Pd network (figure 3D and E). As more metallic Pd is produced by reduction of the Pd salts, the Pd network becomes denser and the interparticle connections become thicker, trapping the micelles (red arrows in figure 3G) within the growing Pd nanostructure (figure 3F and G). Eventually, a Pd film is grown by the e-beam induced reduction that completely covers the scanned area (and is also limited to the scanned area, figure 3H). The Pd appears bright whereas the pores appear dark due to the Z-contrast nature of the DF STEM images. The trapped low Z-number micelles show almost no intensity (dark regions) compared to the high Z-number metallic Pd (bright regions).
The Pd salt/Brij 56 templated growth movie (Supporting Movie 2) has been analyzed for growth rate normalized to an electron dose of 1 e−/Å2, shown in figure 2B. Because (S)TEM generates 2D projections of the sample and does not have directly explicit 3D information in the images, quantification for comparison between templated and nontemplated systems has been performed using area vs. time plots (figure 2). The overall growth rate in the Brij 56 templated system (starting at figure 3D, after nucleation has ended) is ~3,500 times slower than the corresponding growth rate in the non-templated aqueous system (figure 2A, second stage growth rate as comparison of interest). This result shows that the micelle template not only limits the growth geometry of the Pd nanostructures, but also significantly limits growth kinetics and diffusion rates. However, it is recognized that e-beam interactions with the surfactant may have generated a wide variety of organic radicals that may also have altered growth kinetics.
Figures 4, 5 and 6 probe differences in growth mechanisms between electron beam induced reduction and chemical reduction of the Pd salts within the Brij 56 template. Partial chemical reduction of the Pd salt/Brij 56 paste was carried out 2 hours prior to in situ STEM imaging. For this system, growth by ascorbate reduction is given time to occur,24 but the reduction of palladium is incomplete, limited by exhaustion of ascorbate. When this system is imaged in the STEM, we are able to observe the resulting nanostructures from chemical reduction at an intermediate stage between initial nucleation and the final product of porous nanoparticles, and observe further growth of those particles induced primarily by the e-beam.
Figure 4.
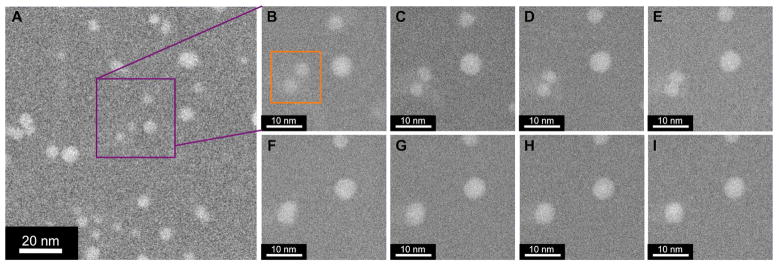
(A) DF STEM image from partially ascorbate reduced Pd salt/Brij 56 paste showing uniform distribution of 2–7 nm spherical Pd nanoparticles, x1.5M magnification. (B–I) DF STEM images of nanoparticle sintering event (enclosed in orange box in B) over 70 seconds, in 10-second intervals (same region as A, as indicated by purple square), x5M magnification.
Figure 5.
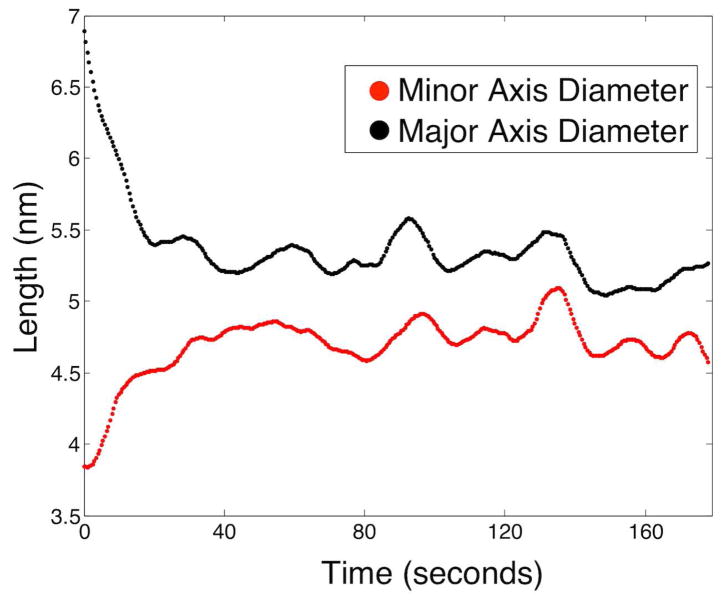
Plot of major (black) and minor (red) axis diameters over 175 seconds during Pd nanoparticle sintering event (figure 4, starting at figure 4B).
Figure 6.
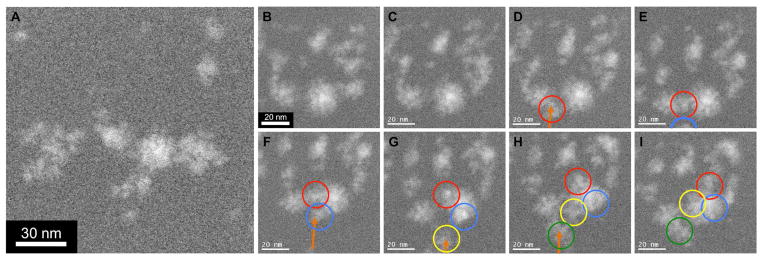
(A) DF STEM image from partially ascorbate reduced Pd salt/Brij 56 paste showing clusters and loose networks of Pd, x1.2M magnification. (B–I) DF STEM images of cluster migration and agglomeration over 160 second time period (same region as A), x2M magnification. Individual clusters are circled to track motion over time (each migrating cluster given a different color: red, blue, yellow, and green). Orange arrows indicate path of migrating clusters from outside the field of view into the viewing area. Figures B–C are separated by a 40-second interval, while C–I are separated by 20-second intervals.
Figure 4A is a DF STEM image of an early stage of growth within the partially ascorbate reduced Pd salt/Brij 56 templated sample. Here, nucleation of the small (2–7 nm), spherical, metallic Pd nanoparticles has occurred ex situ by chemical reduction prior to STEM imaging. Distribution of the particles is highly uniform and non-clustered, indicating that nucleation by ascorbate reduction is homogeneous in character.
When these metallic Pd nanoparticles are subjected to the electron beam, no detectable growth from solution occurs, possibly due to localized depletion of Pd salts. However, over continued exposure (>30 seconds) to the scanning e-beam, migration and agglomeration of nanoparticles occurred within the micelle template (Supporting Movie 3). In some cases sintering and relaxation of agglomerated particles was observed, where oblong particles rearrange into stable spherical morphologies, as shown in figure 4B–I over 70 seconds in 10-second intervals.
This process was quantitatively analyzed to determine whether the observed process is sintering and not merely rotation of an irregularly shaped particle. When agglomeration first occurs, the oblong particle has an eccentricity of ~0.85 (highly elliptical), which steadily decreases to a constant average eccentricity of ~0.4 (much more circular) after relaxation. Figure 5 plots the major (black) and minor (red) axis lengths (diameters) over the relaxation period. The major axis drops from an initial length of ~7 nm when the two particles first touch to an average value of ~5.25 nm after relaxation. In a mirrored trend, the minor axis length increases from an initial value of ~3.75 nm (approximate diameters of original particles) to an average value of ~4.75 nm. The minor axis length increases over the same time scale that major axis length decreases and plateaus at a very similar final diameter. This behavior is consistent with particle sintering by surface diffusion and inconsistent with rotation of an irregularly shaped particle. For these two nanoparticles, the relaxation time is ~35 seconds.
Figure 6A shows a region of the partially ascorbate-reduced, templated sample captured at a more advanced stage of growth, in comparison to figure 4A. At this stage of chemical reduction, larger clusters of metallic Pd (10–25 nm) have formed and there are no isolated sub-5nm particles remaining. The structure of these Pd clusters is quite similar to the interconnected network structure formed by reduction only as induced by the e-beam in the presence of Brij 56 (figure 3G), where micelles have become trapped within the structure of the growing clusters.
When the Pd clusters from figure 6A were illuminated by the scanning e-beam for more than 150 seconds, additional growth processes were observed (Supporting Movie 4). Figure 6B–I shows a series of DF STEM images of this region over a 160 second period, after the initial ~3 minute exposure to the scanning beam with no activity. Initially the various clusters move in slight fluctuations quite independently of the other clusters (figure 6B and C). Although no growth from solution is taking place, small clusters of porous Pd from adjacent areas diffuse into view and connect with the Pd clusters in the center of the view area (figure 6D–I). Orange arrows indicate the paths of the migrating Pd clusters, and colored circles highlight positions of individual clusters in each frame.
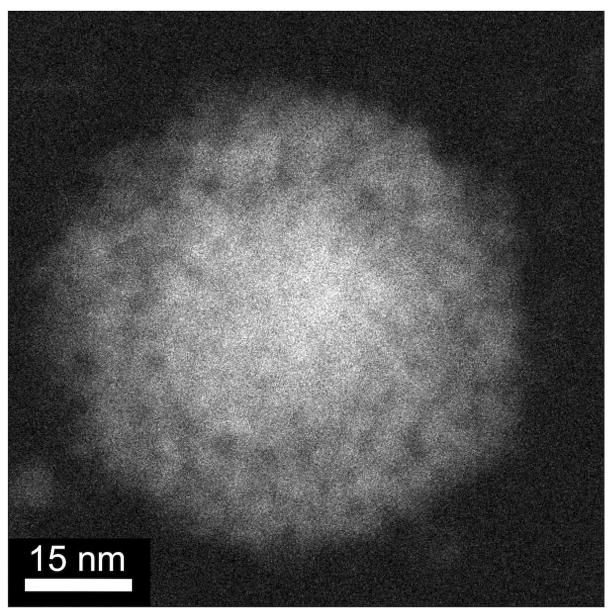
It appears that clusters above ~10 nm in diameter become highly mobile within the surfactant template (Supporting Information, Supporting Table 1). The average migration speed for 10–25 nm diameter Pd clusters in Supporting Movie 4 is ~0.6 nm/s, with some clusters traveling distances of 60 nm or more (the fastest-moving cluster, highlighted with a yellow circle in figure 6, travels at ~1.1 nm/s and is ~15–18 nm in size). Presumably, these migrating Pd clusters are large enough in mass and volume to disrupt the micelle array and diffuse with little resistance through the surfactant template (which the small spherical nanoparticles are unable to do). These migrating clusters connect with other impinging clusters, forming networks that rearrange into larger Pd nanoparticles with micelles trapped within. When Pd salt/templated samples are completely reduced by ascorbate prior to STEM imaging in the liquid stage, spherical nanoparticles with trapped micelles are observed (figure 7), which are very similar to nanoparticles grown ex situ in gram-scale batches.24
Figure 7.
DF STEM image of one spherical Pd nanoparticle with trapped micelles grown by complete ascorbate reduction in the TEM liquid stage outside of the microscope at ambient conditions, and imaged in the liquid stage at x2M magnification after reduction (~24 hours after starting chemical reduction).
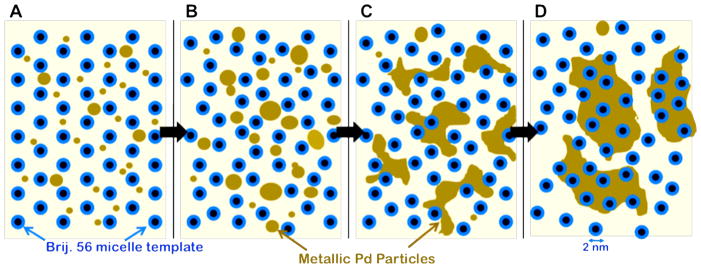
Combining the results obtained from purely e-beam induced reduction with those from partial ascorbate chemical reduction, a Pd growth model within the Brij 56 template has been created, and is shown in figure 8. In both reduction mechanisms (chemical and e-beam), homogeneous nucleation of small (~2–5 nm) spherical Pd particles occurs in the aqueous phase (figure 8A). Particles continue to grow from solution and through coalescence or sintering events until continued growth (~7–10 nm) is restricted by the size constraint of the micelle template (figure 8B). At this stage, the growing particles might begin to disrupt and disorder the micelle array. The micelle template inhibits continued spheroidal growth of the particles, and growth proceeds by the formation of interparticle connections or networks around the micelles (figure 8C). These loose Pd networks continue to grow from solution, forming dense clusters, with trapped micelles within (figure 8D). The Pd clusters are above 10 nm in diameter here, becoming more mobile within the template, which allows these clusters to aggregate and form larger Pd particles with disordered pore structures (trapped micelles).
Figure 8.
(A–D) Schematic of metallic Pd growth model within the Brij 56 micelle template based upon the results from movies 2–4. Micelle tubules, which extend out of the plane of the figure, are represented as the blue/black circles. The metallic palladium is represented as the brown regions, and the aqueous phase is the background.
Conclusion
Using a combination of electron beam induced reduction and ascorbate chemical reduction, we have observed various Pd growth stages within the Brij 56 template in a fluid stage in the TEM. Initially, small Pd particles (~2–7 nm) nucleate, agglomerate, and sinter. Motion of the small particles is restricted by the micelles, and transport of the Pd salts is slow, possibly because the micelles inhibit diffusion within the aqueous phase. However, once the small particles form clusters that reach the size of 10–15 nm, they become mobile within the template and are able to break through the micelle array, aggregate, and trap micelles in the process. This disruption of the micelle array during cluster migration and aggregation may be a contributing mechanism to pore disorder in ascorbate-reduced Pd. This could be remedied by reinforcing or crosslinking the micelles, or by inhibiting transport of growing Pd particles but not the precursors. Ultimately, the Pd clusters agglomerate and form nanoparticles with disordered pores.
More broadly, we have shown that an in situ liquid stage in the STEM can be used to directly observe the fundamental synthesis processes and help understand the transport of reactants and products and their interaction with a liquid crystal template, all at the nanoscale. This capability has implications for other fields of nanoscience where controlling the synthesis is critical for material performance, such as self assembly of block copolymers, biomineralization, and nanostructure control during the synthesis of magnetic or semiconductor materials, energy storage/generation materials, catalysts or drug delivery vehicles.
Methods
Specimen Loading
To load the Pd salt solution into the in situ liquid stage, 0.5 μL of 272 mM aqueous potassium tetrachloropalladate was dropped into the specimen cup of the holder using a micropipette. To load the mesophase Pd salt/Brij 56 paste (prepared according to24) in the in situ stage, two clean silicon nitride chips were placed on a clean lab bench (on Kimwipes), one with nitride membrane up, and the other with nitride membrane down. A small amount of Pd paste, just enough to coat the tip of a bamboo splint, was smeared onto the chip with nitride membrane facing up using a bamboo splint, being very careful not to break the fragile nitride membrane in the center of the chip. The nitride chip sandwich was then placed on a flat steel rod previously heated in a water bath to 50–60° C. After 5–10 seconds on the warm rod, the nitride chip sandwich was picked up with Teflon tweezers and quickly set into the tip region of the in situ liquid stage. The in situ stage was then loaded into the JEOL JEM-2100F/Cs STEM. For the Pd paste/ascorbate mixture (chemically reduced samples), the same loading procedure detailed above was followed, with one alteration. Before smearing the sample onto on of the silicon chips, a small amount of Pd paste and ascorbate were mixed together using two bamboo splints (2:1 ratio for partially reduced sample and 1:1.25 for completely reduced sample). This Pd paste/ascorbate mixture was then smeared on the nitride chip, sandwiched, heated and enclosed in the tip of the liquid stage. After waiting two hours, the stage was loaded into the JEOL 2100F.
Microscope
All in situ characterization was performed on a Cs-corrected JEOL JEM-2100F running GATAN DigitalMicrograph in STEM mode. The corrector was aligned using a PtIr standard sample to obtain atomic resolution, giving a STEM probe that was below 2.3 angstrom. The microscope was operated at 200kV, acquiring 512 × 512 pixel images with a 3 μs dwell time, using an average current density of 50 pA. Both bright field and high angle annular dark field detectors were used simultaneously. All movies were acquired at the corners of the nitride windows, where minimal window bulging occurs and sample thickness is expected to be similar to spacer height (100 – 200 nm). The screen capture software CamStudio was used to acquire live video of the DigitalMicrograph scanning images using a capture rate of 1 or 2 frames per second. All STEM images presented (with exception of figure 7, which is a 1024 × 1024 acquired image with 10 μsecond dwell time) are screen shots from the CamStudio movies. The full movie files are available online at http://pubs.acs.org (Supporting Movies 1–4). All image analysis and quantification has been performed using MATLAB routines on the unedited .avi movie files generated by CamStudio.
For supporting movies 1 and 2, the area of interest was found by searching at low magnification (x20k) near the corners of the windows until we found regions where particle nucleation and growth occurred. The growing structures or particles were focused, and the magnification was increased to the desired magnification for acquiring the movies to adequately resolve the particles and the structure morphology (x200k for supporting movie 1 and x400k for supporting movie 2). The beam was then turned off, and the specimen was moved (blindly) far enough (~1–3 μm) so that when the beam was turned on, the scan area had not previously been illuminated by the e-beam. This was repeated until the sample was moved an appropriate distance with the beam off so that the area had no prior e-beam illumination, and the nucleating particles were already in focus. Minor adjustments to focus were made while acquiring the movies as needed.
For supporting movies 3 and 4 (different areas within the same sample), the area of interest was found by searching at low magnification (x20k – x50k) first, then at slightly higher magnification (x100k – x500k). In both movies, the area of interest was chosen due to the particular size, distribution, and morphology of the particles found in that region of the sample while searching. The focus was adjusted once the area of interest was found and was tuned further during video acquisition at higher magnification.
Supplementary Material
Acknowledgments
This research was funded in part by: the Presidential Early Career Award for Scientists and Engineers for I. Arslan, the NIH from grant number 5RC1GM091755, the UC Academic Senate and UC Laboratory fee research grant, and the Laboratory-Directed Research and Development program at Sandia National Laboratories, a multi-program laboratory managed and operated by Sandia Corporation, a wholly owned subsidiary of Lockheed Martin Corporation, for the U.S. Department of Energy’s National Nuclear Security Administration under contract DE-AC04-94AL85000. The Pacific Northwest National Laboratory is operated by Battelle for the U.S. Department of Energy under contract DE-AC05-76RL01830.
Footnotes
Supporting Information Available: Supporting movie files, supporting movie captions, electron diffraction data, data analysis and quantification details of the raw Pd growth movies, and e-beam heating effect calculations. This material is available free of charge via the Internet at http://pubs.acs.org.
References
- 1.Gogotsi Y, Chmiola J, Yushin G, Portet C, Simon P, Taberna PL. Anomalous Increase in Carbon Capacitance at Pore Sizes Less Than 1 Nanometer. Science. 2006;313:1760–1763. doi: 10.1126/science.1132195. [DOI] [PubMed] [Google Scholar]
- 2.Wiesner U, Lee J, Orilall MC, Warren SC, Kamperman M, Disalvo FJ. Direct Access to Thermally Stable and Highly Crystalline Mesoporous Transition-Metal Oxides with Uniform Pores. Nat Mater. 2008;7:222–228. doi: 10.1038/nmat2111. [DOI] [PubMed] [Google Scholar]
- 3.Ryoo R, Joo SH, Choi SJ, Oh I, Kwak J, Liu Z, Terasaki O. Ordered Nanoporous Arrays of Carbon Supporting High Dispersions of Platinum Nanoparticles. Nature. 2001;412:169–172. doi: 10.1038/35084046. [DOI] [PubMed] [Google Scholar]
- 4.Kim K, Seo JS, Whang D, Lee H, Jun SI, Oh J, Jeon YJ. A Homochiral Metal-Organic Porous Material for Enantioselective Separation and Catalysis. Nature. 2000;404:982–986. doi: 10.1038/35010088. [DOI] [PubMed] [Google Scholar]
- 5.Peng XG, Manna L, Yang WD, Wickham J, Scher E, Kadavanich A, Alivisatos AP. Shape Control of CdSe Nanocrystals. Nature. 2000;404:59–61. doi: 10.1038/35003535. [DOI] [PubMed] [Google Scholar]
- 6.Puntes VF, Krishnan KM, Alivisatos AP. Colloidal Nanocrystal Shape and Size Control: The Case of Cobalt. Science. 2001;291:2115–2117. doi: 10.1126/science.1057553. [DOI] [PubMed] [Google Scholar]
- 7.Komiyama M, Asanuma H, Hishiya T. Tailor-Made Receptors by Molecular Imprinting. Adv Mater. 2000;12:1019–1030. [Google Scholar]
- 8.Gupta AK, Gupta M. Synthesis and Surface Engineering of Iron Oxide Nanoparticles for Biomedical Applications. Biomaterials. 2005;26:3995–4021. doi: 10.1016/j.biomaterials.2004.10.012. [DOI] [PubMed] [Google Scholar]
- 9.Helveg S, Lopez-Cartes C, Sehested J, Hansen PL, Clausen BS, Rostrup-Nielsen JR, Abild-Pedersen F, Norskov JK. Atomic-Scale Imaging of Carbon Nanofibre Growth. Nature. 2004;427:426–429. doi: 10.1038/nature02278. [DOI] [PubMed] [Google Scholar]
- 10.Grunwaldt JD, Molenbroek AM, Topsoe NY, Topsoe H, Clausen BS. In Situ Investigations of Structural Changes in Cu/ZnO Catalysts. J Catal. 2000;194:452–460. [Google Scholar]
- 11.Creemer JF, Helveg S, Hoveling GH, Ullmann S, Molenbroek AM, Sarro PM, Zandbergen HW. Atomic-Scale Electron Microscopy at Ambient Pressure. Ultramicroscopy. 2008;108:993–998. doi: 10.1016/j.ultramic.2008.04.014. [DOI] [PubMed] [Google Scholar]
- 12.Ross FM, Williamson MJ, Tromp RM, Vereecken PM, Hull R. Dynamic Microscopy of Nanoscale Cluster Growth at the Solid-Liquid Interface. Nat Mater. 2003;2:532–536. doi: 10.1038/nmat944. [DOI] [PubMed] [Google Scholar]
- 13.Ross FM, Radisic A, Searson PC. In Situ Study of the Growth Kinetics of Individual Island Electrodeposition of Copper. J Phys Chem B. 2006;110:7862–7868. doi: 10.1021/jp057549a. [DOI] [PubMed] [Google Scholar]
- 14.Radisic A, Vereecken PM, Hannon JB, Searson PC, Ross FM. Quantifying Electrochemical Nucleation and Growth of Nanoscale Clusters Using Real-Time Kinetic Data. Nano Lett. 2006;6:238–242. doi: 10.1021/nl052175i. [DOI] [PubMed] [Google Scholar]
- 15.Searson PC, Radisic A, Vereecken PM, Ross FM. The Morphology and Nucleation Kinetics of Copper Islands During Electrodeposition. Surf Sci. 2006;600:1817–1826. [Google Scholar]
- 16.de Jonge N, Poirier-Demers N, Demers H, Peckys DB, Drouin D. Nanometer-Resolution Electron Microscopy Through Micrometers-Thick Water Layers. Ultramicroscopy. 2010;110:1114–1119. doi: 10.1016/j.ultramic.2010.04.001. [DOI] [PMC free article] [PubMed] [Google Scholar]
- 17.Grogan JM, Rotkina L, Bau HH. In Situ Liquid-Cell Electron Microscopy of Colloid Aggregation and Growth Dynamics. Phys Rev E. 2011;83 doi: 10.1103/PhysRevE.83.061405. [DOI] [PubMed] [Google Scholar]
- 18.Alivisatos AP, Zheng HM, Claridge SA, Minor AM, Dahmen U. Nanocrystal Diffusion in a Liquid Thin Film Observed by in Situ Transmission Electron Microscopy. Nano Lett. 2009;9:2460–2465. doi: 10.1021/nl9012369. [DOI] [PubMed] [Google Scholar]
- 19.Evans JE, Jungjohann KL, Browning ND, Arslan I. Controlled Growth of Nanoparticles from Solution with In Situ Liquid Transmission Electron Microscopy. Nano Lett. 2011;11:2809–2813. doi: 10.1021/nl201166k. [DOI] [PMC free article] [PubMed] [Google Scholar]
- 20.Dahmen U, Zheng HM, Smith RK, Jun YW, Kisielowski C, Alivisatos AP. Observation of Single Colloidal Platinum Nanocrystal Growth Trajectories. Science. 2009;324:1309–1312. doi: 10.1126/science.1172104. [DOI] [PubMed] [Google Scholar]
- 21.Peckys DB, Veith GM, Joy DC, de Jonge N. Nanoscale Imaging of Whole Cells Using a Liquid Enclosure and a Scanning Transmission Electron Microscope. Plos One. 2009;4 doi: 10.1371/journal.pone.0008214. [DOI] [PMC free article] [PubMed] [Google Scholar]
- 22.de Jonge N, Peckys DB. Visualizing Gold Nanoparticle Uptake in Live Cells with Liquid Scanning Transmission Electron Microscopy. Nano Lett. 2011;11:1733–1738. doi: 10.1021/nl200285r. [DOI] [PMC free article] [PubMed] [Google Scholar]
- 23.de Jonge N, Dukes MJ, Peckys DB. Correlative Fluorescence Microscopy and Scanning Transmission Electron Microscopy of Quantum-Dot-Labeled Proteins in Whole Cells in Liquid. ACS Nano. 2010;4:4110–4116. doi: 10.1021/nn1010232. [DOI] [PMC free article] [PubMed] [Google Scholar]
- 24.Robinson DB, Fares SJ, Ong MD, Arslan I, Langham ME, Tran KL, Clift WM. Scalable Synthesis of Nanoporous Palladium Powders. Int J Hydrogen Energ. 2009;34:5585–5591. [Google Scholar]
- 25.Arslan I, Klein MP, Jacobs BW, Ong MD, Fares SJ, Robinson DB, Stavila V, Wagner GJ. Three-Dimensional Pore Evolution of Nanoporous Metal Particles for Energy Storage. J Am Chem Soc. 2011;133:9144–9147. doi: 10.1021/ja200561w. [DOI] [PubMed] [Google Scholar]
- 26.Attard GS, Bartlett PN, Coleman NRB, Elliott JM, Owen JR, Wang JH. Mesoporous Platinum Films from Lyotropic Liquid Crystalline Phases. Science. 1997;278:838–840. [Google Scholar]
- 27.Schacht S, Huo Q, VoigtMartin IG, Stucky GD, Schuth F. Oil-Water Interface Templating of Mesoporous Macroscale Structures. Science. 1996;273:768–771. doi: 10.1126/science.273.5276.768. [DOI] [PubMed] [Google Scholar]
- 28.Brinker CJ, Lu YF, Fan HY, Stump A, Ward TL, Rieker T. Aerosol-Assisted Self-Assembly of Mesostructured Spherical Nanoparticles. Nature. 1999;398:223–226. [Google Scholar]
- 29.Braun PV, Osenar P, Stupp SI. Semiconducting Superlattices Templated by Molecular Assemblies. Nature. 1996;380:325–328. [Google Scholar]
- 30.Robinson DB, Langham ME, Fares SJ, Ong MD, Jacobs BW, Clift WM, Murton JK, Hjelm RP, Kent MS. Thermally Stable Nanoporous Palladium Alloy Powders by Hydrogen Reduction in Surfactant Templates. Int J Hydrogen Energ. 2010;35:5423–5433. [Google Scholar]
- 31.Starink MJ. Kinetic Equations for Diffusion-Controlled Precipitation Reactions. J Mater Sci. 1997;32:4061–4070. [Google Scholar]
- 32.LaVerne JA. OH Radicals and Oxidizing Products in the Gamma Radiolysis of Water. Radiat Res. 2000;153:196–200. doi: 10.1667/0033-7587(2000)153[0196:oraopi]2.0.co;2. [DOI] [PubMed] [Google Scholar]
- 33.Watanabe R, Saito K. Monte Carlo Simulation of Water Radiolysis in Oxygenated Condition for Monoenergetic Electrons from 100 eV to 1 MeV. Radiat Phys Chem. 2001;62:217–228. [Google Scholar]
- 34.Delcourt MO, Belloni J, Saito E. Spectrophotometric Studies of Radiolysis of Liquid-Ammonia. J Phys Chem-Us. 1976;80:1101–1105. [Google Scholar]
- 35.Khan HM, Waltz WL, Woods RJ. A Pulse-Radiolysis Study of Tetraammineplatinum(Ii) Complex Ion in Aqueous Chloride Media. Radiat Phys Chem. 1986;27:41–45. [Google Scholar]
Associated Data
This section collects any data citations, data availability statements, or supplementary materials included in this article.


