

Abstract
Experiences within one’s social environment shape neural sensitivity to threatening and rewarding social cues. However, in racialized societies like the USA, youth from minoritized racial/ethnic backgrounds can have different experiences and perceptions within neighborhoods that share similar characteristics. The current study examined how neighborhood disadvantage intersects with racial/ethnic background in relation to neural sensitivity to social cues. A racially diverse (59 Hispanic/Latine, 48 White, 37 Black/African American, 15 multi-racial and 6 other) and primarily low to middle socioeconomic status sample of 165 adolescents (88 female; Mage = 12.89) completed a social incentive delay task while undergoing functional magnetic resonance imaging (fMRI) scanning. We tested for differences in the association between neighborhood disadvantage and neural responses to social threat and reward cues across racial/ethnic groups. For threat processing, compared to White youth, neighborhood disadvantage was related to greater neural activation in regions involved in salience detection (e.g. anterior cingulate cortex) for Black youth and regions involved in mentalizing (e.g. temporoparietal junction) for Latine youth. For reward processing, neighborhood disadvantage was related to greater brain activation in reward, salience and mentalizing regions for Black youth only. This study offers a novel exploration of diversity within adolescent neural development and important insights into our understanding of how social environments may ‘get under the skull’ differentially across racial/ethnic groups.
Keywords: neighborhood, race/ethnicity, social threat and reward, brain, adolescence
A growing body of neuroimaging research underscores that the social environment, including neighborhood quality and socioeconomic status (SES), can tune the brain toward salient social information (Hao and Farah, 2020; Muscatell, 2018; Varnum and Kitayama, 2017), such as social rewards and threats. Indeed, individuals who grow up in disadvantaged social environments show altered neural sensitivity toward social threat (Gonzalez et al., 2015; Javanbakht et al., 2015) and monetary rewards (Gonzalez et al., 2016; Mullins et al., 2020). These patterns are assumed to be applicable across all individuals, or in other words, that all youth raised in lower-quality neighborhoods or lower SES households are likely to develop these neural patterns. However, in racialized societies such as the USA, one’s racial/ethnic background plays a powerful role in how one experiences their social environment (Alegría et al., 2014). Not only are minoritized racial/ethnic groups more likely to live in systemically disadvantaged neighborhoods (e.g. segregation, lack of access to parks/green spaces and food deserts; Walker et al., 2010; Wen et al., 2013), they may also have different social experiences within similar environments (e.g. experiencing discrimination). Given the importance of race in the daily lives of US adolescents (Bañales et al., 2021), neighborhood disadvantage may have a larger influence in shaping neural sensitivity to social threat and reward in minoritized adolescents compared to White peers. There is a great need for developmental neuroscience not only to utilize diverse samples, but also to examine diversity within those samples (see Qu et al., 2021). Thus, the purpose of the current study is to examine how neighborhood disadvantage interacts with racial/ethnic background in shaping neural processing of social threats and rewards in US adolescents.
It is important to note that race is a socially constructed label that has a strong impact on development, but has no biological or neural basis. Thus, in the present work we are not testing racial/ethnic differences in neural activation, but rather how one social experience (i.e. neighborhood disadvantage) interacts with another social experience (i.e. racial/ethnic background) to shape neural activation toward social threats and rewards. Furthermore, we compare Black and Latine youth to White youth in the current work in an effort to contrast the impact of neighborhood disadvantage on societally marginalized groups (i.e. Black and Latine) compared to the dominant racial group (White). This is not intended to treat neural activation in White youth as ‘normative’ or to apply any value labels to any racial/ethnic group (e.g. healthy, adaptive and risk factor). Rather, White is used as a comparison here to indicate an absence of experiences of systemic and interpersonal racism.
Neighborhoods and sensitivity to social threats and rewards
Neighborhoods have a clear and well-established influence on children and adolescents’ social, emotional and behavioral development (Leventhal, 2018). Youth in disadvantaged neighborhoods often experience more chronic stress, more threats to their safety, less predictability and less control over their circumstances (Dupéré et al., 2012), and as such, face more struggles with mental health and sense of self-efficacy (Leventhal et al., 2009; Dupéré et al., 2012). Furthermore, there is mounting evidence that neighborhood disadvantage gets under the skin and influences biology. Research has identified associations between neighborhood disadvantage and stress physiology in both baseline cortisol levels (Rudolph et al., 2014) and cortisol reactivity during a social stress task in adolescents (Hackman et al., 2012), as well as with faster cardiometabolic aging throughout young adulthood (Lei et al., 2018). Thus, neighborhoods play a critical role in shaping important psychological and physiological outcomes for youth.
Research has also begun to investigate how neighborhood disadvantage impacts neural processing of social threats and rewards. Two studies using a mostly overlapping sample examined how neighborhood disadvantage in adolescence relates longitudinally to neural processing during threat tasks. During a social exclusion task, adults who lived in disadvantaged neighborhoods in their youth showed higher brain activation in the dorsal anterior cingulate cortex (dACC) and dorsomedial prefrontal cortex (dmPFC; Gonzalez et al., 2015), brain regions that support social vigilance, threat monitoring, regulatory effort and mentalizing, among other processes. During a physical threat task, participants were offered social support from a stranger and a friend (Coan et al., 2013). For adults from more advantaged backgrounds, brain activation was lower in the superior frontal gyrus, supplementary motor cortex, insula, putamen and thalamus when threat was experienced in the presence of a friend compared to a stranger. For those from disadvantaged backgrounds, however, the opposite was found, such that brain activation in these same regions was lower when threat was experienced with a stranger compared to a friend. Although the full meaning of these results and the underlying cognitive processes are unclear, these findings suggest that early life neighborhood disadvantage does relate to neural processing of threat in adulthood and that the calibration of threat detection may vary by social conditions and type of social stimuli.
Other work has begun to examine the influence of neighborhoods on neural activity among youth. Along these lines, one study showed that neighborhood disadvantage in childhood related to greater amygdala activity in response to neutral faces in adolescence and young adulthood. These data suggest that there may be a negativity bias leading those who grew up in disadvantaged neighborhoods to perceive socially ambiguous cues as more threatening and/or salient (Gard et al., 2021). Together, this one study in youth and two prior studies in adults offer initial evidence that neighborhood disadvantage relates to brain activation in regions associated with greater attunement to threats and more neural regulatory effort.
Regarding neighborhood disadvantage and reward processing, the evidence is less clear, as the only two known studies on this topic used monetary reward tasks and show conflicting findings. In one study, neighborhood disadvantage was related to blunted activation in the dorsal and ventral striatum during reward anticipation in children (Mullins et al., 2020). In a second study, individuals who experienced neighborhood disadvantage during adolescence showed greater neural sensitivity to rewards in the ventral striatum as adults (Gonzalez et al., 2016). Given these conflicting findings, it is difficult to draw conclusions based on these two studies alone, but they do offer initial evidence that neighborhood disadvantage may be associated with neural processing of rewards.
Together, existing research suggests that neighborhood disadvantage relates to neural processing of both threats and rewards, but several important questions remain open. First, most previous studies did not use social cues, which may be especially relevant for research in adolescence, a developmental period when the social context becomes more important (Blakemore and Mills, 2014). Second, prior research has assessed neighborhood disadvantage differently. Some utilized a census-based measure of neighborhood disadvantage reflective of the average SES of the neighborhood (Mullins et al., 2020; Gard et al., 2021), which tells less about the social experiences within a neighborhood and is often considered to be a measure of SES rather than neighborhood environment (Farah, 2017). Other research utilized a parent-report measure more focused on social experiences within the neighborhood, such as connectedness, crime/deterioration and risk (Coan et al., 2013; Gonzalez et al., 2015, 2016). It is unclear how measurement of neighborhood might shape findings, but recent evidence suggests that measurement does indeed matter. A study of children and adolescents found that a census-based measure of disadvantage related to greater amygdala reactivity to social threat only when their neighborhood was subjectively rated as less secure (Suarez et al., 2022). Due to the small body of research connecting neighborhood environments to brain activity and differences in measurement of neighborhood environments in past work, we first sought to examine the associations between neighborhood disadvantage and neural responses to threat and reward, regardless of race. However, given that nearly all prior studies have been done at the group level with little exploration of additional layers of social experience that may interact with the neighborhood context, we critically examine if the associations between neighborhood disadvantage and neural activity are generalizable across groups or if there are between-group differences that may vary based on race/ethnicity.
Race/ethnicity and neighborhood experiences
It is important to examine potential racial/ethnic differences in how the neighborhood context is associated with neural sensitivity to social threat and reward. We stress that any differences across racial/ethnic background are not due to inherent biological differences, but can be thought of in terms of environmental affordances (Evans et al., 1993). This refers to the extent that a given environment offers individuals or groups control over their environment, such as autonomy and opportunity, or constraint and limitation. It is well documented that certain racial/ethnic groups are minoritized by societal systems that keep them in lower social positions with fewer resources and opportunities, such as being segregated into disadvantaged neighborhoods and having limited access to healthcare, education, housing and upward economic mobility (Alegría et al., 2014; Buchanan et al., 2021). Additionally, from an early age, minoritized individuals receive implicit and explicit messages about their race from parents, schools and the media, making them more aware of historical and current injustices and stereotypes (Hughes et al., 2006; Rowley et al., 2014; Bañales et al., 2021). Furthermore, minoritized individuals are more likely to experience or witness racial discrimination. These social experiences of structural and interpersonal racism may be additional physical and psychosocial stressors that influence minoritized groups differently than dominant groups, even when living in similar neighborhood conditions (see Evans and English, 2002; Evans and Kim, 2013). Furthermore, economic and social resources typically relate to improved mental and physical health, but this is not found in Black men and adolescents, showing that equal resources do not always result in equal benefits (Assari, 2018; Assari and Caldwell, 2018; Assari et al., 2018). Thus, living in a more advantaged neighborhood may not confer the same benefits to all people and may depend on their experiences within that neighborhood.
Not only are minoritized youth more likely to live in disadvantaged neighborhoods than White youth (Alegría et al., 2014), but they are also differentially influenced by the neighborhood context for outcomes such as mental health (Hull et al., 2008; Alegría et al., 2014). For example, Black adults living in more affluent neighborhoods are still at higher risk for depression compared to White adults living in similar neighborhoods (Alegría et al., 2014). Furthermore, the protective effect of youth community involvement in disadvantaged neighborhoods varies across racial/ethnic groups (Hull et al., 2008). Together, this suggests that neighborhood environments may have different effects for minoritized youth compared to White youth. There has been little exploration of whether racial/ethnic group membership might moderate the effect of the social environment on neural sensitivity to threats and rewards; however, there is some initial evidence for this possibility. One study found that neighborhood disadvantage is negatively associated with amygdala response to threat cues, but only for African American participants and not for European American participants (Gard et al., 2017, Supplementary Figure S2). This finding offers initial evidence that racial/ethnic groups may experience and process neighborhood disadvantage differently, which impacts how the brain responds to threat.
Developmental timing
Adolescence is a time during which individuals become particularly sensitive to sociocultural influences (Blakemore and Mills, 2014). During adolescence, the brain undergoes rapid changes in neural circuitry involved in socio-affective and socio-cognitive processing, making adolescents particularly sensitive to their social environment (Crone and Dahl, 2012; Blakemore and Mills, 2014; Nelson et al., 2016). Concurrent with these neural changes, adolescents spend more time navigating their social worlds independently, becoming more aware of and thus more heavily influenced by their social context (Leventhal, 2018). A considerable amount of research has shown that the effects of socioeconomic disadvantage on emotion, cognition and mental and physical health are present in childhood and adolescence (Quon and McGrath, 2014; Heberle and Carter, 2015; Russell and Odgers, 2020). Furthermore, racially minoritized youth become more likely to personally experience racial discrimination, witness instances of discrimination and receive and understand broader societal messages about race and inequality, making adolescence a time of significant development in racial/ethnic identity and critical awareness (Anyiwo et al., 2018). Together, these findings highlight the importance of studying the influence of social context on neural social processing during adolescence.
Current study
The purpose of the current study was to investigate how youth in neighborhoods characterized by higher levels of threats and fewer opportunities for rewards anticipate social threats and rewards. Research on the association between neighborhood environments and brain functioning in adolescence is still limited; therefore, we first explore this association across our whole sample. However, it is also important to explore how these processes may differ across racial/ethnic groups who may experience neighborhood disadvantages differently. To address this, a diverse sample of adolescents completed an fMRI scan during which they anticipated potential social threats and rewards from age-matched peers. Neighborhood disadvantage was measured via parent report, including exposure to violence, presence of homelessness, drug use and social support. Importantly, we controlled for objective measures of SES (i.e. parental education and income, economic strain and census-based information), which allowed us to test the unique role that the neighborhood environment plays above and beyond SES. We used a whole-brain, multiple regression approach to identify brain regions where activation toward social threats and rewards was differentially correlated with neighborhood disadvantage, and compared these across three racial/ethnic groups (i.e. Black/African American, Hispanic/Latine and White/European American). Although we took an exploratory whole-brain approach, we expected that Black and Latine youth in disadvantaged neighborhoods would show greater sensitivity to social threats and rewards compared to White youth and that these differences would be evident in greater activation in brain regions associated with threat monitoring (e.g. amygdala), salience detection (e.g. dACC and insula) and reward processing (e.g. ventral striatum).
Method
Participants
Participants were recruited from a larger study of 873 students in 6th and 7th grades in a small, diverse, rural community in the southeast USA. Participants from the larger study indicated interest in being contacted for a future fMRI study. Interested participants were then called and screened on the phone for eligibility (i.e. MRI contraindications) and recruited for the fMRI study within the same academic year as the larger study. Of the original 178 participants recruited into the neuroimaging sub-study, six were excluded from analyses due to not completing the scan, two for excessive motion (>2 mm across >10% of volumes), two for technical errors, one for an artifact, one for an incidental finding and one for missing data on SES variables, leading to a total sample of 165 adolescents in the present analysis (88 female) aged 11–14 years (Mage = 12.89, s.d. = 0.56). Adolescents were from diverse racial/ethnic backgrounds (59 Hispanic/Latine, 48 White, 37 Black/African American, 15 multi-racial and 6 other) and from low to middle SES families (see Table 1 for socioeconomic and demographic information). For racial/ethnic labels used in this study, teens self-identified by checking boxes with specific labels and had the chance to type in their own responses. Additionally, between 66.7% and 72.1% of students in these schools were classified as economically disadvantaged based on school reports (North Carolina School Report Cards, 2017), and 69.5% of students in the district were eligible for free or reduced-price lunch based on district reports. Teens and parents gave written assent/consent to participate according to the university’s Institutional Review Board. The majority of parents were adolescent’s biological mothers (82%), but also included biological fathers (10%), other maternal figures (i.e. aunt and grandmother; 6%) and other paternal figures (i.e. stepfather and grandfather; 2%). Thirty-two parents completed all questionnaires in Spanish, which were translated and back translated by paid bilingual translators. All adolescent participants were proficient in and completed all materials in English. Data collection took place from December 2016 to May 2018.
Table 1.
Demographic and socioeconomic characteristics of sample
| Variable | N (percentage of sample) |
|---|---|
| Annual family income | |
| $0–$29 999 | 51 (31%) |
| $30–$59 999 | 55 (33%) |
| $60–$99 999 | 40 (24%) |
| $100 000+ | 16 (10%) |
| Primary caregiver education | |
| Less than high school | 43 (26%) |
| High school diploma | 25 (15%) |
| Some college | 48 (29%) |
| College degree | 37 (22%) |
| Graduate school and beyond | 12 (7%) |
| Secondary caregiver education | |
| Less than high school | 49 (29%) |
| High school diploma | 39 (23%) |
| Some college | 22 (13%) |
| College degree | 25 (15%) |
| Graduate school and beyond | 9 (5%) |
| Household structure | |
| Living with both biological parents | 80 (48%) |
| Biological mother only | 40 (24%) |
| Biological mother and stepfather | 33 (20%) |
| Biological father | 5 (3%) |
| Biological father and stepmother | 2 (1%) |
| Other (extended family, joint custody, etc.) | 5 (3%) |
| Number of siblings at home | |
| 0 | 19 (11%) |
| 1 | 49 (29%) |
| 2–3 | 76 (46%) |
| 4+ | 19 (12%) |
| Parental marital status | |
| Married, first marriage | 71 (43%) |
| Remarried | 25 (15%) |
| Single | 26 (15%) |
| Divorced/separated | 21 (13%) |
| Living with significant other | 16 (10%) |
| Widowed | 5 (3%) |
Note. Totals that do not add up to 100% indicate missing data for that variable. Some response categories were collapsed for parsimony.
Measures
At the time of the scan, parents of adolescents completed self-report measures of neighborhood disadvantage and SES. In addition, we obtained an objective measure of area disadvantage from census data. Scores presented here are in their original scales but all measures were z-scored for analyses.
Neighborhood disadvantage
Neighborhood disadvantage was assessed via parent report (Crum et al., 1996), similar to other studies (Coan et al., 2013; Gonzalez et al., 2016). The scale included 15 yes or no questions [e.g. ‘I see people using or selling drugs in my neighborhood’, ‘In my neighborhood there are a lot of poor people who don’t have enough money for food and basic needs’ and ‘I feel safe when I walk around my neighborhood by myself’ (reverse scored); α = 0.81], which were coded as yes = 1 and no = 0 and summed so that higher scores indicated greater disadvantage. Scores in the current sample ranged from 0 to 11 (M = 2.01, s.d. = 2.14). A full list of items and frequencies is included in the supplementary materials section, Supplementary Table S1.
Socioeconomic status
All analyses controlled for three measures of SES. First, we created a standardized score based on parental education (both primary and secondary caregiver when available) on a 1- (‘less than 8th grade’) to 10- (‘professional degree [MD, PhD, etc.]’) point scale and family’s total annual income from the previous year on a 1- (‘$0-14 999’) to 10- (‘$150 000+’) point scale. Second, parents reported on economic hardship over the past 3 months (Conger et al., 2002), including seven questions about their ability to afford life necessities (food, housing, medical care, etc.) on a 1- (‘not at all true for me’) to 4- (‘very true for me’) point scale (reverse coded), one question about difficulty paying bills on a 1- (‘no difficulty at all’) to 4- (‘a great deal of difficulty’) point scale and one question about having money left over at the end of the month on a 1- (‘with more than enough money left over’) to 4- (‘very short of money’) point scale. The nine items were averaged, with higher scores indicating greater economic hardship (α = 0.93). Lastly, participants’ residential addresses were used to derive an objective score on the Area Deprivation Index (ADI; University of Wisconsin School of Medicine and Public Health, 2018) based on US Census data. The index is derived from information on income, education, employment and housing quality for each census block. Scores on the ADI represent a percentile of deprivation relative to the entire US population, with 1 indicating the most advantaged (top 1% of the USA) and 100 indicating the highest level of deprivation in the USA.
Social incentive delay task
Participants completed the Social Incentive Delay Task (Cremers et al., 2015) while undergoing fMRI to measure neural responses to anticipating social rewards and threats (see Figure 1). Each trial began with a cue (i.e. a shape) that signaled whether the upcoming image was a potential reward (i.e. happy face), threat (i.e. angry face) or neutral (i.e. blurred face). Participants completed two rounds of the task, totaling 116 trials (48 reward, 48 threat and 20 neutral). In order to make the task motivationally salient, we used age-matched, racially diverse adolescent faces taken from the National Institute of Mental Health Child Emotional Faces Picture Set (Egger et al., 2011). A full description of the task can be found in the supplementary materials section.
Fig. 1.
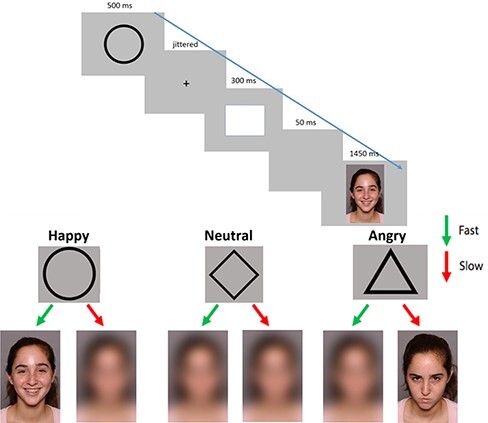
Social incentive delay task. Each trial consists of an anticipation cue (circle, diamond or triangle), a jittered crosshair delay, a target (white square) signaling participants to press a button and feedback (e.g. reward/threat). Each cue and corresponding feedback depicted in the lower panel of the figure.
fMRI data acquisition and preprocessing
A full description of fMRI data acquisition and preprocessing parameters can be found in the supplementary materials.
fMRI data analysis
Individual-level, fixed-effects analyses were estimated using the general linear model convolved with a canonical hemodynamic response function in SPM12. A full description of task modeling can be found in the supplementary materials. The primary contrasts of interest for this study were the anticipation of threat vs neutral and anticipation of reward vs neutral. Focusing on anticipation rather than receipt is most common among similar incentive delay tasks (Cremers et al., 2015) and reflects a motivational state of avoidance or approach rather than disliking or liking (Hao and Farah, 2020). We employed a whole-brain analysis for the threat vs neutral and reward vs neutral anticipation contrasts, using multiple regression analyses in which brain activity for these contrasts was regressed onto the variables of interest (i.e. neighborhood disadvantage and race/ethnicity), controlling for the SES variables (all variables z-scored). We ran three regression analyses: one for the main effect of neighborhood disadvantage across the whole sample, one for the interaction of neighborhood and race/ethnicity comparing Black and White youth and one for the interaction of neighborhood and race/ethnicity comparing Latine and White youth. Although all adolescents were included in this model, we focused on the contrasts for Black vs White and Latine vs White. To correct for multiple comparisons, we ran Monte Carlo simulations using 3dClustSim in the AFNI software package (updated version April 2017; Ward, 2000). We submitted the residuals generated from the random-effects, individual-level analysis to the 3dFWHMx program to calculate the spatial group smoothness, assuming an autocorrelation function (–acf). Based on these simulations, we determined that to achieve a corrected threshold of P < 0.005, a cluster extent of 141 voxels was needed for the regressions of neighborhood disadvantage onto threat vs neutral anticipation and reward vs neutral anticipation. Whole-brain analyses for each contrast are available on Neurovault (Gorgolewski et al., 2015; https://neurovault.org/collections/LKQWGFEW/).
Results
Descriptives
Means, ranges and correlations among all study variables are presented in Table 2. The individual SES indicators are moderately correlated in the expected direction. As shown in Table 3, results from a multivariate analysis of variance (MANOVA) comparing neighborhood disadvantage and SES across racial/ethnic groups indicate that there are some racial/ethnic differences in this sample, F(16, 489) = 4.35, Wilks’ lambda = 0.666, P < 0.001. Specifically, Hispanic/Latine youth live in more disadvantaged neighborhoods and lower SES environments relative to other groups on all measures; Black youth are in lower SES environments relative to White youth in terms of parental education/income and area deprivation.
Table 2.
Means, standard deviations and correlations among study variables
| Pearson correlations | |||||
|---|---|---|---|---|---|
| M (s.d.) | Min − Max | Neighb | Educ/inc | Econ | |
| Neighb disadvantage | 2.01 (2.14) | 0–11 | |||
| Education/income | 0 (0.87) | −1.54–2.45 | −0.20* | ||
| Economic strain | 1.95 (0.76) | 1–3.56 | 0.34** | −0.62** | |
| Area deprivation | 67.70 (18.41) | 22–97 | 0.28** | −0.49** | 0.35** |
Note. Min − Max in the table are values present in the sample. For the full possible ranges of the scales, neighborhood disadvantage ranges from 0 to 15, education/income is standardized here (see Table 1 for more information), economic strain ranges from 1 (low strain) to 4 (high strain) and area deprivation ranges from 1 (most advantaged compared to rest of the USA) to 100 (least advantaged compared to rest of the USA).
P < 0.01,
P < 0.001.
Table 3.
Mean comparisons of study variables for Hispanic/Latine, White and Black youth
| Hispanic/Latine M (s.d.) | White M (s.d.) | Black M (s.d.) | |
|---|---|---|---|
| Neighborhood disadvantage | 2.33a (2.39) | 1.33b (1.31) | 2.22ab (2.41) |
| Education/income | −0.58a (0.72) | 0.49b (0.82) | 0.14c (0.63) |
| Economic strain | 2.25a (0.79) | 1.64b (0.60) | 1.89b (0.69) |
| Area deprivation | 74.15a (18.80) | 60.76b (15.27) | 68.81a (17.51) |
Note. Groups with different superscripts within the same row indicate statistically significant differences at P < 0.001 using Bonferroni correction for multiple comparisons.
fMRI results
Results from regression models examining the main effect of neighborhood and the interaction of neighborhood × race on brain activation are displayed in Table 4. Notably, all analyses controlled for SES. For the full-sample main effect of neighborhood model (see Figure 2), activation in the left insula was associated with neighborhood disadvantage in the threat condition, such that individuals from more disadvantaged neighborhoods showed greater activity the left insula when anticipating threat. There was no significant association between neighborhood disadvantage and neural responses to reward anticipation. Significant differences in the association between neighborhood disadvantage and brain activation were found between youth from minoritized racial/ethnic backgrounds and White youth, for both social threat and reward anticipation. For descriptive purposes, we extracted parameter estimates of signal intensity from each cluster that correlated with neighborhood disadvantage and plotted the effects for each comparison.
Table 4.
Neural regions showing differential associations with neighborhood disadvantage between racial groups for threat and reward anticipation
| Anatomical region | x | y | z | t | k |
|---|---|---|---|---|---|
|
Threat > Neutral anticipation
Main effect of neighborhood disadvantage (full sample) |
|||||
| L insula | −26 | 8 | 14 | 3.91 | 186 |
| Black vs White | |||||
| L insula, putamen, caudate | −26 | 24 | −4 | 4.70 | 3126 |
| R insula, putamen, caudate, amygdala | 40 | −2 | −14 | 4.10 | 1220 |
| ACC | −6 | 32 | 8 | 4.18 | 410 |
| L temporal pole | −50 | 2 | −30 | 3.82 | 224 |
| Latine vs White | |||||
| ACC | 0 | 46 | 20 | 4.15 | 394 |
| R temporal pole | 32 | 16 | −36 | 4.04 | 205 |
| L PFC, SMA | −10 | 24 | 52 | 3.59 | 152 |
| R pSTS | 52 | −32 | −4 | 3.99 | 148 |
|
Reward > Neutral anticipation
Black vs White |
|||||
| L insula, putamen, IFG, ventral striatum | −40 | 22 | −8 | 4.84 | 744 |
| R IFG | 16 | 60 | 18 | 3.45 | 456 |
| L insula, amygdala, subgenual ACC, striatum | −16 | −2 | −14 | 3.69 | 253 |
| L dlPFC | −30 | 40 | 14 | 4.18 | 182 |
| R TPJ | 64 | −48 | 30 | 4.57 | 179 |
Note. L = left; R = right; Sup = superior; Med = medial; Inf = inferior; Temp = temporal; Occ = occipital; Mid = middle; xyz refers to MNI coordinates; k refers to number of contiguous voxels within each cluster; SMA = Supplementary motor area.
Fig. 2.
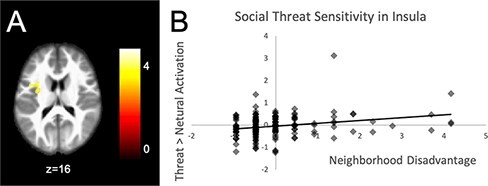
Left insula cluster (k = 186) associated with neighborhood disadvantage for the threat > neutral condition in the main effects, full-sample model (Panel A). The scatterplot in Panel B shows how neighborhood disadvantage relates to brain activation in this cluster.
Threat anticipation
Black > White youth
For Black youth compared to White youth, neighborhood disadvantage was associated with differential activation in the insula, putamen, amygdala, anterior cingulate cortex (ACC), caudate and temporal poles (see Figure 3A) during threat anticipation. As shown in Figure 3B and 3C, greater neighborhood disadvantage was associated with greater activation in these regions for Black youth, but not for White youth.
Fig. 3.
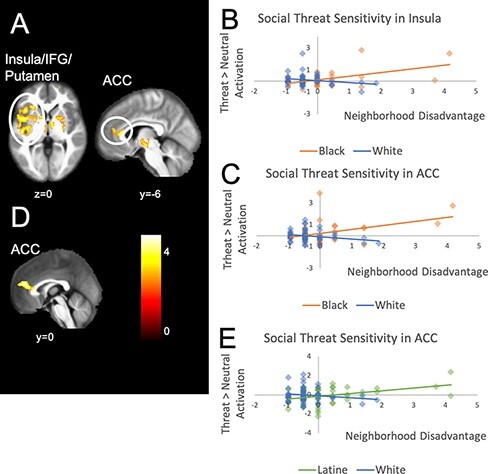
Regions associated with neighborhood disadvantage and race for the threat > neutral condition. Panel A shows the insula, IFG and putamen cluster (k = 3126) and the ACC cluster (k = 410) for the comparison of Black and White youth. The scatterplot in Panel B shows how neighborhood disadvantage relates to brain activation (parameter estimates from the regression analysis for a given cluster) differently for Black and White youth in the insula and Panel C in the ACC. Panel D shows the ACC cluster (k = 394) for the comparison of Latine and White youth. The scatterplot in Panel E shows how neighborhood disadvantage relates to brain activation differently for Latine and White youth in the ACC. Scatterplots for other clusters within a given comparison showed similar patterns in activation.
Latine > White youth
For Latine youth compared to White youth, neighborhood disadvantage was associated with differential activation in the ACC, temporal poles, posterior superior temporal sulcus (pSTS) and sensory motor area (see Figure 3D) during threat anticipation. As shown in Figure 3E, neighborhood disadvantage related to greater activation in these areas for Latine youth but not White youth.
Reward anticipation
Black > White youth
For Black youth compared to White youth, neighborhood disadvantage was associated with differential activation in the insula, putamen, inferior frontal gyrus (IFG), PFC, amygdala, ventral striatum (VS) and temporoparietal junction (TPJ; see Figure 4A) during reward anticipation. As shown in Figure 4B, greater neighborhood disadvantage was associated with greater activation in these regions for Black youth, but not for White youth.
Fig. 4.
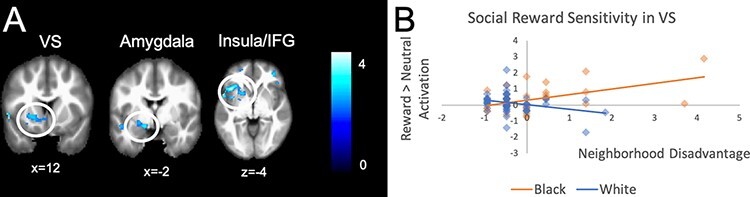
Regions associated with neighborhood disadvantage and race for the reward > neutral condition. Panel A shows clusters including the ventral striatum (k = 744), amygdala (k = 253) and insula/IFG (k = 744) for the comparison of Black and White youth. The scatterplot in Panel B shows how neighborhood disadvantage relates to brain activation (parameter estimates from the regression analysis for a given cluster) differently for Black and White youth in the VS. Scatterplots for other clusters within this comparison showed similar patterns in activation.
Latine > White youth
There were no significant differences in the association between neighborhood disadvantage and neural activity between Latine and White youth for reward anticipation.
Discussion
The current study explored the association between neighborhood disadvantage and neural processing of social threats and rewards in adolescents, with a particular focus on exploring differential associations for youth from different racial/ethnic backgrounds. Using a social incentive delay fMRI task, we found that across the whole sample, greater neighborhood disadvantage related to higher left insula activation when anticipating social threats; there was no association for social rewards. We further found that Black and Latine youth showed different associations between neighborhood disadvantage and neural responses to social threats and rewards compared to White youth. This study offers important contributions to research as the first study to demonstrate differences in the association between neighborhood disadvantage and neural function between racial/ethnic groups, suggesting that previous findings may not be universal among all adolescents. Rather, racialized experiences, both systemic and interpersonal, may play an important role in how the neighborhood environment becomes embedded in the developing brain.
In making these cross-race comparisons, it is important to note that we view race/ethnicity as a proxy for different social experiences based on one’s racial/ethnic background in a society that minoritizes Black and Latine youth and treats White youth as the dominant racial group. Furthermore, we purposefully refrain from treating any one group’s neural activation as normative or labeling them in terms of positive/negative or adaptive/maladaptive or conjecturing about how these findings may relate to other outcomes. Our findings should not be considered in terms of ‘hyper-vigilance’ or ‘increased social cognition’ toward social threats and rewards, but simply as what they are—one form of vigilance or cognition, as shaped by experiences within an environment. We believe these differences are due to differences in lived experience, not innate to groups or individuals. Thus, our discussion rather focuses on the possible experiences that might contribute to these different patterns. It is important to note that, consistent with patterns across the USA, the White youth in this study lived in more advantaged neighborhoods on average than Black and Latine youth. Thus, the question of whether youth of different racial backgrounds have different experiences within the same neighborhood environment that shape neural activation cannot be fully captured here, because many are not living in the same environments. Thus, we exercise caution when interpreting these results and urge others to do so as well. Nevertheless, this study is among the first to consider the interactions between marginalization and broader developmental context on neural responses to negative and positive social stimuli.
Race, ethnicity and social experiences
Thus far, we have framed our discussion of race/ethnicity in this paper around racialized social experiences. We do this to speak openly against racial essentialism, but we also feel it important to expand and clarify the language we use to make sense of these findings, particularly regarding race and ethnicity. Race is a socially constructed system of power in which a dominant group is privileged over other groups, whereas ethnicity typically refers to cultural beliefs and practices within a group. Yet both are frequently used to broadly describe social and psychological experiences of a group, and over time, the lines between how to define race and ethnicity have become blurry not just for researchers describing people (see Markus, 2008), but also, and perhaps more importantly, for how people describe themselves (Rivas‐Drake et al., 2014).
For example, White/Caucasian and Black/African American are considered racial categories, whereas Hispanic/Latine is considered an ethnicity and is often asked as a separate question in many surveys. It is important to remember, however, that many racial and ethnic labels originated as social constructs in the USA for use in the census, but in and of themselves have little meaning in describing the characteristics of groups or individuals. The distinction between race and ethnicity is particularly unclear and at times even confusing for people from Hispanic/Latine backgrounds. According to the Pew Research Center, approximately two-thirds of Latines say that being Hispanic/Latine is a part of both their ethnic and racial identity (Gonzalez-Barrera and Lopez, 2015; Parker et al., 2015). When asked their race in surveys and on the census, approximately one-third left the provided racial categories blank, often selecting ‘Other’ and typing in responses such as ‘Mexican’ or ‘Latin-American’ (Hitlin et al., 2007; Gonzalez-Barrera and Lopez, 2015). This was also the case in the current study, in which 20 of the 59 Hispanic/Latine participants did not select one of the racial categories provided by the researchers (which did not include Hispanic/Latine as a racial category) and instead provided their own text responses related to their Hispanic/Latine origin as their race.
Therefore, we feel it important to clarify that within all three groups in this study—White, Black and Latine adolescents—there are both systemic (i.e. race-based) and cultural (i.e. ethnic) processes that interact with the neighborhood environment to help explain our findings. Thus, one aspect of our discussion centers on systemic racial experiences (e.g. discrimination, inequitable educational opportunities, housing policies, etc.) and how people might respond and adapt to unjust racialized environments. The second aspect centers on cultural values and practices that also shape social experiences, recognizing the agency and intentionality that people use to organize and define themselves and their communities. Thus, when we speak of differences across racial groups, we recognize the strengths and intentionality of marginalized groups and seek to describe them as far more than their being marginalized by US society.
Social threat processing
We found that for social threat anticipation, neighborhood disadvantage was associated with greater activation in the left insula across the whole sample. This region was found in one other related study that examined the influence of neighborhood on neural processing of physical threat (Coan et al., 2013) and is often associated with salience detection (Menon and Uddin, 2010; Touroutoglou et al., 2012). However, despite our whole-brain exploratory approach, this was the only significant brain region found to be associated with neighborhood disadvantage in the current study, whereas previous studies have found multiple brain regions. The lack of clear main effects of neighborhood disadvantage on neural activity could be due to the racial heterogeneity in our sample, which we explored by examining differences in this association across racial/ethnic groups. When anticipating social threats, we found that minoritized youth showed greater brain activation in the insula, putamen, amygdala, ACC, IFG, temporal poles and pSTS compared to White youth—regions that relate to salience detection (Seeley et al., 2007; Hampshire et al., 2010; Menon and Uddin, 2010; Touroutoglou et al., 2012) and mentalizing processes. Although there were some overlapping regions between Black and Latine youth (e.g. ACC), Black youth showed stronger associations between neighborhood disadvantage and activity in salience regions, whereas Latine youth showed stronger associations within mentalizing regions (vs White youth).
Both Black and Latine youth showed an association between neighborhood disadvantage and heightened activation in the ACC when anticipating social threat, relative to their White peers. The ACC is involved in processing experiences of social exclusion (Gonzalez et al., 2015) and salience detection (Seeley et al., 2007). This could mean that for minoritized youth in disadvantaged neighborhoods, anticipation of social threat may elicit similar brain activation as experiences of social exclusion and these youth may process social threats as more salient and personally relevant. Again, we do not view this in terms of positive or negative, but rather a possible response to systemic racialized experiences within the neighborhood context. For example, minoritized youth face systemic social limitations and interpersonal experiences of discrimination, which may resemble a sense of exclusion and foster a sense of threat awareness that may not be present or could be different in youth who have not had these experiences.
Relative to White youth, Black youth show associations between neighborhood disadvantage and heightened activation in regions of the brain that process the salience of stimuli, including the insula, putamen, amygdala, ACC and IFG. This is consistent with previous research that found associations between neighborhood disadvantage and activity in salience regions in children and adults, particularly the dACC, insula, putamen and amygdala (Coan et al., 2013; Gonzalez et al., 2015; Gard et al., 2021). However, findings from our study are the first to show that this trend was particularly pronounced for Black (compared to White) youth. Disadvantaged environments, particularly those with more immediate threats to safety, may foster an increased awareness of negative and threatening aspects of the social world (Kraus et al., 2012; Stephens et al., 2014; Varnum and Kitayama, 2017), perhaps through repeated exposure to an unsafe and insecure environment. Our findings suggest that this is may be further exacerbated by racialized experiences within that environment, as many Black adolescents experience overt discrimination and become more aware of systemic inequities facing their and other groups (Hughes et al., 2006; Rowley et al., 2014; Anyiwo et al., 2018). Furthermore, largely in response to a hostile racial environment, many African American parents talk openly with their adolescents about facing bias and exercising caution and wariness in interracial situations (Hughes et al., 2006; Umaña-Taylor and Hill, 2020). Again, these responses may very well be normative responses to certain experiences, but nonetheless may help explain these findings regarding social threat processing for Black youth.
Although some previous research has shown that individual-level socioeconomic disadvantage relates to activation in regions of the brain often associated with mentalizing (Muscatell et al., 2012), we demonstrate here that neighborhood disadvantage was also associated with neural responses in social cognition/mentalizing-related regions, including the temporal poles and pSTS, among Latine youth relative to White youth. Disadvantaged environments are known to foster a sense of interdependence and greater awareness of others’ emotional states (Kraus et al., 2012; Stephens et al., 2014; Varnum and Kitayama, 2017; Manstead, 2018). This may be especially true for Latine youth who experience an added layer of disadvantage within their neighborhood context. Cultural practices and values emphasizing interdependence, familism and being more other-oriented are also more common in Latine than Black and White families (Knight et al., 2016), and thus, when facing a limiting and threatening neighborhood environment, Latine youth may be more likely to engage in other-oriented thinking, such as mentalizing about others’ emotional states to assess potential threats. Furthermore, connections to their other-oriented culture help promote prosocial behavior and self-esteem and protect against the effects of discrimination among Latine youth (Umaña-Taylor and Updegraff, 2007; Knight et al., 2016). Thus, the neural responses to social threat observed in this study sensitivity do not reflect a deficit or hypersensitivity and perhaps actually reflects a more prosocial response compared to others. It will be important for future research to study the role of specific cultural values, such as interdependent thinking, in shaping the influence of neighborhood environments on brain function.
Social reward processing
This study also offers important insights into our understanding of how neighborhood environments are associated with social reward processing. Past research has shown an association between neighborhood context and neural activation in the ventral striatum to monetary rewards, with higher neighborhood disadvantage associated with greater activation in this region adults (Gonzalez et al., 2016) and lower activation in children (Mullins et al., 2020). Contrary to these findings, when analyzing the full sample, we found no significant associations between neighborhood disadvantage and neural activation toward social rewards. These differences may be due to a number of differences between the present study and past work in this area, including that we used social rather than monetary reward cues, our sample had a higher proportion of low SES participants and our sample consisted of adolescents. However, when we tested the interaction of neighborhood disadvantage and race, we found significant differences in neural activation between Black and White youth. Specifically, greater neighborhood disadvantage related to greater activation in the insula, putamen, amygdala, IFG, ventral striatum, dorsolateral prefrontal cortex (dlPFC) and TPJ for Black youth only. These regions are known to be involved in salience detection (i.e. insula, putamen, amygdala and IFG), reward processing (ventral striatum), mentalizing (i.e. TPJ) and cognitive control (dlPFC).
Again, we posit that there are likely racialized systemic and cultural experiences that contribute to these differences. Disadvantaged neighborhoods generally lack rewarding social experiences due to a lack of resources (e.g. social cohesion, parks and green spaces) and the presence of violence, threats and an uncontrollable environment (Rios et al., 2012; Wen et al., 2013). For Black youth in this study, these disadvantaged environments were associated with heightened brain activation in regions involved in reward processing and salience detection. In part, this may be a form of strength and resilience in the face of an environment with limited social rewards (Frankenhuis and Nettle, 2019; Ellis et al., 2020), that these youth are more responsive to positive social experiences when they do experience them.
There are also several important cultural processes that might influence Black youths’ sensitivity to social rewards. African American parents frequently seek to instill values in their children that are inherently social and positive, such as fostering a sense of cultural pride, developing positive personal and cultural identities, gaining social intelligence, being oriented toward fairness and social justice and finding strength in community support (Hughes et al., 2006; Evans et al., 2012; Doyle et al., 2016; Grills et al., 2016; Cooper et al., 2020; Umaña-Taylor and Hill, 2020). These values relate to many aspects of positive youth development in African American youth, including prosocial behavior, community engagement and stronger social connection (Evans et al., 2012; Grills et al., 2016). Taken together, these social cultural values in African American families may help explain why we found greater neural responses to social rewards in reward and salience regions of the brain in African American youth, although future research is needed to directly test the specific cultural and psychological processes that may give rise to this enhanced sensitivity to rewards.
Strengths, limitations and future directions
Taken together, results from this study suggest that the neighborhood context interacts with racialized experiences to shape neural sensitivity to social threats and rewards among adolescents. One major strength of this study is that it utilized a large and diverse sample of US adolescents, which allows for more generalizability of findings on adolescent brain development in the USA. Compared to previous studies, this sample includes youth from both low and high SES and diverse racial/ethnic backgrounds, capturing a wider range of experiences related to socioeconomic disadvantage. This is also one of the first studies to examine the interaction of neighborhood disadvantage and race, showing that youth from minoritized backgrounds are more strongly influenced by their social environment, likely because race adds an additional layer of how the environment is experienced. Importantly, these comparisons are made difficult by the fact that White youth lived in more advantaged neighborhoods on average compared to Black and Latine youth, and thus it cannot be fully concluded that White youth would not show similar activation if in that neighborhood context. Although these comparisons across racial/ethnic groups make an important contribution, there was also heterogeneity in neighborhood disadvantage, SES and brain activation within racial/ethnic groups. Other factors not assessed in this study may also shape how race is experienced, particularly for Latine youth, such as bilingualism, immigration status and skin tone (i.e. presenting as White, Black or Indigenous). Future research should examine differences within groups as well as across.
Furthermore, although we offer several possible explanations of our findings based on current research, these findings show a need for future research to examine specific mechanisms that underlie these differences, including systemic factors (e.g. segregation, access to nutritious food and lack of green spaces), social factors (e.g. discrimination and critical awareness) and cultural factors (e.g. interdependent values and racial attitudes and beliefs) that might play a role in minoritized adolescents’ lives. Finally, this sample was from a rural region of the USA, whereas most research has been conducted in suburban or urban areas. Although we view this novel perspective as a strength, it is also possible that the disadvantage operates differently in rural and urban settings, and future research should aim to investigate these different settings.
Although we offer some initial evidence for the specific role of neighborhood context, the cross-sectional nature of the study limits conclusions about developmental trajectories or causal pathways. Thus, although neighborhood disadvantage is associated with neural threat and reward processing during adolescence, there is much yet to be learned about specific developmental timing and change over time from childhood through adolescence. Prior work in adults has shown that disadvantage during childhood and adolescence is more important for brain function than during adulthood (Lynch et al., 1997; Kim et al., 2013; Javanbakht et al., 2015). This suggests that a change in one’s social environment later in life does not exert a strong influence on brain function, but rather the patterns established earlier in life remain. Although we are unable to examine changes in neighborhood environment in the current study, future research should use longitudinal approaches to understand how different aspects of the social environment play a role at specific developmental periods and how changes in environment may relate to social threat and reward processing.
Conclusions
In conclusion, this study makes a number of meaningful contributions to our current understanding of neighborhood disadvantage, race and the developing brain. This study utilized a large and diverse sample of US adolescents and a novel approach to understanding the intersection of neighborhood disadvantage and race, making it more generalizable for understanding influences on adolescent brain development. Neighborhood disadvantage was related to greater neural activation in salience and mentalizing regions of the brain toward social threats for Black and Latine adolescents and to greater activation in reward, salience and mentalizing brain regions toward social rewards for Black adolescents. Together, this study shows that race and racialized experiences are important for understanding how social environments shape neural sensitivity to social threats and rewards.
Supplementary Material
Contributor Information
Nathan A Jorgensen, Department of Psychology and Neuroscience, The University of North Carolina at Chapel Hill, Chapel Hill, NC 27510-3270, USA.
Keely A Muscatell, Department of Psychology and Neuroscience, The University of North Carolina at Chapel Hill, Chapel Hill, NC 27510-3270, USA.
Ethan M McCormick, Institute of Psychology, Leiden University, RB Leiden 2300, The Netherlands.
Mitchell J Prinstein, Department of Psychology and Neuroscience, The University of North Carolina at Chapel Hill, Chapel Hill, NC 27510-3270, USA.
Kristen A Lindquist, Department of Psychology and Neuroscience, The University of North Carolina at Chapel Hill, Chapel Hill, NC 27510-3270, USA.
Eva H Telzer, Department of Psychology and Neuroscience, The University of North Carolina at Chapel Hill, Chapel Hill, NC 27510-3270, USA.
Conflict of interest
The authors declared that they had no conflict of interest with respect to their authorship or the publication of this article.
Supplementary data
Supplementary data are available at SCAN online.
References
- Alegría M., Molina K.M., Chen C.-N. (2014). Neighborhood characteristics and differential risk for depressive and anxiety disorders across racial/ethnic groups in the United States. Depression and Anxiety, 31, 27–37. [DOI] [PMC free article] [PubMed] [Google Scholar]
- Anyiwo N., Bañales J., Rowley S.J., Watkins D.C., Richards-Schuster K. (2018). Sociocultural influences on the sociopolitical development of African American youth. Child Development Perspectives, 12, 165–70. [Google Scholar]
- Assari S. (2018). Blacks’ diminished return of education attainment on subjective health; mediating effect of income. Brain Sciences, 8(9), 1–11. [DOI] [PMC free article] [PubMed] [Google Scholar]
- Assari S., Lankarani M.M., Caldwell C.H. (2018). Does discrimination explain high risk of depression among high-income African American men? Behavioral Sciences, 8(4), 1–11. [DOI] [PMC free article] [PubMed] [Google Scholar]
- Assari S., Caldwell C.H. (2018). High risk of depression in high income African American boys. Journal of Racial and Ethnic Health Disparities, 5(4), 808–19. [DOI] [PMC free article] [PubMed] [Google Scholar]
- Bañales J., Lozada F.T., Channey J.B.T., Jagers R.J. (2021). Relating through oppression: longitudinal relations between parental racial socialization, school racial climate, oppressed minority ideology, and empathy in Black male adolescents’ prosocial development. American Journal of Community Psychology, 68(1-2), 88–99. [DOI] [PubMed] [Google Scholar]
- Blakemore S.-J., Mills K.L. (2014). Is adolescence a sensitive period for sociocultural processing? Annual Review of Psychology, 65, 187–207. [DOI] [PubMed] [Google Scholar]
- Buchanan N.T., Perez M., Prinstein M.J., Thurston I.B. (2021). Upending racism in psychological science: strategies to change how science is conducted, reported, reviewed, and disseminated. American Psychologist, 76(7), 1097–112. [DOI] [PubMed] [Google Scholar]
- Coan J.A., Beckes L., Allen J.P. (2013). Childhood maternal support and social capital moderate the regulatory impact of social relationships in adulthood. International Journal of Psychophysiology, 88, 224–31. [DOI] [PMC free article] [PubMed] [Google Scholar]
- Conger R.D., Wallace L.E., Sun Y., Simons R.L., McLoyd V.C., Brody G.H. (2002). Economic pressure in African American families: a replication and extension of the family stress model. Developmental Psychology, 38, 179–93. [PubMed] [Google Scholar]
- Cooper S.M., Burnett M., Johnson M.S., Brooks J., Shaheed J., McBride M. (2020). ‘That is why we raise children’: African American fathers’ race-related concerns for their adolescents and parenting strategies. Journal of Adolescence, 82, 67–81. [DOI] [PubMed] [Google Scholar]
- Cremers H.R., Veer I.M., Spinhoven P., Rombouts S.A.R.B., Roelofs K. (2015). Neural sensitivity to social reward and punishment anticipation in social anxiety disorder. Frontiers in Behavioral Neuroscience, 8, 1–9. [DOI] [PMC free article] [PubMed] [Google Scholar]
- Crone E.A., Dahl R.E. (2012). Understanding adolescence as a period of social–affective engagement and goal flexibility. Nature Reviews Neuroscience, 13(9), 636–50. [DOI] [PubMed] [Google Scholar]
- Crum R., Lillie-Blanton M., Anthony J.C. (1996). Neighborhood environment and opportunity to use cocaine and other drugs in late childhood and early adolescence. Drug and Alcohol Dependence, 43, 155–61. [DOI] [PubMed] [Google Scholar]
- Doyle O., Magan I., Cryer-Coupet Q.R., Goldston D.B., Estroff S.E. (2016). “Don’t wait for it to rain to buy an umbrella:” The transmission of value from African American fathers to sons. Psychology of Men & Masculinity, 17(4), 309–19. [Google Scholar]
- Dupéré V., Leventhal T., Vitaro F. (2012). Neighborhood processes, self-efficacy, and adolescent mental health. Journal of Health and Social Behavior, 53, 183–98. [DOI] [PubMed] [Google Scholar]
- Egger H.L., Pine D.S., Nelson E., et al. (2011). The NIMH Child Emotional Faces Picture Set (NIMH-ChEFS): a new set of children’s facial emotion stimuli. International Journal of Methods in Psychiatric Research, 20, 145–56. [DOI] [PMC free article] [PubMed] [Google Scholar]
- Ellis B.J., Abrams L.S., Masten A.S., Sternberg R.J., Tottenham N., Frankenhuis W.E. (2020). Hidden talents in harsh environments. Development and Psychopathology, 34(1), 95–113. [DOI] [PubMed] [Google Scholar]
- Evans A.B., Banerjee M., Meyer R., Aldana A., Foust M., Rowley S. (2012). Racial socialization as a mechanism for positive development among African American youth. Child Development Perspectives, 6(3), 251–7. [Google Scholar]
- Evans G.W., Shapiro D.H., Lewis M.A. (1993). Specifying dysfunctional mismatches between different control dimensions. British Journal of Psychology, 84, 255–73. [Google Scholar]
- Evans G.W., English K. (2002). The environment of poverty: multiple stressor exposure, psychophysiological stress, and socioemotional adjustment. Child Development, 73(4), 1238–48. [DOI] [PubMed] [Google Scholar]
- Evans G.W., Kim P. (2013). Childhood poverty, chronic stress, self-regulation, and coping. Child Development Perspectives, 7(1), 43–8. [Google Scholar]
- Farah M. J. (2017). The neuroscience of socioeconomic status: Correlates, causes, and consequences. Neuron, 96, 56–71. [DOI] [PubMed] [Google Scholar]
- Frankenhuis W.E., Nettle D. (2019). The strengths of people in poverty. Current Directions in Psychological Science, 29(1), 16–21. [Google Scholar]
- Gard A.M., Waller R., Shaw D.S., Forbes E.E., Hariri A.R., Hyde L.W. (2017). The long reach of early adversity: parenting, stress, and neural pathways to antisocial behavior in adulthood. Biological Psychiatry: Cognitive Neuroscience and Neuroimaging, 2, 582–90. [DOI] [PMC free article] [PubMed] [Google Scholar]
- Gard A.M., Maxwell A.M., Shaw D.S., et al. (2021). Beyond family-level adversities: exploring the developmental timing of neighborhood disadvantage effects on the brain. Developmental Science, 24, 1–15. [DOI] [PMC free article] [PubMed] [Google Scholar]
- Gonzalez M.Z., Beckes L., Chango J., Allen J.P., Coan J.A. (2015). Adolescent neighborhood quality predicts adult dACC response to social exclusion. Social Cognitive and Affective Neuroscience, 10, 921–8. [DOI] [PMC free article] [PubMed] [Google Scholar]
- Gonzalez M.Z., Allen J.P., Coan J.A. (2016). Lower neighborhood quality in adolescence predicts higher mesolimbic sensitivity to reward anticipation in adulthood. Developmental Cognitive Neuroscience, 22, 48–57. [DOI] [PMC free article] [PubMed] [Google Scholar]
- Gonzalez-Barrera A., Lopez M.H. Is being Hispanic a matter of race, ethnicity or both? Pew Research Center. Available: http://pewrsr.ch/1egbvPL [June 15, 2015].
- Gorgolewski K.J., Varoquaux G., Rivera G., et al. (2015). NeuroVault.org: a web-based repository for collecting and sharing unthresholded statistical maps of the human brain. Frontiers in Neuroinformatics, 9, 1–9. [DOI] [PMC free article] [PubMed] [Google Scholar]
- Grills C., Cooke D., Douglas J., Subica A., Villanueva S., Hudson B. (2016). Culture, racial socialization, and positive African American youth development. Journal of Black Psychology, 42(4), 343–73. [Google Scholar]
- Hackman D.A., Betancourt L.M., Brodsky N.L., Hurt H., Farah M.J. (2012). Neighborhood disadvantage and adolescent stress reactivity. Frontiers in Human Neuroscience, 6(Article), 1–11. [DOI] [PMC free article] [PubMed] [Google Scholar]
- Hampshire A., Chamberlain S.R., Monti M.M., Duncan J., Owen A.M. (2010). The role of the right inferior frontal gyrus: inhibition and attentional control. Neuroimage, 50, 1313–9. [DOI] [PMC free article] [PubMed] [Google Scholar]
- Hao Y., Farah M.J. (2020). The affective neuroscience of socioeconomic status: implications for mental health. BJPsych Bulletin, 44, 202–7. [DOI] [PMC free article] [PubMed] [Google Scholar]
- Heberle A.E., Carter A.S. (2015). Cognitive aspects of young children’s experiences of economic disadvantage. Psychological Bulletin, 141, 723–46. [DOI] [PubMed] [Google Scholar]
- Hitlin S., Brown J.S., Elder G.H. (2007). Measuring Latinos: racial vs. ethnic classification and self-understandings. Social Forces, 86, 587–611. [Google Scholar]
- Hughes D., Rodriguez J., Smith E.P., Johnson D.J., Stevenson H.C., Spicer P. (2006). Parents’ ethnic-racial socialization practices: a review of research and directions for future study. Developmental Psychology, 42, 747–70. [DOI] [PubMed] [Google Scholar]
- Hull P., Kilbourne B., Reece M., Husaini B. (2008). Community involvement and adolescent mental health: moderating effects of race/ethnicity and neighborhood disadvantage. Journal of Community Psychology, 36, 534–51. [Google Scholar]
- Javanbakht A., King A.P., Evans G.W., et al. (2015). Childhood poverty predicts adult amygdala and frontal activity and connectivity in response to emotional faces. Frontiers in Behavioral Neuroscience, 9, 1–8. [DOI] [PMC free article] [PubMed] [Google Scholar]
- Kim P., Evans G.W., Angstadt M., et al. (2013). Effects of childhood poverty and chronic stress on emotion regulatory brain function in adulthood. Proceedings of the National Academy of Sciences of the United States of America, 110(46), 18442–7. [DOI] [PMC free article] [PubMed] [Google Scholar]
- Knight G.P., Carolo G., Mahrer N.E., Davis A.N. (2016). The socialization of culturally related values and prosocial tendencies among Mexican American adolescents. Child Development, 87, 1758–71. [DOI] [PMC free article] [PubMed] [Google Scholar]
- Kraus M.W., Piff P.K., Mendoza-Denton R., Rheinschmidt M.L., Keltner D. (2012). Social class, solipsism, and contextualism: how the rich are different from the poor. Psychological Review, 119(3), 546–72. [DOI] [PubMed] [Google Scholar]
- Lei M.-T., Beach S.R.H., Simons R.L. (2018). Biological embedding of neighborhood disadvantage and collective efficacy: influences on chronic illness via accelerated cardiometabolic age. Development and Psychopathology, 30, 1797–815. [DOI] [PMC free article] [PubMed] [Google Scholar]
- Leventhal T., Dupéré V., Brooks-Gunn J. (2009). Neighborhood influences on adolescent development. In: Lerner, R.M., Steinberg, L., editors. Handbook of Adolescent Psychology, 3rd edn, Vol. 2, Hoboken, NJ: Wiley. 411–43. [Google Scholar]
- Leventhal T. (2018). Neighborhood context and children’s development: when do neighborhoods matter most? Child Development Perspectives, 12, 258–63. [Google Scholar]
- Lynch J.W., Kaplan G.A., Salonen J.T. (1997). Why do poor people behave poorly? Variation in adult health behaviours and psychosocial characteristics by stages of the socioeconomic lifecourse. Social Science & Medicine, 44, 809–19. [DOI] [PubMed] [Google Scholar]
- Manstead A.S.R. (2018). The psychology of social class: how socioeconomic status impacts thought, feelings, and behaviour. British Journal of Social Psychology, 57, 267–91. [DOI] [PMC free article] [PubMed] [Google Scholar]
- Markus H.R. (2008). Pride, prejudice and ambivalence: toward a unified theory of race and ethnicity. American Psychologist, 63, 651–70. [DOI] [PubMed] [Google Scholar]
- Menon V., Uddin L.Q. (2010). Saliency, switching, attention and control: a network model of insula function. Brain Structure & Function, 214, 655–67. [DOI] [PMC free article] [PubMed] [Google Scholar]
- Mullins T.S., Campbell E.M., Hogeveen J. (2020). Neighborhood deprivation shapes motivational-neurocircuit recruitment in children. Psychological Science, 31, 881–9. [DOI] [PMC free article] [PubMed] [Google Scholar]
- Muscatell K.A., Morelli S.A., Falk E.B., et al. (2012). Social status modulates neural activity in the mentalizing network. NeuroImage, 60(3), 1771–7. [DOI] [PMC free article] [PubMed] [Google Scholar]
- Muscatell K.A. (2018). Socioeconomic influences on brain function: Implications for health. Annals of the New York Academy of Sciences, 1428, 1–19. [DOI] [PubMed] [Google Scholar]
- Nelson E.E., Jarcho J.M., Guyer A.E. (2016). Social re-orientation and brain development: an expanded and updated view. Developmental Cognitive Neuroscience, 17, 118–27. [DOI] [PMC free article] [PubMed] [Google Scholar]
- North Carolina School Report Cards . (2017). Available: https://ncreportcards.ondemand.sas.com/src/school?school=530336&year=2017&lang=english [January 2018].
- Parker K., Horowitz J.M., Morin R., Lopez M.H. Multiracial in America, Chapter 7: the many dimensions of Hispanic racial identity. Pew Research Center. Available: https://www.pewresearch.org/social-trends/2015/06/11/chapter-7-the-many-dimensions-of-hispanic-racial-identity/ [June 11, 2015].
- Qu Y., Jorgensen N.A., Telzer E.H. (2021). A call for greater attention to culture in the study of brain and development. Perspectives on Psychological Science, 16, 275–93. [DOI] [PMC free article] [PubMed] [Google Scholar]
- Quon E.C., McGrath J.J. (2014). Subjective socioeconomic status and adolescent health: a meta-analysis. Health Psychology, 33, 433–47. [DOI] [PMC free article] [PubMed] [Google Scholar]
- Rios R., Aiken L.S., Zautra A.J. (2012). Neighborhood contexts and the mediating role of neighborhood social cohesion on health and psychological distress among Hispanic and non-Hispanic residents. Annals of Behavioral Medicine, 43, 50–61. [DOI] [PubMed] [Google Scholar]
- Rivas‐Drake D., Seaton E.K., Markstrom C., et al. (2014). Ethnic and racial identity in adolescence: implications for psychosocial, academic, and health outcomes. Child Development, 85, 40–57. [DOI] [PMC free article] [PubMed] [Google Scholar]
- Rowley S.J., Ross L., Lozada F.T., Williams A., Gale A., Kurtz-Costes B. (2014). Framing black boys: parent, teacher, and student narratives of the academic lives of black boys. Advances in Child Development and Behavior, 47, 301–32. [DOI] [PubMed] [Google Scholar]
- Rudolph K.E., Wand G.S., Stuart E.A., et al. (2014). The association between cortisol and neighborhood disadvantage in a U.S. population-based sample of adolescents. Health & Place, 25, 68–77. [DOI] [PMC free article] [PubMed] [Google Scholar]
- Russell M.A., Odgers C.L. (2020). Adolescents’ subjective social status predicts day-to-day mental health and future substance use. Journal of Research on Adolescence, 30(S2), 532–44. [DOI] [PubMed] [Google Scholar]
- Seeley W.W., Menon V., Schatzberg A.F., et al. (2007). Dissociable intrinsic connectivity networks for salience processing and executive control. The Journal of Neuroscience, 27, 2349–56. [DOI] [PMC free article] [PubMed] [Google Scholar]
- Stephens N.M., Markus H.R., Phillips L.T. (2014). Social class culture cycles: how three gateway contexts shape selves and fuel inequality. Annual Reviews of Psychology, 65, 611–34. [DOI] [PubMed] [Google Scholar]
- Suarez G.L., Burt S.A., Gard A.M., et al. (2022). The impact of neighborhood disadvantage on amygdala reactivity: pathways through neighborhood social processes. Developmental Cognitive Neuroscience, 54, 1–15. [DOI] [PMC free article] [PubMed] [Google Scholar]
- Touroutoglou A., Hollenbeck M., Dickerson B., Barrett L.F. (2012). Dissociable large-scale networks anchored in the right anterior insula subserve affective experience and attention. Neuroimage, 60, 1947–58. [DOI] [PMC free article] [PubMed] [Google Scholar]
- Umaña-Taylor A.J., Hill N.E. (2020). Ethnic-racial socialization in the family: a decade’s advance on precursors and outcomes. Journal of Marriage and Family, 82, 244–71. [Google Scholar]
- Umaña-Taylor A.J., Updegraff K.A. (2007). Latino adolescents’ mental health: exploring the interrelations among discrimination, ethnic identity, cultural orientation, self-esteem, and depressive symptoms. Journal of Adolescence, 30(4), 549–67. [DOI] [PubMed] [Google Scholar]
- University of Wisconsin School of Medicine and Public Health . (2018). Area deprivation index v2.0. Available: https://www.neighborhoodatlas.medicine.wisc.edu/ [May 1, 2018].
- Varnum M.E.W., Kitayama S. (2017). The neuroscience of social class. Current Opinion in Psychology, 18, 147–51. [DOI] [PubMed] [Google Scholar]
- Walker R.E., Keane C.R., Burke J.G. (2010). Disparities and access to healthy food in the United States: a review of food deserts literature. Health & Place, 16, 876–84. [DOI] [PubMed] [Google Scholar]
- Ward B.D. (2000). Simultaneous inference for fMRI data [WWW]. Available: https://afni.nimh.nih.gov/pub/dist/doc/manual/AlphaSim.pdf [November 17, 2017].
- Wen M., Zhang X., Harris C.D., Holt J.B., Croft J.B. (2013). Spatial disparities in the distribution of parks and green spaces in the USA. Annals of Behavioral Medicine, 45, 18–27. [DOI] [PMC free article] [PubMed] [Google Scholar]
Associated Data
This section collects any data citations, data availability statements, or supplementary materials included in this article.