SUMMARY
R-loops are RNA-DNA hybrid-containing nucleic acids with important cellular roles. Deregulation of R-loop dynamics can lead to DNA damage and genome instability1 which has been linked to the action of endonucleases such as XPG2–4. However, the mechanism and cellular consequences of such processing have remained unclear. Here, we identify a new population of RNA-DNA hybrids in the cytoplasm that are R-loop processing products. When nuclear R-loops were perturbed by depleting the RNA-DNA helicase Senataxin (SETX) or the breast cancer gene, BRCA15–7, we observed XPG and XPF-dependent cytoplasmic hybrid formation. We identify the hybrid source as a subset of stable, converging nuclear R-loops with a specific nucleotide signature. Cytoplasmic hybrids bind the pattern recognition receptors cGAS and TLR38, activating IRF3 and inducing apoptosis. Excised hybrids and an R-loop-induced innate immune response were also observed in SETX-mutated ataxia oculomotor apraxia type 2 (AOA2) patient cells9 and in BRCA1-mutated cancer cells10. These findings establish RNA-DNA hybrids as immunogenic species which aberrantly accumulate in the cytoplasm upon R-loop processing, linking R-loop accumulation to cell death through the innate immune response. Aberrant R-loop processing and subsequent innate immune activation may contribute to many diseases, such as neurodegeneration and cancer.
R-loops are three-stranded nucleic acid structures that form during transcription. Unscheduled R-loop formation can interfere with productive DNA replication and transcription, and has been linked to double-strand break formation, genome instability, senescence and cell death in several disease states1,5,11. Many factors suppress R-loop formation in human cells, including the helicase SETX3,7, which can unwind the RNA-DNA hybrid portion of the R-loop, and the breast-cancer predisposition gene BRCA16, which is involved in DNA repair, DNA replication and transcription. Although DNA breaks are known to result from the endonucleolytic processing of R-loops2–4, the fate of these processed nucleic acids and their impact on the cell remains unknown.
Cytoplasmic RNA-DNA hybrid accumulation
To study R-loop processing, we used recombinant, GFP-tagged, catalytically-inactive RNase H1 D210N (GFP-dRH) to visualize RNA-DNA hybrids throughout the cell12. Surprisingly, we observed that siRNA-mediated knockdown of two factors that affect R-loop levels, SETX or BRCA1, not only led to an increase in nuclear GFP-dRH signal as previously observed12, but also of cytoplasmic GFP-dRH signal (Fig. 1a, Extended Data Fig. 1a–c). This signal was sensitive to pre-treatment of cells with RNase H, which degrades the RNA moiety of RNA-DNA hybrids, indicating that RNA-DNA hybrids accumulate in the cytoplasm of cells. To characterize these nucleic acids, we developed a method to biochemically purify and visualize cytoplasmic RNA-DNA hybrids – termed cytoplasmic DNA-RNA hybrid immunoprecipitation (cytoDRIP) (Fig. 1b). Using this approach, we found that depletion of SETX or BRCA1 (Fig. 1c,d, Extended Data Fig. 1d–g), as well as splicing inhibition using Pladienolide B13 (PlaB) (Extended Data Fig. 1h), resulted in increased accumulation of cytoplasmic RNA-DNA hybrid fragments, ranging in size from 100 bp to several kilobases.
Figure 1. Loss of R-loop resolution factors leads to XPG-dependent cytoplasmic RNA-DNA hybrid accumulation.
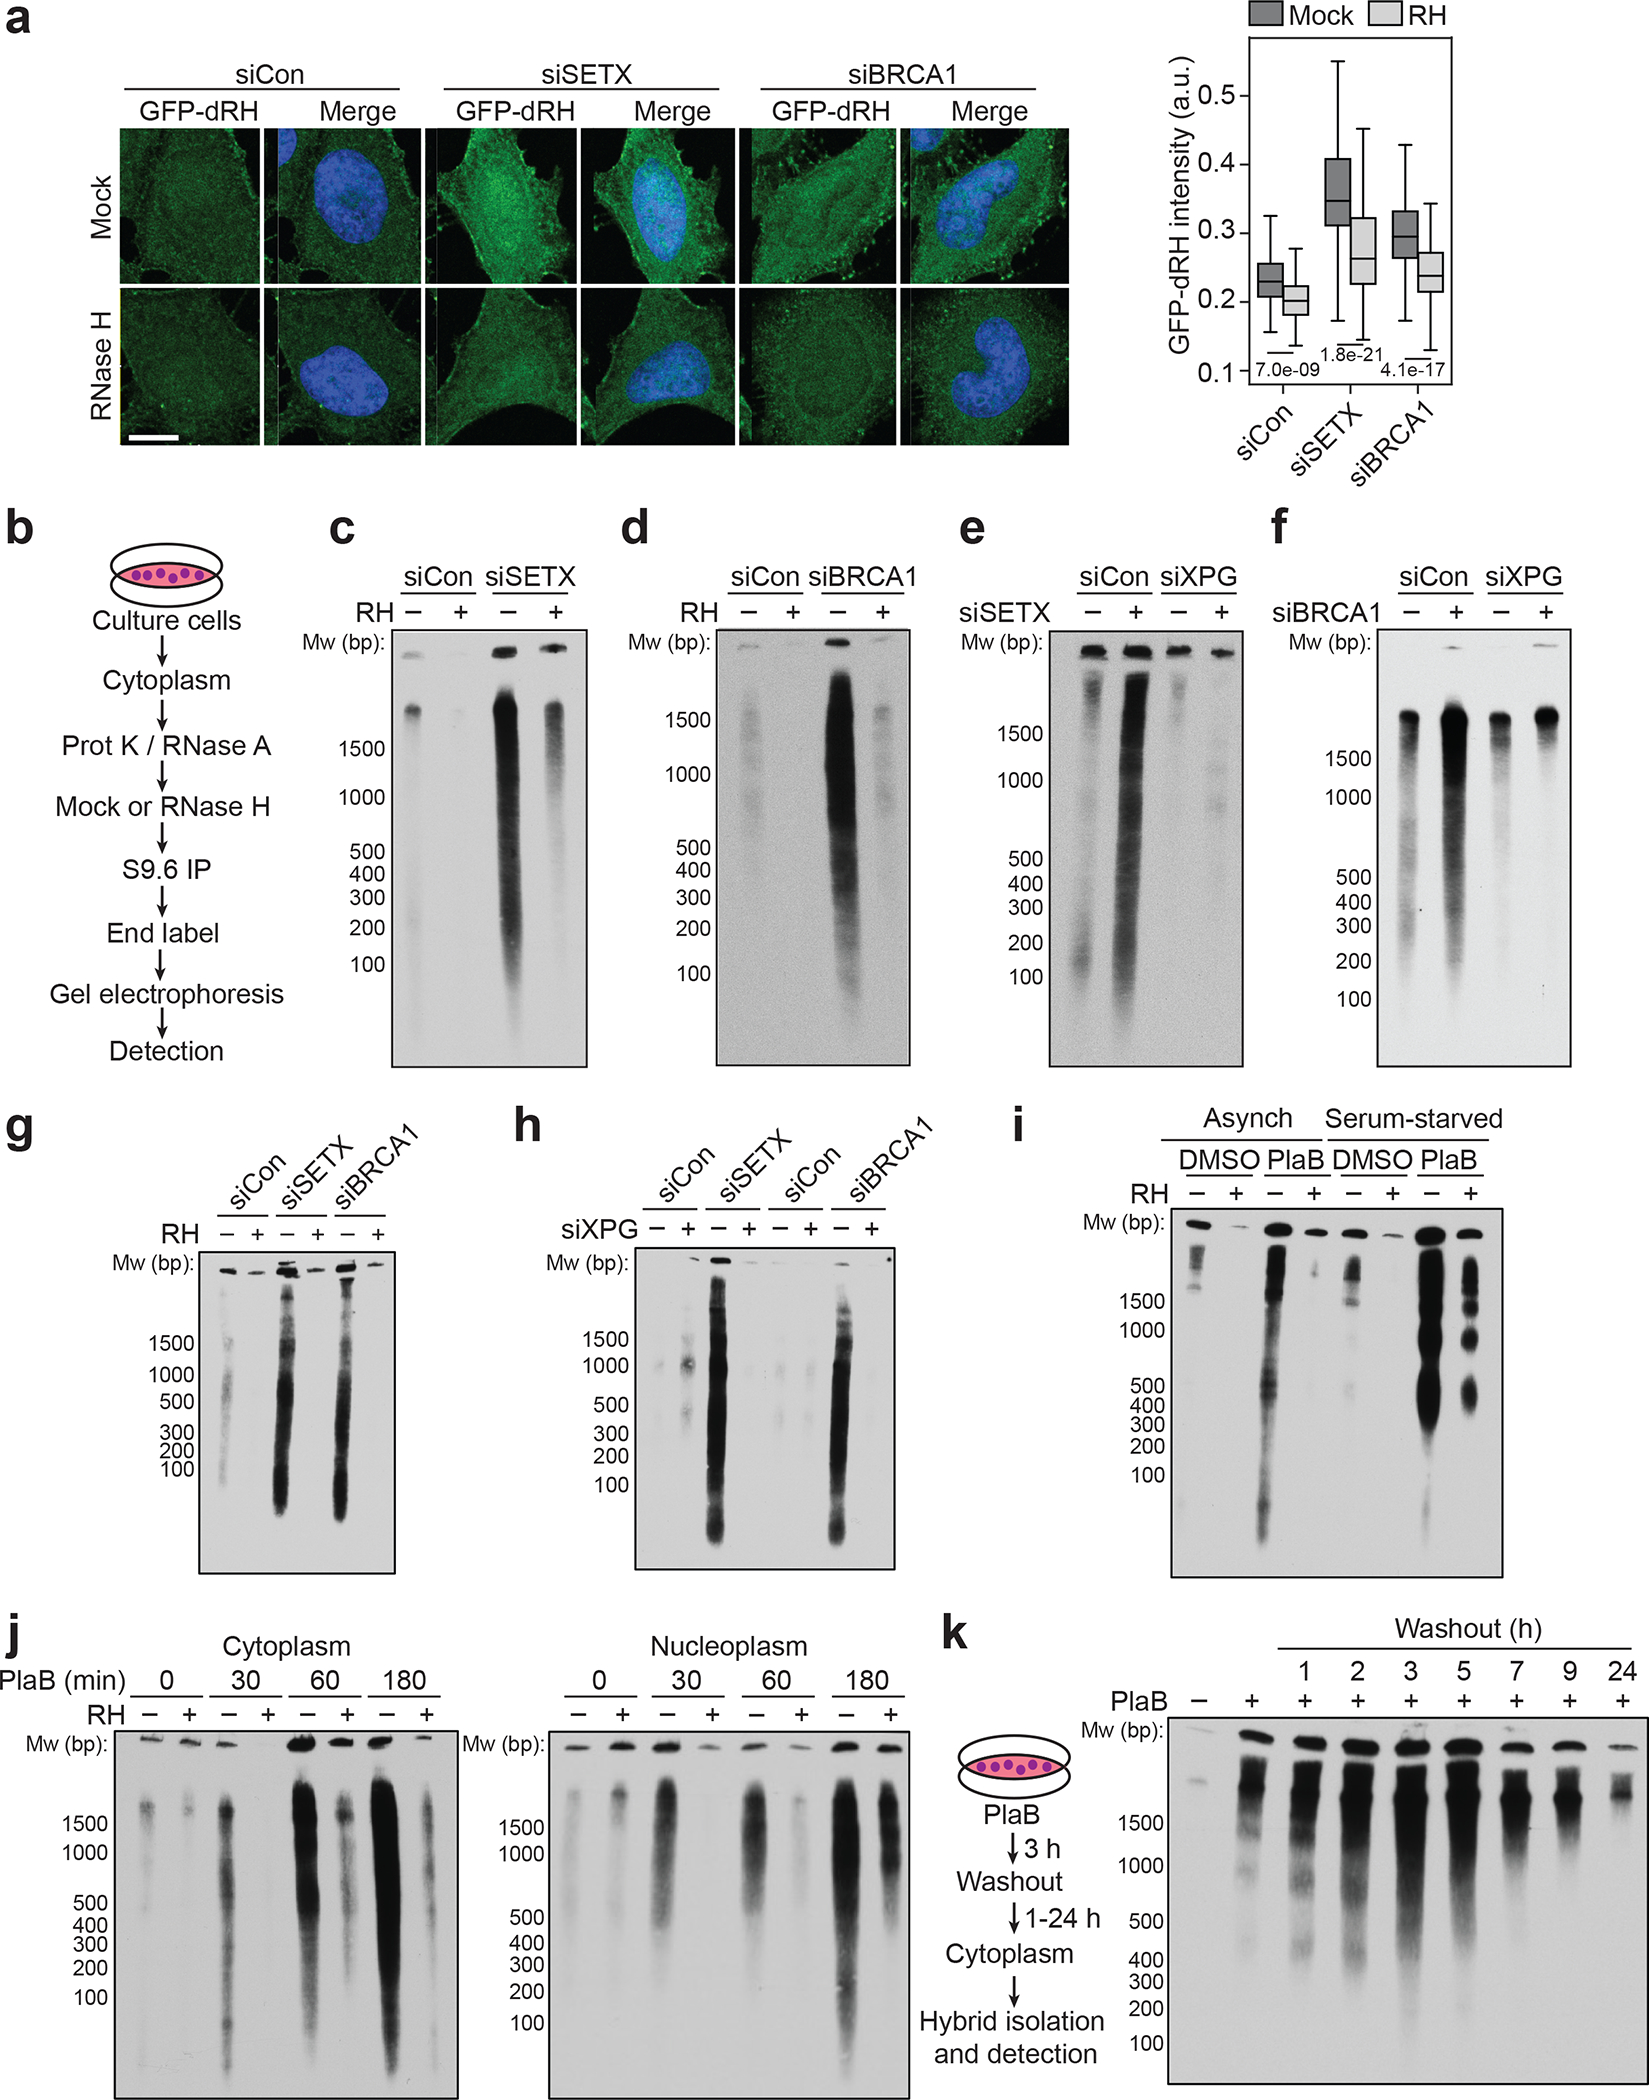
(a) Left: Images of SETX or BRCA1-depleted HeLa cells probed with GFP-dRH protein after fixation, following mock or RNase H (RH) pre-treatment. Scale bar is 10 μm. Right: quantification of cytoplasmic GFP-dRH intensities; p-values are shown in the figure; two-sided Mann Whitney U test: n-values from left to right: 463, 249, 397, 237, 286, 224. Center line, median; box limits, 75 and 25 percentiles, whiskers, min and max values.
(b) Schematic of cytoDRIP experimental workflow.
(c) Cytoplasmic RNA-DNA hybrids extracted from control (siCon) and siSETX-treated HeLa cells, with mock and RH treatment prior to pull-down. Size markers indicated in base pairs (bp).
(d) As in (c) but for control and siBRCA1-treated cells.
(e) As in (c) but with siXPG.
(f) As in (e) but after BRCA1 knockdown.
(g) Cytoplasmic hybrid levels in BAX−/−BAK−/− HeLa cells after treatment with siCon, siSETX or siBRCA1.
(h) As in (g) with or without XPG knockdown.
(i) Cytoplasmic hybrids extracted from asynchronous or serum-starved MCF10A cells following DMSO or PlaB treatment (500 nM, 3 h), with mock and RH treatment prior to pull-down.
(j) Cytoplasmic (left) or soluble nuclear (right) hybrids from HeLa cells following a time course of PlaB, with mock and RH treatment prior to pull-down.
(k) Cytoplasmic hybrids extracted from HeLa cells after PlaB treatment (500 nM, 3 h) and then washout for up to 24 h.
XPG and XPF excise RNA-DNA hybrids
As the endonucleases XPG and XPF have been implicated in R-loop processing2–4, we asked whether they contribute to cytoplasmic hybrid formation. Interestingly, cytoplasmic RNA-DNA hybrid accumulation was abrogated by siRNA-mediated depletion of XPG or XPF (Fig. 1e,f, Extended Data Fig. 1i–l), or by degradation of auxin-induced degron (AID)-tagged XPG (Extended Data Fig. 1m–o). These results indicate that R-loop deregulation leads to an XPG- and XPF-dependent increase in the formation of cytoplasmic RNA-DNA hybrids. To ensure that cytoplasmic hybrids were not simply generated as a result of apoptosis, we generated apoptosis-deficient BAX−/− BAK−/− double-knockout cells14,15. We observed R-loop-induced, XPG-dependent accumulation of cytoplasmic hybrids in these cells (Fig. 1g,h, Extended Data Fig. 2a). We also observed cytoplasmic hybrids in serum-starved cells (Fig. 1i, Extended Data Fig. 2b–k), indicating that cytoplasmic hybrid production does not require DNA replication and that these hybrids are not simply released into the cytoplasm through nuclear envelope breakdown. The nuclear transport receptor exportin-1, which is involved in the export of nucleic acids16–18, also had a partial role in regulating localization of the hybrids induced by SETX loss or PlaB treatment (Extended Data Fig. 2l–n). This finding suggests cytoplasmic hybrid formation is an active process involving nuclear export. Finally, we leveraged the rapid action and reversibility of PlaB (Extended Data Fig. 2o,p) to study the dynamics and stability of cytoplasmic RNA-DNA hybrids. We found that cytoplasmic and soluble nucleoplasmic hybrids formed within 30 min of PlaB addition, and their levels accumulated over time (Fig. 1j). Three hours after PladB withdrawal, hybrid levels began to decline, exhibiting a half-life of approximately 4 h and returning to baseline by 24 h (Fig. 1k). Therefore, R-loop processing results in the rapid formation and active export of RNA-DNA hybrids to the cytoplasm, from which they are eventually cleared.
Hybrids originate from genomic R-loops
To trace the origin of cytoplasmic RNA-DNA hybrids, we combined cytoDRIP with strand-specific RNA-DNA hybrid sequencing (cytoDRIP-seq) (Fig. 2a, b) using control and SETX-depleted cells. We sequenced the single-stranded DNA moiety of the hybrids to prevent known issues of the S9.6 antibody binding to dsRNA12,19, obtaining a highly reproducible signal (Extended Data Fig. 3a). The sequencing reads were primarily derived from the nucleus, with a small fraction mapping to the mitochondrial genome (Extended Data Fig. 3b). We identified 866 peaks in control and 5726 peaks in SETX-depleted cells representing 0.04% and 0.19% of genome space, respectively (Extended Data Fig. 3c). Most of these sites were not present in control cells (Extended Data Fig. 3d) and were enriched above IgG control (Extended Data Fig. 3e). Importantly, we also demonstrated sensitivity to RNase H (Extended Data Fig. 3f) and validated the role of XPG in cytoplasmic hybrid formation (Fig. 2c). CytoDRIP sites mapped to both genic and intergenic regions (Fig. 2d, Extended Data Fig. 3g,h). Within genes, most cytoDRIP sites occurred within gene bodies (Extended Data Fig. 4a), and within intergenic regions, there was significant enrichment at enhancers (Fig. 2d). Since nuclear R-loops are enriched for certain repetitive DNA sequences20, we asked if repeats overlapped cytoplasmic hybrid sites more than expected. We found cytoDRIP regions to be elevated for several types of repeats, in particular simple and low complexity repeats (Extended Data Fig. 4b,c), centromeres and rDNA (Extended Data Fig. 4d).
Figure 2. CytoDRIP-seq shows cytoplasmic RNA-DNA hybrids are derived from a subset of nuclear R-loops.
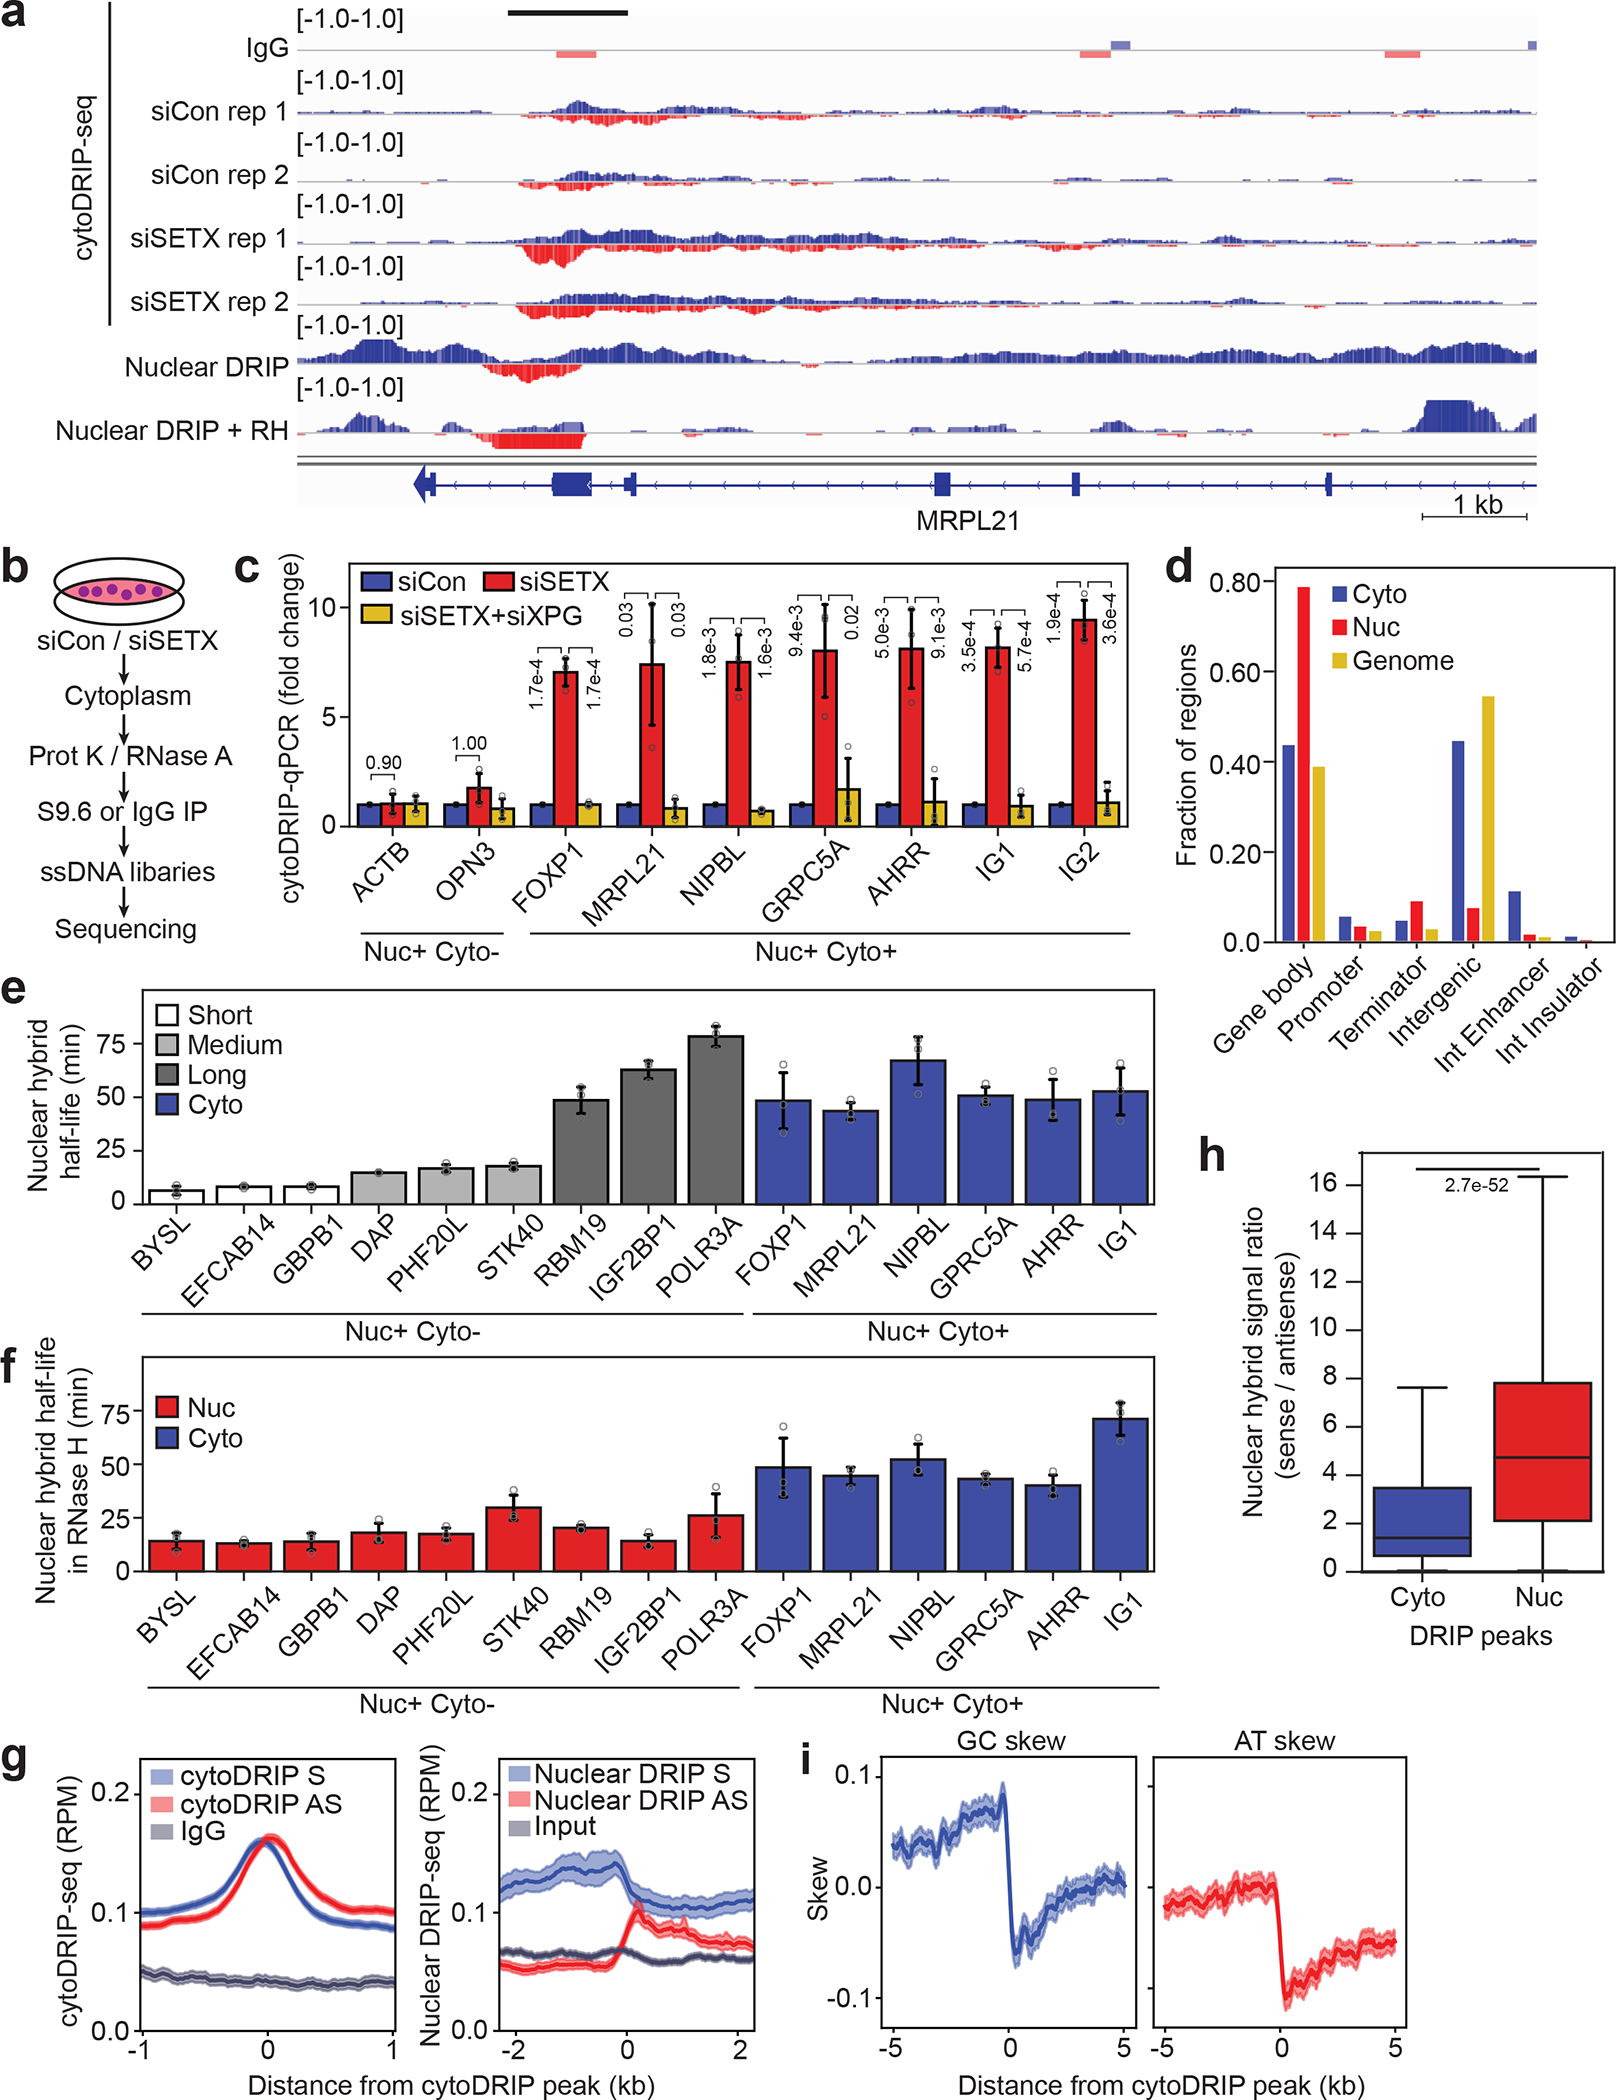
(a) Genomic tracks showing stranded signal (red = positive, blue = negative) for cytoDRIP-seq (IgG, siCon, siSETX), nuclear DRIP-seq and nuclear DRIP-seq + RH21. Black bar shows peak.
(b) CytoDRIP-seq workflow.
(c) CytoDRIP-qPCR after depletion of SETX and/or XPG. P-values are shown in the figure, unpaired, two-tailed t-test.
(d) Genomic distributions of peaks from cytoDRIP-seq (Cyto), nuclear DRIP-seq (Nuc) and genome values (Genome). Int: intergenic. P = 1.0e-16 between Cyto, Nuc, Genome, Kruskal-Wallis test.
(e) Nuclear hybrid half-lives following transcription inhibition. Short, medium and long R-loop lifetimes were derived previously21, P = 1.6e-7 between nuclear DRIP sites with short or medium lifetimes and cytoDRIP sites (two-sided Mann Whitney U test).
(f) Nuclear hybrid half-lives following in vitro RH treatment. P = 2.3e-7 between nuclear DRIP and cytoDRIP sites (two-sided Mann Whitney U test).
(g) Plots around siSETX cytoDRIP regions showing cytoDRIP-seq (left) and nuclear DRIP-seq (right) defined by transcription direction: sense-strand signal (blue), antisense-strand signal (red), IgG or input (grey). Mean of 1762 genic peaks (n = 1762).
(h) Boxplot showing ratios of sense/antisense nuclear hybrid signal in siSETX cytoDRIP (Cyto, n = 984) and nuclear R-loop (Nuc, n = 30,446) peaks. P-value is shown; two-sided Mann Whitney U test. Center line, median; box limits, 75 and 25 percentiles, whiskers, min and max values.
(i) Plots around siSETX cytoDRIP regions from (g) showing GC skew (blue) and AT skew (red).
In c), e) and f): ‘Nuc+ Cyto+’ sites (blue) were found in the nucleus and cytoplasm, ‘Nuc+ Cyto−’ sites (red) only in the nucleus. Gene names are indicated; IG1/IG2 are intergenic sites. Shown is the mean ± s.d. from three biological replicates (n = 3).
In g) and i) error bands show 95% CI of the mean.
By comparing cytoDRIP-seq and nuclear DRIP-seq signals21, we found that most cytoDRIP regions overlapped sites that form nuclear RNA-DNA hybrids (Fig. 2A, Extended Data Fig. 4e), as expected. However, cytoDRIP regions collectively occupied a much smaller area of the genome (Extended Data Fig. 3C), and peak lengths were smaller than those for nuclear R-loops (Extended Data Fig. 4f), indicating that cytoplasmic hybrids are derived from a small subset of nuclear R-loops, and that only a portion of nuclear R-loops may be susceptible to processing. CytoDRIP peak strength did not correlate with nuclear DRIP-seq levels (Extended Data Fig. 4g), or nascent transcription levels as measured by GRO-seq (Extended Data Fig. 4h), and well-studied sites of abundant nuclear R-loop formation did not generate cytoplasmic hybrids (Extended Data Fig. 4i,j). Therefore, highly transcribed, abundant R-loops are not necessarily susceptible to processing and cytoplasmic accumulation. We also asked whether XPG was preferentially recruited to genomic R-loops corresponding to cytoDRIP sites, as compared to nuclear R-loop sites not represented in the cytoplasm. Using a knock-in cell line expressing GFP-tagged XPG (Extended Data Fig. 4k), we performed ChIP-qPCR against GFP. XPG binding increased upon SETX loss specifically at hybrid sites found in the cytoplasm, but not at other nuclear R-loop sites (Extended Data Fig. 4l). Overall, these data suggest that certain genomic R-loops become more susceptible to XPG-dependent processing in the absence of SETX.
Hybrid sequences and stability
We next asked whether the stability of genomic hybrids affects the likelihood of cytoplasmic hybrid accumulation. Previous modeling revealed a range of nuclear hybrid lifetimes on the genome, with an average half-life of 11 min21,22. Using actinomycin D to inhibit transcription and new R-loop formation, we probed the lifetimes of nuclear R-loops from which the cytoDRIP signal was derived, using for comparison previously identified21 short, medium and long-lived nuclear hybrids (Fig. 2e, Extended Data Fig. 5a, b). Strikingly, we estimated R-loop half-lives of 43–67 min from the cytoDRIP-seq sites tested, indicating that these R-loops are particularly long-lived on the genome (Fig. 2e). We also observed a strong association between cytoDRIP sites and a subset of nuclear RNA-DNA hybrids that were previously identified as partially resistant to RNase H treatment21,23 (Fig. 2a, Extended Data Fig. 4e, 5c). An in vitro RNase H titration combined with high-resolution nuclear DRIP-qPCR confirmed that cytoplasmic hybrids map to nuclear R-loop regions that are less sensitive to RNase H and require longer treatment for degradation (Fig. 2f). However, long genomic half-life and RNase H-resistance were not sufficient determinants of R-loop processing, since multiple long-lived or RNase H-resistant R-loops were not identified in the cytoplasm by cytoDRIP-seq (Extended Data Fig. 3c, Extended Data Fig. 5d).
Interestingly, when averaging across all cytoDRIP peaks, we observed that the sense and antisense cytoplasmic and nuclear hybrid signals formed two distinct peaks, with the antisense signal shifted approximately 100 nucleotides downstream (Fig. 2a, g). This suggests that cytoplasmic hybrids are derived from genomic regions that have adjacent and potentially overlapping nuclear RNA-DNA hybrids on both strands in a convergent (i.e. head-on) orientation (Extended Data Fig. 6a). To test this, we calculated the ratio between sense and antisense nuclear hybrid signal within each cytoDRIP peak and, for comparison, within each nuclear DRIP peak. As expected, the nuclear hybrid ratios within nuclear DRIP peaks were much higher than one, reflecting that hybrid signal within nuclear R-loops is predominantly derived from the sense strand (Fig. 2h). However, the ratios within cytoDRIP peaks were smaller and close to one, indicating that these are sites in which both sense and antisense hybrids form. This is consistent with hybrid formation associated with sites of convergent transcription. We next analyzed nucleotide features of the cytoDRIP peaks. While cytoDRIP regions had overall similar GC and AT content relative to nuclear R-loop regions (Extended Data Fig. 6b), they exhibited abrupt switches in the polarity of GC and AT skew (asymmetry in G content and A content between DNA strands, respectively), shifting from high to low skew at the center of the peak (Fig. 2i). Similar patterns in nucleotide skew were not observed for nuclear DRIP-seq24–26 (Extended Data Fig. 6c). Since R-loops are known to form preferentially at and be stabilized by GC-skewed regions24, the overlapping, convergent hybrid signal and nucleotide skew observed at cytoDRIP peaks may promote the formation of particularly stable nuclear R-loops.
Notably, the small number of cytoDRIP sites identified in control cells exhibited similar characteristics to those induced by SETX loss (Extended Data Fig. 6d–f), suggesting that there is a low basal level of hybrid processing that occurs on the genome that is dramatically increased when nuclear R-loop dynamics are perturbed. Taken together, our results indicate that the cytoplasmic hybrids observed after SETX loss are derived from a small subset of nuclear R-loop regions that are partially RNase H-resistant, relatively long-lived, and may result from convergent transcription at sites of nucleotide skew.
Hybrid-activated innate immune responses
Cellular nucleic acids can stimulate immune responses via pattern recognition receptors (PRRs)8,10,15,27–29, and deregulation of R-loops has been linked to this signaling17,30–33. Whether cytoplasmic hybrids resulting from nuclear R-loop processing contribute to this response is unknown. We found that depletion of SETX or BRCA1, or PlaB treatment, triggered an increase in phosphorylation of IRF3 on serine 386 (pIRF3) (Fig. 3a, Extended Data Fig. 7a–d), a marker of IRF3 immune signaling. This phosphorylation was reduced by expression of nuclear-localized wild-type RNase H1 (NLS-RH), but not catalytically-inactive NLS-dRH (Fig. 3a, Extended Data Fig. 7e). Several IRF3 effectors, including interferon-beta (IFNβ) and several interferon-stimulated genes (ISGs), were also upregulated in an RNaseH-reversible manner (Fig. 3b, Extended Data Fig. 7f). More importantly, depletion of XPG or XPF by siRNA (Fig. 3c, d) or using AID-tagged XPG (Fig. 3e, Extended Data Fig. 7g) reversed this signaling. These observations couple IRF3 signaling to nuclear R-loop processing.
Figure 3. Cytoplasmic RNA-DNA hybrids derived from R-loop processing activate IRF3 signaling and induce apoptosis.
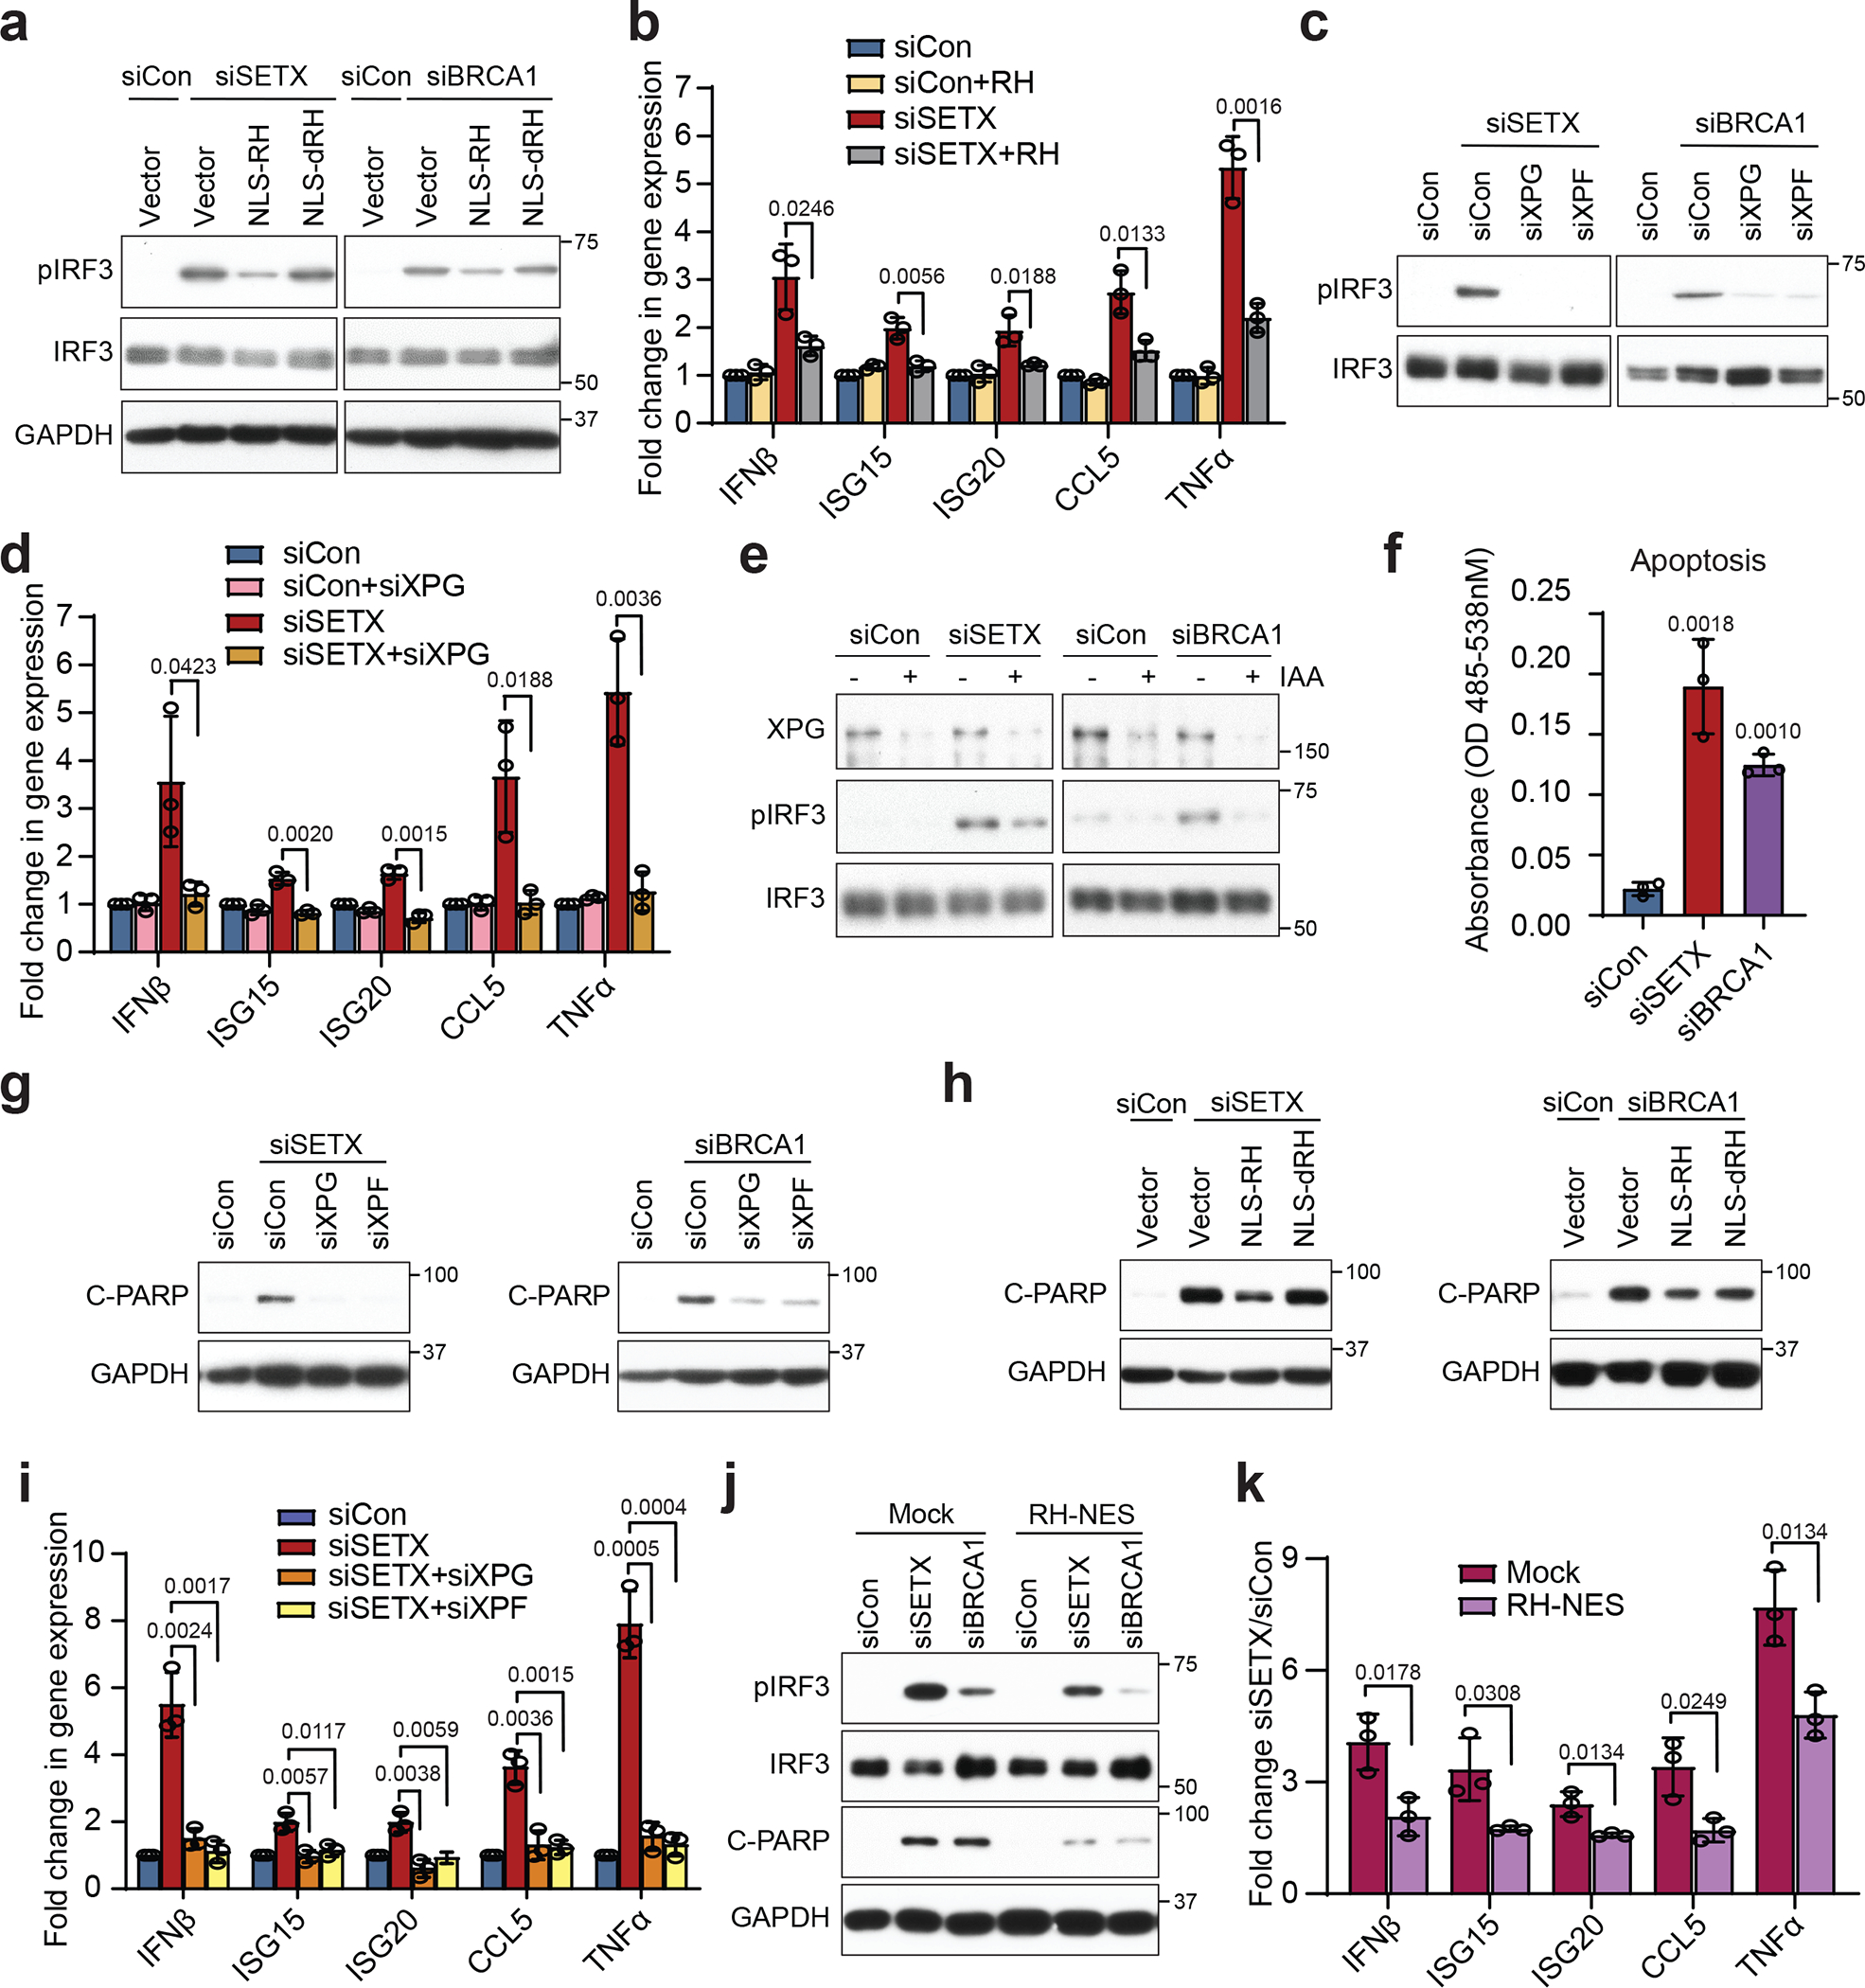
(a) Western blot of pIRF3 upon expression of empty vector, human NLS-tagged RNase H1 (RH), or NLS-tagged RNase H1 catalytically-dead mutant D210N (dRH) in SETX- and BRCA1-deficient HeLa cells. GAPDH is the loading control.
(b) RT-qPCR measurements of IRF3 effectors upon knockdown of SETX and overexpression of RNase H in HeLa cells.
(c) As in (a) with XPG or XPF knockdown in HeLa cells.
(d) As in (b) with XPG knockdown in HeLa cells.
(e) pIRF3 levels upon knockdown of SETX or BRCA1 with IAA treatment to induce XPG degradation in HeLa AID-tagged XPG degron cells.
(f) Caspase 3 activity after depletion of either SETX or BRCA1 in HeLa cells.
(g) Western blots of cleaved PARP (C-PARP) upon depletion of XPG or XPF in siSETX- or siBRCA1-treated HeLa cells. GAPDH serves as the loading control.
(h) As in (g) upon expression of empty vector, RH or dRH in HeLa cells.
(i) RT-qPCR measurements of IRF3 effectors upon knockdown of SETX and XPG or XPF in BAX−/−BAK−/− HeLa cells.
(j) Western blots of pIRF3 and C-PARP upon knockdown of SETX or BRCA1 in HeLa cells stably expressing GFP (Mock) or NES-tagged RH (RH-NES).
(k) RT-qPCR measurements of IRF3 effectors in mock and RH-NES HeLa stable cell lines upon SETX knockdown.
All bar graphs represent the mean ± s.d., n = 3 independent biological replicates (two-tailed t-test with CI = 95%). P values are shown at the top of the graphs.
IFNβ and some ISGs upregulated by IRF3 signaling are known to induce apoptosis34. We found that cleaved-PARP (C-PARP)35 and caspase 3 activity36 were induced upon loss of SETX or BRCA1 in a manner that was blocked either by knockdown of the R-loop processing factors XPG and XPF, or expression of NLS-RH (Fig. 3f–h, Extended Data Fig. 7h,i). Additionally, the proinflammatory and apoptosis factor TNFα37 was elevated upon R-loop processing (Fig. 3d), and its knockdown reduced C-PARP levels (Extended Data Fig. 7j). These findings indicate that apoptosis, mediated in part by TNFα, is a consequence of R-loop processing. Importantly, R-loop-induced, XPG and XPF-dependent IRF3 signaling was also observed in BAX−/− BAK−/− cells (Fig. 3i, Extended Data Fig. 7k). These results demonstrate that the innate immune response can be triggered by R-loop processing independent of apoptosis.
Finally, to establish whether cytoplasmic DNA-RNA hybrids can directly induce the immune response observed in SETX- and BRCA1- deficient cells, we stably expressed cytoplasmically-localized RNase H (RH-NES) in these cells. We observed efficient digestion of cytoplasmic hybrids (Extended Data Fig. 7l,m) as well as diminished innate immune signaling and apoptosis when RH-NES was expressed (Fig. 3j, k). Hence, while other nucleic acids could contribute to activation of the innate immune response, our findings strongly suggest that cytoplasmic RNA-DNA hybrids directly contribute to its activation and to apoptosis in these cells.
cGAS and TLR3 sense cytoplasmic hybrids
To test which innate immune sensor mediates the activation of IRF3 when R-loops are induced, we knocked-down TLR3, RIGI or MDA5, or inhibited cGAS using RU52138 in SETX-deficient cells. Inhibition of cGAS, depletion of TLR3 or knockout of either protein strongly reduced pIRF3 and downstream effectors, whereas depletion of RIGI or MDA5 had only a modest effect (Fig. 4a, Extended Data Fig. 8a–f). Consistently, combined cGAS inhibition and TLR3 knockdown fully suppressed activation of IRF3 downstream effectors (Fig. 4a, b, Extended Data Fig. 8g,h) and apoptosis (Fig. 4c, Extended Data Fig. 8i) in SETX/BRCA1-deficient cells. We also excluded the possibility that cGAS or TLR3 depletion regulates pIRF3 levels indirectly by reciprocally affecting protein levels (Extended Data Fig. 8j). These observations indicate that R-loop-induced IRF3 signaling is mediated primarily by cGAS and TLR3.
Figure 4. R-loop-derived cytoplasmic RNA-DNA hybrids trigger IRF3 signaling via the cGAS and TLR3 receptors.
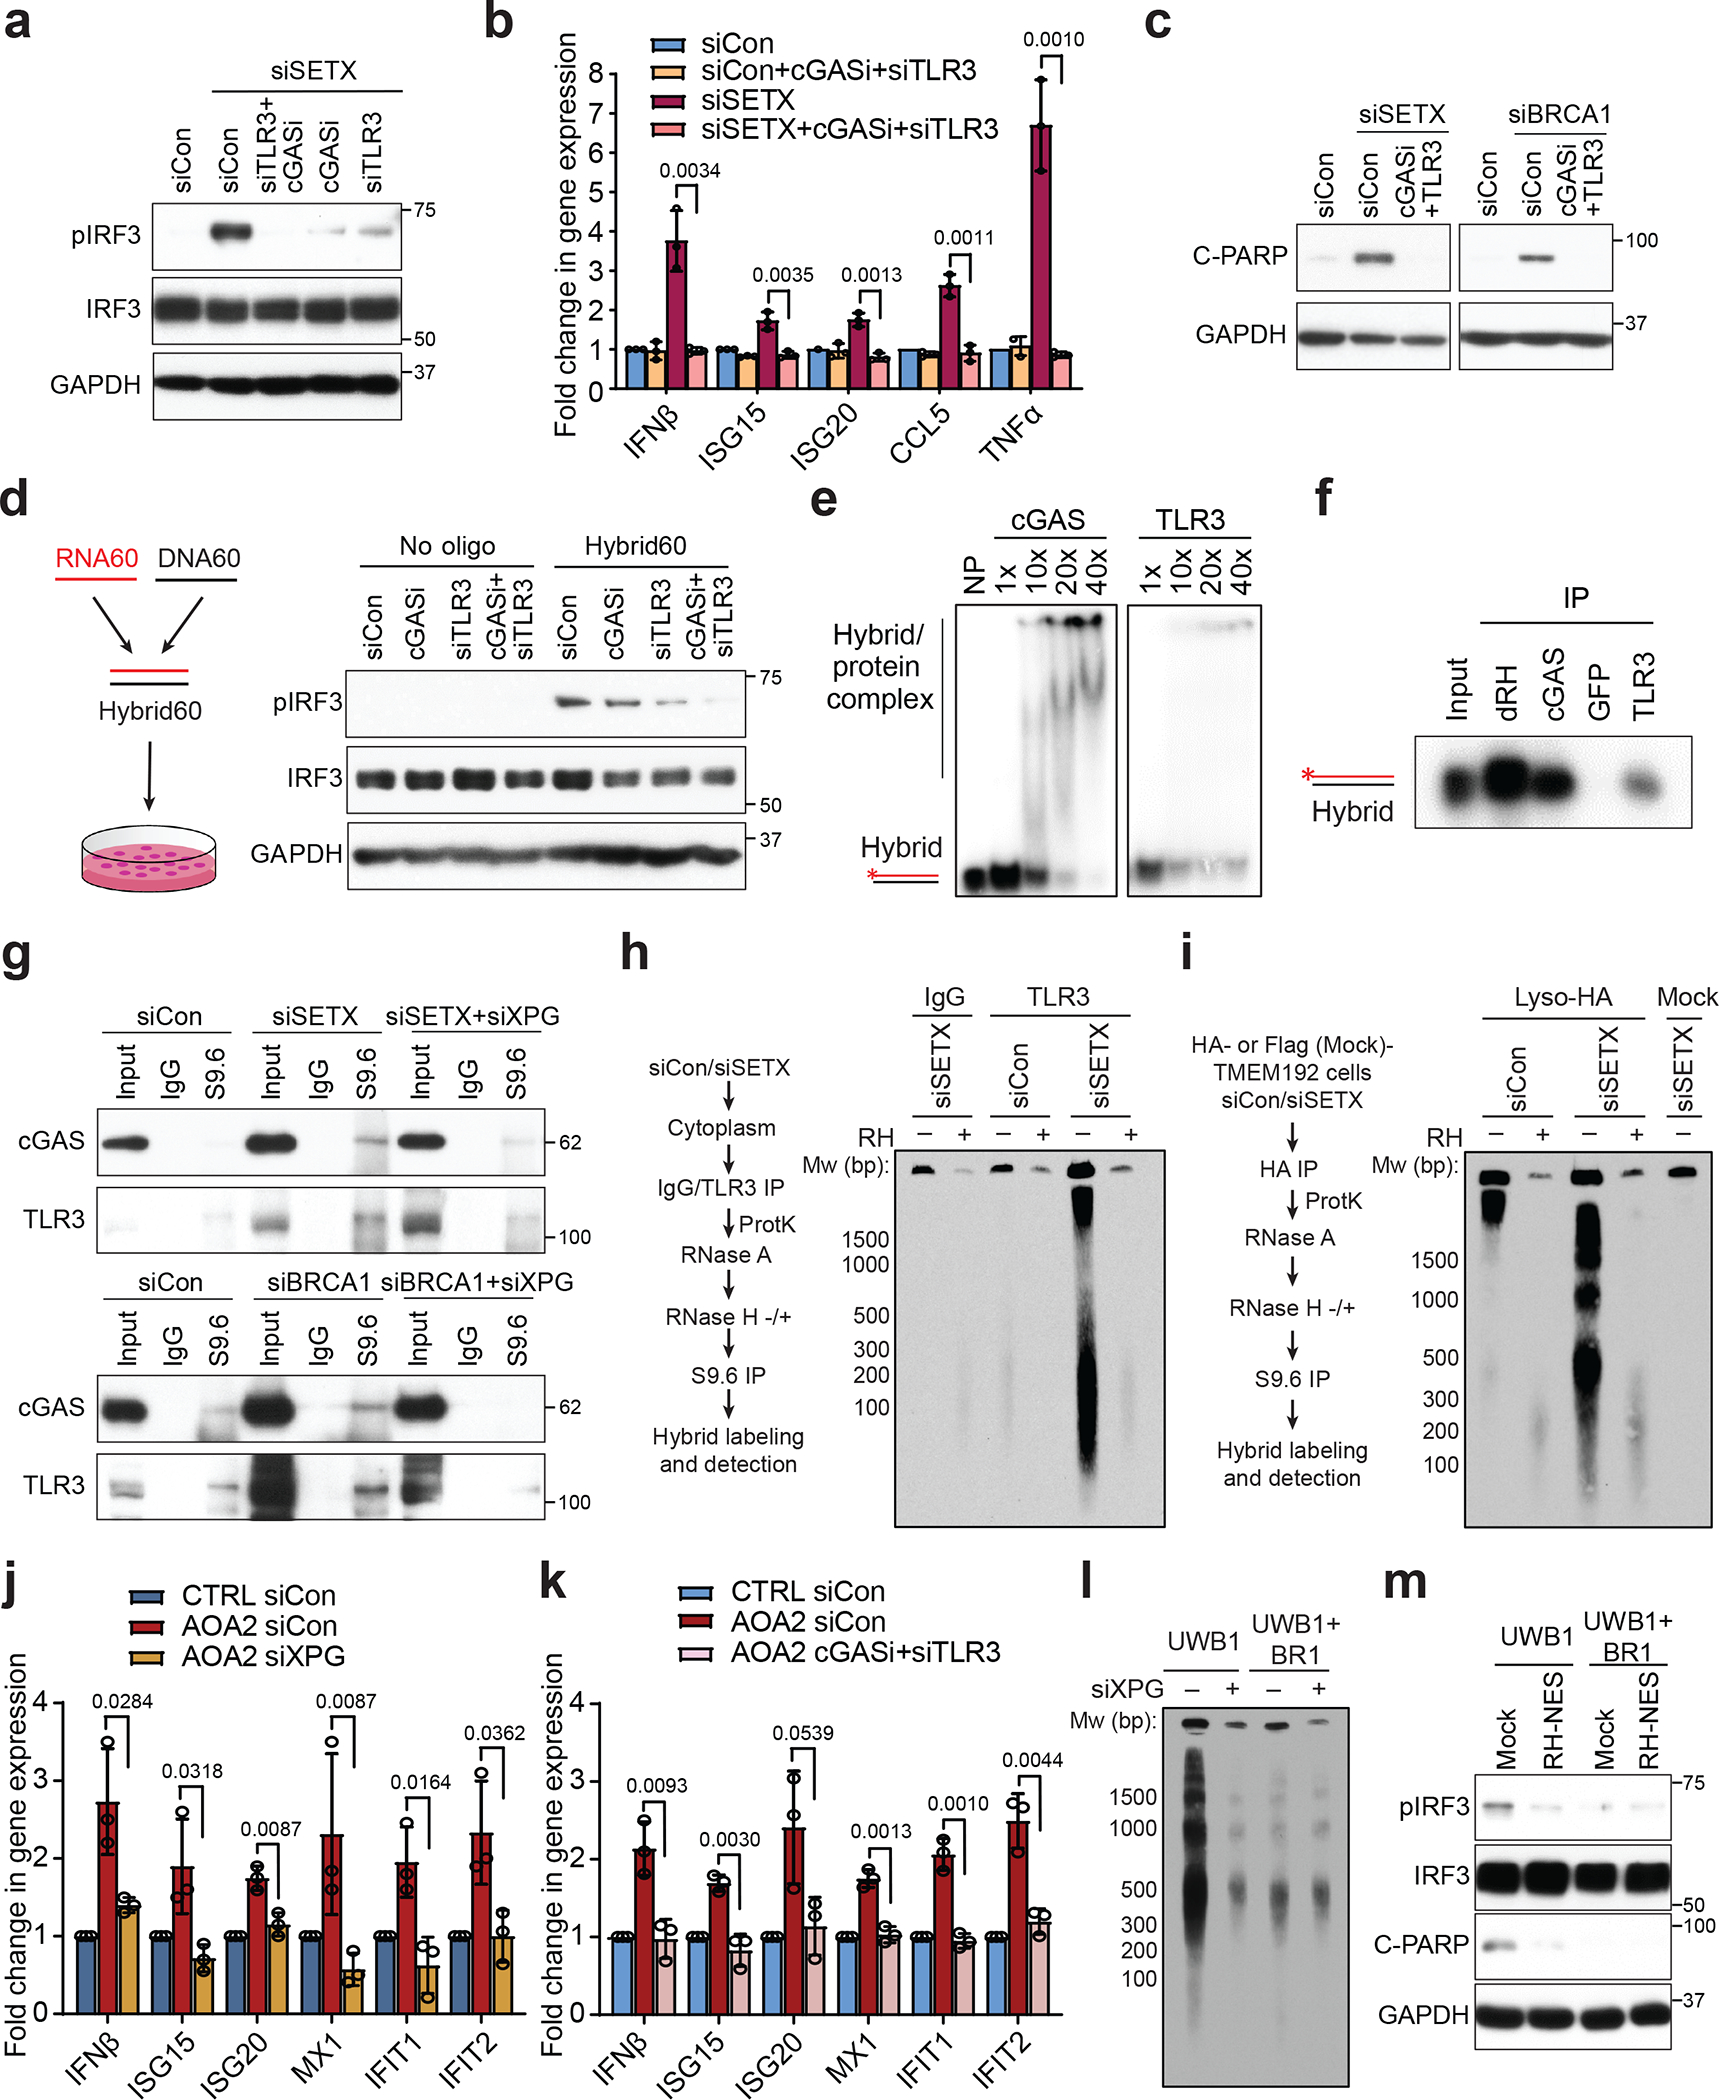
(a) Dependence of SETX knockdown-induced pIRF3 level on cGAS or TLR3 in HeLa cells.
(b) RT-qPCR measurements of IRF3 effectors upon knockdown of SETX and TLR3 and cGASi treatment in HeLa cells.
(c) Western blots of C-PARP upon perturbation of immune receptors in SETX- or BRCA1-depleted HeLa cells.
(d) Western blot of pIRF3 upon TLR3 or cGAS loss after synthetic RNA:DNA hybrid transfection.
(e) Gel shift assay showing in vitro binding of cGAS and TLR3 to RNA-DNA hybrids. NP: no protein.
(f) In vitro pull-down assay showing hybrid binding activity of purified cGAS and TLR3. dRH and GFP are positive and negative controls respectively.
(g) Coimmunoprecipitation of cGAS or TLR3 with cytoplasmic hybrids upon knockdown of SETX or BRCA1, with or without XPG knockdown.
(h) cytoDRIP blot of TLR3-associated hybrids in the cytoplasm of control and SETX-depleted HeLa cells, with mock and RH treatment prior to hybrid pull-down. dsDNA markers are indicated in bp.
(i) LysoIP blot shows RNA-DNA hybrid levels in the endolysosome of control and SETX-depleted HA-TMEM192 HEK293T cells, with or without RH treatment prior to hybrid pull-down. Flag-TMEM192 HEK293T cells: mock control.
(j) RT-qPCR measurements of IFNβ and ISGs in CTRL and AOA2 fibroblasts upon knockdown of XPG.
(k) As in (j) upon cGAS inhibition and TLR3 knockdown.
(l) cytoDRIP blot showing cytoplasmic hybrid production upon XPG knockdown in UWB1.289 and UWB1.289+BRCA1 cells.
(m) Western blot of pIRF3 and C-PARP in UWB1.289 and UWB1.289+BRCA1 cells stably expressing GFP (mock) and RH-NES.
Bar graphs represent the mean ± s.d. n = 3 independent biological replicates (two-tailed t-test with CI = 95%). P values are shown at the top of the graphs.
We then sought to elucidate whether cGAS and TLR3 recognize cytoplasmic RNA-DNA hybrids in SETX-deficient cells. Consistent with previous reports, cGAS-dependent IRF3 signaling could be activated by synthetic RNA-DNA hybrids32,39. Surprisingly, RNA-DNA hybrids also induced TLR3-dependent IRF3 signaling (Fig. 4d, Extended Data Fig. 8k). Both TLR3 and cGAS also bound RNA-DNA hybrids directly in vitro, as well as their canonical ligands, dsRNA and dsDNA8, respectively (Fig. 4e,f, Extended Data Fig. 8l,m). In addition, the knockdown of SETX or BRCA1 led to the association of cGAS and TLR3 with cytoplasmic hybrids in a manner that was abrogated by the knockdown of XPG, removal of hybrids by in vitro RNase H treatment, or competition with a synthetic hybrid (Fig. 4g, Extended Data Fig. 9a–d). These results suggest that cGAS and TLR3 directly recognize endogenous, R-loop-derived cytoplasmic RNA-DNA hybrids.
To confirm the interaction of TLR3 with cytoplasmic hybrids, which has not been reported, we immunoprecipitated TLR3 from the cytoplasm and probed for hybrids. We observed an RNaseH-sensitive increase in TLR3 co-associated cytoplasmic hybrids in SETX-deficient cells (Fig. 4h, Extended Data Fig. 9e), consistent with the S9.6 co-IP results (Fig. 4g). We also asked if we could observe RNA-DNA hybrids in acidified endolysosomal compartments where TLR3 is enriched40 by isolating lysosomes using the HA-tagged lysosomal transmembrane protein TMEM19241 and then performing an S9.6 IP (Extended Data Fig. 9f). We observed an increase of RNA-DNA hybrids in endolysosomes upon SETX depletion (Fig. 4i, Extended Data Fig. 9g–i). In addition, we found cGAS did not interact with TLR3 in the cytoplasm (Extended Data Fig. 9j,k). These observations strongly suggest cGAS and TLR3 directly sense R-loop-derived cytoplasmic RNA-DNA hybrids in the cytosol and endolysosomes, respectively, and cooperate to activate IRF3-mediated signaling (Extended Data Fig. 9l).
Pathological hybrids and disease
Finally, we asked whether IRF3 signaling can be triggered by R-loops that accumulate under pathological conditions. We used a cell line derived from an individual with the neurodegenerative disease ataxia oculomotor apraxia type 2 (AOA2), harboring a loss of function SETX mutation9,42,43, and the UWB1.289 human ovarian cancer cell line, in which BRCA1 is mutated10. Cytoplasmic hybrids were induced in AOA2 patient-derived fibroblasts in an XPG-dependent manner (Extended Data Fig. 10a–c). Additionally, IFNβ and several ISGs were increased in an XPG- and cGAS/TLR3-dependent manner in AOA2 fibroblasts (Fig. 4j,k, Extended Data Fig. 10d,e), as well as in control fibroblasts following SETX depletion (Extended Data Fig. 10f,g). Similarly in UWB1.289 BRCA1-deficient cells, we observed increased cytoplasmic hybrids (Fig. 4l, Extended Data Fig. 10h,i) and an NES-RH-sensitive immune response and apoptosis, compared to isogenic controls in which BRCA1 is restored (Fig. 4m, Extended Data Fig. 10j,k). Interestingly, cytoplasmic hybrids, as well as an XPG-dependent and NES-RH-sensitive immune response and apoptosis were also observed after knockdown of SAMHD1 (Extended Data Fig. 10l–o), which is mutated in the autoimmune disease Aicardi-Goutières syndrome (AGS)28. Altogether, these data indicate that R-loop-induced accumulation of cytoplasmic RNA-DNA hybrids and subsequent activation of the innate immune response and apoptosis can be observed in several models for human disease.
DISCUSSION
Here, we describe the discovery of cytoplasmic RNA-DNA hybrids as immunogenic products of R-loop processing (Extended Data Fig. 9l). We show that cytoplasmic hybrids accumulate when nuclear R-loop metabolism is deregulated, and that this accumulation depends on the endonucleases XPG and XPF. Importantly, we find that endogenous cytoplasmic hybrids are sensed by the immune receptors cGAS and TLR3, whose canonical activation has been ascribed to DNA and RNA, respectively. We thus reveal a previously unknown arm of the innate immune response and establish cellular RNA-DNA hybrids as drivers of IRF3 signaling which, when accumulated aberrantly at high levels, can induce apoptosis. Interestingly, low but detectable levels of cytoplasmic hybrids are present in unperturbed cells, suggesting that XPG-mediated excision may be a mechanism used to remove a small subset of persistent R-loops. However, when R-loops are deregulated or resolution pathways disrupted, some genomic R-loops become susceptible to nucleolytic processing, raising the levels of cytoplasmic hybrids above a critical threshold for IRF3 activation.
How R-loop processing is regulated remains unclear, as is the mechanism by which these hybrids leave the nucleus, but our findings suggest these pathways occur throughout the cell cycle and are focused on a subset of nuclear R-loops. Using next-generation sequencing on biochemically purified cytoplasmic hybrids from SETX-deficient cells, we traced their origin to genomic R-loops that are highly stable and exhibit distinct sequence properties, consistent with convergent transcription and hybrid formation. We envision that the increased stability of hybrids formed at these sites, stalled RNA polymerases and potential secondary structure formation may render them more prone to XPG-mediated processing. Many hybrids were enriched in the cytoplasm only upon loss of SETX, suggesting that these R-loop sites are normally resolved by this RNA-DNA helicase and hence not usually vulnerable to processing. Furthermore, XPG-dependent cytoplasmic hybrid accumulation, immune activation and apoptosis were observed in AOA2 patient-derived cells and UWB1 human ovarian cancer cells, which harbor mutated SETX and BRCA1. These results suggest that aberrant R-loop processing and subsequent innate immune activation may be pathological processes that could differentially affect disease outcome based upon the cellular context. For example, such processing may contribute to cell death when associated with neurodegenerative diseases but act as a protective mechanism during early oncogenesis to remove genomically unstable cells in cancer cells with mutated BRCA1 or deregulated splicing36,44.
Our findings therefore reveal a new mechanistic connection linking R-loop deregulation and processing with innate immune activation that could be relevant to many human diseases. They also suggest the innate immune response may represent a second, distinct pathological response to R-loops beyond canonical DNA damage mechanisms.
METHODS
Cell culture and transfection
HeLa, HCT116, MCF10A and 293T cells were obtained from ATCC, where they were tested for mycoplasma and verified by STR profiling, and grown in DMEM (Gibco) supplemented with 10% FBS and 1% penicillin/streptomycin/glutamine (PSG). Control normal foreskin (CTRL) fibroblasts and AOA2 patient-derived (SETX-1RM) fibroblasts9 (gifts from Stephen West), were cultured in DMEM supplemented with 15% FBS and 1% PSG (lacking FBS for serum starvation for 3 days). UWB1.289 (UWB1) or UWB1.289+ BRCA1 (UWB1+BR1) reconstituted cells (gifts from Roger Greenberg10) were cultured in 1:1 RPMI1640 and MEGM (BulletKit, Lonza) with 10% FBS, penicillin and streptomycin. MCF10A cells were cultured in 1:1 DMEM and F12 media, 5% horse serum, 0.5 μg/ml hydrocortisone, 10 μg/ml insulin, 20ng/ml EGF, 100 ng/ml Cholera Toxin, and 1% PSG (for serum starvation, media lacking horse serum and EGF was used for 48 h). All cells were grown in a 37°C humid incubator with 5% CO2. siRNA transfections were performed by using Lipofectamine RNAiMax (ThermoFisher) and 20 nM siRNA (Supplementary Table 1). Plasmid DNA transfections were performed with FuGENE HD (Promega) for 48 h or as indicated. For transfection into AID-fused XPG degron cells, 4 mM indole-3-acetic acid (IAA, Sigma) or an equal volume of DMSO was added to the culture medium immediately after transfection. The following inhibitors were used for the times indicated: 2 μg/ml cGAS inhibitor (cGASi) RU.521 (Invivogen), 500 nM Pladienolide B (Cayman Chemicals) and 5 nM Leptomycin B (LMB) (Cayman Chemicals).
Immunofluorescence
Immunofluorescence experiments with GFP-dRH protein were performed as described12. For Cyclin B1, cells were fixed with 4% paraformaldehyde for 20 min at room temperature and permeabilized with 0.25% Triton X-100 and in Cyclin B1 antibody at 4°C overnight, then finally incubated with 5 ng/mL DAPI, 0.2 μL HCS Cellmask Deep Red (Thermo Fisher Scientific) and Alexa Fluor 488. Coverslips were mounted onto glass slides using Prolong Glass antifade mountant (Thermo Fisher Scientific). Antibody dilutions can be found in Supplementary Table 1.
Image acquisition and analysis
For GFP-dRH analysis, images were acquired as described12. Using CellProfiler (v4.2.1), the DAPI channel was used to identify nuclei using the IdentifyPrimaryObjects module, Primary Objects and whole cell stain were then used to identify cells as Secondary Objects. The cytoplasmic area was identified as a Tertiary Object from the whole cells shrunk by one pixel and nuclei expanded by three pixels. The mean intensity for each cytoplasmic area was calculated and exported. For epifluorescence imaging, a Zeiss OBSERVER.Z1 INVERTED microscope was used with a Plan-APO 40x/1.4 Oil DIC (UV) VIS-IR objective. Images were adjusted equally in ImageJ (version 2.0.0).
Cell cycle analysis
To monitor cell cycle synchronization in MCF10As, cells were incubated with 10 μM 5-Bromo-2’-deoxyuridine (BrdU) and processed according to the manufacturer’s guidelines (BD Biosciences). Data analysis was done using FlowJo v3.05 and the gating strategy is shown in Supplementary Figure 2. For fibroblasts, cells were incubated with 10 μM EdU for 30 min and processed45.
CytoDRIP
Cells (10–50 ×106) were harvested using trypsin, washed in PBS and pelleted by centrifugation and fractionated using the Nuclear and Cytoplasmic Extraction kit (Thermo Fisher Scientific). Cytoplasmic or nucleoplasmic fractions were recovered and incubated in 0.4% SDS and 40 μg/ml of proteinase K (Thermo Fisher Scientific) for 90 min at 37°C. Samples were resuspended in ultrapure water, adjusted to 550 mM NaCl and treated with RNase A (1 μg/mL) for 25–45 min. For RNase H treatment, samples were digested overnight in 1× NEB RNase H buffer and RNase H (0.4 U/μL). Samples were then normalized by protein concentration in the cytoplasmic extract or to equal cell counts. For immunoprecipitation, 16 μg of S9.6 antibody or mouse IgG were bound to Dynabeads Protein G beads (Thermo Fisher Scientific) in 1× binding buffer (20 mM Tris-HCl pH 8.0, 2 mM EDTA, 1% Triton X-100, 150 mM NaCl, 0.5% sodium deoxycholate) for 4–6 h at 4°C. In parallel, samples were resuspended in 1× TE buffer and then pre-cleared with Dynabeads Protein G for 1–2 h in 1× binding buffer. Pre-cleared genomic samples were then added to S9.6 or IgG-bound beads and incubated overnight with rotation at 4°C. Bound beads were washed with TE and then with TSE buffer (20 mM Tris-HCl pH 8.0, 2 mM EDTA, 1% Triton X-100, 0.1% SDS, 150 mM NaCl). Elution was performed in 200 μL elution buffer (50 mM Tris pH 8, 10 mM EDTA, 0.5% SDS, 8 μl Proteinase K 20 mg/ml) for 50 min at 50°C. For cytoplasmic hybrid association with TLR3, hybrids were first enriched with TLR3 IP, eluted in elution buffer as described above, before the second IP with S9.6. For cytoDRIP-qPCR, samples were resuspended in ultrapure water and analyzed. For cytoDRIP blotting, eluted samples were resuspended in TE buffer and 3’-end labelled with 2 μM biotin-11-dUTP (Biotium) and 0.2 U/μl of TdT (NEB) in 1× TdT reaction buffer supplemented with 0.25 mM CoCl2 for 45 min at 37 °C. The labeling reactions were stopped by addition of 20 mM EDTA and put on ice. The reactions were then incubated with 0.4% SDS and 40 μg/ml of proteinase K for 40 min at 37 °C. About 100 ng of 100 bp DNA ladder (NEB) was labeled in an identical reaction for use as a molecular weight marker during gel electrophoresis. The labeled samples were separated on 4–20% TBE gels, transferred onto Biodyne B Nylon membranes (Thermo Fisher Scientific), and fixed by UV crosslinking. Membranes were processed as described46 and chemiluminescence was detected by X-ray film. Uncropped gel images are in Supplementary Fig. 1.
Nuclear DRIP-qPCR
This was performed as described previously21. For hybrid lifetime analysis, actinomycin D (2 μg/mL, Cayman Chemical Company) was added prior to harvest. For RNase H titration, samples were treated after cell lysis and prior to immunoprecipitation in 200 μl reaction volumes as follows: 13 μg DNA with 0.5 U RNase H for 5 min; 13 μg DNA with 0.5 U RNase H for 15 min; 13 μg DNA with 2.5 U RNase H for 45 min; 5.5 μg DNA with 100 U RNase H for for 16 h; 5.5 μg DNA with 100 U RNase H for for 40 h.
Library preparation and sequencing for cytoDRIP-seq
After elution, genomic material was resuspended in TE buffer and sonicated to a peak fragment size of 300 bp, performed on a Covaris machine (E220 evolution) (10% Duty Factor, 200 cycles/burst, 140 peak incident power, 30 s per tube). DNA libraries were synthesized from ssDNA using the Accel-NGS 1S DNA library kit (Swift Biosciences) as described21. Library DNA was sequenced on a HiSeq 4000 (Illumina) at the Stanford Genome Sequencing Service Center, using 2 × 150 bp sequencing.
Chromatin immunoprecipitation (ChIP)
5–15 million cells were cross-linked per ChIP sample in 25 mL PBS with 1% methanol-free formaldehyde for 10 min and quenched with a final concentration of 0.125 M glycine for 5 min with nutation. Samples were processed as described47. 7.5 μg GFP antibody was added per ChIP sample and incubated overnight at 4°C. 50 uL of Protein G Dynabeads (ThermoFisher) were blocked with Block solution (0.5% BSA (w/v) in 1X PBS) and then added to antibody-bound chromatin for 4 h, washed and eluted. ChIP and input samples were purified by phenol-chloroform-isoamylalcohol extraction and ethanol precipitated. Antibodies used are in Supplementary Table 1.
qPCR
Cells were collected 48 h after transfection and lysed with Trizol (Invitrogen). RNA was isolated by phenol–chloroform extraction and converted to cDNA using SuperScript® III First-Strand Synthesis System (Invitrogen). qPCR was performed on a Roche LightCycler 480 Instrument II using SYBR-Green master mix (Bio-Rad Laboratories). To measure the transcription level, primers recognizing the transcript of genes of interest and β-Actin, serving as internal control, were designed, and the RNA level of each target gene was normalized to that of β-Actin. For splicing inhibition, cDNA was amplified with primers within different introns to monitor mRNA splicing efficiency. qPCR data was analyzed by Roche LightCycler version 1.5.1. Primers used for qPCR are in Supplementary Table 1. Ct values from qPCR of immune genes are in Source Data Table 1.
cytoDRIP-seq analysis
Trimmed reads (with cutadapt v1.16) were aligned to human genome reference hg38 with bowtie2 (v2.3.4). Reads were separated into positive and negative stranded files using SAMtools (v1.10) and unix text-processing utilities. Genome browser tracks were produced with the BEDTools genomecov utility, normalized to reads per million mapped, and visualized using IGV (v2.8.2). Tracks for nuclear DRIP-seq and RNase H resistant DRIP-seq signal in HeLa cells were generated previously21.
Peak calling
Peaks were called against a merged bam file from all IgG samples using MACS2 with narrow peak settings. BEDTools (v2.29.2) was then used to obtain coverage in each experiment over these consensus peaks. Using these read counts, we filtered out peaks that were highest in IgG coverage (top 5% measured by reads per million), and then filtered only for regions with a peak score > 50. The remaining peaks from two biological replicates were merged for siCon and siSETX samples. This resulted in 2911 peaks that were used for subsequent meta analyses. Strand annotations were assigned by intersecting peaks with genes expressed in HeLa cells21.
Metaplots
Metaplots around cytoDRIP peaks and other genome features were produced using deepTools (v3.2.1). Tracks for GC and AT-skew were generated as described21. GC and AT content within peaks was calculated using bedtools nuc. Ratios of sense and antisense hybrid signal were calculated from the coverage of plus and minus strand reads within the peaksets indicated. Only peaks with at least one sense and one antisense read were included. Data processing for all genomic plots was performed with Python v3.7.13, NumPy v1.21.5 and Pandas v1.3.5. Data were visualized with the Python packages Matplotlib v3.5.1 and Seaborn v0.11.2. Statistical analysis was performed in Python using SciPy v1.7.3.
Analysis of genome features
Analysis of genome compartments overlapping cytoDRIP peaks was performed using CEAS (Cis-Regulatory Element Annotation System). For intergenic enhancer and insulator annotations, ChromHMM annotations for HeLa cells (from UCSC Table Browser) were intersected with intergenic cytoDRIP peaks using bedtools intersect. For DNA repeat elements, RepeatMasker annotations were used. CytoDRIP peaks were sub-sampled 10,000 times (bedtools shuffle) from within all nuclear DRIP peaks. A jaccard coefficient (bedtools jaccard) was calculated for each randomized peak set and the Z-score was calculated from the resulting distribution. Consensus rDNA regions (5.8S: NG_054872.1, 18S: NG_054871.1, 28S: M11167, total rDNA: U13369.1), alpha satellite (M95601.1) were indexed and then sequencing reads aligned to these using bwa mem. For telomere sequence analysis, R1 and R2 reads with >= 3 instances of AATCCC or TTAGGG were counted.
R-loop lifetime and RNase H half-life analysis
Percent inputs were obtained by qPCR for each hybrid region from a time course with actinomycin D treatment or a time course of RNase H treatment and half-lives were derived by fitting an exponential decay function to these measurements. Short, average and long-lived nuclear R-loop sites were identified previously21.
Electrophoretic mobility shift assay (EMSA)
RNA60 and DNA60 oligos were 5’-end labeled with γ-32P–ATP by T4 polynucleotide kinase (NEB) and purified by illustra G-25 microspin column (GE Lifesciences). RNA60 oligo was annealed with unlabeled DNA60 or asRNA60 oligo to form a 60 bp-long hybrid or dsRNA substrate. DNA60 oligo and unlabeled asDNA60 oligo were annealed together to form a dsDNA substrate. For annealing, two oligonucleotides were mixed at 1:1 molar ratio in a buffer containing 1.25 mM EDTA and 12.5 mM Tris-HCl pH7.6. Samples were heated at 95°C for 5 min and were allowed to slowly cool to room temperature. The oligo sequences are listed in Extended Data Table 1. For the EMSA reaction, proteins purified from mammalian cells were mixed with 1 nM labeled substrate at molar ratios ranging from 1:1 to 40:1. Samples were incubated for 30 min at 37 °C in a total volume of 10 μl containing 25 mM Tris-HCl pH 7.5, 50 mM NaCl, 1 mM EDTA pH 8.0, 1 mM DTT, 6% glycerol, 0.1% NP-40, 0.1 mg/ml BSA, RNaseOUT and 0.5 mM PMSF. Afterwards, the samples were run on a non-denaturing 6% polyacrylamide gel in 0.5 × TBE buffer at 4°C and visualized by a Typhoon imager scanner. Uncropped gel images are in Supplementary Fig. 1.
In vitro pull-down
To measure the hybrid-protein binding affinities, we performed the in vitro pull-down by using the radioactivity-labeled 60bp-long RNA-DNA hybrid described above. Flag-tagged proteins were purified from mammalian cells and immobilized to M2 magnetic beads (Sigma). In each reaction, 62.5 fmol hybrid was incubated with a specific protein at 1:10 molar ratio, and 1× binding buffer (25 mM Tris-HCl pH 7.5, 50 mM NaCl, 1 mM EDTA pH 8.0, 1 mM DTT, 0.1% NP-40, 0.1 mg/ml BSA) was added into the reaction to bring the total volume up to 150 μl. Samples were held on a rotator for 3 h at room temperature. After the binding reaction, magnetic beads were washed 3 times with 1× binding buffer to remove the unassociated hybrids. The hybrids still associated with the beads were eluted by proteinase K digestion which was performed in 10 μl 1× binding buffer with 0.1% SDS for 30 min at 37 °C. Eluted samples were analyzed by non-denaturing 6% polyacrylamide gel in 0.5× TBE buffer at 4°C followed by autoradiography imaging. Human RNaseH1 catalytic inactive mutant (D210N) and GFP served as positive and negative controls, respectively. Uncropped gel images are in Supplementary Fig. 1.
Cytoplasmic S9.6 and TLR3 IP
HeLa cells were fractionated as described48. The purity of the cytoplasmic portion was confirmed by analyzing LaminB1 protein using western blot. After fractionation, hybrids in the cytoplasm were enriched by the S9.6 antibody or the TLR3 antibody and 30 μl Protein A/G Agarose (Life Technologies) in IP buffer (150 mM KCl, 0.2 mM EDTA, 5 mM MgCl2, 20 mM Tris-HCl pH8.0, 10% glycerol) at 4°C overnight. Beads were washed three times in the IP buffer and immunoprecipitated material was eluted in Laemmli buffer. For hybrid competition S9.6 co-IP, 15 bp synthetic hybrid annealed by Com-RNA15 and Com-DNA15 were added into the samples at S9.6 IP step as described49, with concentration indicated. Oligonucleotide sequences and antibody amounts used for each IP reaction are in Supplementary Table 1. For RNase H digestion, 50 U/ml RNase H was added to the sample for 1 h at 37°C before the IP step. For detailed information on the S9.6 and TLR3 antibodies used in IPs see Supplementary Table 1.
Immunopurification of lysosomes (LysoIP)
HEK293T HA-Lyso cells expressing TMEM192–3xHA and Control-Lyso expressing TMEM192–2xFLAG41 were cultured as indicated. For each condition, 6×10⁷ cells were processed per IP and 6 IPs performed in parallel41. Cells were quickly rinsed twice with PBS, scraped in 1 mL of PBS, pooled based on condition, then centrifuged at 1000 × g for 2 min at 4°C. Cells were resuspended and divided into six parts of 950 uL PBS. The cells were homogenized with 25 strokes of a 2 mL homogenizer. The homogenate was centrifuged at 1000 × g for 2 min at 4°C and the supernatant containing the cellular organelles including lysosomes was incubated with 100 uL of PBS prewashed anti-HA magnetic beads (ThermoScientific) on a rotator shaker for 3 min at 4°C. IPs were washed thrice with PBS on a DynaMag Spin Magnet. Beads with bound lysosomes were then resuspended in 400 μl DRIP elution buffer with 20 μl Proteinase K, incubated for 1.5 h at 50°C and nucleic acids purified by phenol-chloroform extraction, before continuing with the cytoDRIP protocol. For protein lysates, 2.5% total cells were reserved for the whole-cell fraction. The remaining cells were used for LysoIP as described above, except after the final wash, beads with bound lysosomes were resuspended in 80 μl of lysis buffer (50 mM HEPES pH 7.4, 1% Triton X-100, 10 mM β-glycerol phosphate, 10 mM pyrophosphate, 1.5 mM NaF, 40 mM NaCl, 2 mM EDTA and cOmplete Protease Inhibitor Cocktail), incubated for 30 min on ice, and the supernatant recovered. For the whole-cell fraction, lysis buffer was added to the samples for 30 min and protein extracts recovered after centrifugation at maximum speed for 10 min at 4°C. Uncropped gel images are in Supplementary Fig. 1. Antibodies used in LysoIP are listed in Supplementary Table 1.
Caspase-3 activity
7,000 HeLa cells were seeded into triplicate wells of a 96-well plate containing the transfection reagent-siRNA mixture. Media was refreshed the next morning. 48 h after siRNA transfection, caspase-3 activity was measured by Apo-ONE® Homogeneous Caspase-3/7 Assay’ (Promega) according to manufacturer’s instructions.
Cloning of NLS- and NES- tagged RNase H
For NLS-tagged RNase H, cDNA fragments containing wild type (WT) human RNase H1 and D201N catalytic dead mutant without the first 27 amino acids mitochondrial localization signal were amplified by PCR. Two SV40 nuclear localization signal (NLS) (CCCAAAAAGAAACGCAAAGTG) were introduced by forward primer at the PCR step. Primers used in PCR amplification are listed in Extended Data Table 1. For NES-tagged RNase H, the sequence encoding E.coli. RNaseHI was tagged with a nuclear export signal (NES) (CTGTCCTCCCACTTCCAGGAGCTGTCCATC) at the C-terminal end. Both NLS- and NES- tagged DNA fragments were then cloned into the pEGFP-N2 vector. The DNA fragments containing RNaseH and EGFP were then moved into a pLVX-tight-puro vector, allowing us to establish stable cell lines with these plasmids via lentiviral infection. Nuclear and cytoplasmic localization of the proteins was confirmed by fluorescence microscopy (Extended Data Fig. 7e, i, Extended Data Fig. 10j). A vector only expressing EGFP was used as mock control.
Western blot
Cells were lysed in lysis buffer (300 mM KCl, 0.2 mM EDTA, 5 mM MgCl2, 20 mM Tris-HCl pH8.0, 10% glycerol) with proteinase and phosphatase inhibitors (Sigma). Protein samples were then sonicated with a probe-type ultrasonicator and analyzed by SDS-PAGE as described50. Chemiluminescence was detected by exposure to an X-ray film. Representative blots are shown in the figures. Antibodies used in western blot are in Supplementary Table 1. Uncropped gel images are in Supplementary Information Fig. 1.
Construction of HeLa auxin-inducible XPG degron
To insert an auxin inducible degron (AID) downstream of XPG coding sequence in genomic DNA, guide DNAs (gDNAs) targeting the 3′ UTR of human XPG gene were designed using Zhang Lab design resources (https://zlab.bio/guide-design-resources). gDNA oligos with BbsI overhangs were annealed and ligated into pSpCas9(BB)-2A-Puro(PX459) V2.0 (no. 62988, Addgene). The homology arms flanking the XPG 3′UTR and overwriting the stop codon were produced by PCR with Phusion High-Fidelity DNA polymerase (NEB) using the XPG 5′ arm or XPG 3′ arm forward and reverse primers (Extended Data Table 1). The amplified XPG 5’ and 3’ arms were then assembled together with a fragment encoding EGFP-AID and DNA backbone by using HiFi DNA Assembly (NEB). The EGFP-AID fragment was inserted between the XPG 5′ arm and XPG 3′ arm designed to be inserted into the genome by homology-directed repair. All these plasmids were transfected into HeLa cells using FuGENE HD. At 24 h following transfection, cells were selected with 1 μg/mL puromycin for 48 h, and then 14 days after transfection GFP positive cells were selected by FACS. Homozygous clones were identified by PCR and western blot with the XPG antibody. To stably express OsTIR1, homozygous clones with EGFP-AID successfully inserted were infected with lentivirus expressing both OsTIR1 and blue fluorescent protein (BFP). BFP positive cells were obtained by FACS.
Construction of HCT116 auxin-inducible XPG degron
HCT116 cells expressing degron-tagged XPG were generated by transfecting HCT116-OsTIR1 cells51 with pLentiCRISPR-V2 plasmid52 expressing Cas9 and an sgRNA targeting the XPG C-terminus (AAGGAAACTAAGACGTGCGA) and with two homology-directed repair constructs based on pMK289 and pMK290 plasmids (a gift from Masato Kanemaki51) containing mAID-mClover sequence and a hygromycin or neomycin resistance cassette flanked by 200 bp XPG homology arms. A homozygous knock-in cell line was obtained after selection with G418 and hygromycin, which was verified by genotyping and sequencing.
Establishing BAX−/−BAK−/− double-knockout cell lines
Cell lines were generated as previously described15. In brief, HeLa and MCF10A cells were co-transfected with two plasmids, gifts from the Sfeir lab (Addgene plasmid #167296 and #167295). Each of them contains the sequence encoding Cas9 and two sgRNAs targeting Bax (GCTGCAGGATGATTGCCGCCG and GTCTGACGGCAACTTCAACTG) or Bak (GCATGAAGTCGACCACGAAG and GGCCATGCTGGTAGACGTGT), respectively. 48 h after transfection, cells were then treated with three drugs, A-1331852, ABT-199 and S63845 (MedChem Express). Hela cells were treated with 1 μM each of drug and MCF10A cells with 0.5 μM each of drug, and surviving cells were selected.
CRISPR–Cas9 knockout cell lines
To establish cGAS and TLR3 knockout cell lines, we first generated Hela cells stably expressing Cas9. For this purpose, cells were infected with a lentivirus encoding Cas9 and a blasticidin resistance marker (Lentiviral Prep #52962-LV, Addgene). Next, negative control sgRNA (TrueGuide™ sgRNA A35526, Thermo Fisher) and sgRNAs targeting cGAS or TLR3 (see Supplementary Table 1) were transfected into the prepared Cas9 stable cell line using Lipofectamine RNAiMax. Cells were then split to 15 cm dishes and single clones were selected and validated by western blot. Two clones from each group were used in experiments.
Statistical analysis and reproducibility
All box and whisker plots demarcate the median (center line), 75 and 25 percentiles (upper and lower bounds, respectively), and min and max values (whiskers). Here, two-tailed Mann-Whitney U tests were performed to determine statistical significance of three biologically independent replicates in aggregate. Cell numbers per condition are found in the figure legends. For all bar graphs, statistical analyses were performed with GraphPad Prism v9.3.1 or Python v3.7.13 using SciPy v1.7.3. Bar graphs represent the mean ± s.d. When comparing two samples (aggregate of three biologically independent experiments), unpaired, two-tailed t-tests were performed. Each western blot, cytoDRIP blot, in vitro binding assay or coimmunoprecipitation has been repeated at least three times as biologically independent experiments (Figures 1c–k, 3a, c, e, g, h, j, 4a, c–i, l, m; Extended Data Figures 1a, d–j, m, 2a, c, e, h, j–m, 4k, 7a–d, g–k, m, 8a, c, e, f, j–m, 9a–k, 10b, c, h, i, m–o). Immunofluorescence experiments shown in Figure 1a and Extended Data Figure 1c, k–l depict representative images and quantifications are the aggregate of three biological replicates. Other micrographs (Extended Data Figures 1b, 2n, 7e, l, 10j) were performed once as proof of concept examples. No statistical methods were used to determine sample size. Experiments were not randomized, nor were the investigators blinded to allocation. All data were assembled into figures with Adobe Illustrator CS6.
Extended Data
Extended Data Fig. 1. Cytoplasmic RNA-DNA hybrids are induced upon multiple cellular perturbations.
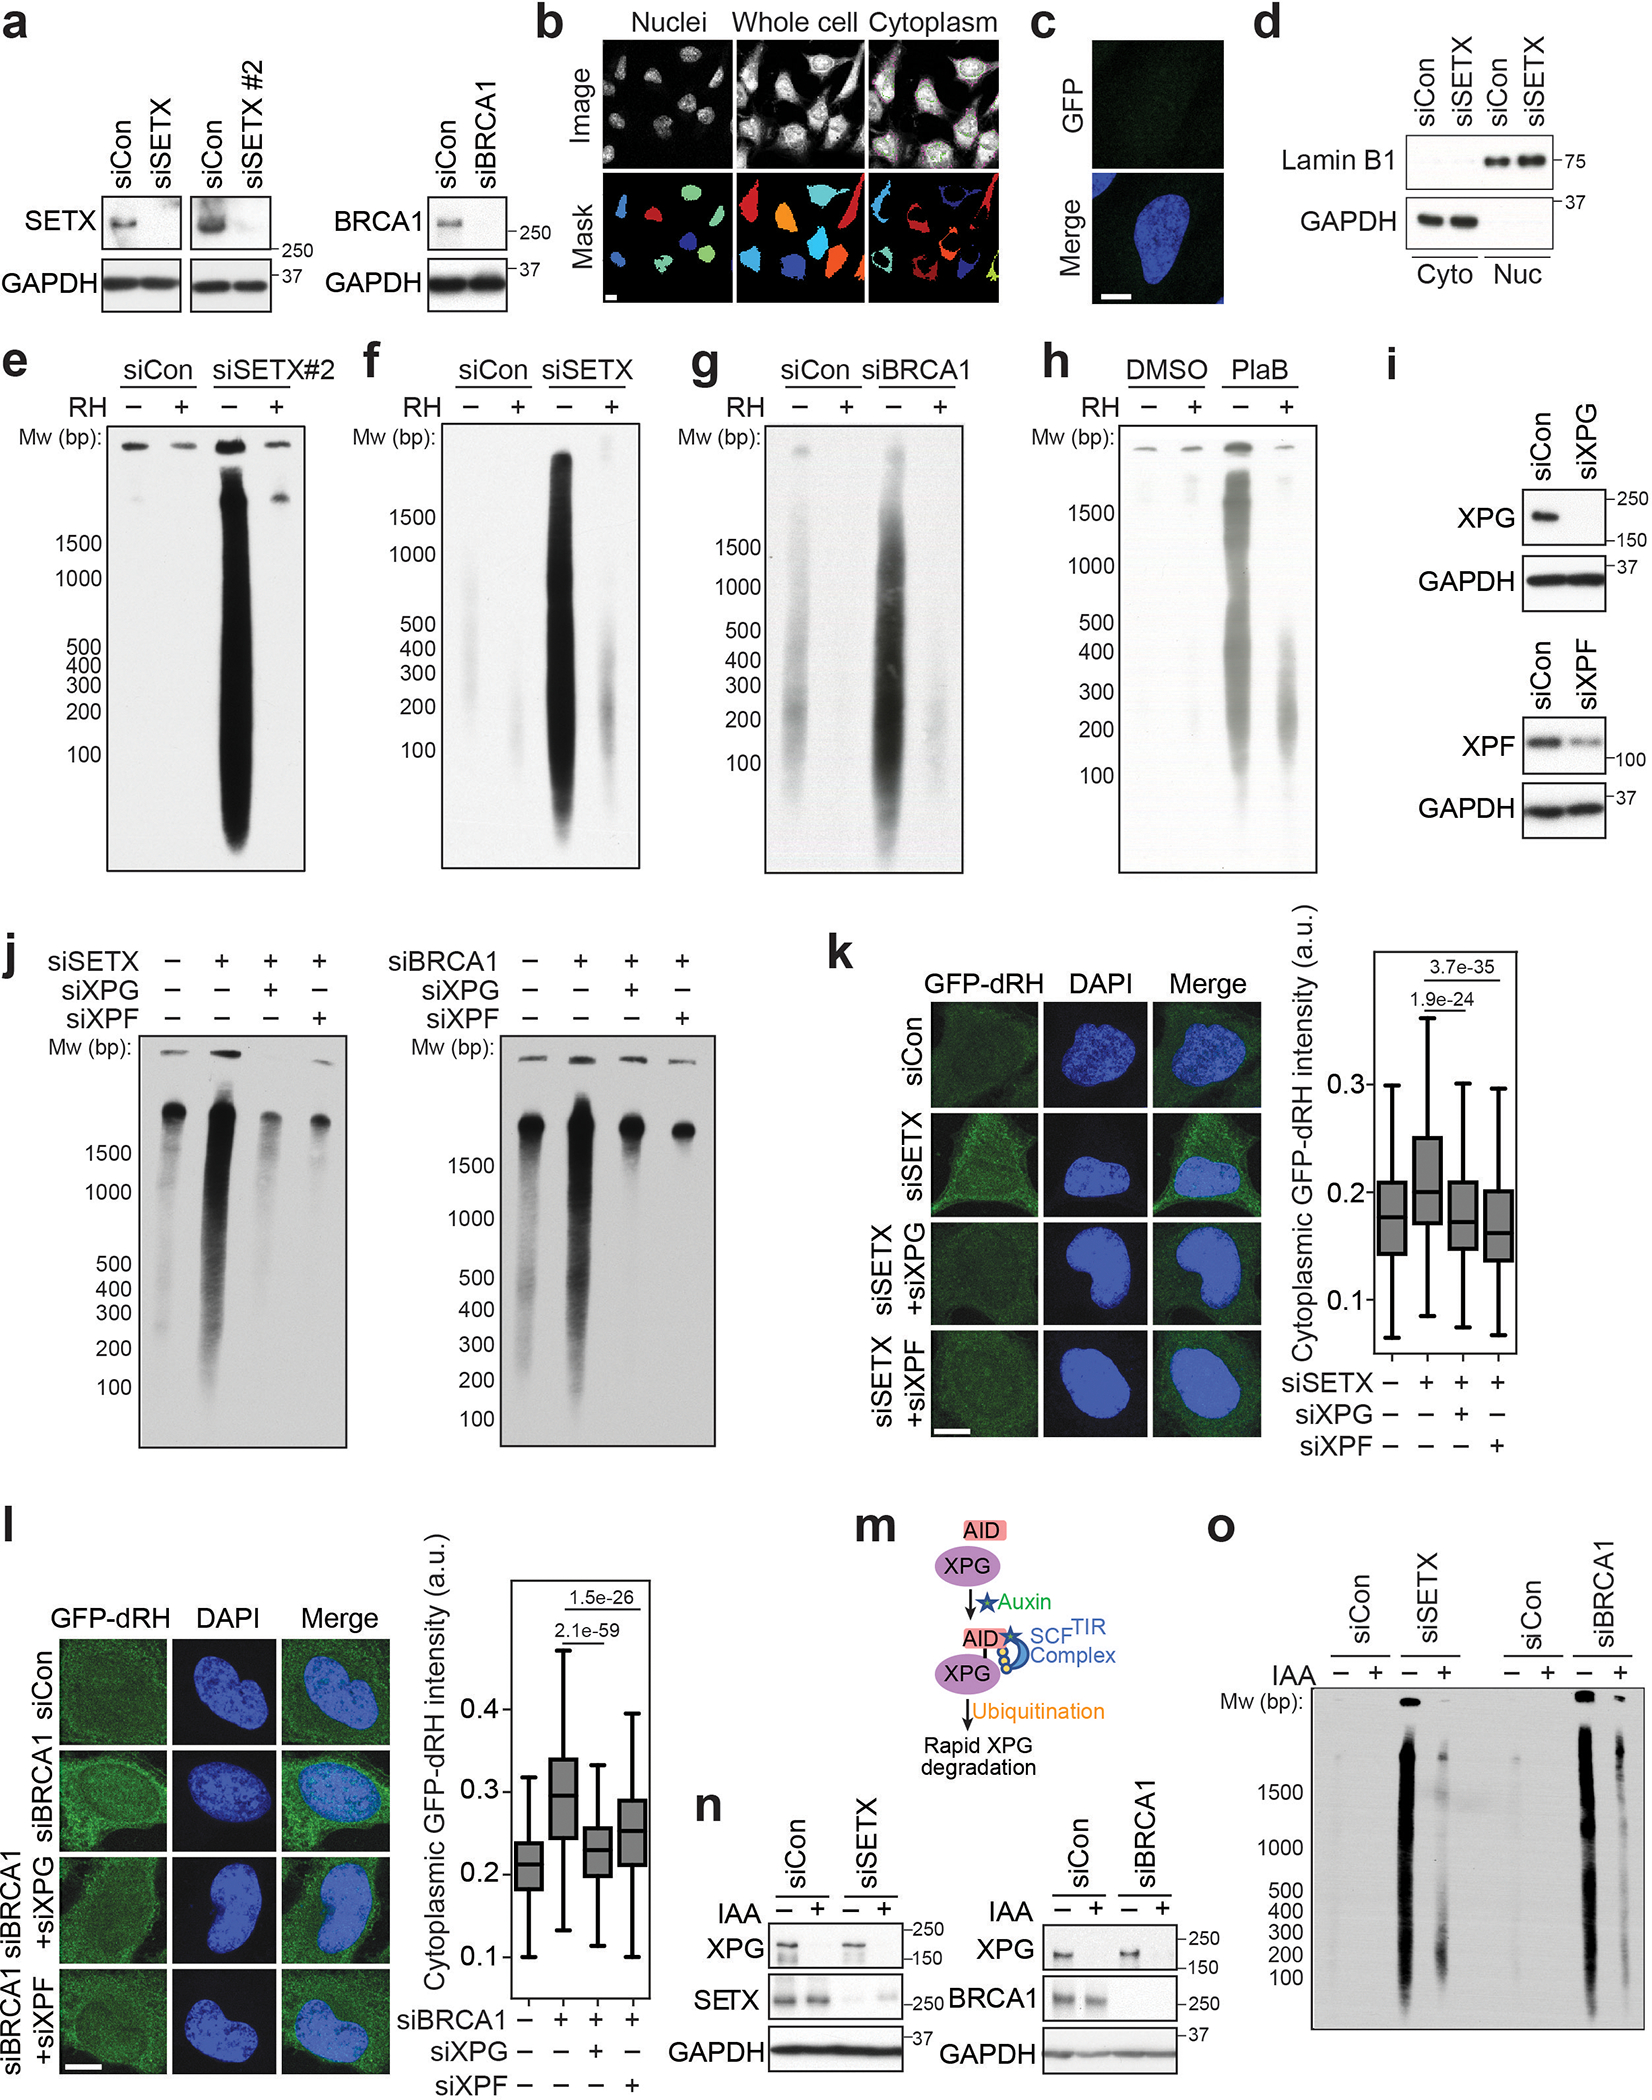
(a) Western blot showing knockdown efficiency of siRNAs targeting SETX and BRCA1 in HeLa cells.
(b) Images showing segmentation of nuclear and cytoplasmic compartments in HeLa cells, using DAPI and whole cell stain as masks, respectively. Scale bar is 20 μm.
(c) Images showing the lack of GFP protein binding on fixed HeLa cells. Scale bar is 10 μm.
(d) Western blot showing fractionation of siControl and siSETX-treated HeLa cells into soluble nuclear and cytoplasmic compartments with Lamin B1 and GAPDH as markers, respectively.
(e) cytoDRIP blot showing cytoplasmic hybrid accumulation in HeLa cells following SETX knockdown using a second siRNA. In vitro RH treatment was performed prior to pull-down.
(f) cytoDRIP blot showing cytoplasmic hybrid accumulation in siSETX-treated HCT116 cells. In vitro RH treatment was performed prior to pull-down.
(g) cytoDRIP blot showing cytoplasmic hybrid accumulation in siBRCA1-treated HCT116 cells. In vitro RH treatment was performed prior to pull-down.
(h) cytoDRIP blot showing cytoplasmic hybrid accumulation in PlaB-treated (500nM, 3h) HeLa cells. In vitro RH treatment was performed prior to pull-down.
(i) Western blot showing knockdown efficiency of siRNAs targeting XPG and XPF in HeLa cells.
(j) cytoDRIP blot showing the role of XPG and XPF in cytoplasmic hybrid production after SETX or BRCA1 knockdown in HeLa cells.
(k) Left: images of HeLa cells after SETX and XPG or XPF knockdown probed with GFP-dRH protein after fixation, following mock or RH pre-treatment. Scale bar is 10 μm. Right: quantification of cytoplasmic GFP-dRH intensities; p-values are shown; two-sided Mann Whitney U test: n-values from left to right: 611, 573, 659, 686. Center line, median; box limits, 75 and 25 percentiles, whiskers, min and max values.
(l) As in (k) but after BRCA1 knockdown in HeLa cells. Two-sided Mann Whitney U test: n-values from left to right: 526, 502, 633, 653. Center line, median; box limits, 75 and 25 percentiles; whiskers, min and max values.
(m) Schematic of the XPG auxin-inducible degron (AID) system.
(n) Western blots showing XPG degradation after knockdown of SETX (left) and BRCA1 (right) in HCT116 cells.
(o) cytoDRIP blot showing cytoplasmic hybrid accumulation after knockdown of SETX or BRCA1 and impact of auxin-induced XPG degradation in HCT116 cells.
Extended Data Fig. 2. Dynamics of cytoplasmic hybrid production.
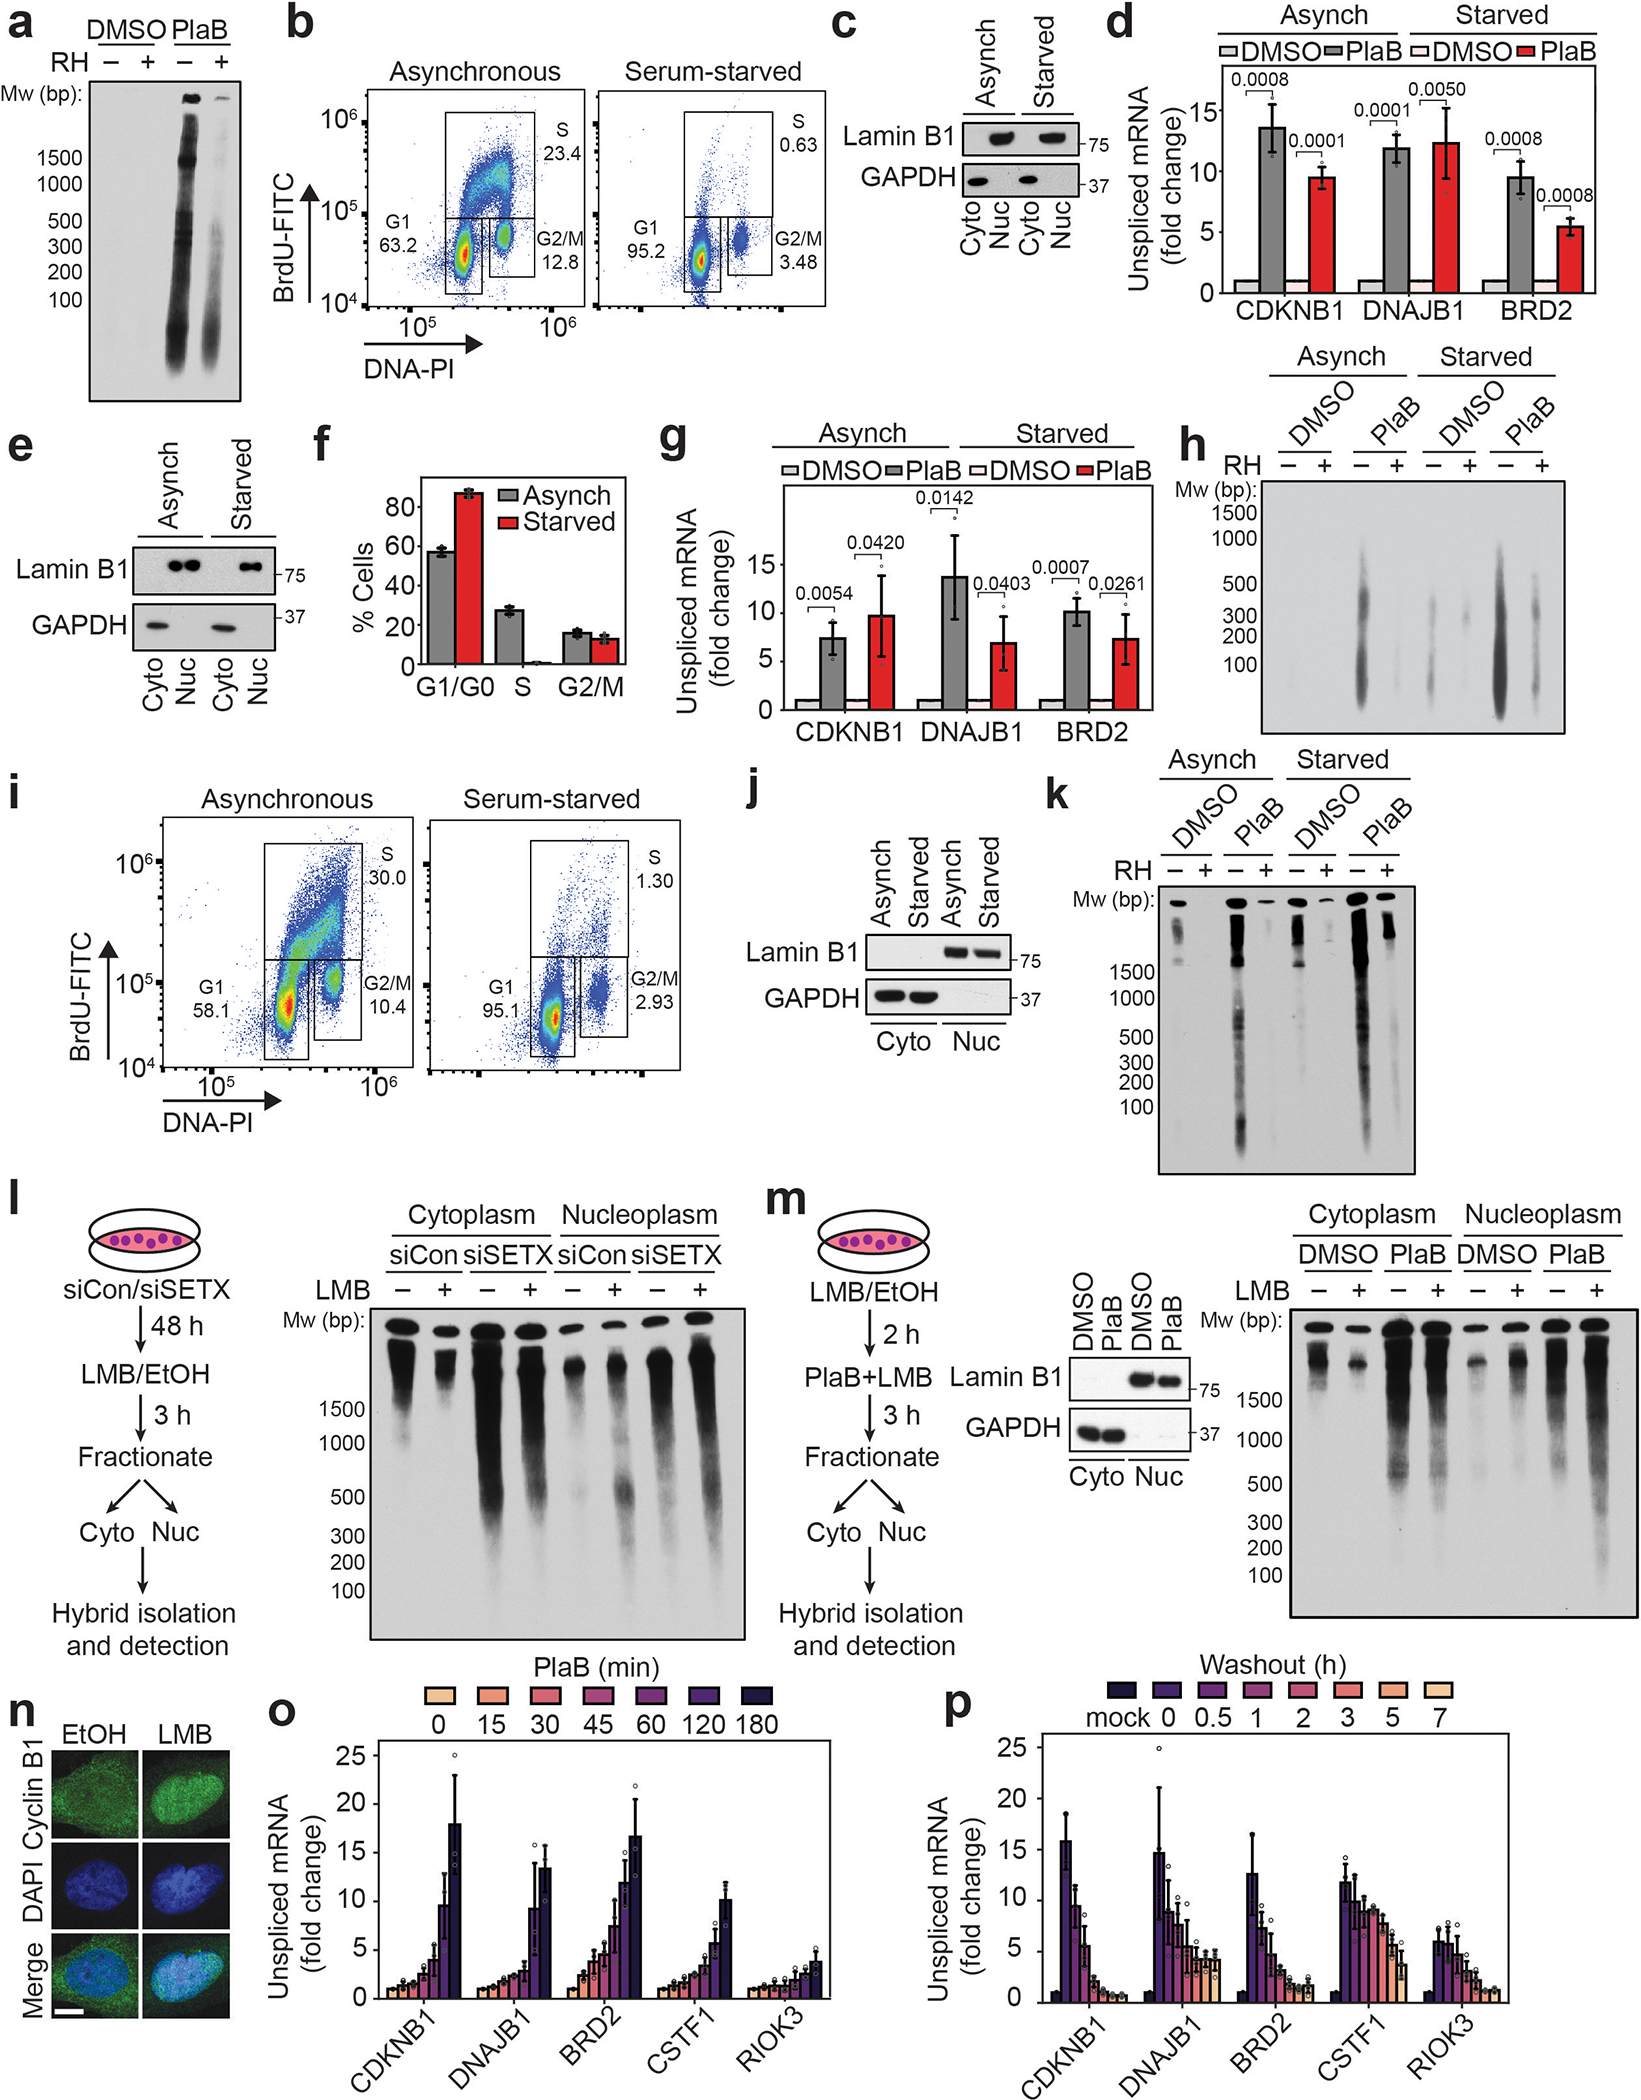
(a) cytoDRIP blot showing cytoplasmic hybrids in mock or PlaB treated (500 nM, 3 h) BAX−/−BAK−/− HeLa cells with or without in vitro RH treatment.
(b) Flow cytometry analysis of asynchronous or serum-starved MCF10A cells following incubation with BrdU. Cells were segmented based on DNA content (propidium iodide staining) and BrdU intensity. The percentage of cells in G1, S and G2/M are indicated. At least 50,000 cells were quantified per condition.
(c) Western blot showing fractionation of asynchronous and serum-starved MCF10A cells into soluble nuclear and cytoplasmic compartments with LaminB1 and GAPDH as markers, respectively.
(d) RT-qPCR from asynchronous or serum-starved MCF10A cells showing increased unspliced mRNA following PlaB treatment (500 nM, 3 h). Shown is the mean ± s.d. from three independent biological replicates (n = 3), p-values are indicated in the figure; unpaired, two-tailed t-test.
(e) As in (c) but for foreskin fibroblasts.
(f) Cell cycle quantification from high-content imaging of foreskin fibroblasts after EdU incorporation, using DAPI staining for DNA content. Shown is the mean ± s.d. from three independent biological replicates (n = 3).
(g) As in (d) but for foreskin fibroblasts.
(h) cytoDRIP blot showing cytoplasmic hybrids extracted from equal numbers of asynchronous or serum-starved foreskin fibroblasts following DMSO or PlaB treatment (500 nM, 3 h), with mock and RH treatment prior to pull-down.
(i) As in (b) but for BAX−/−BAK−/− MCF10A cells.
(j) Western blot showing fractionation of asynchronous and serum-starved BAX−/−BAK−/− MCF10A cells into soluble nuclear and cytoplasmic compartments with LaminB1 and GAPDH as markers, respectively.
(k) cytoDRIP blot showing cytoplasmic hybrids in asynchronous and serum-starved BAX−/−BAK−/− MCF10A cells with DMSO or PlaB treatment (500 nM, 3 h). Each sample was treated with RH in vitro to confirm the specificity of the hybrid IP.
(l) Left: experimental workflow. Right: blots showing hybrids isolated from the cytoplasm or nucleoplasm of siCon or siSETX-treated HeLa cells, with mock or LMB treatment (3 h, 5 nM) prior to harvest.
(m) Left: experimental workflow. Middle: western blot as in (c) from HeLa cells treated with vehicle control (DMSO) or PlaB (500 nM, 3 h). Right: blot showing hybrids as in (i) but in HeLa cells treated with LMB (2 h, 5 nM) followed by PlaB + LMB for a further 3 h.
(n) Representative images showing cyclin B1 localization in fixed HeLa cells treated with LMB (5 h, 5 nM) or vehicle control (EtOH). Scale bar is 10 μm.
(o) RT-qPCR from HeLa cells showing increased unspliced mRNA following treatment with PlaB (500 nM) for the times indicated. Shown is the mean ± s.d. from three independent biological replicates (n = 3).
(p) As in (o) but cells were treated with PlaB (500 nM, 3 h) and then fresh media was added following PlaB withdrawal for the times indicated. Shown is the mean ± s.d. from four independent biological replicates (n = 4).
Extended Data Fig. 3. Characteristics of cytoDRIP peaks.
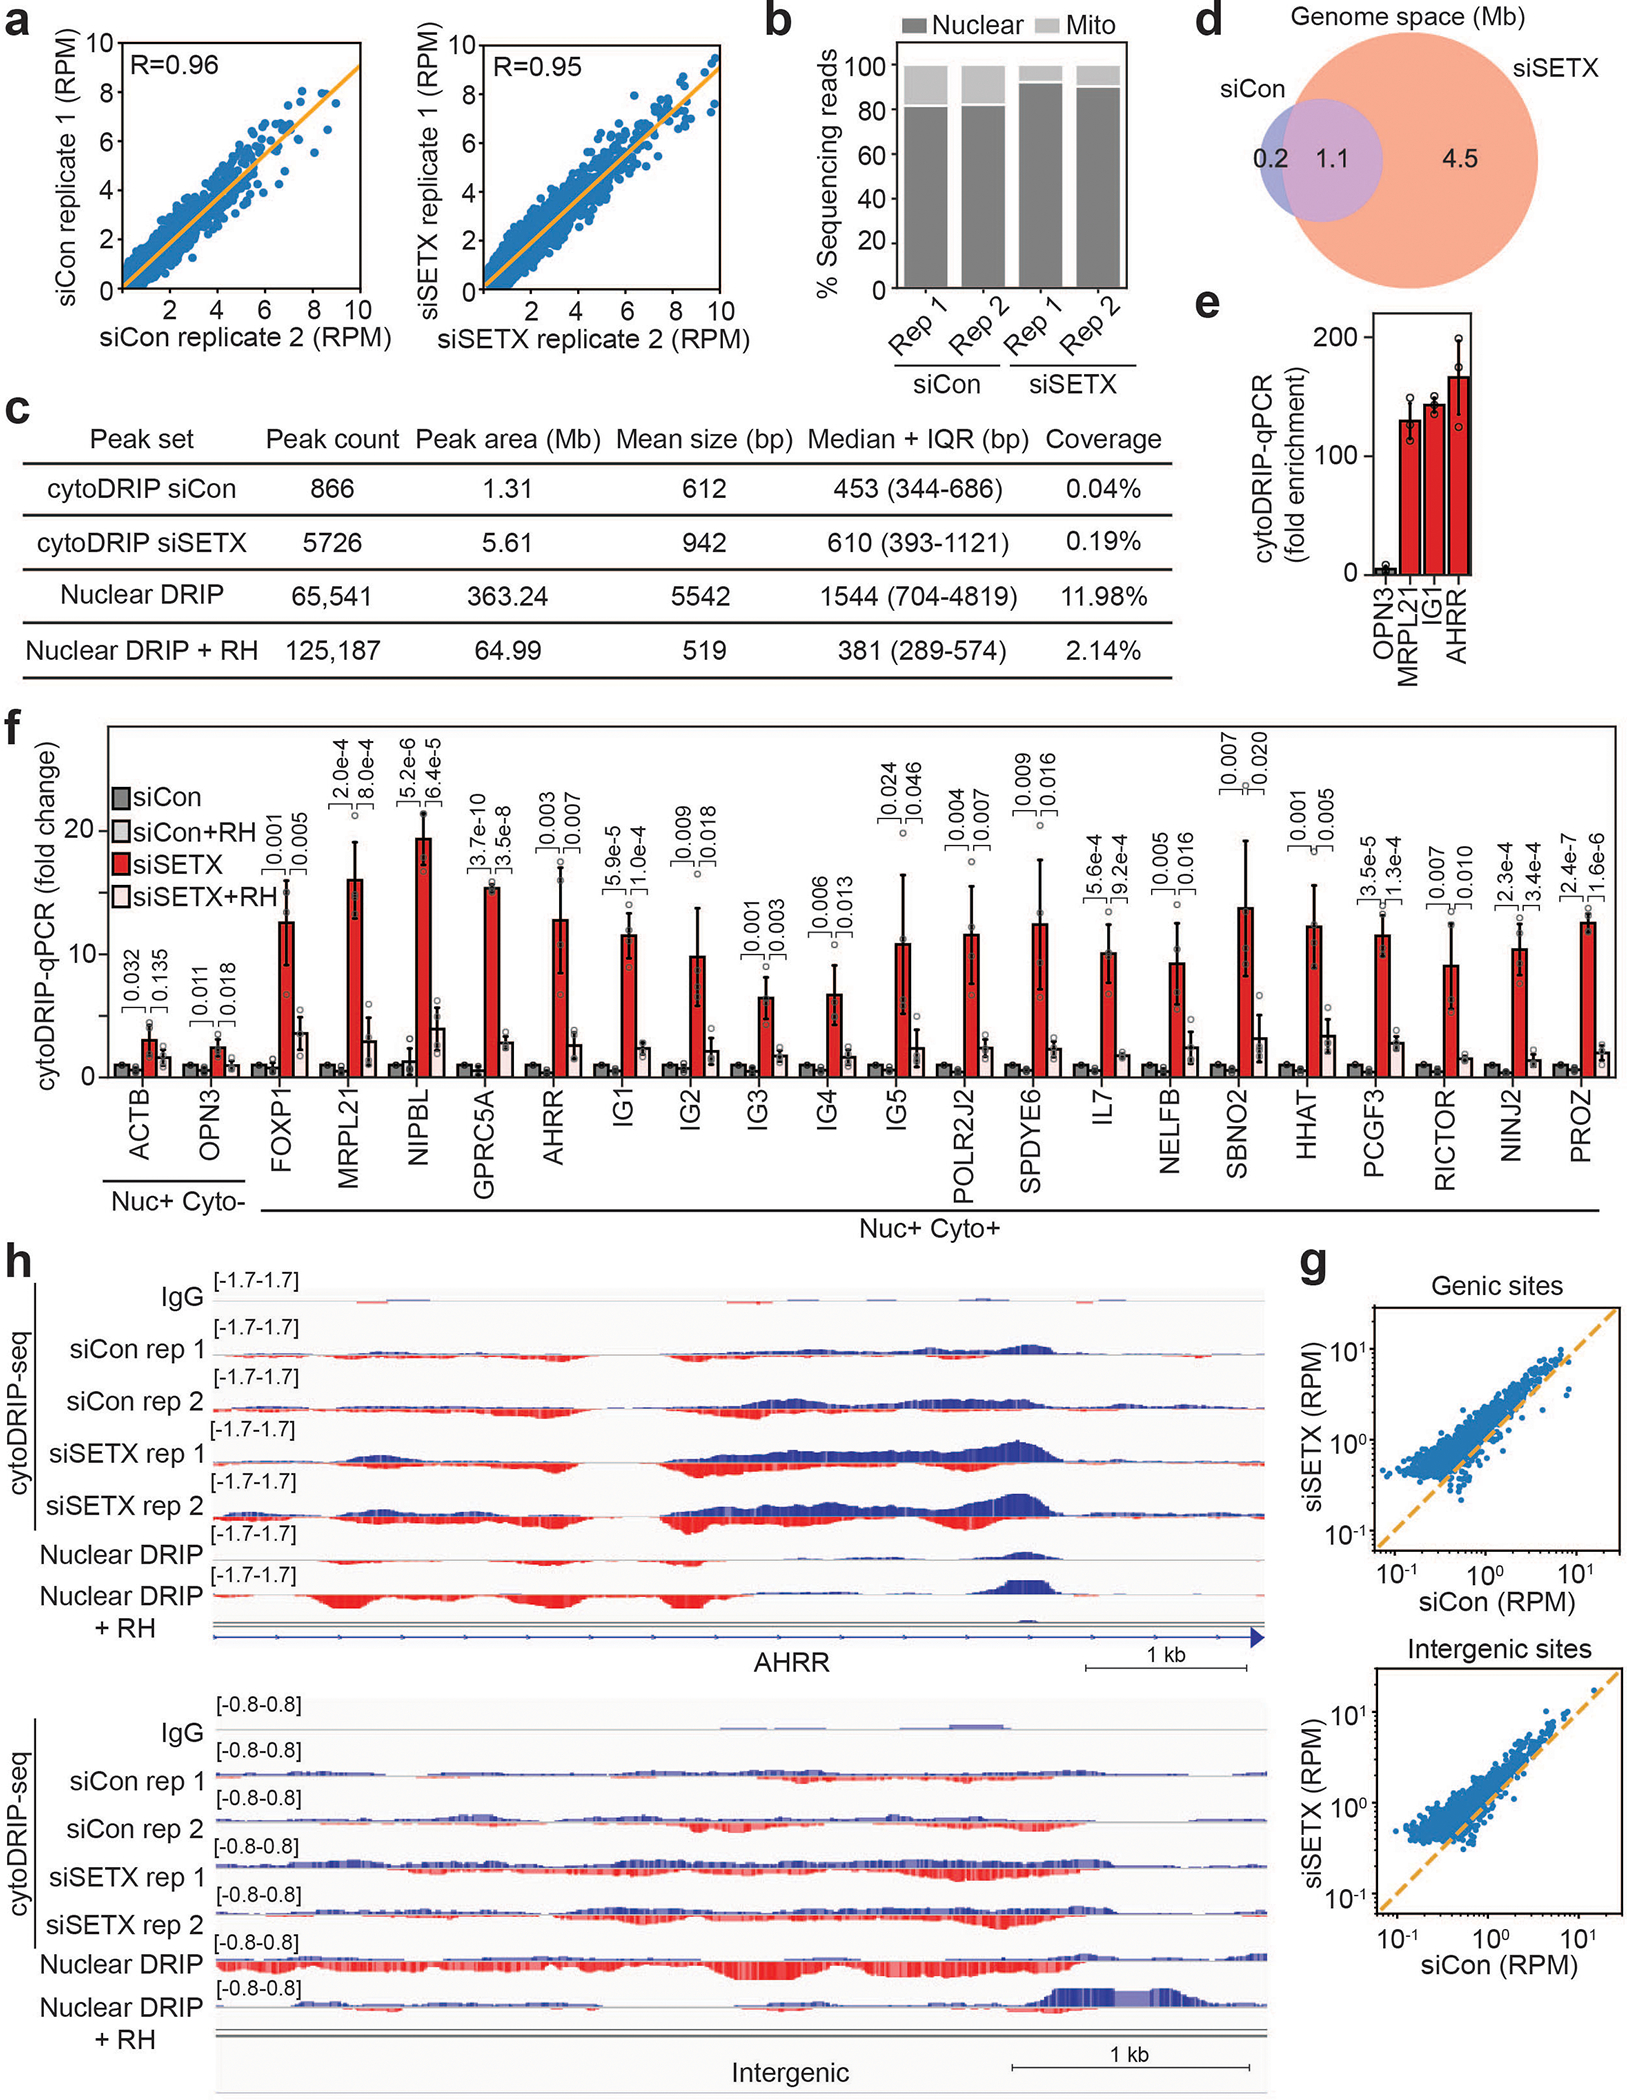
(a) Scatter plots showing high reproducibility between cytoDRIP-seq siCon (left) and siSETX (right) replicates; Pearson’s correlation: R = 0.96 and 0.95 respectively; p < 1e-16 (machine precision limit).
(b) Bar blot showing proportion of deduplicated sequencing reads mapping to the nuclear and mitochondrial (mito) genomes in cytoDRIP-seq samples. Data from two biological replicates are shown.
(c) Table showing peak characteristics in cytoDRIP-seq, nuclear DRIP-seq, and nuclear DRIP-seq following RH treatment (RHR DRIP). Numbers of peaks (peak count), genomic space covered by peaks (peak area), size of peaks (mean and median), percent of genome covered by peaks (coverage) are shown. IQR is interquartile range.
(d) Venn diagram of genome areas (in megabases) occupied by peaks identified in siCon and siSETX cytoDRIP-seq samples.
(e) Bar plot showing enrichment of cytoplasmic hybrid sites by qPCR after S9.6 pull-down, relative to IgG. OPN3 was only found in the nucleus; the other sites were found in the nucleus and cytoplasm. Shown is the mean ± s.d. from three independent biological replicates (n = 3).
(f) CytoDRIP-qPCR in HeLa cells after depletion of SETX at cytoDRIP-seq sites and nuclear R-loop forming sites. RH treatment was performed in vitro, prior to hybrid pull-down. ‘Nuc+ Cyto+’ sites were found in the nucleus and cytoplasm, while ‘Nuc+ Cyto−’ sites were only found in the nucleus. Gene names are shown; IG1-IG5 are intergenic sites. Shown is the mean ± s.d. from four independent biological replicates (n = 4); p-values are shown in the figure, unpaired two-tailed t-test.
(g) Scatter plots showing increased cytoDRIP-seq signal upon depletion of SETX in genic sites (upper) and intergenic sites (lower). Dashed line represents x = y.
(h) Genome browser views of genic (top) and intergenic (bottom) cytoDRIP-seq sites. From top to bottom normalized tracks are: IgG, siCon (2 replicates), siSETX (2 replicates), nuclear DRIP-seq, nuclear DRIP-seq + RH. Red indicates negative strand signal, blue indicates positive strand signal.
Extended Data Fig. 4. CytoDRIP sites map to genic and intergenic regions.
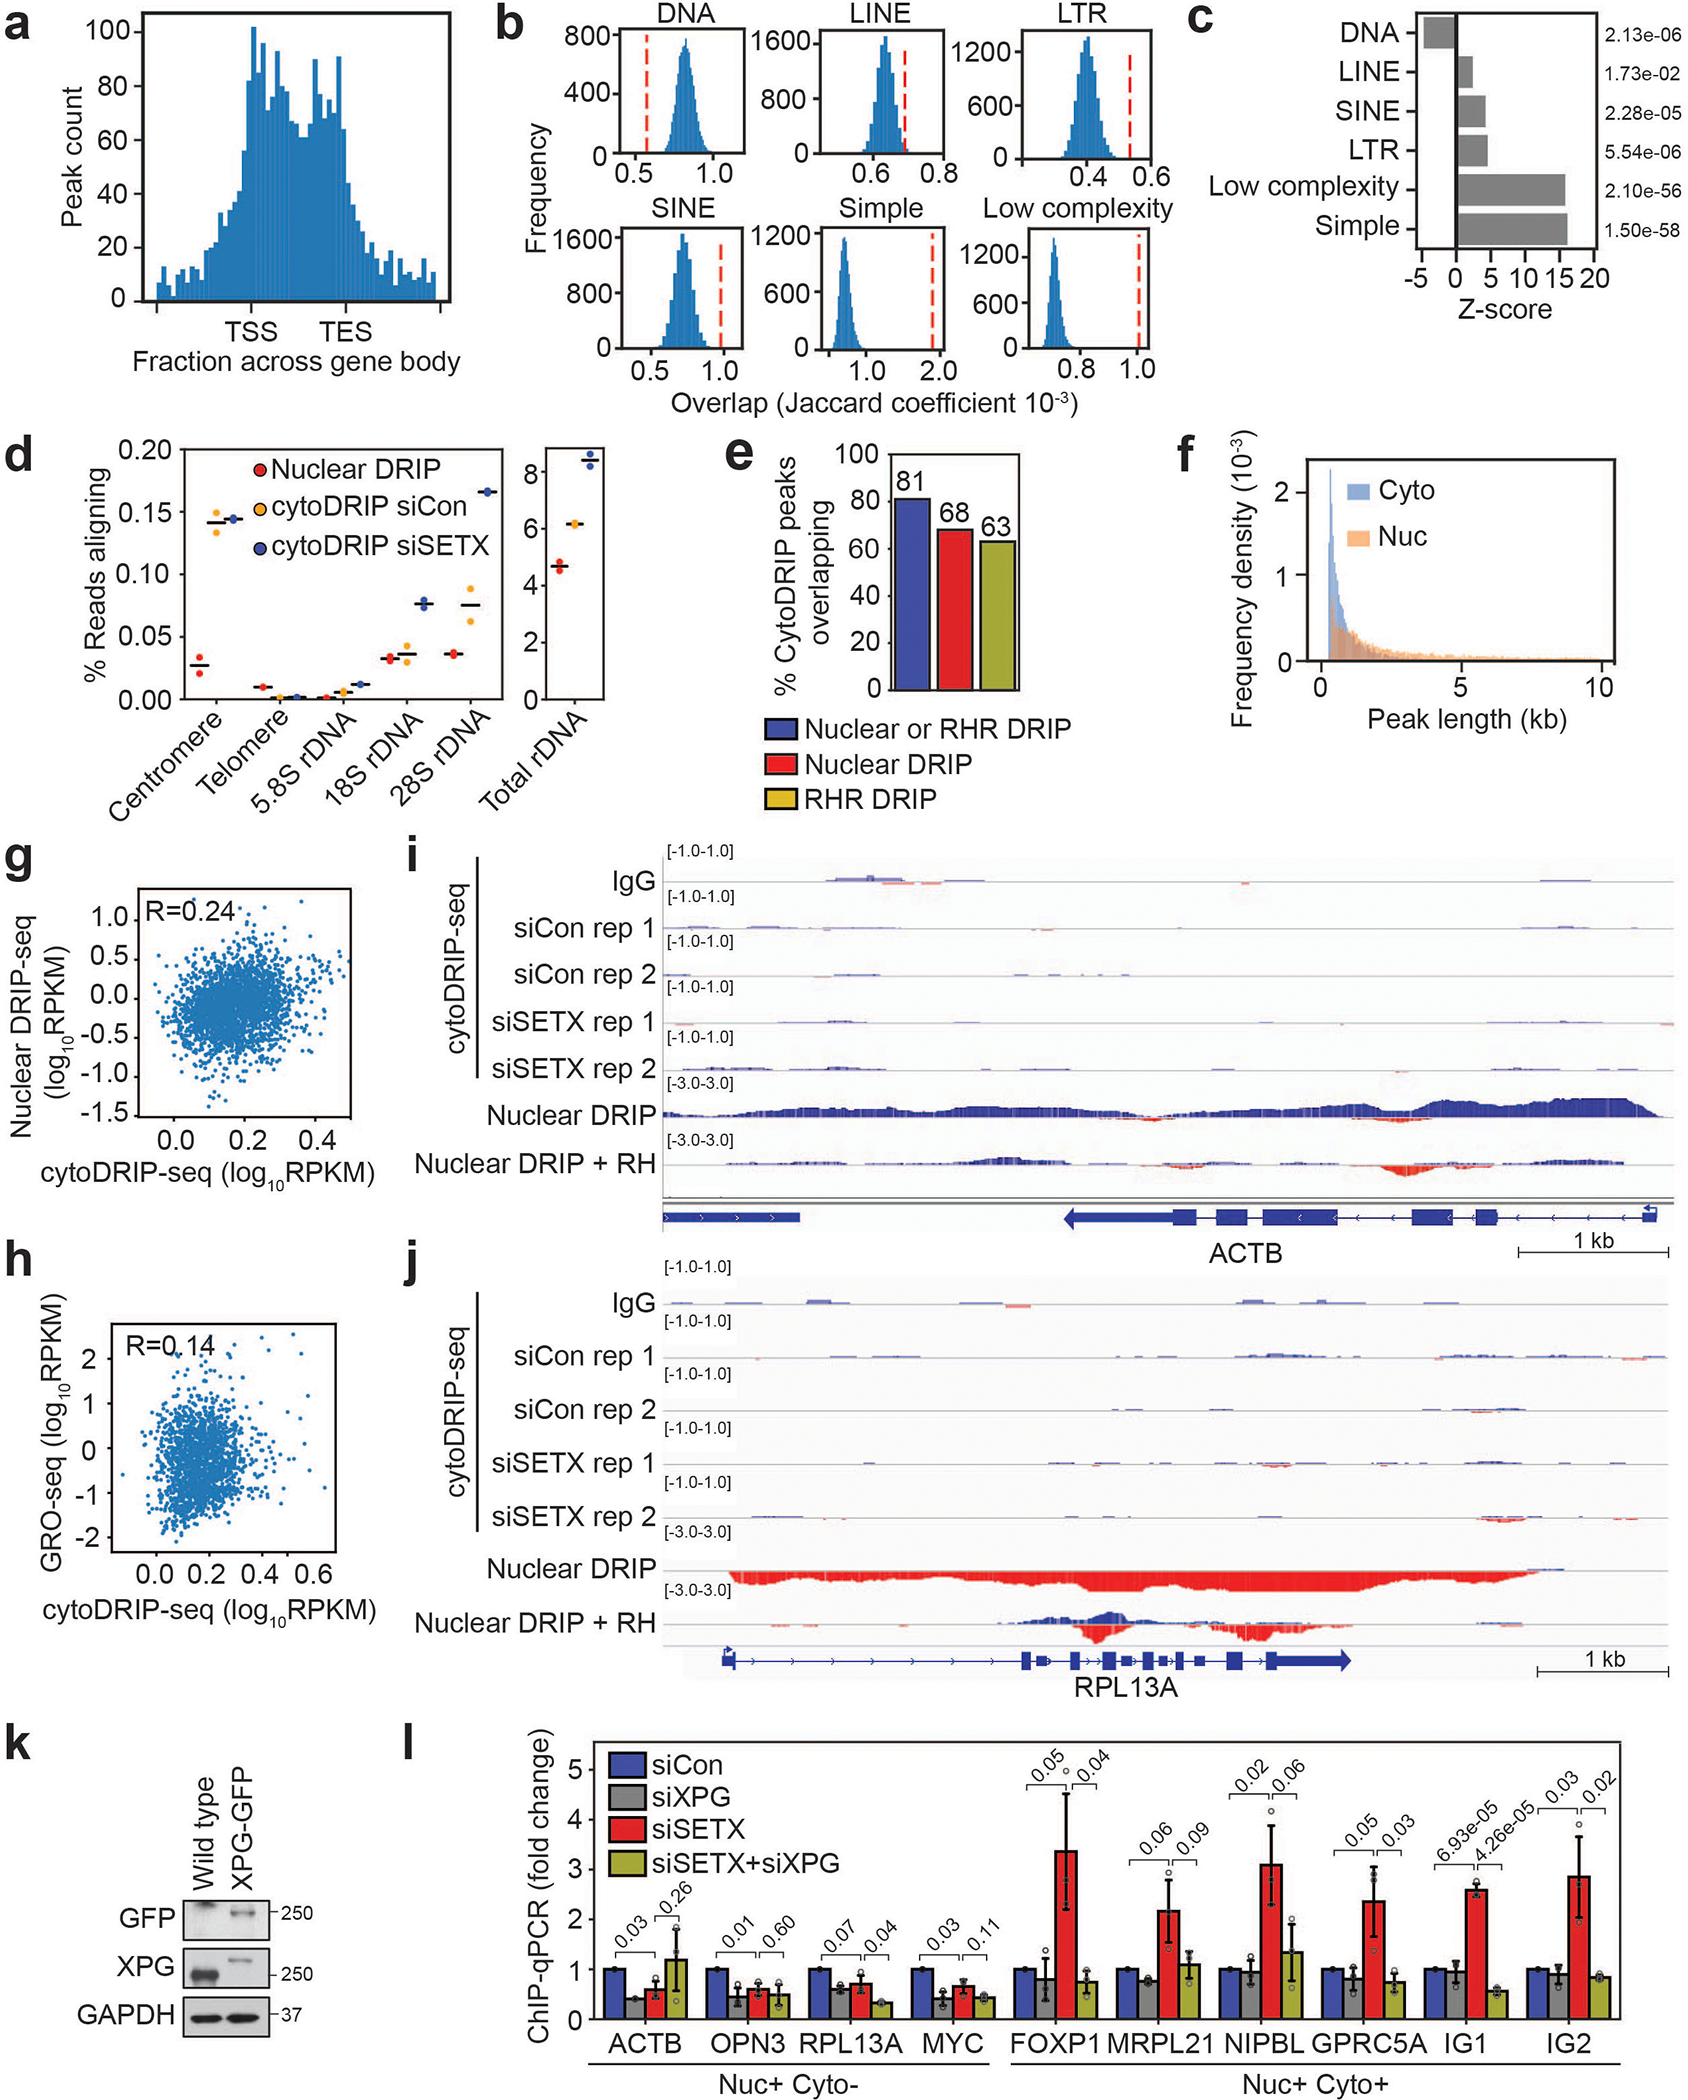
(a) Histogram showing distribution of cytoDRIP peaks over genes. Positions of transcription start site (TSS) and transcription end site (TES) are indicated.
(b) Blue histograms show expected overlaps between repeat elements and randomly sampled peak sets (matched in size and number from cytoDRIP peaks) from within all nuclear R-loop peaks. Red dashed line indicates the observed overlap for cytoDRIP peaks.
(c) Z-scores for the overlaps calculated in (b); individual p-values are shown on the right.
(d) Proportion of nuclear DRIP-seq and cytoDRIP-seq reads aligning to consensus regions for rDNA, alpha satellite for centromeres and telomeric repeats. Data are from two independent biological replicates (n = 2) per condition, black lines show the mean.
(e) Bar plot showing proportion of cytoDRIP peaks overlapping nuclear DRIP and/or RNase H resistant hybrid (RHR) sites.
(f) Histogram of peak lengths comparing cytoDRIP-seq (siSETX condition) (Cyto) and nuclear DRIP-seq (Nuc) peaks.
(g) Scatter plot correlating nuclear DRIP-seq signal at cytoDRIP regions with cytoDRIP-seq signal, Pearson’s correlation: R = 0.24.
(h) Scatter plot correlating nascent transcription by GRO-seq at cytoDRIP regions with cytoDRIP-seq signal, Pearson’s correlation: R = 0.14.
(i,j) Genome browser views showing lack of cytoDRIP signal at sites with robust nuclear R-loop formation (i) ACTB, (j) RPL13A. From top to bottom normalized tracks are: IgG, siCon (2 replicates), siSETX (2 replicates), nuclear DRIP-seq, nuclear DRIP-seq + RH. Red indicates negative strand signal, blue indicates positive strand signal.
(k) Western blot showing HeLa cells stably expressing GFP-tagged XPG. GAPDH is the loading control.
(l) GFP ChIP-qPCR in HeLa cells following knockdown of SETX and/or XPG, showing GFP-XPG binding at hybrid sites. ‘Nuc+ Cyto+’ sites were found in the nucleus and cytoplasm, while ‘Nuc+ Cyto−’ sites were only found in the nucleus. Gene names are shown; IG1 and IG2 are intergenic sites. Shown is the mean ± s.d. from three independent biological replicates (n = 3); unpaired two-tailed t-test; p-values are shown.
Extended Data Fig. 5. Cytoplasmic hybrids are derived from long-lived and partially RNase H-resistant nuclear R-loops.
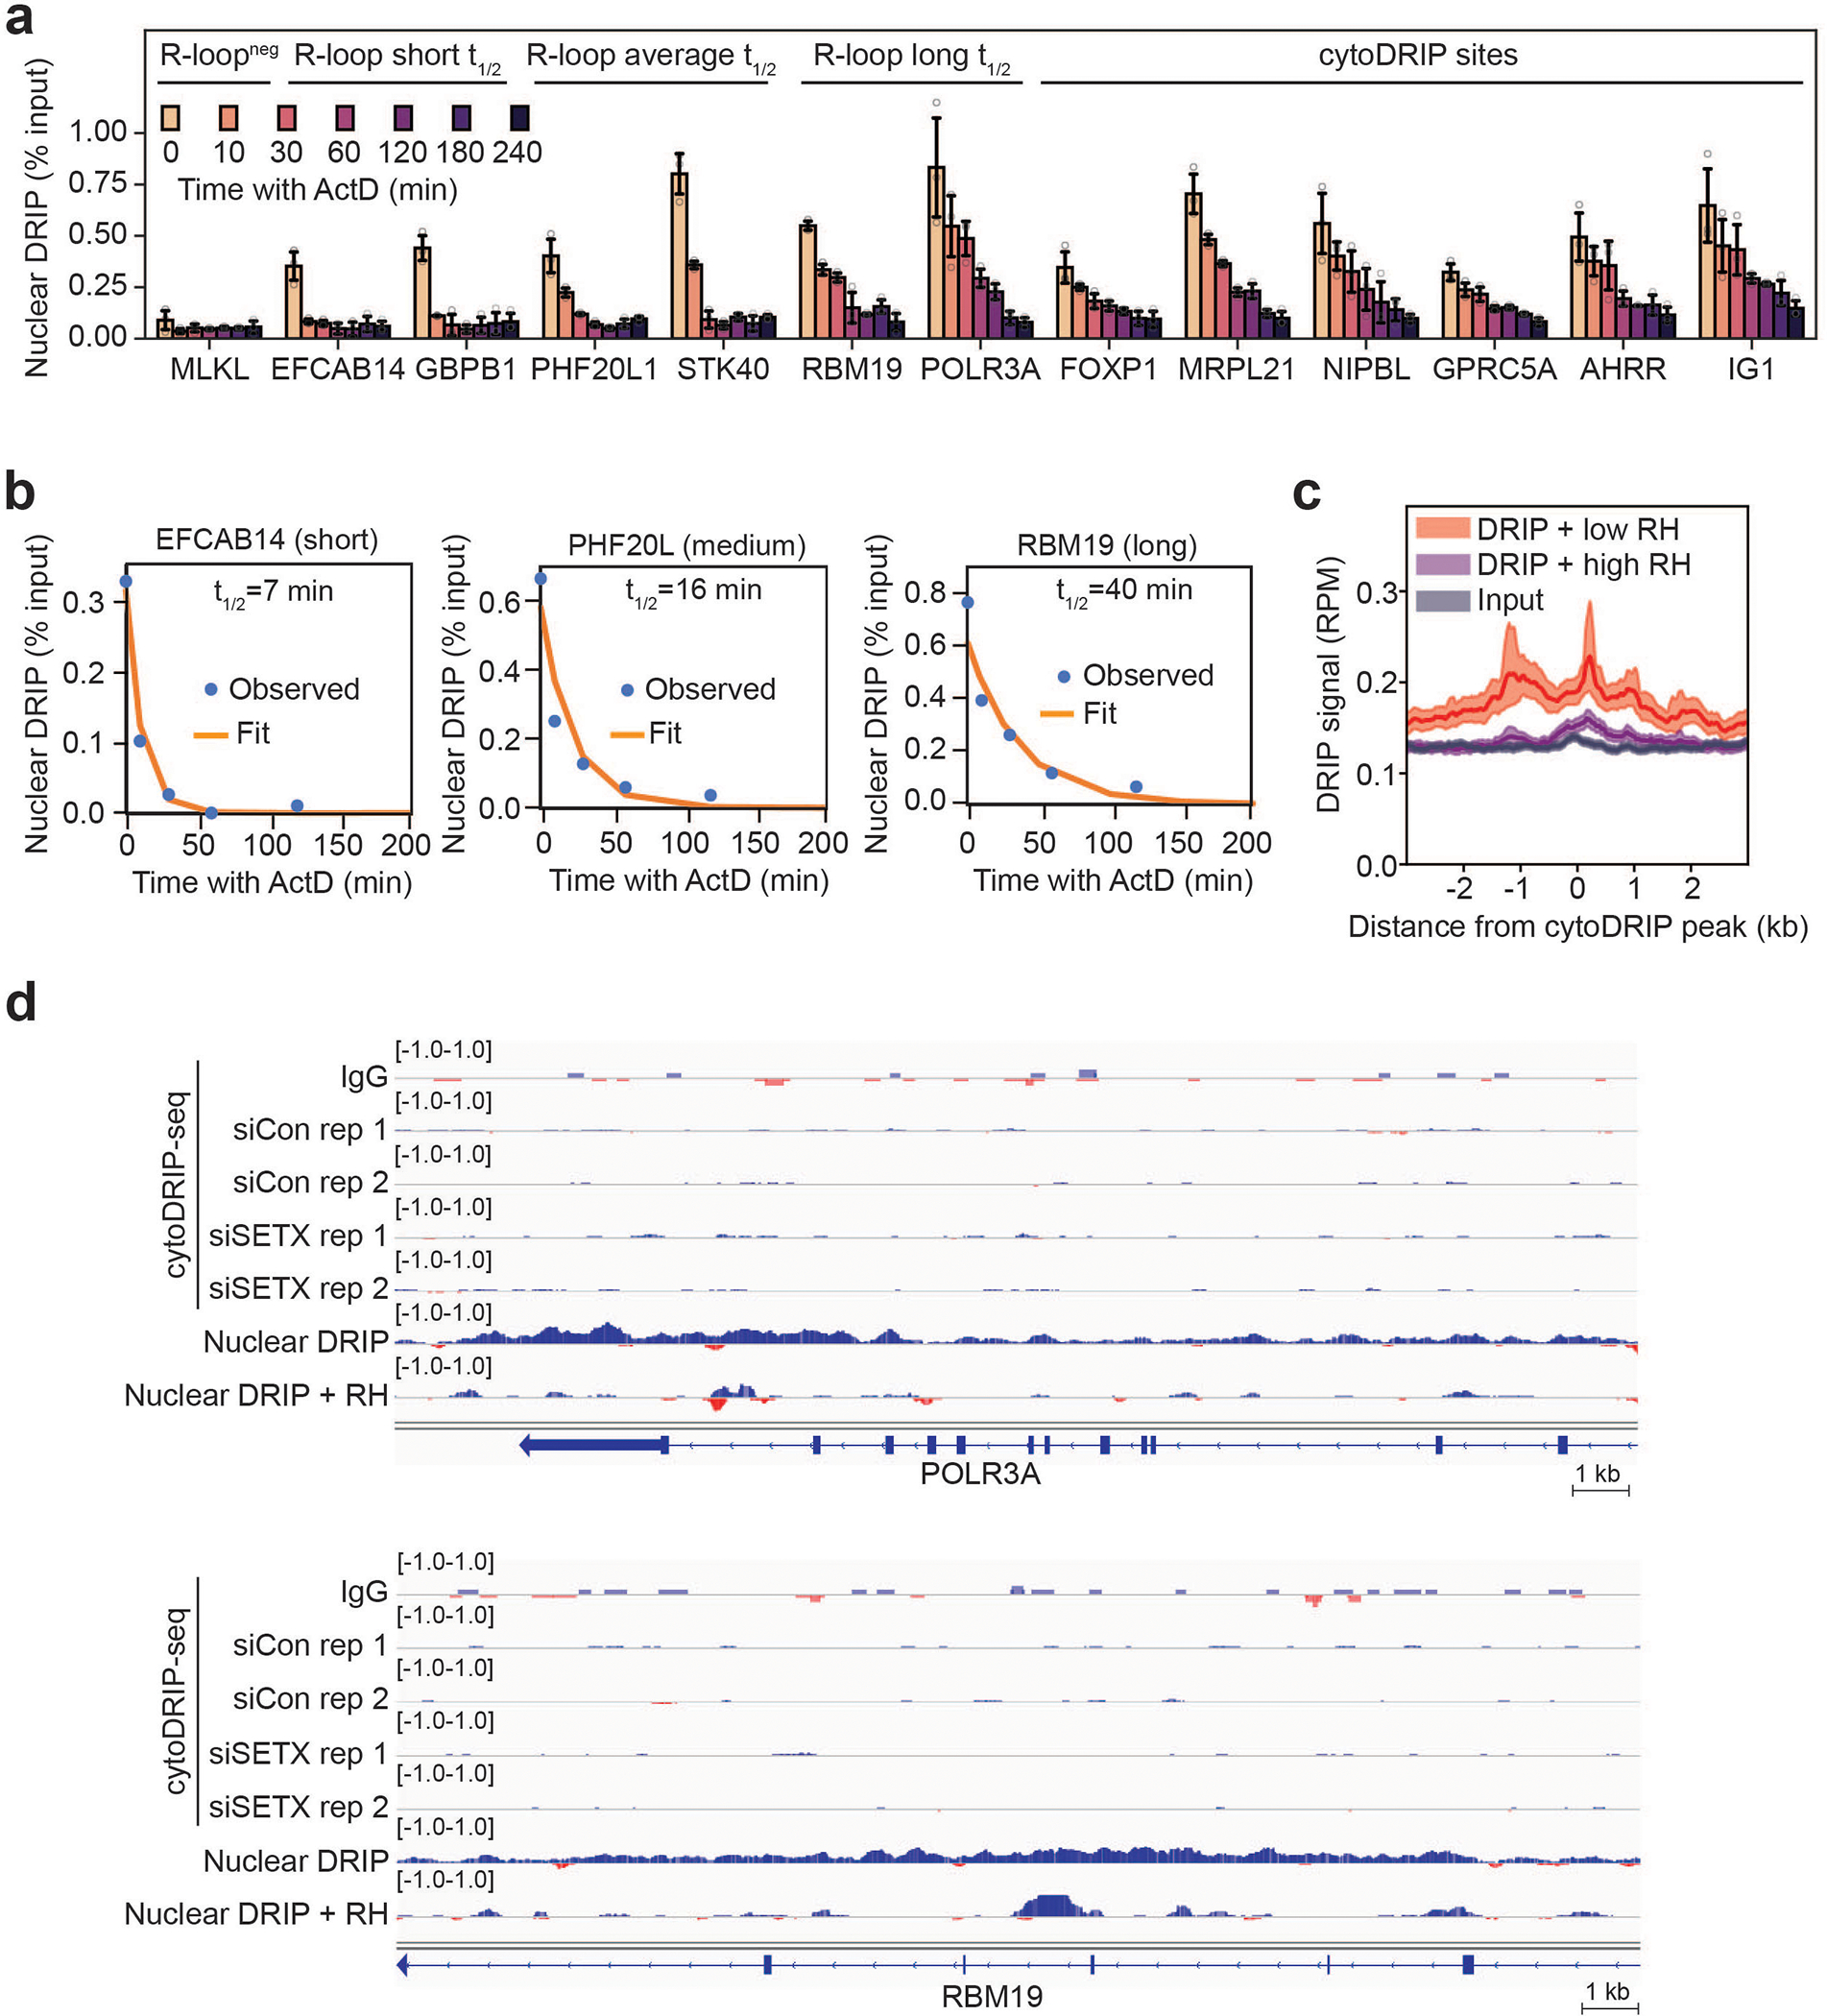
(a) Nuclear DRIP-qPCR after actinomycin D treatment. Nuclear R-loop sites with short, average and long half-lives21 are indicated, as well as cytoDRIP sites. R-loopneg indicates a nuclear site with low R-loop abundance. Gene names are indicated. IG1 is an intergenic site. Shown is the mean ± s.d. from three independent biological replicates (n = 3). P = 9.81e-12 between nuclear sites with short or medium lifetimes and cytoDRIP sites (two-tailed Mann Whitney U test).
(b) Nuclear DRIP-qPCR after actinomycin D treatment showing example fits of exponential decay to derive RNA-DNA hybrid half-lives. Shown is the mean from three independent biological replicates (n = 3).
(c) Aggregate plots around cytoDRIP regions showing nuclear DRIP-seq signal following low (red) or high (purple) RH treatment in vitro. Input signal is grey. Each line is the mean of 1762 genic peaks (n = 1762). Error bands represent 95% CI of the mean.
(d) Genome browser views of previously identified21 long-lived nuclear R-loop sites. From top to bottom normalized tracks are: IgG, siCon (2 replicates), siSETX (2 replicates), nuclear DRIP-seq, nuclear DRIP-seq + in vitro RH. Red indicates negative strand signal, blue indicates positive strand signal.
Extended Data Fig. 6. Cytoplasmic hybrids are characterized by switches in nucleotide skew.
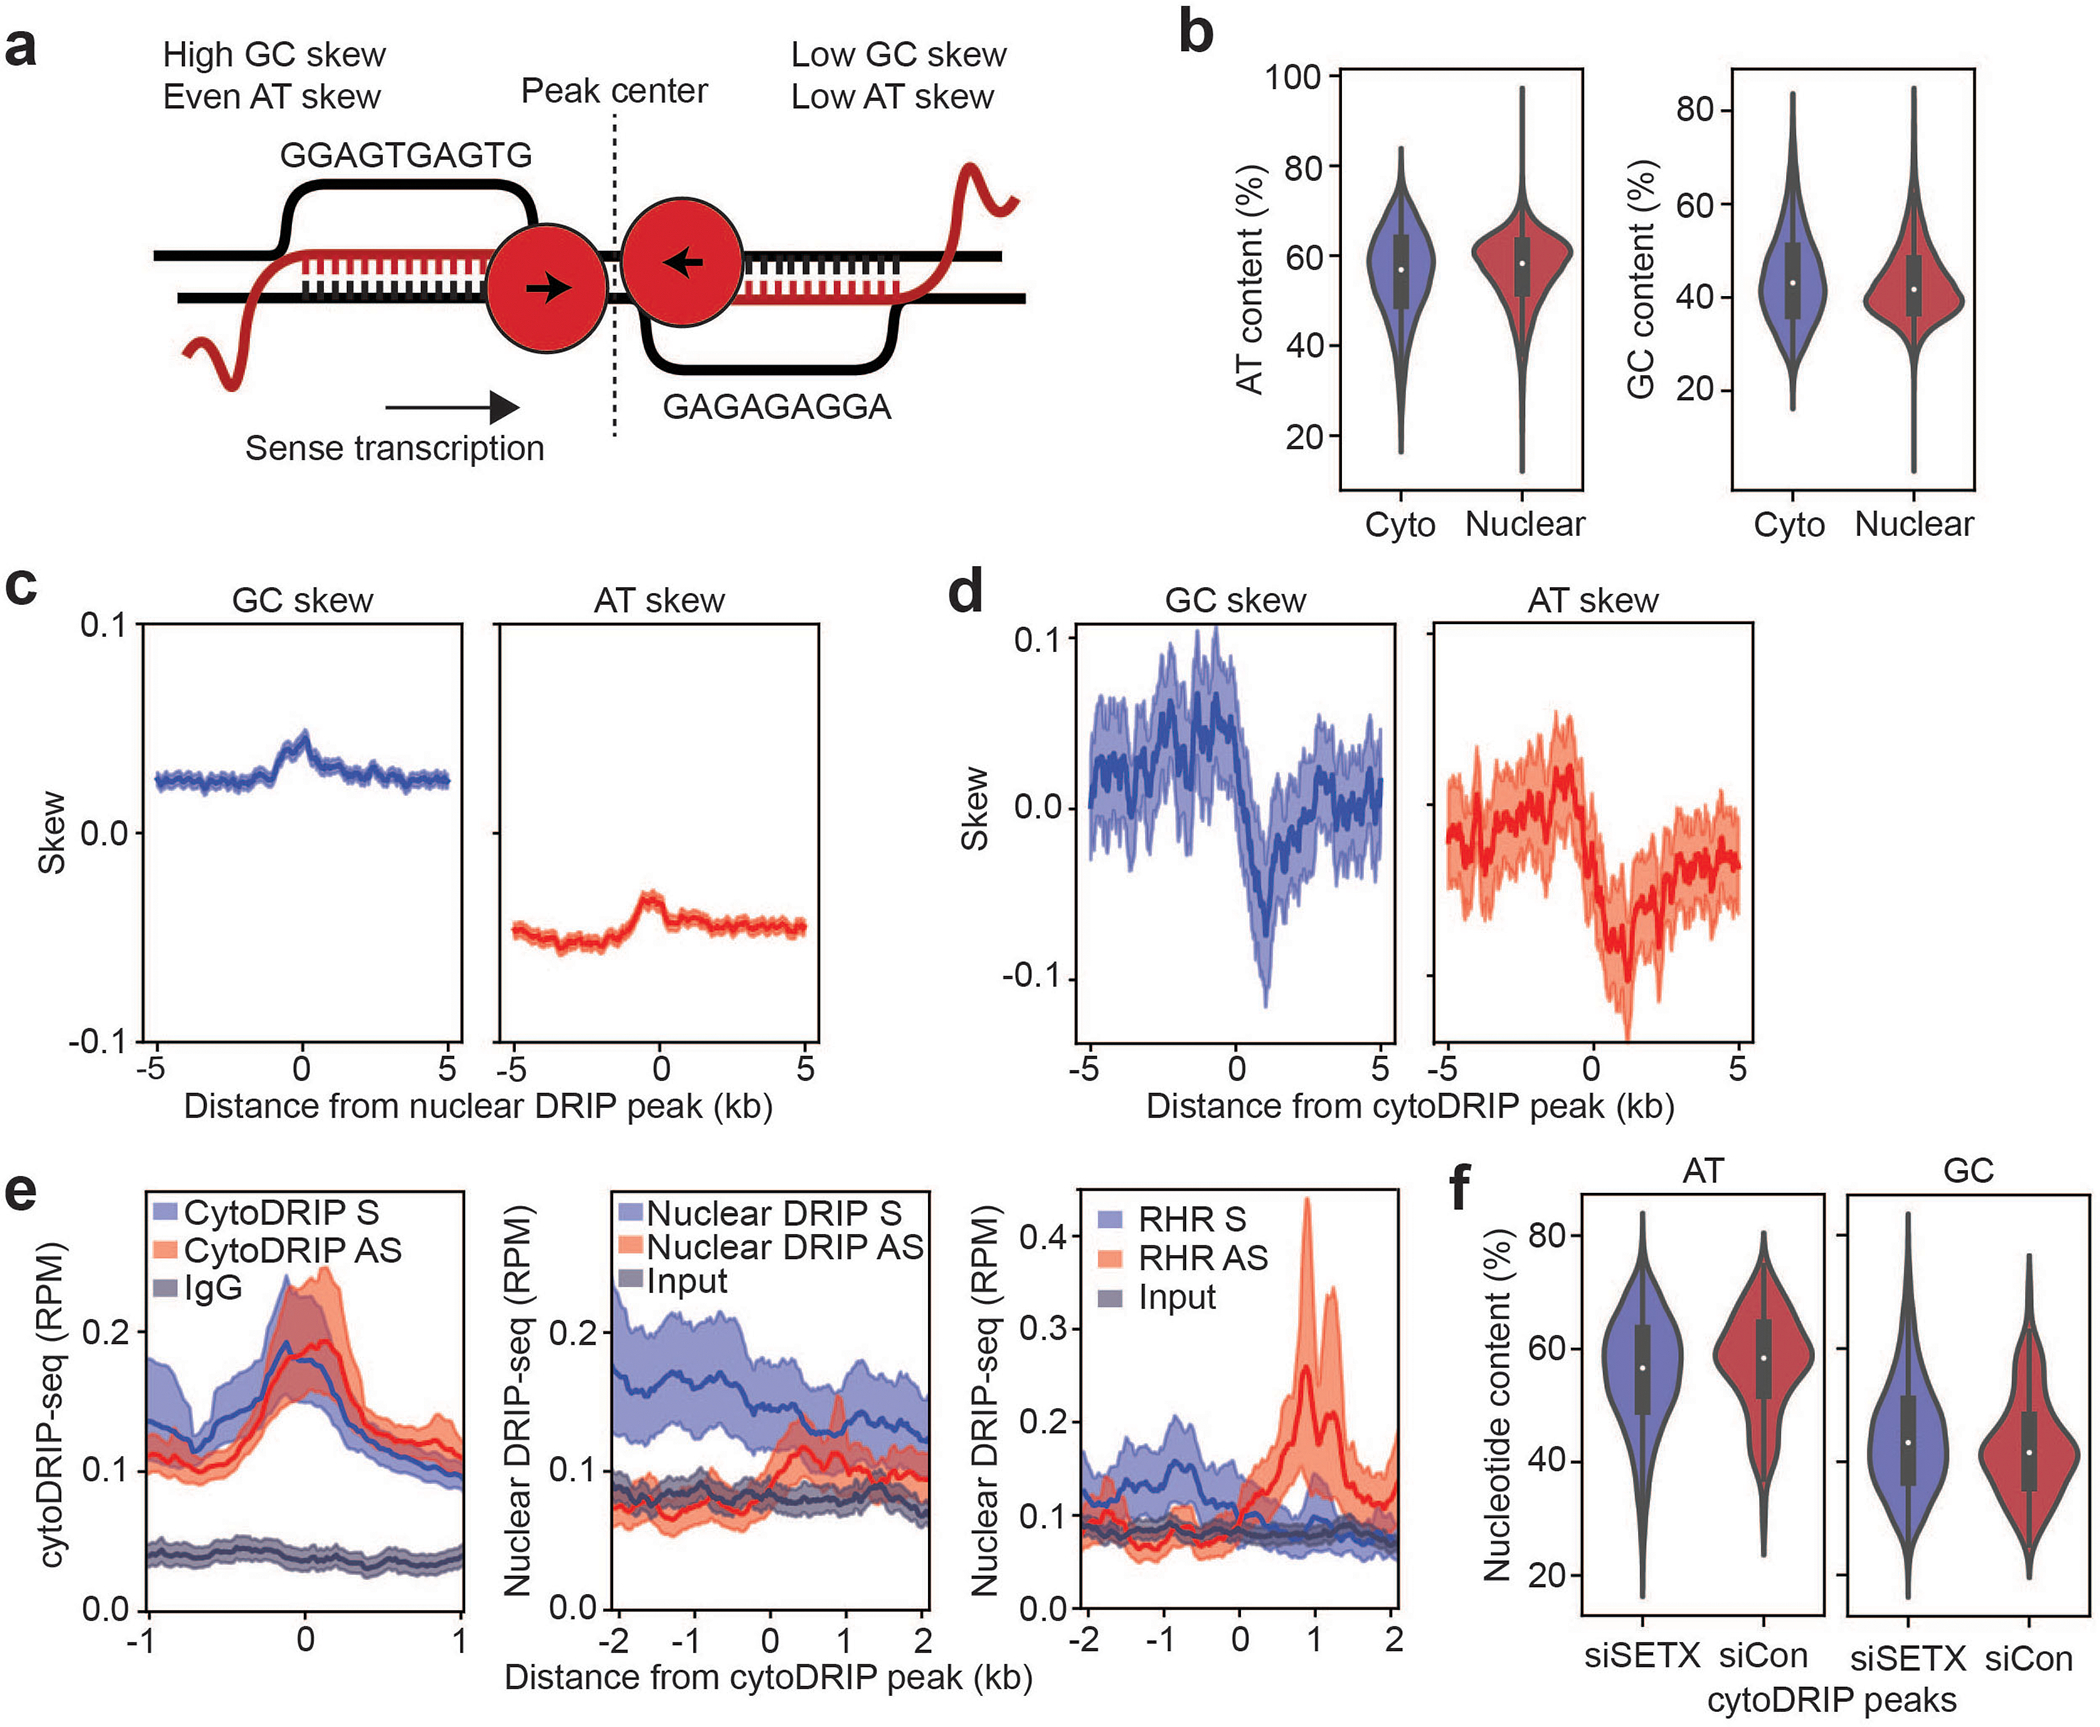
(a) Model of converging transcription at cytoDRIP peaks. RNA-DNA hybrids form as a result of sense and antisense transcription in regions of high GC-skew on the non-template strand. Example nucleotide sequences that fit the observed skew pattern are shown.
(b) Violin plots of AT content (left) and GC content (right) for cytoDRIP (n = 2911) and nuclear DRIP (n = 65,541) regions, two-tailed Mann Whitney U between cytoDRIP and nuclear DRIP regions: p = 3.6e-8 (left), p = 3.5e-16 (right). Center line, median; box limits, 75 and 25 percentiles, whiskers, min and max values.
(c) Aggregate plots around genic nuclear DRIP regions (n = 56,433) showing GC skew (left) and AT skew (right). Error bands represent 95% CI of the mean.
(d) Aggregate plots around genic siCon cytoDRIP regions showing GC skew (left) and AT skew (right). Means of 282 peaks (n = 282) are shown; error bands represent 95% CI of the mean.
(e) Aggregate plots around genic siCon cytoDRIP regions showing cytoDRIP-seq signal (left), nuclear DRIP-seq signal (middle) and nuclear RHR signal (right). Means of 282 peaks (n = 282) are shown; error bands represent 95% CI of the mean.
(f) Violin plots of AT content (left) and GC content (right) for siSETX (n = 2629) and siCon (n = 282) cytoDRIP regions, two-tailed Mann Whitney U between cytoDRIP and nuclear DRIP regions: p = 0.003 (left), p = 0.003 (right). Center line, median; box limits, 75 and 25 percentiles, whiskers, min and max values.
Extended Data Fig. 7. Different perturbations inducing cellular R-loops trigger IRF3 signaling and apoptosis.
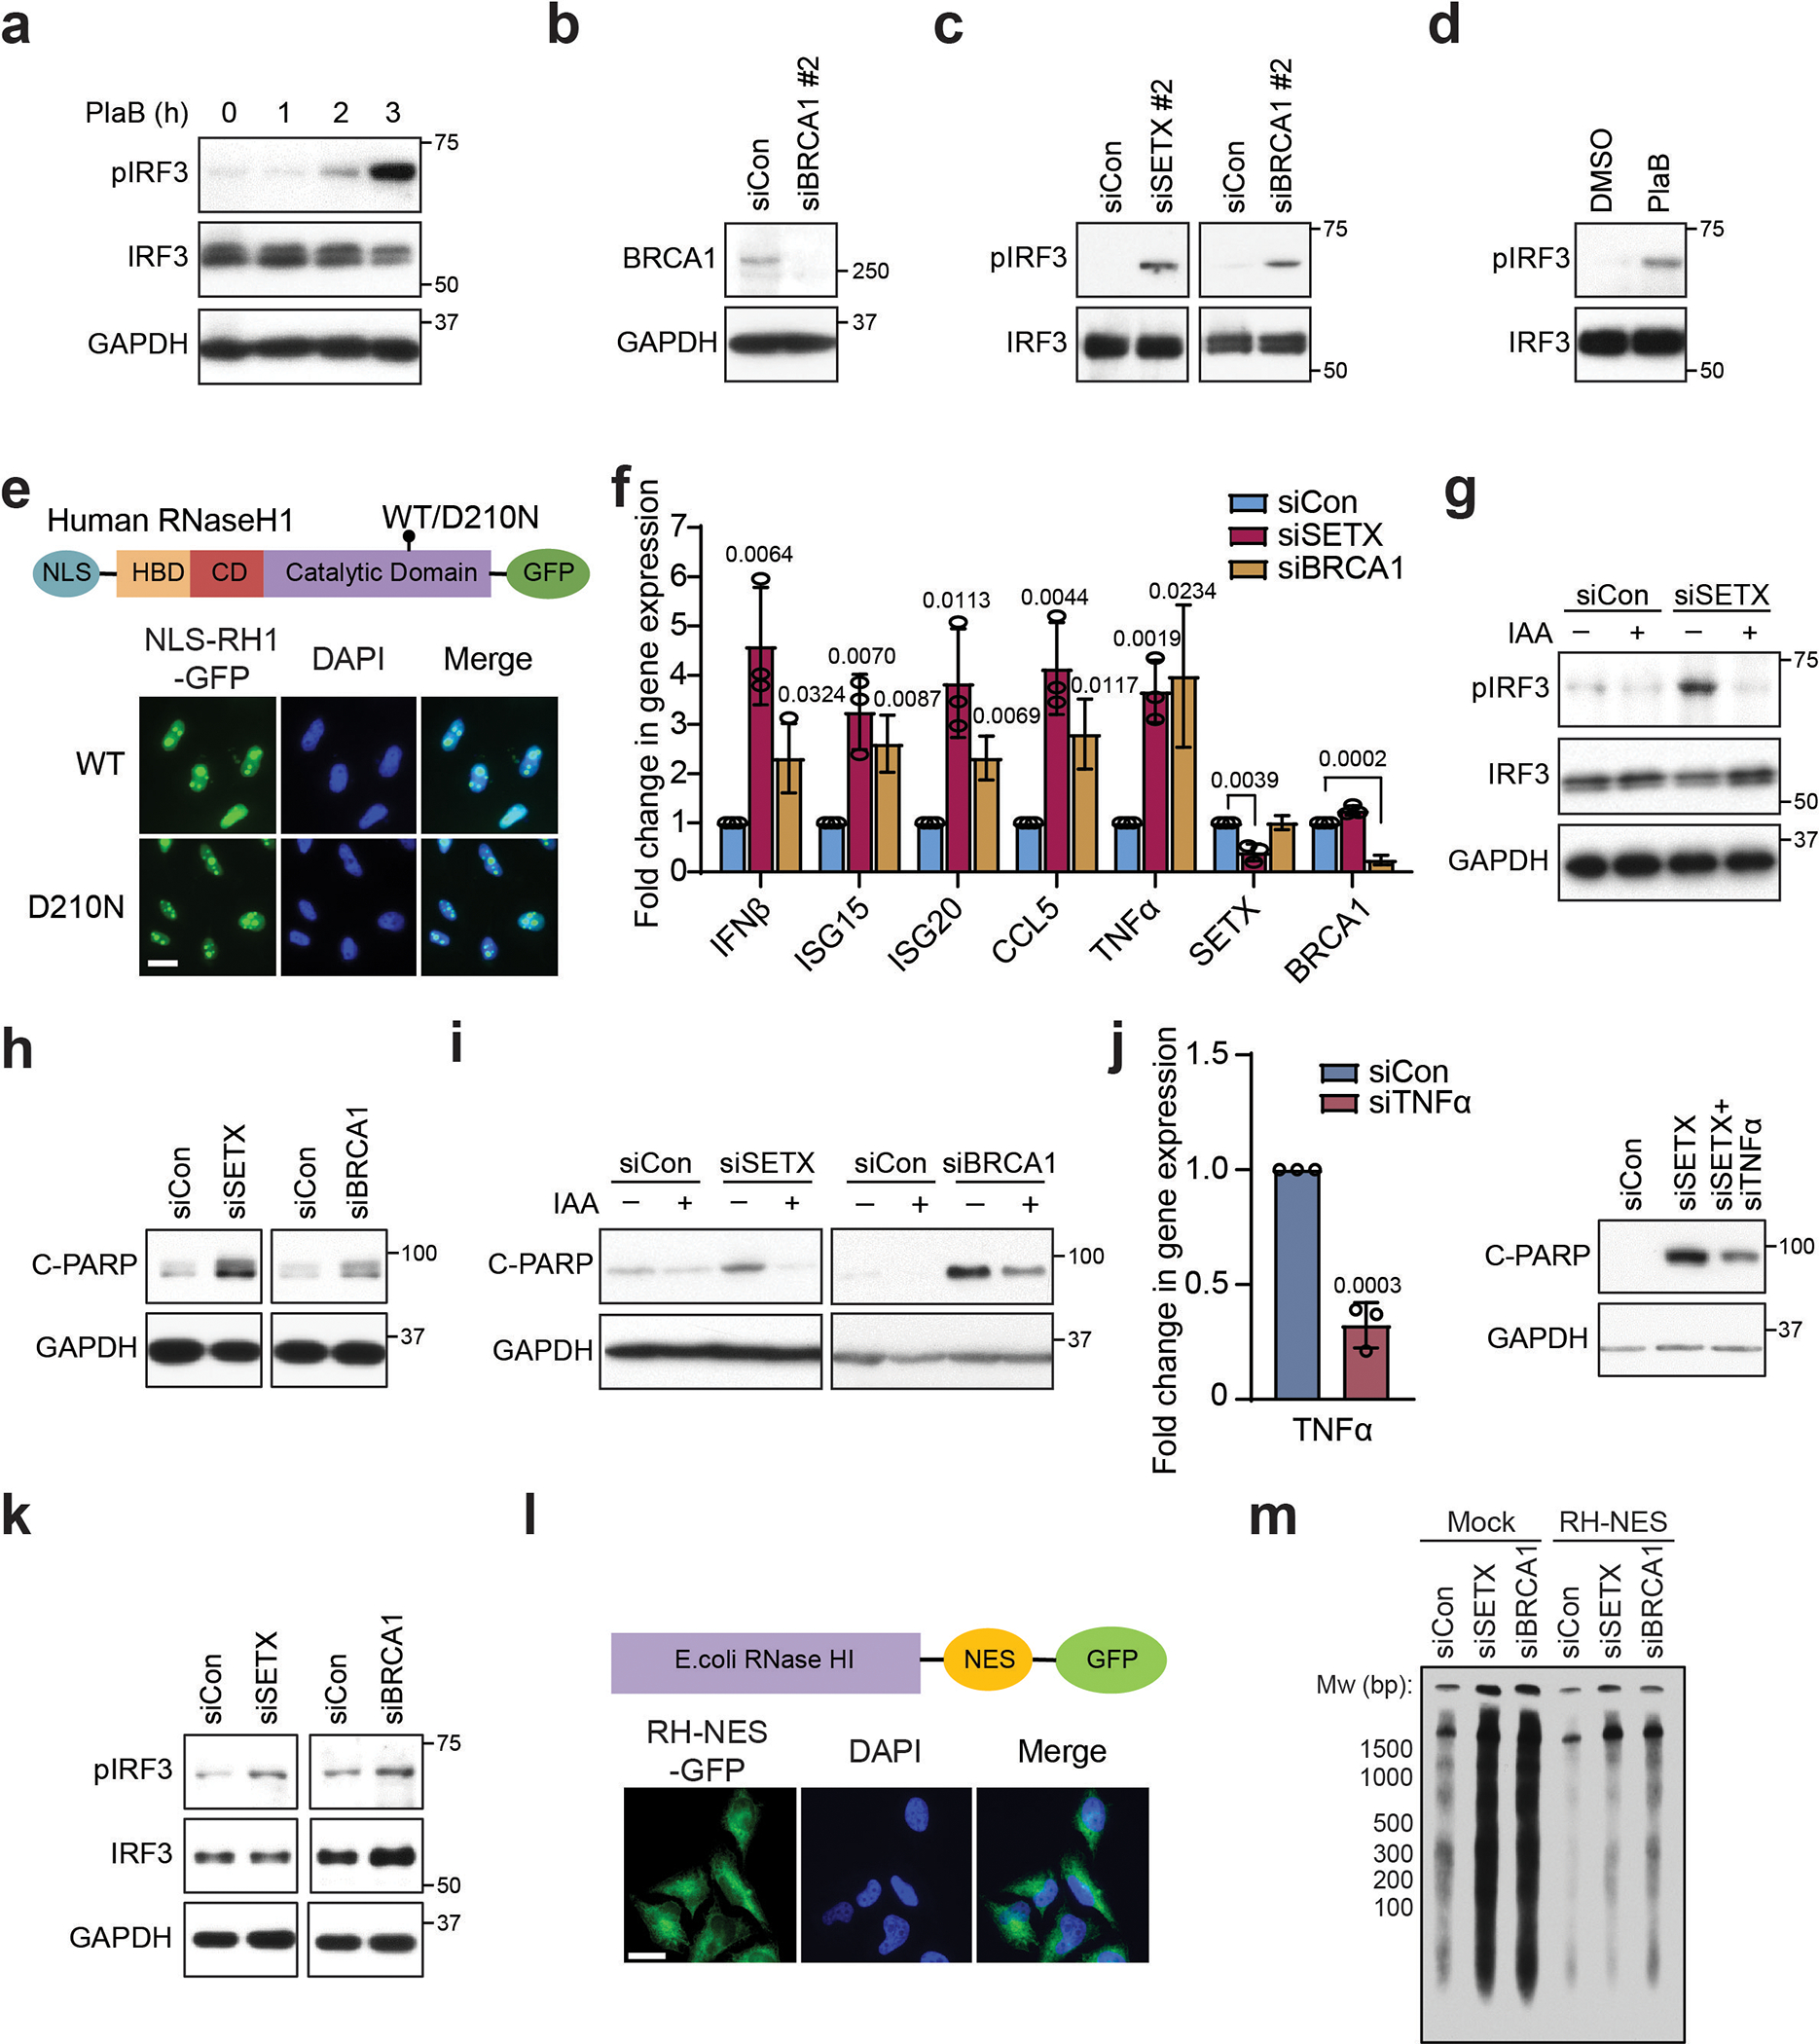
(a) Western blot of pIRF3 upon PlaB treatment (500 nM) in HeLa cells. GAPDH is the loading control.
(b) Western blot showing knockdown efficiency of a second siRNA to BRCA1. GAPDH serves as the loading control.
(c) Western blot showing pIRF3 levels upon knockdown of SETX or BRCA1 using a second siRNA in HeLa cells.
(d) Effect of PlaB treatment (500 nM, 3 h) on pIRF3 in HCT116 cells.
(e) Top: Schematic of nuclear localization signal (NLS)-tagged wild-type (WT) or catalytically-inactive (D210N) RNase H1. HBD = hybrid binding domain, CD = connection domain. Bottom: cellular localization of GFP-tagged NLS-RNaseH1 WT/D210N. Scale bar, 20 μm.
(f) RT-qPCR measurements of IRF3 effectors upon knockdown of SETX or BRCA1 in MCF10A cells.
(g) Western blot of pIRF3 after auxin-induced XPG degradation and SETX knockdown in HCT116 cells. GAPDH is the loading control.
(h) Western blot showing C-PARP levels upon knockdown of SETX or BRCA1 in MCF10A cells.
(i) Western blot showing the impact of auxin-induced XPG degradation on C-PARP in siSETX- or siBRCA1-treated HCT116 cells. The same GAPDH blot, which is the loading control, is used in Extended Data Fig. 1n.
(j) Left: RT-qPCR showing the knockdown efficiency of TNFα in HeLa cells. Right: western blots showing levels of C-PARP upon knockdown of TNFα in siSETX-treated HeLa cells.
(k) Western blot showing levels of pIRF3 upon knockdown of SETX or BRCA1 in BAX−/−BAK−/− HeLa cells.
(l) Top: Schematic of nuclear export signal (NES)-tagged RNase HI. Bottom: cellular localization of GFP-tagged RNase HI-NES in HeLa cells. Scale bar, 20 μm.
(m) CytoDRIP blot showing cytoplasmic hybrids upon knockdown of SETX or BRCA1 in mock-treated HeLa cells and HeLa cells stably expressing NES-tagged RNase HI.
Bar graphs are mean ± s.d. from 3 independent biological replicates (n = 3) (unpaired two-tailed t-test with CI = 95%). P values are shown at the top of the graphs.
Extended Data Fig. 8. cGAS and TLR3 cooperate to activate IRF3 signaling.
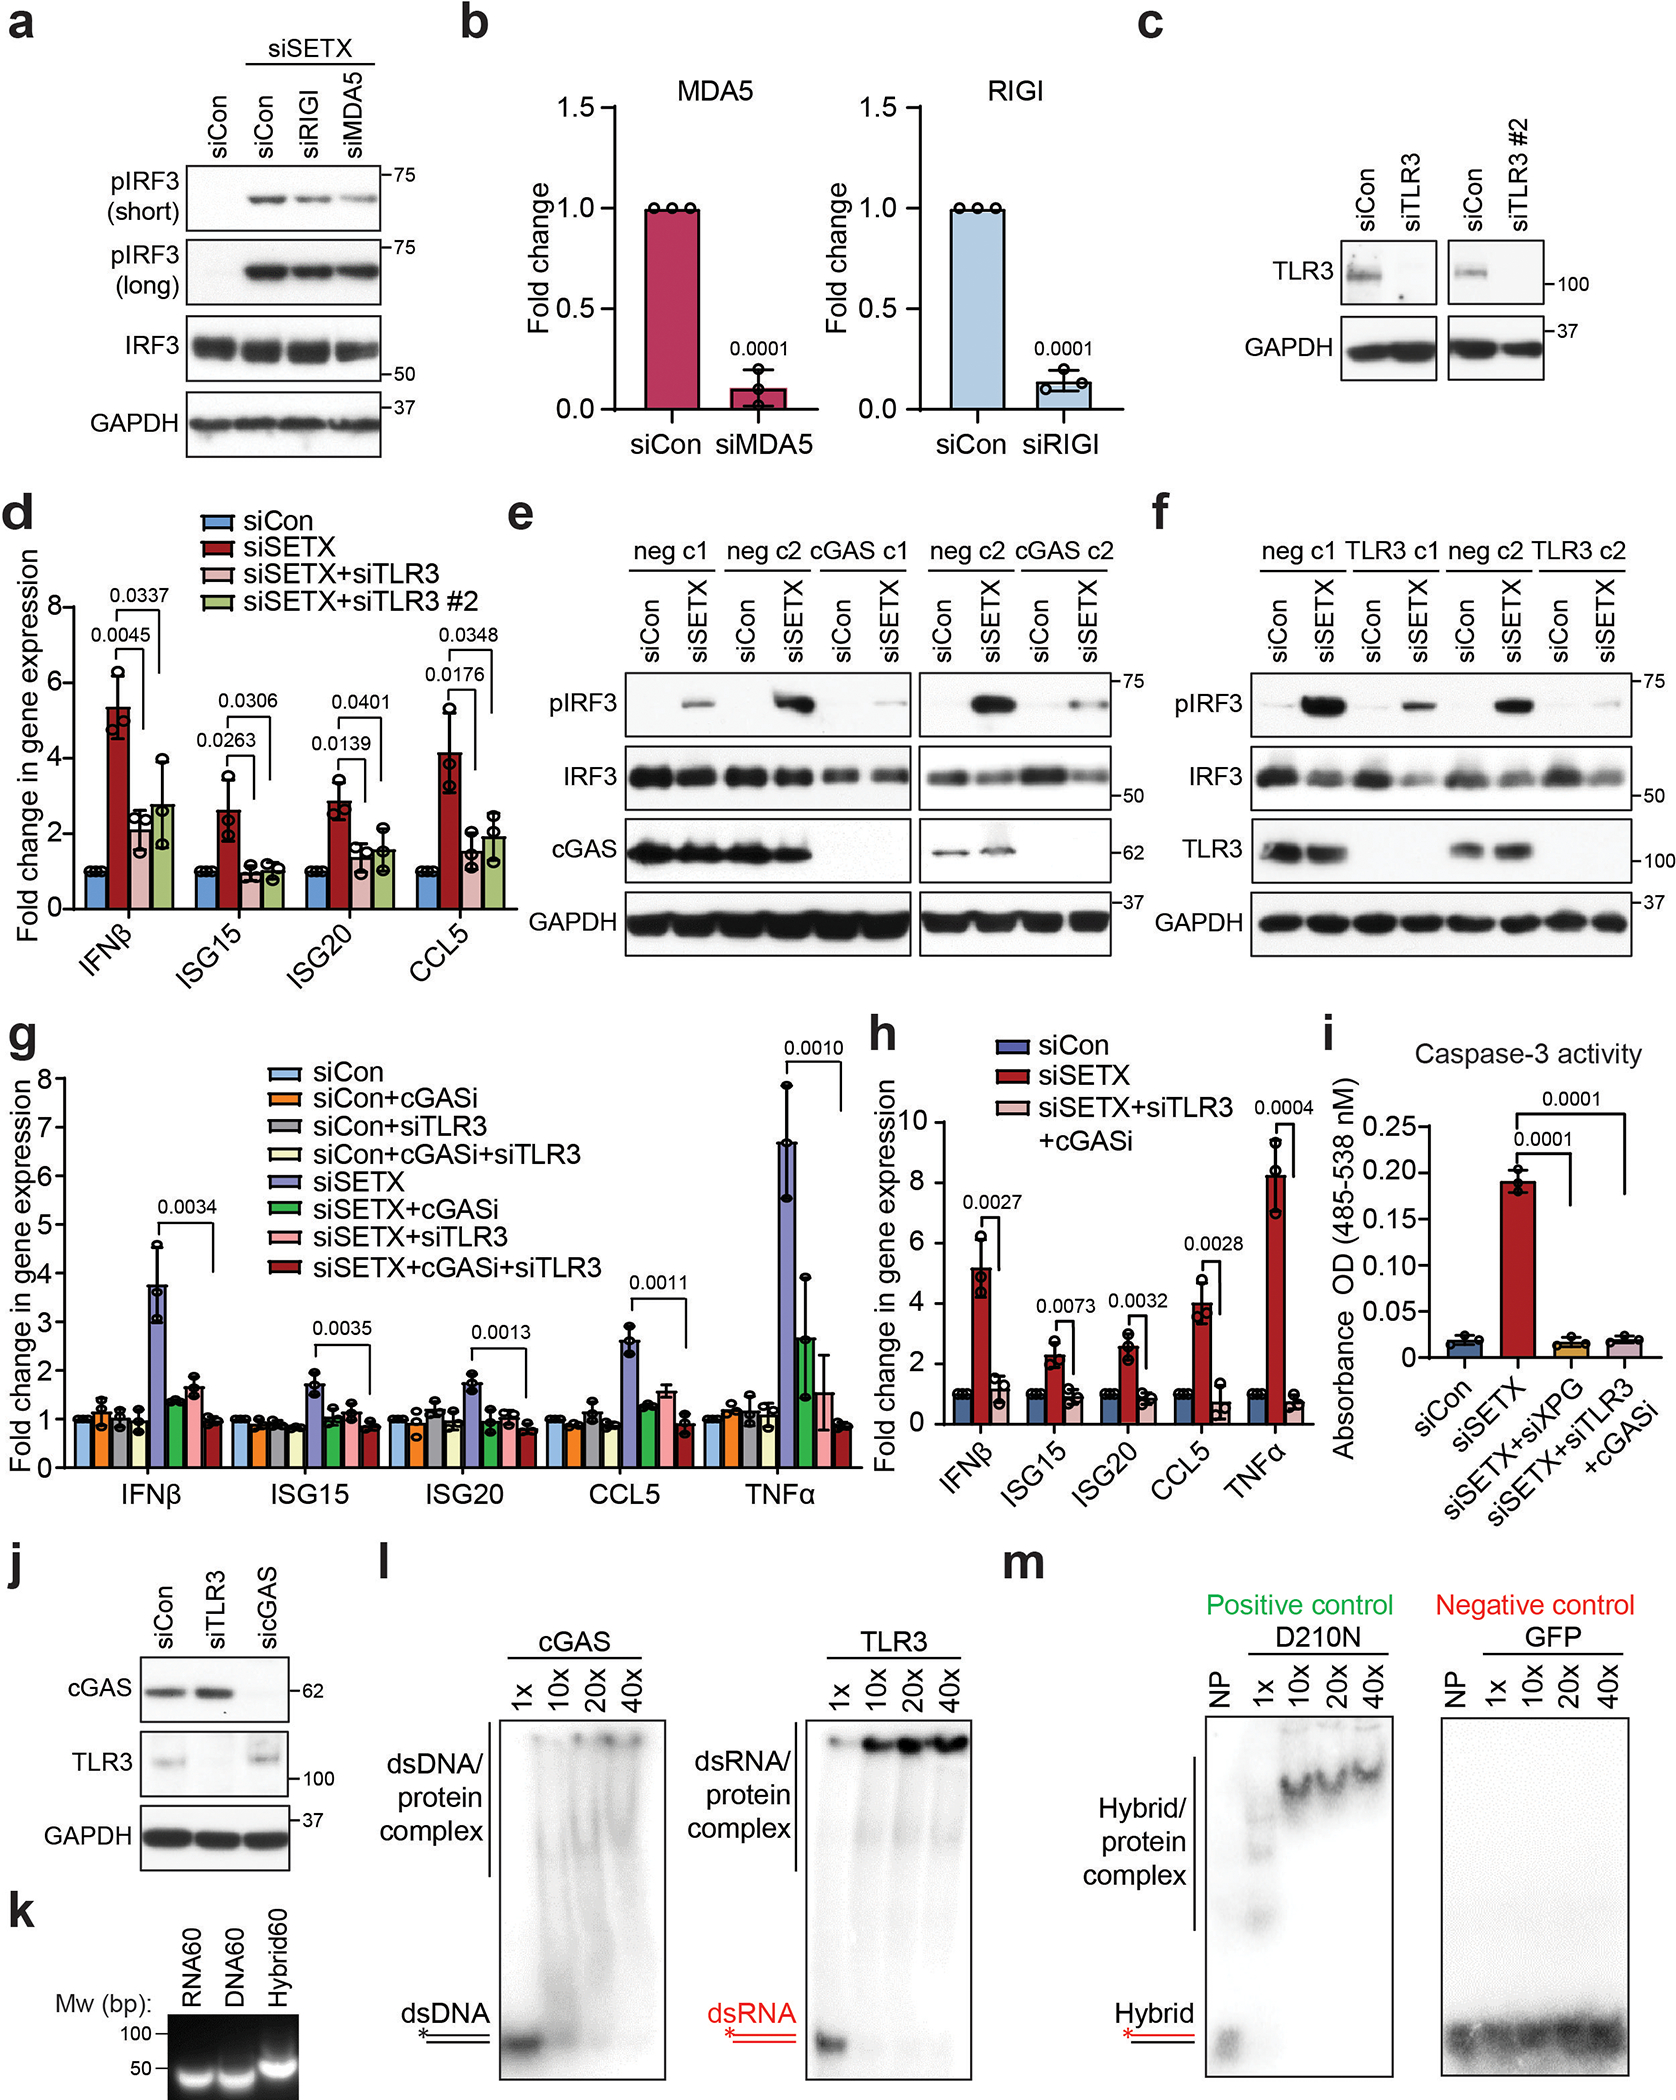
(a) Western blot showing pIRF3 levels upon siRNA-mediated knockdown of SETX and either RIG1 or MDA5 in HeLa cells. GAPDH is the loading control.
(b) RT-qPCR showing the knockdown efficiency of RIGI and MDA5 in HeLa cells.
(c) Western blot showing the knockdown efficiency of two different TLR3 siRNAs in HeLa cells.
(d) RT-qPCR measurements of IRF3 effectors upon TLR3 knockdown with two different siRNAs in siSETX-treated BAX−/−BAK−/− HeLa cells.
(e) and (f) Western blot showing levels of pIRF3 in two negative control (neg) clones and either cGAS knockout clones (e) or TLR3 knockout clones (f) generated using the CRISPR–Cas9 system in HeLa cells. c1 = clone 1, c2 = clone 2. GAPDH serves as the loading control.
(g) RT-qPCR measurements of IRF3 effectors upon single or combined inhibition/knockdown of cGAS and TLR3 in control and siSETX-treated HeLa cells.
(h) As in (g) but in BAX−/−BAK−/− HeLa cells.
(i) Caspase 3 activity assay after knockdown of SETX and either XPG knockdown or the combination of cGAS inhibition and TLRs knockdown.
(j) cGAS and TLR3 protein levels upon siRNA-mediated knockdown of TLR3 or cGAS in HeLa cells.
(k) Agarose gel showing DNA (60 nt) and RNA (60 nt) oligonucleotides can anneal to form a DNA/RNA hybrid.
(l) Gel shift assays of cGAS binding to double-stranded DNA (dsDNA) (left) and TLR3 binding to double-stranded RNA (dsRNA) (right).
(m) Gel shift assays show binding of human RNaseH1 D210N catalytically-inactive mutant and GFP protein to RNA-DNA hybrids which are used as positive and negative controls, respectively. NP stands for no protein.
Bar graphs are mean ± s.d.from three independent biological replicates (n = 3) (unpaired two-tailed t-test with CI = 95%). P values are shown at the top of the graphs.
Extended Data Fig. 9. cGAS and TLR3 bind directly to cytoplasmic RNA-DNA hybrids.
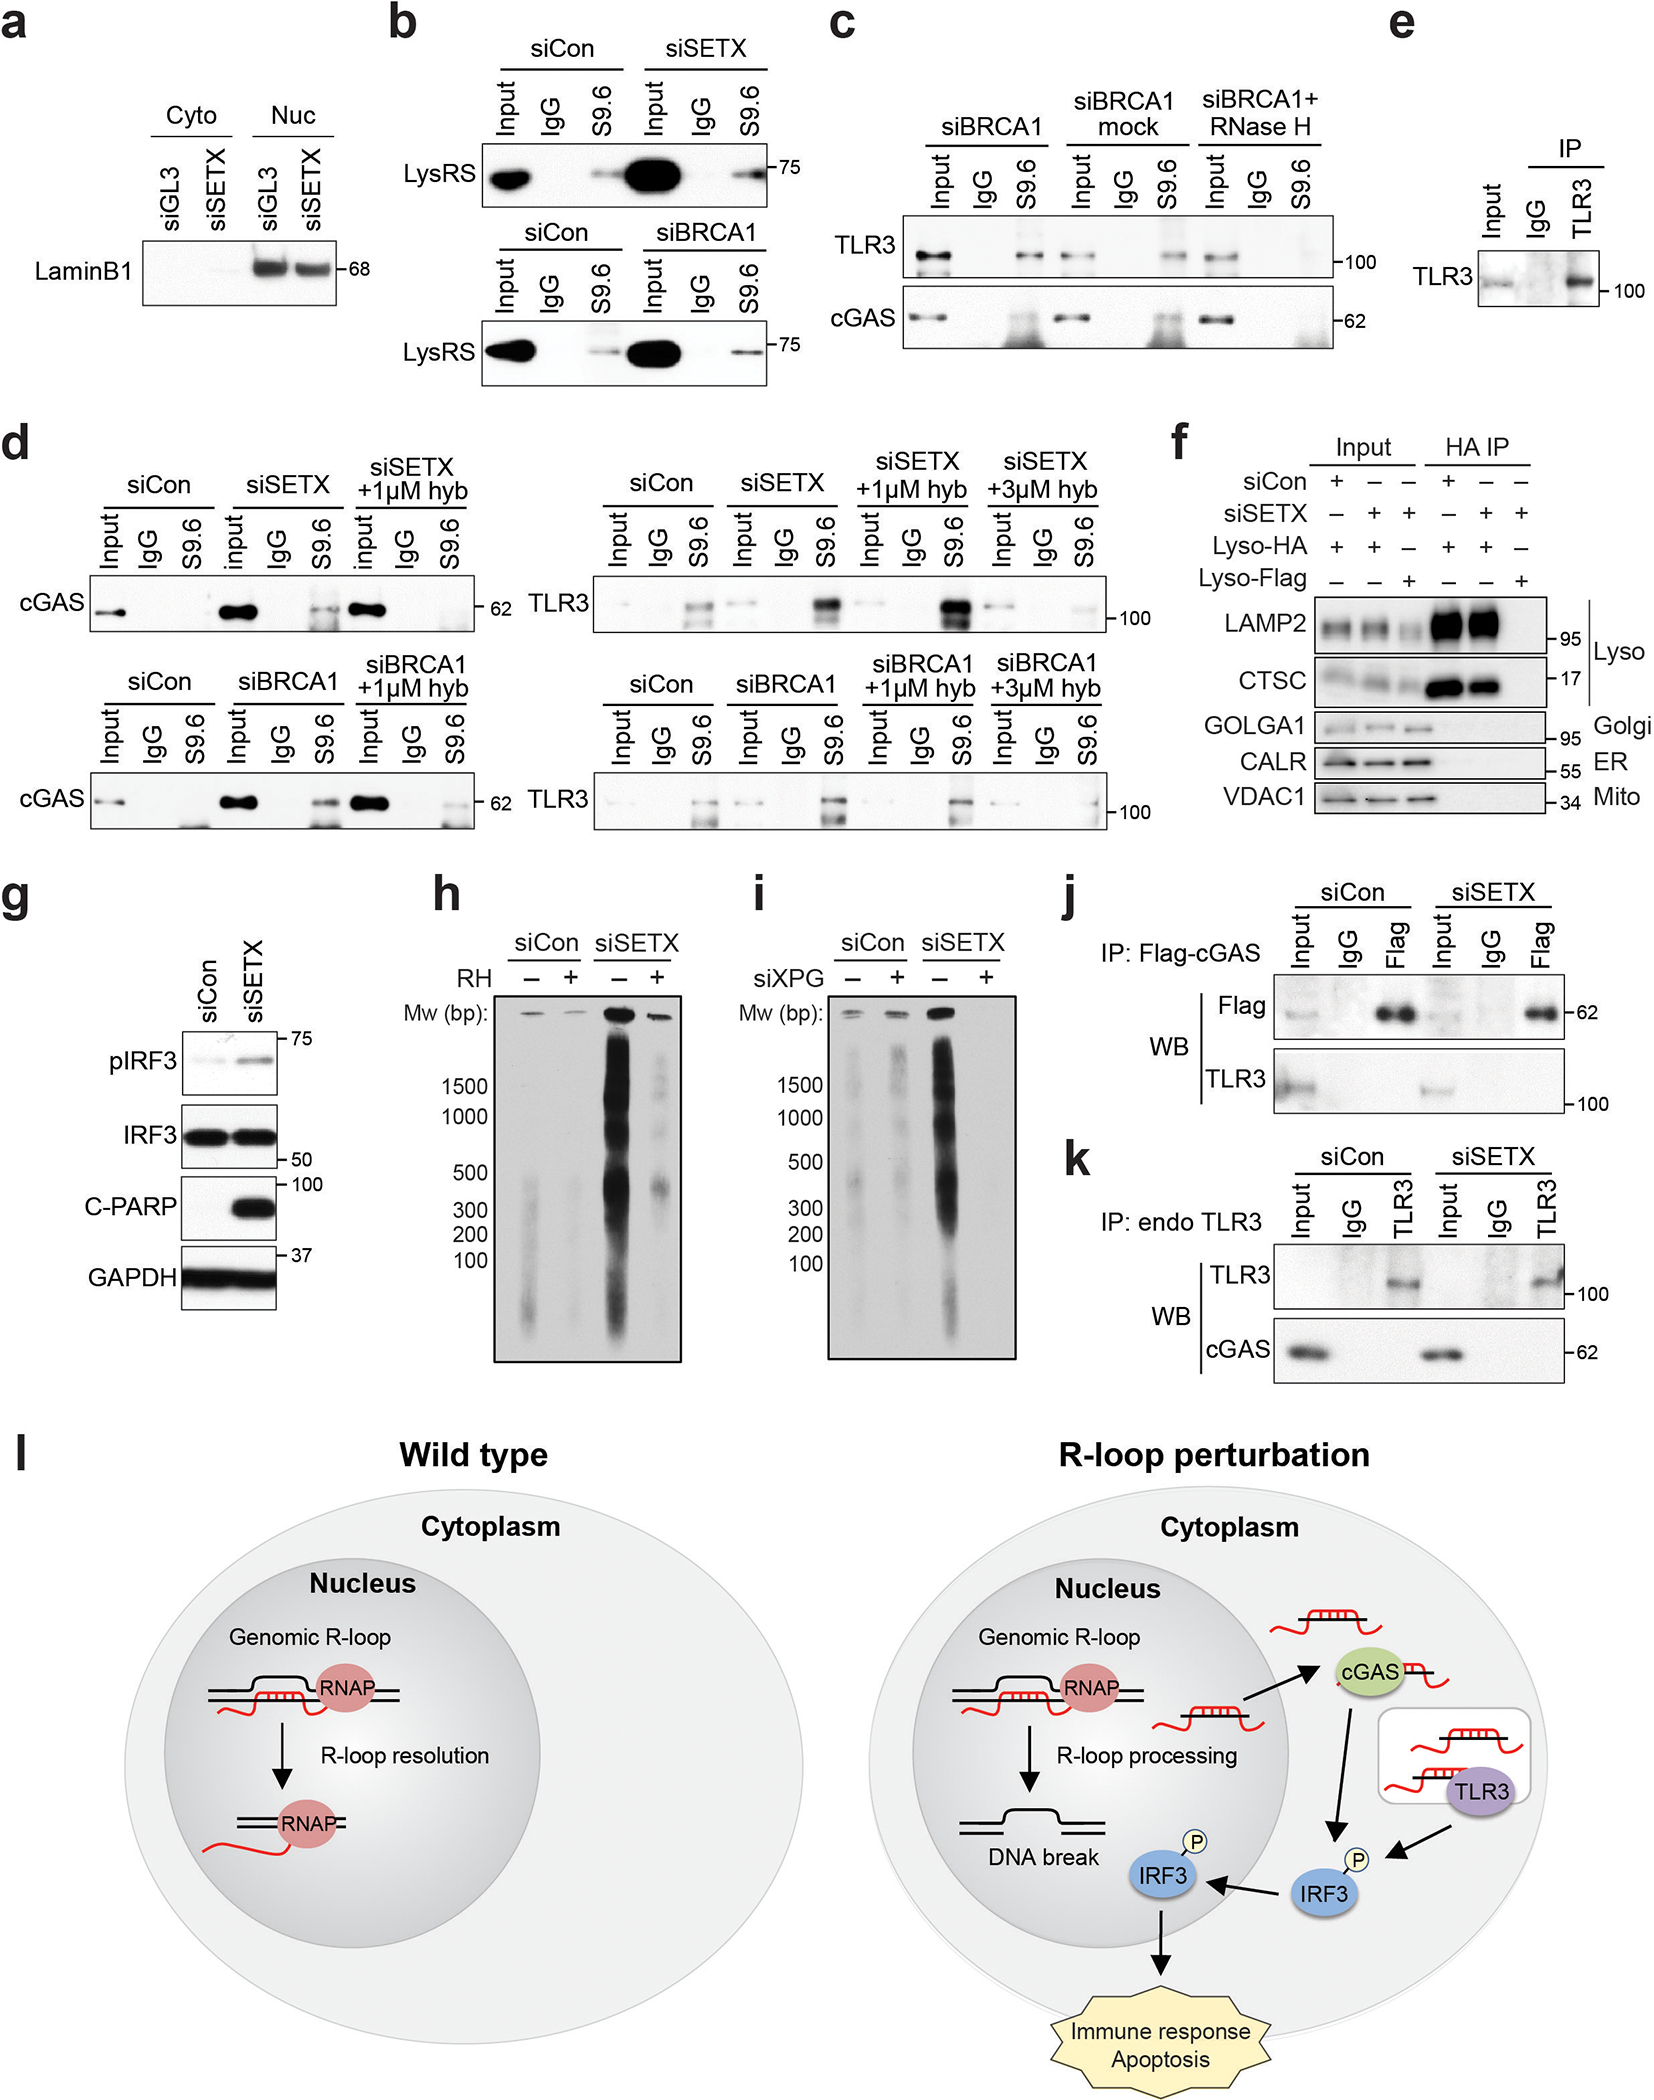
(a) The purity of the cytoplasmic fraction used for the S9.6 co-IP was assessed by western blot.
(b) S9.6 co-IP from the cytoplasmic fraction showing LysRS binds to cytoplasmic hybrids in our methods. LysRS has been reported to interact with cytoplasmic hybrids and serves as the positive control.
(c) S9.6 co-IP from the cytoplasmic fraction showing cGAS and TLR3 associate with RNA-DNA hybrids isolated from siBRCA1-treated cells, as well as the impact of 37°C no enzyme mock control and in vitro RNase H treatment before the IP step. RNase H treatment, 50 U/ml for 1 h at 37°C.
(d) S9.6 co-IP from cytoplasmic fraction showing cGAS binding to hybrids induced by siSETX is disrupted by 1 μM hybrid competitor in IP reaction, and TLR3 binding to hybrids is disrupted by 3 μM hybrid competitor in an IP reaction. hyb = hybrid.
(e) Western blot validating the TLR3 IP efficiency in experiments to detect TLR3-associated cytoplasmic hybrids by performing TLR3 IP followed by S9.6 IP (Fig. 4h).
(f) Western blot assessing the purity of the endolysosomal fraction after isolation following HA immunoprecipitation in control or SETX-depleted HA-TMEM192 HEK293T cells. Flag-TMEM192 HEK293T cells were used as a negative control for the LysoIP. Proteins marking the lysosome (Lyso), Golgi apparatus (Golgi), endoplasmic reticulum (ER) and mitochondria (Mito) are indicated.
(g) Western blot showing pIRF3 and C-PARP levels induced by SETX knockdown in HA-TMEM192 HEK293T cells, as was observed in HeLa cells. This result suggests this cell line is suitable for the study of R-loop-induced immune activation. This experiment is a control for the LysoIP (Fig. 4i).
(h) cytoDRIP blot showing cytoplasmic hybrids levels are elevated upon knockdown of SETX in HA-TMEM192 HEK293T cells. In vitro RNase H digestion was used to ensure IP specificity. This experiment is also a control for the LysoIP.
(i) cytoDRIP blot showing cytoplasmic hybrids upon knockdown of SETX in HA-TMEM192 HEK293T cells with or without knockdown of XPG.
(j) co-IP testing the interaction between Flag-tagged cGAS and endogenous TLR3.
(k) co-IP testing the interaction between endogenous TLR3 and cGAS.
(l) Working model. Left: in wild-type cells, nuclear R-loops are efficiently resolved by RNase H or RNA-DNA helicases, such as SETX. Only a small number of R-loops are processed by XPG and converted to cytoplasmic hybrids, so that cytoplasmic hybrid levels are below the threshold required for activation of IRF3 signaling. Right: under certain perturbations, including depletion of SETX/BRCA1, or under pathological conditions that deregulate R-loops, a subset of nuclear R-loops that may not be efficiently resolved are processed by XPG, leading to RNA-DNA hybrid accumulation in the cytoplasm. These hybrids are then recognized by cGAS and TLR3 in the cytosol and endolysosome, activating IRF3-mediated immune signaling and apoptosis.
Extended Data Fig. 10. R-loop-induced cytoplasmic RNA-DNA hybrid accumulation and innate immune activation in patient-derived disease cell models.
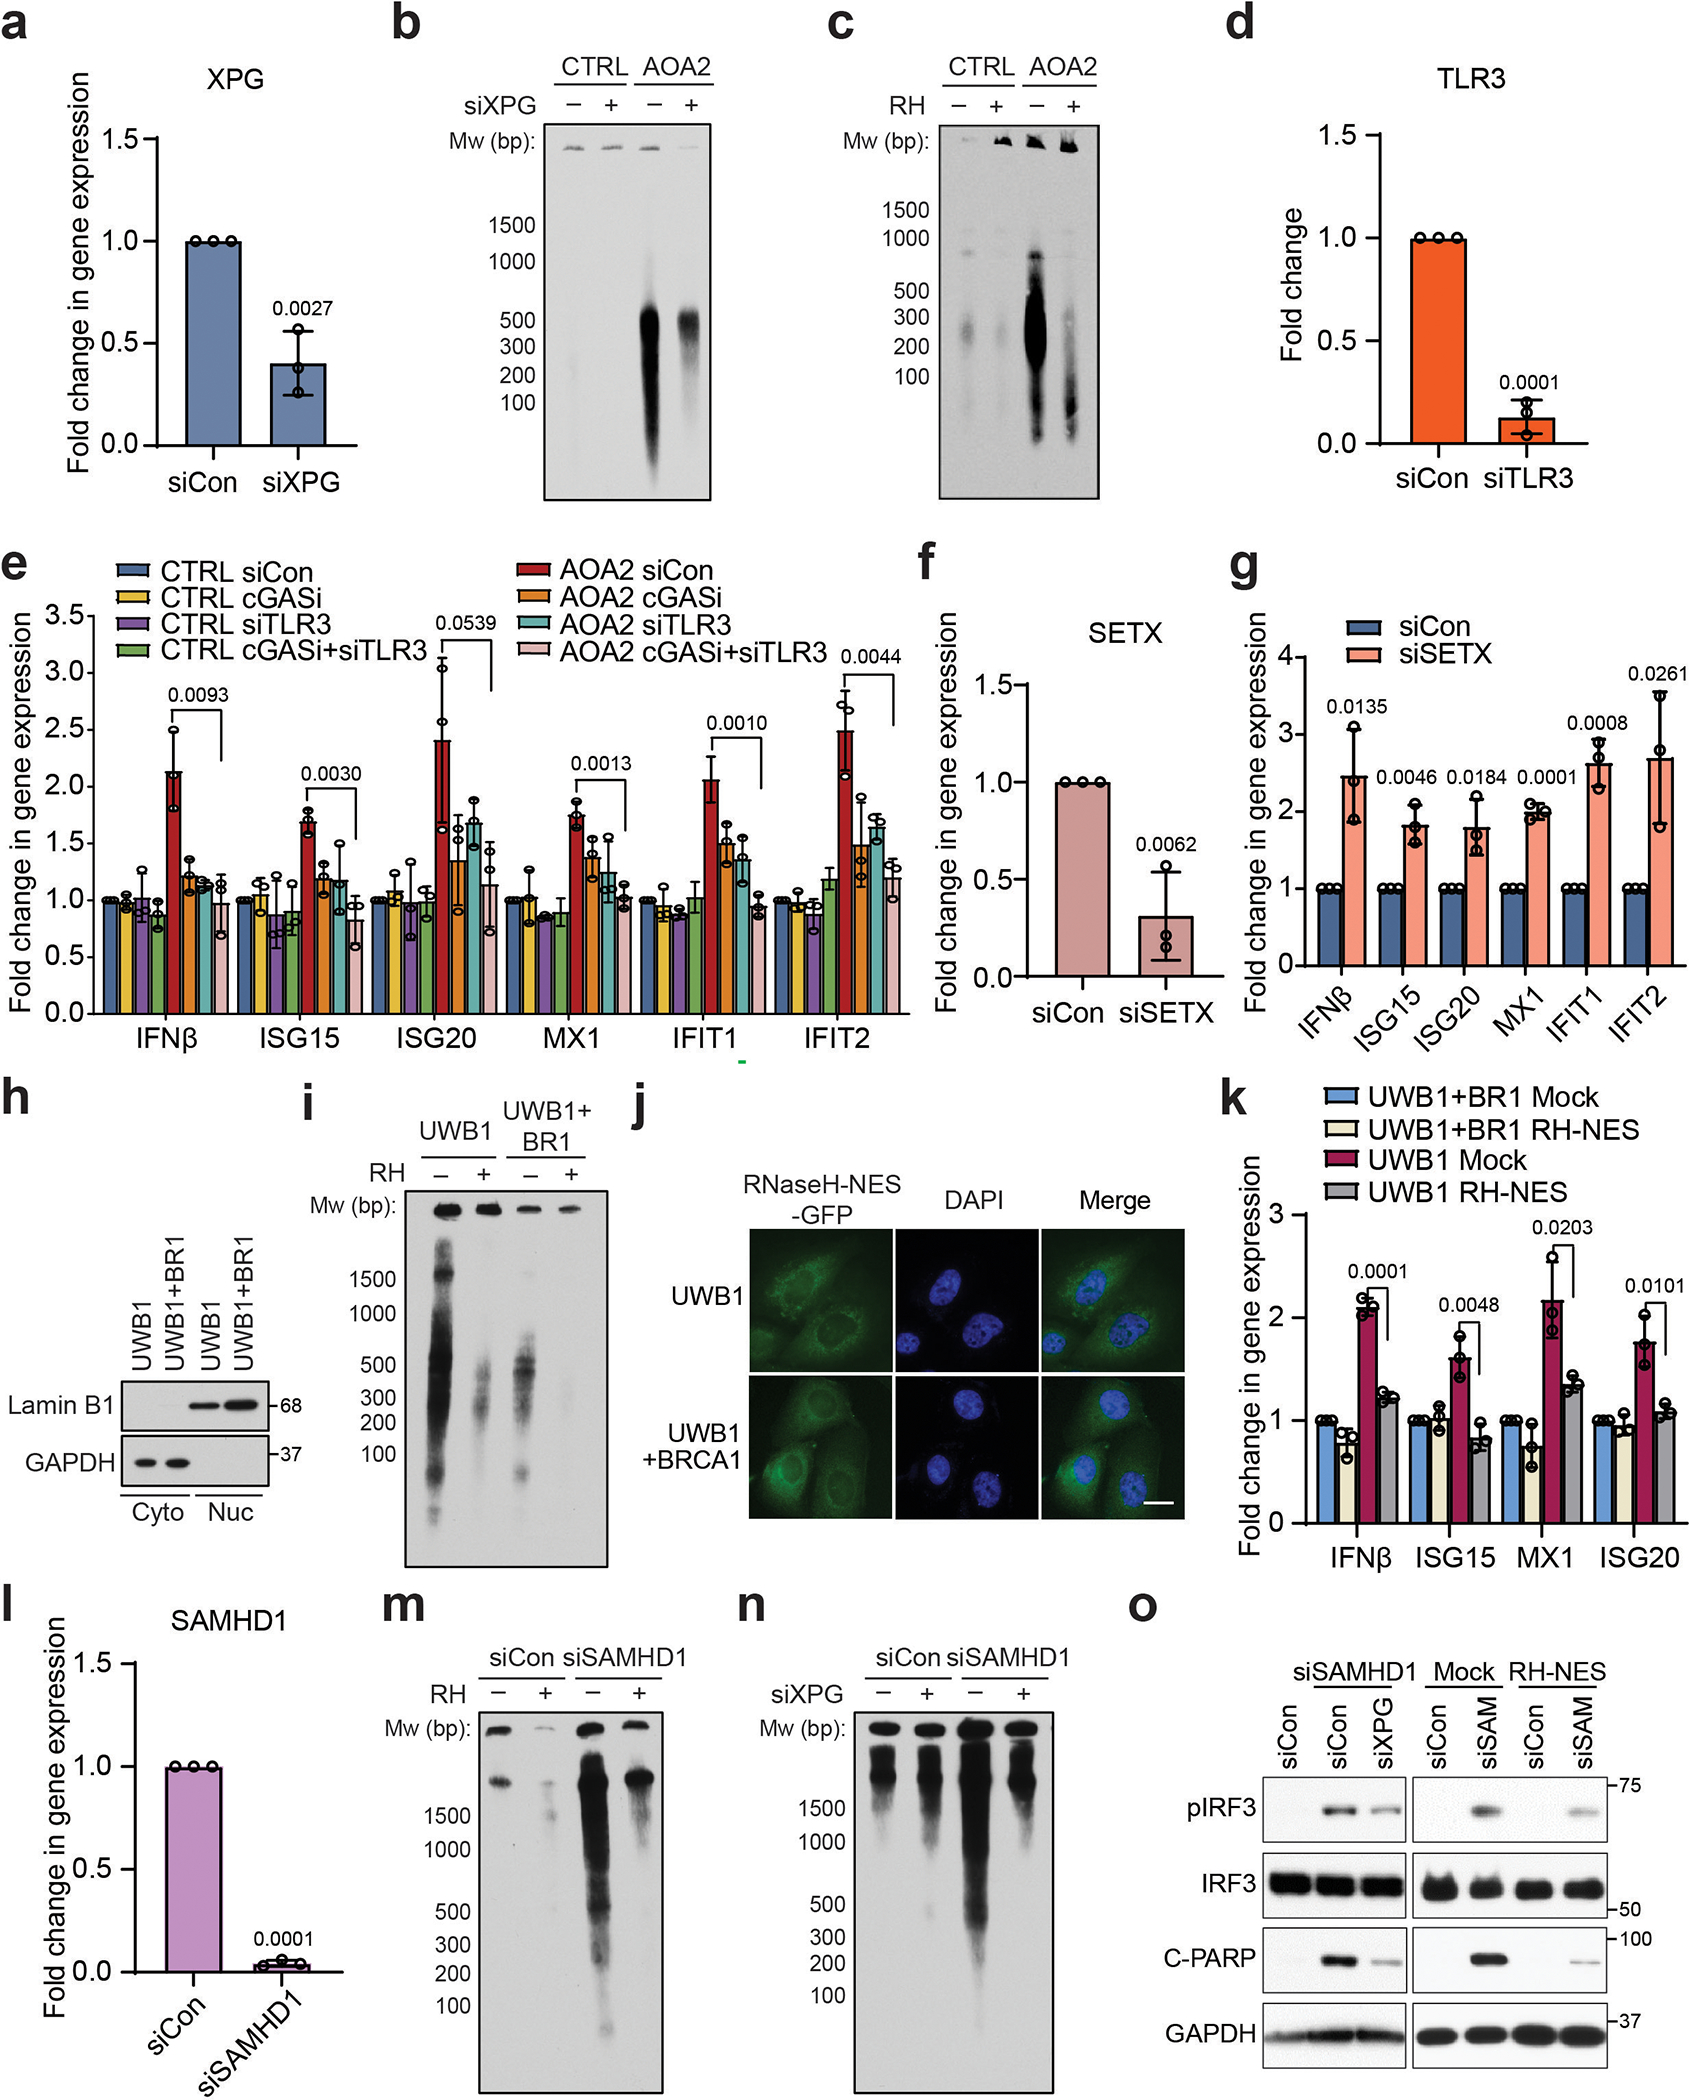
(a) RT-qPCR showing the XPG siRNA knockdown efficiency in AOA2 patient-derived fibroblasts.
(b) cytoDRIP blot showing cytoplasmic hybrids in CTRL and AOA2 patient-derived fibroblasts with or without knockdown of XPG.
(c) cytoDRIP blot showing cytoplasmic hybrids in CTRL and AOA2 patient-derived fibroblasts with or without in vitro RNase H treatment prior to hybrid IP.
(d) RT-qPCR showing the knockdown efficiency of TLR3 in AOA2 patient-derived fibroblasts.
(e) RT-qPCR measurements of immune effectors upon single or combined inhibition and knockdown of cGAS and TLR3, respectively, in CTRL and AOA2 patient-derived fibroblasts.
(f) RT-qPCR showing the SETX siRNA knockdown efficiency in CTRL fibroblasts.
(g) RT-qPCR measurements of IFNβ and ISGs upon knockdown of SETX in CTRL fibroblasts.
(h) Western blot showing the fractionation of UWB1.289 and UWB1.289+BRCA1 cells into soluble nuclear and cytoplasmic compartments with LaminB1 and GAPDH as markers, respectively.
(i) cytoDRIP blot showing cytoplasmic hybrids in UWB1.289 and UWB1.289+BRCA1 cells with or without in vitro RNaseH treatment prior to hybrid IP.
(j) Cellular localization of GFP-tagged NES-RNaseHI in UWB1.289 and UWB1.289+BRCA1 cells. Scale bar, 20 μm.
(k) RT-qPCR measurements of immune effectors in UWB1.289 and UWB1.289+BRCA1 cells stably expressing GFP (mock) or NES-tagged RH (RH-NES).
(l) RT-qPCR showing the SAMHD1 siRNA knockdown efficiency in HeLa cells.
(m) cytoDRIP blot showing cytoplasmic hybrids in control and SAMHD1-deficient HeLa cells with or without in vitro RNase H treatment.
(n) cytoDRIP blot showing cytoplasmic hybrids in control and SAMHD1-deficient HeLa cells with or without XPG knockdown.
(o) Left: western blots showing levels of pIRF3 and C-PARP upon knockdown of XPG in siSAMHD1-treated HeLa cells. Right: western blots showing pIRF3 and C-PARP level upon knockdown of SAMHD1 in mock and RH-NES HeLa stable cell lines. siSAM = siSAMHD1.
Bar graphs are mean ± s.d. from three independent biological replicates (n = 3) (unpaired, two-tailed t-test with CI = 95%). P values are shown at the top of the graphs.
Supplementary Material
ACKNOWLEDGEMENTS
We thank Joanna Wysocka, Stephan Hamperl, and Julie Sollier for helpful discussions and comments. We also thank Miaw-Sheue Tsai (GFP-dRH) and the Straight lab (help in designing AID-XPG in HeLa).
FUNDING
This work was supported by: Leukemia and Lymphoma Society [5455-17 to M.P.C.]; National Institutes of Health [GM119334 to K.A.C., S10OD018220 to the Stanford Functional Genomics Facility, T32-CA09302 to M.J.B., T32-HG000044 to C.L., DP2-CA271386 to M.A-R]; Stanford Cancer Institute, an NCI-designated Comprehensive Cancer Center, to M.A-R and M.P.C; Korea Research Institute of Standards and Science [KRISS-GP2021-0003-10 to J-H.C.], National Research Foundation of Korea (MSIT) [NRF-2020R1A2C1101575 to J-H.C.], National Science Foundation [GRFP to C.L], Jane Coffin Childs Memorial Fund for Medical Research [61-1755 to J.R.B], gravitation program CancerGenomiCs.nl from the Netherlands Organisation for Scientific Research (NOW) and the Oncode Institute which is partly financed by the Dutch Cancer Society to W.V., and the V Foundation [D2018-017 to K.A.C.]. M.A-R is a Terman Fellow and Pew-Stewart Scholar. K.A.C. is an ACS Research Professor.
Footnotes
Competing Interests
K.A.C. is a scientific advisory board member of RADD Pharmaceuticals. M.A-R. is a scientific advisory board member of Lycia Therapeutics. The other authors declare no competing interests.
CODE AVAILABILITY
Further code information is available on request from the authors.
ADDITIONAL INFORMATION
Supplementary Information is available for this paper. Correspondence and requests for materials should be addressed to Karlene A. Cimprich.
DATA AVAILABILITY
All sequencing data generated in this work have been deposited in the Gene Expression Omnibus (GEO) under the accession number GSE178841. For nuclear DRIP-seq, datasets under accession number GSE134084 were used from https://doi.org/10.1093/nar/gkaa500.
REFERENCES
- 1.Crossley MP, Bocek M & Cimprich KA R-Loops as Cellular Regulators and Genomic Threats. Mol. Cell 73, 398–411 (2019). [DOI] [PMC free article] [PubMed] [Google Scholar]
- 2.Sollier J et al. Transcription-coupled nucleotide excision repair factors promote R-loop-induced genome instability. Mol. Cell 56, 777–785 (2014). [DOI] [PMC free article] [PubMed] [Google Scholar]
- 3.Makharashvili N et al. Sae2/CtIP prevents R-loop accumulation in eukaryotic cells. Elife 7, (2018). [DOI] [PMC free article] [PubMed] [Google Scholar]
- 4.Cristini A et al. Dual Processing of R-Loops and Topoisomerase I Induces Transcription-Dependent DNA Double-Strand Breaks. Cell Rep. 28, 3167–3181.e6 (2019). [DOI] [PMC free article] [PubMed] [Google Scholar]
- 5.Santos-Pereira JM & Aguilera A R loops: new modulators of genome dynamics and function. Nat. Rev. Genet. 16, 583–597 (2015). [DOI] [PubMed] [Google Scholar]
- 6.Hatchi E et al. BRCA1 recruitment to transcriptional pause sites is required for R-loop-driven DNA damage repair. Mol. Cell 57, 636–647 (2015). [DOI] [PMC free article] [PubMed] [Google Scholar]
- 7.Skourti-Stathaki K, Proudfoot NJ & Gromak N Human senataxin resolves RNA/DNA hybrids formed at transcriptional pause sites to promote Xrn2-dependent termination. Mol. Cell 42, 794–805 (2011). [DOI] [PMC free article] [PubMed] [Google Scholar]
- 8.Schlee M & Hartmann G Discriminating self from non-self in nucleic acid sensing. Nat. Rev. Immunol. 16, 566–580 (2016). [DOI] [PMC free article] [PubMed] [Google Scholar]
- 9.Suraweera A et al. Senataxin, defective in ataxia oculomotor apraxia type 2, is involved in the defense against oxidative DNA damage. J. Cell Biol. 177, 969–979 (2007). [DOI] [PMC free article] [PubMed] [Google Scholar]
- 10.Harding SM et al. Mitotic progression following DNA damage enables pattern recognition within micronuclei. Nature 548, 466–470 (2017). [DOI] [PMC free article] [PubMed] [Google Scholar]
- 11.He Y et al. NF-κB-induced R-loop accumulation and DNA damage select for nucleotide excision repair deficiencies in adult T cell leukemia. Proc. Natl. Acad. Sci. U. S. A. 118, (2021). [DOI] [PMC free article] [PubMed] [Google Scholar]
- 12.Crossley MP et al. Catalytically-inactive, purified RNaseH1: a specific and sensitive probe for RNA-DNA hybrid imaging. J. Cell Biol. (2021) doi: 10.1083/jcb.202101092. [DOI] [PMC free article] [PubMed] [Google Scholar]
- 13.Nguyen HD et al. Functions of Replication Protein A as a Sensor of R Loops and a Regulator of RNaseH1. Mol. Cell 65, 832–847.e4 (2017). [DOI] [PMC free article] [PubMed] [Google Scholar]
- 14.Bernardini JP et al. Parkin inhibits BAK and BAX apoptotic function by distinct mechanisms during mitophagy. EMBO J. 38, (2019). [DOI] [PMC free article] [PubMed] [Google Scholar]
- 15.Tigano M, Vargas DC, Tremblay-Belzile S, Fu Y & Sfeir A Nuclear sensing of breaks in mitochondrial DNA enhances immune surveillance. Nature 591, 477–481 (2021). [DOI] [PubMed] [Google Scholar]
- 16.Köhler A & Hurt E Exporting RNA from the nucleus to the cytoplasm. Nat. Rev. Mol. Cell Biol. 8, 761–773 (2007). [DOI] [PubMed] [Google Scholar]
- 17.Chatzidoukaki O et al. R-loops trigger the release of cytoplasmic ssDNAs leading to chronic inflammation upon DNA damage. Sci Adv 7, eabj5769 (2021). [DOI] [PMC free article] [PubMed] [Google Scholar]
- 18.Koo CX et al. RNA Polymerase III Regulates Cytosolic RNA:DNA Hybrids and Intracellular MicroRNA Expression. Journal of Biological Chemistry vol. 290 7463–7473 (2015). [DOI] [PMC free article] [PubMed] [Google Scholar]
- 19.Smolka JA, Sanz LA, Hartono SR & Chédin F Recognition of RNA by the S9.6 antibody creates pervasive artifacts when imaging RNA:DNA hybrids. J. Cell Biol. 220, (2021). [DOI] [PMC free article] [PubMed] [Google Scholar]
- 20.Petermann E, Lan L & Zou L Sources, resolution and physiological relevance of R-loops and RNA-DNA hybrids. Nat. Rev. Mol. Cell Biol. (2022) doi: 10.1038/s41580-022-00474-x. [DOI] [PubMed] [Google Scholar]
- 21.Crossley MP, Bocek MJ, Hamperl S, Swigut T & Cimprich KA qDRIP: a method to quantitatively assess RNA-DNA hybrid formation genome-wide. Nucleic Acids Res. 48, e84 (2020). [DOI] [PMC free article] [PubMed] [Google Scholar]
- 22.Sanz LA et al. Prevalent, Dynamic, and Conserved R-Loop Structures Associate with Specific Epigenomic Signatures in Mammals. Mol. Cell 63, 167–178 (2016). [DOI] [PMC free article] [PubMed] [Google Scholar]
- 23.Lim G & Hohng S Single-molecule fluorescence studies on cotranscriptional G-quadruplex formation coupled with R-loop formation. Nucleic Acids Res. 48, 9195–9203 (2020). [DOI] [PMC free article] [PubMed] [Google Scholar]
- 24.Ginno PA, Lott PL, Christensen HC, Korf I & Chédin F R-loop formation is a distinctive characteristic of unmethylated human CpG island promoters. Mol. Cell 45, 814–825 (2012). [DOI] [PMC free article] [PubMed] [Google Scholar]
- 25.Ginno PA, Lim YW, Lott PL, Korf I & Chédin F GC skew at the 5’ and 3’ ends of human genes links R-loop formation to epigenetic regulation and transcription termination. Genome Res. 23, 1590–1600 (2013). [DOI] [PMC free article] [PubMed] [Google Scholar]
- 26.Xu W et al. The R-loop is a common chromatin feature of the Arabidopsis genome. Nature Plants 3, 704–714 (2017). [DOI] [PubMed] [Google Scholar]
- 27.Shen YJ et al. Genome-derived cytosolic DNA mediates type I interferon-dependent rejection of B cell lymphoma cells. Cell Rep. 11, 460–473 (2015). [DOI] [PubMed] [Google Scholar]
- 28.Coquel F et al. SAMHD1 acts at stalled replication forks to prevent interferon induction. Nature 557, 57–61 (2018). [DOI] [PubMed] [Google Scholar]
- 29.Mackenzie KJ et al. cGAS surveillance of micronuclei links genome instability to innate immunity. Nature 548, 461–465 (2017). [DOI] [PMC free article] [PubMed] [Google Scholar]
- 30.Weinreb JT et al. Excessive R-loops trigger an inflammatory cascade leading to increased HSPC production. Dev. Cell 56, 627–640.e5 (2021). [DOI] [PMC free article] [PubMed] [Google Scholar]
- 31.Giordano AMS et al. DNA damage contributes to neurotoxic inflammation in Aicardi-Goutières syndrome astrocytes. J. Exp. Med. 219, (2022). [DOI] [PMC free article] [PubMed] [Google Scholar]
- 32.Suter MA et al. cGAS-STING cytosolic DNA sensing pathway is suppressed by JAK2-STAT3 in tumor cells. Sci. Rep. 11, 7243 (2021). [DOI] [PMC free article] [PubMed] [Google Scholar]
- 33.Cristini A et al. RNase H2, mutated in Aicardi-Goutières syndrome, resolves cotranscriptional R-loops to prevent DNA breaks and inflammation. Nat. Commun. 13, 2961 (2022). [DOI] [PMC free article] [PubMed] [Google Scholar]
- 34.Chawla-Sarkar M et al. Apoptosis and interferons: role of interferon-stimulated genes as mediators of apoptosis. Apoptosis 8, 237–249 (2003). [DOI] [PubMed] [Google Scholar]
- 35.Boulares AH et al. Role of poly(ADP-ribose) polymerase (PARP) cleavage in apoptosis. Caspase 3-resistant PARP mutant increases rates of apoptosis in transfected cells. J. Biol. Chem. 274, 22932–22940 (1999). [DOI] [PubMed] [Google Scholar]
- 36.Porter AG & Jänicke RU Emerging roles of caspase-3 in apoptosis. Cell Death Differ. 6, 99–104 (1999). [DOI] [PubMed] [Google Scholar]
- 37.Wajant H, Pfizenmaier K & Scheurich P Tumor necrosis factor signaling. Cell Death Differ. 10, 45–65 (2003). [DOI] [PubMed] [Google Scholar]
- 38.Zhou Y, He C, Wang L & Ge B Post-translational regulation of antiviral innate signaling. Eur. J. Immunol. 47, 1414–1426 (2017). [DOI] [PMC free article] [PubMed] [Google Scholar]
- 39.Mankan AK et al. Cytosolic RNA:DNA hybrids activate the cGAS-STING axis. EMBO J. 33, 2937–2946 (2014). [DOI] [PMC free article] [PubMed] [Google Scholar]
- 40.Blasius AL & Beutler B Intracellular toll-like receptors. Immunity 32, 305–315 (2010). [DOI] [PubMed] [Google Scholar]
- 41.Abu-Remaileh M et al. Lysosomal metabolomics reveals V-ATPase- and mTOR-dependent regulation of amino acid efflux from lysosomes. Science 358, 807–813 (2017). [DOI] [PMC free article] [PubMed] [Google Scholar]
- 42.Yeo AJ et al. R-loops in proliferating cells but not in the brain: implications for AOA2 and other autosomal recessive ataxias. PLoS One 9, e90219 (2014). [DOI] [PMC free article] [PubMed] [Google Scholar]
- 43.Kanagaraj R et al. Integrated genome and transcriptome analyses reveal the mechanism of genome instability in ataxia with oculomotor apraxia 2. Proc. Natl. Acad. Sci. U. S. A. 119, (2022). [DOI] [PMC free article] [PubMed] [Google Scholar]
- 44.Semmler L, Reiter-Brennan C & Klein A BRCA1 and Breast Cancer: a Review of the Underlying Mechanisms Resulting in the Tissue-Specific Tumorigenesis in Mutation Carriers. J. Breast Cancer 22, 1–14 (2019). [DOI] [PMC free article] [PubMed] [Google Scholar]
REFERENCES FOR METHODS
- 45.Bai G et al. HLTF Promotes Fork Reversal, Limiting Replication Stress Resistance and Preventing Multiple Mechanisms of Unrestrained DNA Synthesis. Mol. Cell 78, 1237–1251.e7 (2020). [DOI] [PMC free article] [PubMed] [Google Scholar]
- 46.Choi J-H, Kim S-Y, Kim S-K, Kemp MG & Sancar A An Integrated Approach for Analysis of the DNA Damage Response in Mammalian Cells: NUCLEOTIDE EXCISION REPAIR, DNA DAMAGE CHECKPOINT, AND APOPTOSIS. J. Biol. Chem. 290, 28812–28821 (2015). [DOI] [PMC free article] [PubMed] [Google Scholar]
- 47.Long HK et al. Loss of Extreme Long-Range Enhancers in Human Neural Crest Drives a Craniofacial Disorder. Cell Stem Cell 27, 765–783.e14 (2020). [DOI] [PMC free article] [PubMed] [Google Scholar]
- 48.Guerra J et al. Lysyl-tRNA synthetase produces diadenosine tetraphosphate to curb STING-dependent inflammation. Sci Adv 6, eaax3333 (2020). [DOI] [PMC free article] [PubMed] [Google Scholar]
- 49.Cristini A, Groh M, Kristiansen MS & Gromak N RNA/DNA Hybrid Interactome Identifies DXH9 as a Molecular Player in Transcriptional Termination and R-Loop-Associated DNA Damage. Cell Rep. 23, 1891–1905 (2018). [DOI] [PMC free article] [PubMed] [Google Scholar]
- 50.Hamperl S, Bocek MJ, Saldivar JC, Swigut T & Cimprich KA Transcription-Replication Conflict Orientation Modulates R-Loop Levels and Activates Distinct DNA Damage Responses. Cell 170, 774–786.e19 (2017). [DOI] [PMC free article] [PubMed] [Google Scholar]
- 51.Natsume T, Kiyomitsu T, Saga Y & Kanemaki MT Rapid Protein Depletion in Human Cells by Auxin-Inducible Degron Tagging with Short Homology Donors. Cell Rep. 15, 210–218 (2016). [DOI] [PubMed] [Google Scholar]
- 52.Sanjana NE, Shalem O & Zhang F Improved vectors and genome-wide libraries for CRISPR screening. Nat. Methods 11, 783–784 (2014). [DOI] [PMC free article] [PubMed] [Google Scholar]
Associated Data
This section collects any data citations, data availability statements, or supplementary materials included in this article.
Supplementary Materials
Data Availability Statement
All sequencing data generated in this work have been deposited in the Gene Expression Omnibus (GEO) under the accession number GSE178841. For nuclear DRIP-seq, datasets under accession number GSE134084 were used from https://doi.org/10.1093/nar/gkaa500.


