

Abstract
During pregnancy, the placental villous cytotrophoblasts differentiate via cell fusion and multinucleation to create syncytiotrophoblasts, a cell type at the maternal-fetal interface. Apoptosis of syncytiotrophoblasts is associated with adverse pregnancy outcomes. The human trophoblast BeWo cell line has been used as an in vitro model for this differentiation process, also known as syncytialization. In the current study, we exposed unsyncytialized BeWo cells, BeWo cells undergoing syncytialization, and syncytialized BeWo cells to S-(1,2-dichlorovinyl)-L-cysteine (DCVC), a metabolite of the industrial chemical trichloroethylene (TCE). DCVC exposure at 50 μM for 48 h decreased cell viability, increased cytotoxicity, increased caspase 3/7 activity, and increased nuclear condensation or fragmentation in BeWo cells regardless of their differentiation status. Investigating mechanisms of apoptosis, DCVC increased H2O2 abundance and decreased PRDX2 mRNA in all three BeWo cell models. DCVC decreased tumor necrosis factor-receptor 1 (TNF-R1) concentration in media and decreased NFKB1 and PRDX1 mRNA expression in syncytialized BeWo cells only. DCVC decreased BCL2 mRNA expression in syncytializing BeWo cells and in syncytialized BeWo cells only. Decreased LGALS3 mRNA was seen in unsyncytialized BeWo cells only. Together, these data suggest roles for oxidative stress and pro-inflammatory mechanisms underlying apoptosis in BeWo cells with differences depending on differentiation state.
Keywords: Trichloroethylene (TCE); S-(1,2-dichlorovinyl)-L-cysteine (DCVC); Apoptosis; Placenta; Villous trophoblasts; Syncytialization
1. Introduction
Many adverse pregnancy outcomes, including intrauterine growth retardation and decreased fetal weight, are attributable to abnormalities in placenta development (Ilekis et al., 2016). Important classes of placental cells that have been studied with regard to adverse pregnancy outcomes include villous cytotrophoblasts and syncytiotrophoblasts. Villous cytotrophoblasts are the placental cells that differentiate in vivo into syncytiotrophoblast in a process involving cell fusion and multinucleation, known as syncytialization (Wang et al., 2014). The syncytiotrophoblast serves as the maternal fetal interface that regulates gas, waste, and nutrient exchange between the mother and the fetus (Potgens et al., 2002; Wang et al., 2014).
Apoptosis of villous cytotrophoblasts, syncytiotrophoblasts, and other cytotrophoblasts is important as a mechanism for pregnancy disorders related to disruption of placental development and function. As specific examples, apoptosis of syncytiotrophoblasts is associated with intrauterine growth retardation and preeclampsia (Ishihara et al., 2002), and apoptosis of invasive cytotrophoblasts is associated with preeclampsia (DiFederico et al., 1999; Genbacev et al., 1999). Furthermore, loss of villous cytotrophoblasts and disrupted syncytia formation are proposed as stimuli for syncytiotrophoblast degeneration (Fox, 1970; Panigel and Myers, 1972; Castellucci et al., 1990). Additional examples on the deleterious role of apoptosis of placental cells for adverse pregnancy outcomes are provided in a review by Sharp et al. (Sharp et al., 2010).
Multiple biological processes regulate placental cell apoptosis. In BeWo and JEG-3 cells, placental cell lines representative of villous and extravillous cytotrophoblastic cells, respectively (Pattillo and Gey, 1968; Kohler and Bridson, 1971; Kohler et al., 1971), overexpression of antioxidant response with selenium decreases apoptosis (Khera et al., 2017). Additionally, a pro-inflammatory mechanism can contribute to apoptosis in placental cells. In WISH cells, IL-1β and NF-κB1 activation stimulate apoptosis (Saquib et al., 2013), and IFN-γ promotes apoptosis in cultured human cytotrophoblast cells and rat placenta and uterus (Sun et al., 2007). Finally, TNF-α increases apoptosis in both BeWo and JEG-3 cells (Al-Nasiry et al., 2006) as well as in syncytiotrophoblasts isolated from placentae of uncomplicated pregnancies (Garcia-Lloret et al., 2000).
Trichloroethylene (TCE) is an industrial solvent used as a metal degreaser and in the synthesis of various chemicals, including refrigerants (Agency for Toxic Substances and Disease Registry, 2007). Epidemiological studies associate TCE exposure to adverse pregnancy outcomes, including low birth weight and small for gestational age (Rodenbeck et al., 2000; Forand et al., 2012; Ruckart et al., 2014). S-(1,2-Dichlorovinyl)-L-cysteine (DCVC) is a TCE metabolite generated in the TCE glutathione (GSH) conjugation metabolic pathway (Lash et al., 2014a) that is important for TCE toxicity. DCVC is toxic because it is further metabolized into unstable and reactive compounds, including 1,2-dichlorovinylthiol (DCVT), chlorothioketene (CTK), and chlorothionoacetyl chloride (CTAC) (Lash et al., 2014a). Notably, DCVC stimulates apoptosis, necrosis, and mitochondrial dysfunction in kidney cells (Lash and Anders, 1986; Lash et al., 1986; Lash et al., 1994; Xu et al., 2008; Lash et al., 2014b). DCVC also stimulates reactive oxygen species (ROS) generation, pro-inflammatory response, and apoptosis in the HTR-8/SVneo extravillous cytotrophoblast cell line (Hassan et al., 2016; Elkin et al., 2018). The relevance of DCVC to toxicity is further supported by lack of toxicity of CYP-derived TCE metabolites, such as dichloroacetate (DCA) and trichloroacetate (TCA) (Fisher et al., 1989; Lash et al., 2014a), in HTR-8/SVneo cells (Elkin et al., 2022). However, despite knowledge supporting DCVC as a placental toxicant, mechanisms by which DCVC may act similarly or differently in BeWo cells in comparison to other placental cell lines are currently unknown.
As an in vitro model of first-trimester villous cytotrophoblasts (Pattillo and Gey, 1968; Wice et al., 1990), the BeWo cell line may provide insight into how DCVC may act on these placental cells. Cytotrophoblastic BeWo cells have been used to study the impact of toxicant exposure on placental cells to identify numerous affected proliferation and differentiation pathways (Zhang et al., 1995; Zhang and Shiverick, 1997; Le Vee et al., 2014; Wang et al., 2015). Additionally, the cytotrophoblastic BeWo cells can be induced to fuse and multinucleate, adopting important characteristics consistent with syncytialization in vivo (Wice et al., 1990), such as upregulating expression of molecules including syncytin-1, syncytin-2 (Vargas et al., 2009), and human chorionic gonadotropin (Wice et al., 1990). Forskolin, an adenylate cyclase activator (Daly, 1984), is commonly used to stimulate BeWo cell syncytialization (Wice et al., 1990; Al-Nasiry et al., 2006; Inadera et al., 2010). Importantly, regulation of redox-active and cell death molecules is critical in BeWo cell syncytialization. For example, when BeWo cell syncytialization is inhibited by hypoxia, levels of peroxiredoxin proteins are decreased relative to control (Hu et al., 2007), suggesting that increased peroxiredoxins are critical to sustain syncytialization. Similarly, upregulation of anti-apoptotic BCL2 mRNA expression in BeWo cells and human primary cytotrophoblasts during syncytialization has been observed (Zheng et al., 2016), and it was suggested that this prevents excessive cell death during syncytialization.
For the present study, we exposed unsyncytialized (cytotrophoblastic) BeWo cells, BeWo cells undergoing syncytialization, and syncytialized BeWo cells to various concentrations of DCVC to investigate how BeWo cells respond to DCVC in different states of differentiation. To optimize the interpretability of our results in the context of DCVC toxicity and syncytialization, we focused on endpoints well-studied in the context of syncytialization but not DCVC (e.g., peroxiredoxins) and included some endpoints well-studied in the context of DCVC but not syncytialization (e.g., caspase 3/7 activity). As such, the current study is well-positioned to discover new mechanisms of DCVC toxicity of relevance to syncytialization. Because DCVC is known to generate ROS and apoptosis in HTR-8/SVneo placental cells (Hassan et al., 2016; Elkin et al., 2018), we hypothesize that similar disruptions will happen in the case of BeWo cells. Importantly, because syncytializing BeWo cells and syncytialized BeWo cells are undergoing or have recently been through redox and apoptotic-related changes, respectively, we also hypothesize that these BeWo models will be most sensitive to DCVC insult.
2. Materials and methods
2.1. BeWo cell line
The BeWo human placental villous cytotrophoblast cell line (Pattillo and Gey, 1968) was obtained from American Type Culture Collection (ATCC CCL-98), and its identity from its short tandem repeat (STR) profile was verified with fragment analysis (ABI 3730XL DNA Analyzer, Applied Biosystems, Waltham, MA) at the University of Michigan DNA Sequencing Core. The cells were grown in F12—K Nutrient Mixture Kaighn’s Modification with (+) L Glutamine medium (Gibco, Grand Island, NY). DMEM/F12 Nutrient Mixture medium (Gibco, Grand Island, NY) without phenol red was used whenever BeWo cells were treated with an exposure. Treatments for the cells were diluted in DMEM/F12 Nutrient Mixture. All media were supplemented with 10% (v/v) heat-inactivated fetal bovine serum (HI-FBS) and 1% (v/v) penicillin/streptomycin (P/S) (Gibco, Grand Island, NY). Cell cultures were washed three times with phosphate buffered saline (PBS) (Invitrogen Life Technologies, Carlsbad, CA) prior to detaching the cells with 0.25% trypsin-EDTA (Invitrogen Life Technologies, Carlsbad, CA) for subculture. For regular subculture, BeWo cells were plated at a 100,000 cells/mL in 25 mL in 175 cm2 flasks (Corning Inc., Corning, NY) and sub-cultured at 70–80% confluence. Cell cultures were maintained in a 5% CO2, 37 °C controlled and humidified incubator. This work with human cell cultures was approved by the University of Michigan Institutional Biosafety Committee (IBCA00000100).
2.2. Exposures
DCVC was synthesized by the University of Michigan Medicinal Chemistry Core via a previously published method (McKinney et al., 1959), and chemical identity of DCVC was verified periodically through proton nuclear magnetic resonance (NMR) spectroscopy and determined to be 98.7% pure by high-performance liquid chromatography (HPLC). DCVC was dissolved in PBS as a 1 mM stock solution and stored in 1 mL aliquots at −20 °C.
The BeWo cells were plated at 100,000 cells/mL density in either 6-well or 96-well plates depending on the experiment and allowed 24 h to adhere and acclimate prior to initiating treatment. The unsyncytialized BeWo cells were exposed to DCVC concentrations spanning from 1 μM to 100 μM. The effect of DCVC on forskolin-induced syncytialization of BeWo cells was evaluated using co-exposure to DCVC and forskolin. The cytotrophoblastic BeWo cells were syncytialized by culturing the cells with 100 μM forskolin for 48 h (Wice et al., 1990; Al-Nasiry et al., 2006; Inadera et al., 2010). Forskolin was dissolved in dimethyl sulfoxide (DMSO) (Tocris Bioscience, Bristol, UK) and then diluted 1:1000 in medium to create the 100 μM forskolin treatment. Hence, the vehicle control used in these experiments was 0.1% (v/v) DMSO. We also tested the effects of DCVC exposure on BeWo cells after the 48-h forskolin-stimulated syncytialization, hereafter referred to as syncytialized BeWo cells receiving DCVC exposure.
The DCVC concentrations in these experiments ranged from 1 to 100 μM. DCVC concentrations were chosen based on past reports of effects of DCVC at similar concentrations (Xu et al., 2008; Lash et al., 2014b; Hassan et al., 2016; Elkin et al., 2018). In addition, the DCVC concentration range includes the average concentration of the DCVC precursor DCVG (13.4 μM) found in the blood of women exposed by inhalation to the US Occupational Safety and Health Administration permissible exposure level (Lash et al., 1999; Agency for Toxic Substances and Disease Registry, 2007). Camptothecin (CPT; Cayman Chemical, Ann Arbor, MI) and was used as a positive control in several experiments. CPT was dissolved in DMSO at 5.74 mM prior to administration to cell media.
2.3. Phalloidin-FITC and 4′,6-diamidino-2-phenylindole, dihydrochloride (DAPI) staining
Cells were plated at a density of 200,000 cells/well in 2 mL/well in Corning Costar tissue culture-treated 6-well plates (Corning, NY; product number 3516) and allowed to adhere for 24 h before treatment. After the 48-h treatment, the medium was removed, and the cells were washed three times with PBS. Then, 1:10 dilution buffered-formalin (Fisherbrand, Waltham, MA; product number 245–684) was added to the wells for 5 min to fix the cells, and the cells were washed three times with PBS again. Next, phalloidin-fluorescein isothiocyanate (phalloidin-FITC) (Sigma-Aldrich, St. Louis, MO) was applied at a concentration of 3.99 μM (from a stock solution of 0.399 mM in DMSO diluted 1:100 in PBS) for 40 min at room temperature. Cells were washed three times with PBS, and then incubated for 5 min at room temperature in 300 nM 4′,6-diamidino-2-phenylindole, dihydrochloride (DAPI) (Thermo Fisher Scientific, Waltham, MA) (prepared from a 2.86 mM DAPI stock solution in dH2O diluted in PBS). Cells were washed three times in PBS again prior to imaging using an EVOS microscope with fluorescence capabilities (Thermo Fisher Scientific, Waltham, MA). To obtain an accurate representation of the well, three images at 200× magnification were captured and analyzed per well: one near the top, one near the middle, and one near the bottom from a top-down direction.
Manual scoring of the images was performed to quantify cell multinucleation and fusion. The fusion index was calculated as follows: fusion index = [(N-S)/T]*100%, as previously described (Matsuura et al., 2011; Li et al., 2015; Zheng et al., 2016). In the fusion index, N is the number of nuclei in syncytia, S is the total number of syncytia, and T is the total number of nuclei. As such, this index is interpreted as the number of fusion events per total nuclei. The range of this index is 0 to nearly 100 but not exactly 100. In the case of a fusion index of 0, no fusion has occurred, and in the case of nearly 100, all nuclei are within one syncytium (i.e., [(99−1)/99]*100% = 99%). Complementing the fusion index, the percentage of nuclei in syncytia, or (N/T)*100%, was calculated. Unlike the fusion index, the percentage of nuclei in syncytia is independent of the number of syncytia (S) present. Therefore, the percentage of nuclei in syncytia increases relative to fusion index as the number of syncytia (S) increases or nuclei per syncytia (N) decreases. The numerical quantities used in the current study were manually assessed by two researchers, with the second researcher “blind” to knowledge of treatment group and providing matching values on a subset of images to the first researcher. Averaged quantities from the three images per well were used for statistical analysis purposes.
2.4. Measurement of cell viability and cytotoxicity
BeWo cells were plated at a density of 10,000 cells/well in 100 μL/well in Corning Costar tissue cultured-treated 96-well plates (Corning, NY) and allowed to adhere for 24 h before treatment. Cell viability and cytotoxicity were detected sequentially using the Multitox-Glo Multiplex Cytotoxicity Assay assessed on the Glomax Multi Plus Detection System (Promega, Madison, WI), as instructed by the manufacturers. For cell viability assessment, 50 μL of cell viability assay reagent was added to each well, and then plates were wrapped in aluminum foil and incubated at 37 °C for 45 min prior to reading. The viability assay works by the principle of cell uptake of a fluorogenic peptide substrate (GF-AFC) that is cleaved by live cell protease activity to produce a fluorescence signal proportional to number of live cells (Niles et al., 2007). After the viability reading, 50 μL of cell cytotoxicity assay reagent was added to each well, and then plates were wrapped in aluminum foil and incubated at room temperature for 15 min prior to reading. This cytotoxicity assay works by the principle of using a luminogenic peptide substrate (AAF-aminoluciferin) that is cleaved by dead cell (i.e., cells with compromised membranes) protease activity to release the aminoluciferin product that produces a luminescent signal proportional to the number of dead cells (Niles et al., 2007). Cytotoxicity data were normalized to protein mass, which was determined from a separate set of cells in 96-well plates. Protein was collected in Pierce RIPA Lysis and Extraction Buffer (Thermo Fischer Scientific, Waltham, MA) and quantified using the bicinchoninic acid assay (Thermo Fisher Scientific, Waltham, MA). The average of nine different protein readings from three independent experiments for each experimental group was used for normalization.
2.5. Measurement of caspase 3/7 activity
Cells were plated in Corning Costar tissue culture-treated 96-well white, clear-bottom plates (Corning, NY) at a density of 10,000 cells/well in 100 μL/well and allowed to adhere for 24 h before treatment. After treatment, caspase 3/7 activity was measured using a luminescence-based Caspase-Glo 3/7 Assay detected with the Glomax Multi Plus Detection System (Promega, Madison, WI) according to the manufacturer’s instructions. The assay consisted of adding 100 μL of Caspase-Glo substrate in Caspase-Glo buffer followed by incubation at 37 °C for one hour wrapped in aluminum foil to protect from light. The substrate is engineered to be specific in amino acid sequence to caspase 3/7: DEVD (Asp-Glu-Val-Asp). Activity was luminogenically detected because the cleavage of the substrate, indicative of caspase activity, generates aminoluciferin, which reacts with luciferase to produce light (Niles et al., 2008). Caspase 3/7 activity was normalized to protein mass, which was determined from a separate set of cells in 96-well plates in Pierce RIPA Lysis and Extraction Buffer (Thermo Fischer Scientific, Waltham, MA). Protein was quantified using the bicinchoninic acid assay (Thermo Fisher Scientific, Waltham, MA). The average of nine different mass readings from three independent experiments for each experimental group was used for normalization.
2.6. Hoechst staining to detect nuclear condensation or fragmentation
Cells were plated in Corning Costar tissue culture-treated 6-well plates at a density of 200,000 cells/well in 2 mL/well and allowed to adhere for 24 h before treatment. After the treatment, the medium was removed, and the cells were washed three times with PBS. The cells were fixed with 3.7% formaldehyde for 5 min, and then washed three times with PBS again. Next, Hoechst 33342 trihydrochloride, trihydrate (Invitrogen Life Technologies, Carlsbad, CA) at 0.5 μg/mL (from a 10 mg/mL stock solution diluted 1:20,000 in PBS) was added to each well to cover the cells. Cells were incubated in the Hoechst solution for 15 min, then washed three times with PBS before imaging using an EVOS microscope with fluorescence capabilities (Thermo Fisher Scientific, Waltham, MA). Three images were taken per well at 400× magnification. To provide an accurate representation of the well, images were captured near the top, middle, and bottom of each well, going in a top-down direction.
Quantification consisted of using ImageJ (NIH, Bethesda, MD) set to a brightness threshold that highlighted nuclei sufficiently to visualize nuclear condensation. The settings were as follows: hue (0, 255), saturation (0, 255), brightness (165, 255). Under these settings, at least 10% of the nucleus had to be highlighted in order for the nucleus to be considered condensed. Criteria used to assess nuclear fragmentation include consideration of fragmentation into multiple pieces, jaggedness of the nuclei, and unequal size of nuclei subsequent to fragmentation. A second researcher without knowledge of treatment groups verified the quantification of a subset of the Hoechst staining images with matching values to the first researcher. Averaged quantities from the three images per well were used for statistical analysis purposes.
2.7. Detection of hydrogen peroxide (H2O2) abundance
Cells were plated at a density of 10,000 cells/well in 100 μL/well in Corning Costar tissue culture-treated 96-well white, clear-bottom plates (Corning, NY) and allowed to adhere for 24 h before treatment. Hydrogen peroxide (H2O2) was detected using the ROS-Glo™ H2O2 assay (Promega, Madison, WI), performed according to the manufacturer’s instructions. Six hours before the end of treatment, 20 μL of the H2O2 substrate solution containing a derivatized luciferin substrate was added to each well to bring the volume to 100 μL (specific to this protocol, treatments had been added at 80 μL volumes each). After 6 h, 100 μL of the detection solution was added to each well. The assay works by the principle of addition of a derivatized luciferin substrate, which produces a luciferin precursor when reacting with H2O2. After 6 h, addition of the detection solution generates a luciferin product that gives off a light signal proportional to the amount of H2O2 present extracellularly and intracellularly. The H2O2 abundance was normalized to protein mass, which was determined from a separate set of cells in 96-well plates in Pierce RIPA Lysis and Extraction Buffer (Thermo Fischer Scientific, Waltham, MA). Protein was quantified using bicinchoninic acid assay (Thermo Fisher Scientific, Waltham, MA). The average of nine different protein readings from three independent experiments for each experimental group was used for normalization. Menadione (MD) was purchased from Sigma-Aldrich (St. Louis, MO) and used as a positive control. MD was directly dissolved in a stock solution of cell medium at a 1 mM concentration.
2.8. Detection of pro-inflammatory factors (TNF-R1, IL-6, IFN-γ, and CRP) in media
Cells were plated at 200,000 cells/well in 2 mL/well in Corning Costar tissue culture-treated 6-well plates (Corning, NY) and allowed to adhere for 24 h before treatment. After treatment, the medium was collected and stored at −80 °C until further processing. Cells were scraped and collected in a lysis buffer containing 0.5% (v/v) IGEPAL CA-630 (Sigma-Aldrich, St. Louis, MO), 250 mM NaCl (Sigma-Aldrich, St. Louis, MO), and 5% (v/v) of 1 mM Tris-HCl (pH 7.4) (Sigma-Aldrich, St. Louis, MO). Protein concentration from the cell lysate was measured using the bicinchoninic acid (BCA) assay (Thermo Fischer Scientific, Waltham, MA) according to the manufacturer’s protocol. Cytokine concentrations in the medium were normalized to the mass of protein present. Media samples were thawed and pipetted into round-bottom 96-well plates to immediately prior to delivering the samples to the University of Michigan Immunologic Monitoring Core. The core performed ELISA assays using Duosets (R&D Systems, Minneapolis, MN) according to the manufacturer’s recommended protocol.
2.9. RNA extraction
Cells were plated in Corning Costar tissue culture-treated 6-well plates at a density of 200,000 cells/well in 2 mL/well and allowed to adhere for 24 h before treatment. After treatment, the medium was removed and RNA was extracted from the cells using a RNeasy PLUS Mini Kit (Qiagen, Hilden, Germany) according to the manufacturer’s instructions. Briefly, 1 mL of the RLT Buffer Plus reagent (Qiagen, Hilden, Germany) containing 1% (v/v) 2-mercaptoethanol (Sigma-Aldrich, St. Louis, MO) was placed in each well to generate cell lysate. Cell lysates were homogenized using QIA Shredders (Qiagen, Hilden, Germany) prior to continuation of the manufacturer protocol with gDNA elimination as the next step. Concentration and purity of RNA were determined using a Nanodrop 2000 UV–Vis Spectrophotometer (Thermo Fisher Scientific, Waltham, MA), and RNA was stored at −80 °C until analyzed.
2.10. Quantitative real-time polymerase chain reaction (qRT-PCR)
To synthesize cDNA from the RNA samples, an iScript™ cDNA synthesis kit (Bio-Rad Laboratories, Hercules, CA) was used according to the manufacturer’s protocol. A Bio-Rad CFX Connect™ Real-Time System was used to carry out the cDNA synthesis reaction. We used the following protocol on the Bio-Rad CFX Connect™ Real-Time System for the cDNA synthesis reaction: (1) 5 min at 25 °C, (2) 30 min at 42 °C, (3) 5 min at 85 °C, and then (4) a cool down to 4 °C. The cDNA was stored at −20 °C until further use.
The qRT-PCR was performed using 25-μL reaction mixtures consisting of the following: 52.5% (v/v) SsoAdvanced™ Universal SYBR® Green Supermix (Bio-Rad Laboratories, Hercules, CA), 0.28 μM of each (forward and reverse) primer, and 32 ng of cDNA template. Primer sequences are described in Supplemental Table 1 and were custom-made by Integrated DNA Technologies (Coralville, IA). A Bio-Rad CFX Connect™ Real-Time System was used to perform qRT-PCR using to the following protocol: (1) 10 min at 95 °C, (2) 15 s at 95 °C, (3) 1 min at 60 °C, (4) repeat 39 times steps 2 and 3, (5) 1 min at 95 °C, (6) 2 min at 65 °C, (7) 65 °C to gradual increase to 95 °C, stopping at every 0.5 °C interval for 5 s each. Analysis was performed using the ΔΔCt method (Yuan et al., 2006), and all samples were analyzed in duplicate. B2M served as the reference gene. This gene encodes for beta-2-microglobulin, a ubiquitously-expressed protein that stabilizes major histocompatibility class I and similar structures (Li et al., 2016), and is among the most stable reference genes in healthy human placenta (Imperio et al., 2019).
2.11. CyQUANT™ NF cell proliferation assay to measure DNA quantity
To assess cellular DNA content (included in supplemental data), the CyQUANT NF Cell Proliferation Assay kit (Thermo Fisher Scientific, Waltham, MA) was utilized. Cells were plated in Corning Costar tissue culture-treated 96-well white, clear-bottom plates (Corning, NY) at a density of 10,000 cells/well in 100 μL/well and allowed to adhere for 24 h before treatment. After treatment, the medium was removed from the cells, and 100 μL of dye-binding solution (ratio of 1 μL of CyQUANT® NF dye reagent to 0.5 mL of 1× HBSS Buffer, as directed by the manufacturer) was added per well. Next, cells were incubated in the dark at 37 °C for 45 min prior to obtaining a fluorescence reading (excitation = 485 nm, emission = 530 nm) using the SpectraMax M2e Multi-Mode Microplate Reader (Molecular Devices, San Jose, CA). The fluorescence signal was proportional to DNA content.
2.12. Statistical analysis
Statistical analyses included unpaired two-tailed t-test, one-way ANOVA (GraphPad Prism 7, GraphPad Software, San Diego, CA) and mixed model ANOVA (SPSS, IBM Corporation, Chicago, IL) with treatment as fixed variable and experiment day as random variable. Percentage data were transformed to fractions and arcsine transformed prior to statistical analysis. To compare BeWo models, ratio data of DCVC versus control response were log10-transformed to minimize non-Gaussian distribution prior to statistical analysis. Then, data were analyzed by unpaired two-tailed t-test for comparison of two BeWo models or ANOVA (one-way or mixed model) if three BeWo models were compared. Mixed model ANOVA in this scenario had model as the fixed variable and experiment day as the random variable. All ANOVAs were followed with Tukey’s post-hoc comparison of means. Graphs were generated using GraphPad Prism 7 (GraphPad Software, San Diego, CA). A p < 0.05 was considered statistically significant.
3. Results
3.1. Effects of forskolin and DCVC on syncytialization
To verify the model of forskolin-stimulated syncytialization of BeWo cells, we exposed cytotrophoblastic BeWo cells to 0, 10, 20 50 or 100 μM forskolin for 48 h. These cells were co-stained with phalloidin-FITC and DAPI to identify the nuclei and plasma membranes, respectively, and thereby visualize cellular fusion and multinucleation (Fig. 1A). As seen in Figs. 1 B1 and 1B2, forskolin increased the fusion index and percentage of nuclei in syncytia in a concentration-dependent manner, respectively. Treatment with 100 μM forskolin increased the fusion index and percentage of nuclei in syncytia by 7.72 and 6.32 fold, respectively, relative to control (0 μM forskolin) (p < 0.0001). Because the indices of syncytialization were substantially increased by 100 μM forskolin compared with lower forskolin concentrations, and because forskolin treatment for 48 h is established as effective by others (Wice et al., 1990; Al-Nasiry et al., 2006; Inadera et al., 2010), we used 100 μM forskolin exposures for 48 h to stimulate syncytialization in BeWo cells in the remainder of our experiments.
Fig. 1.
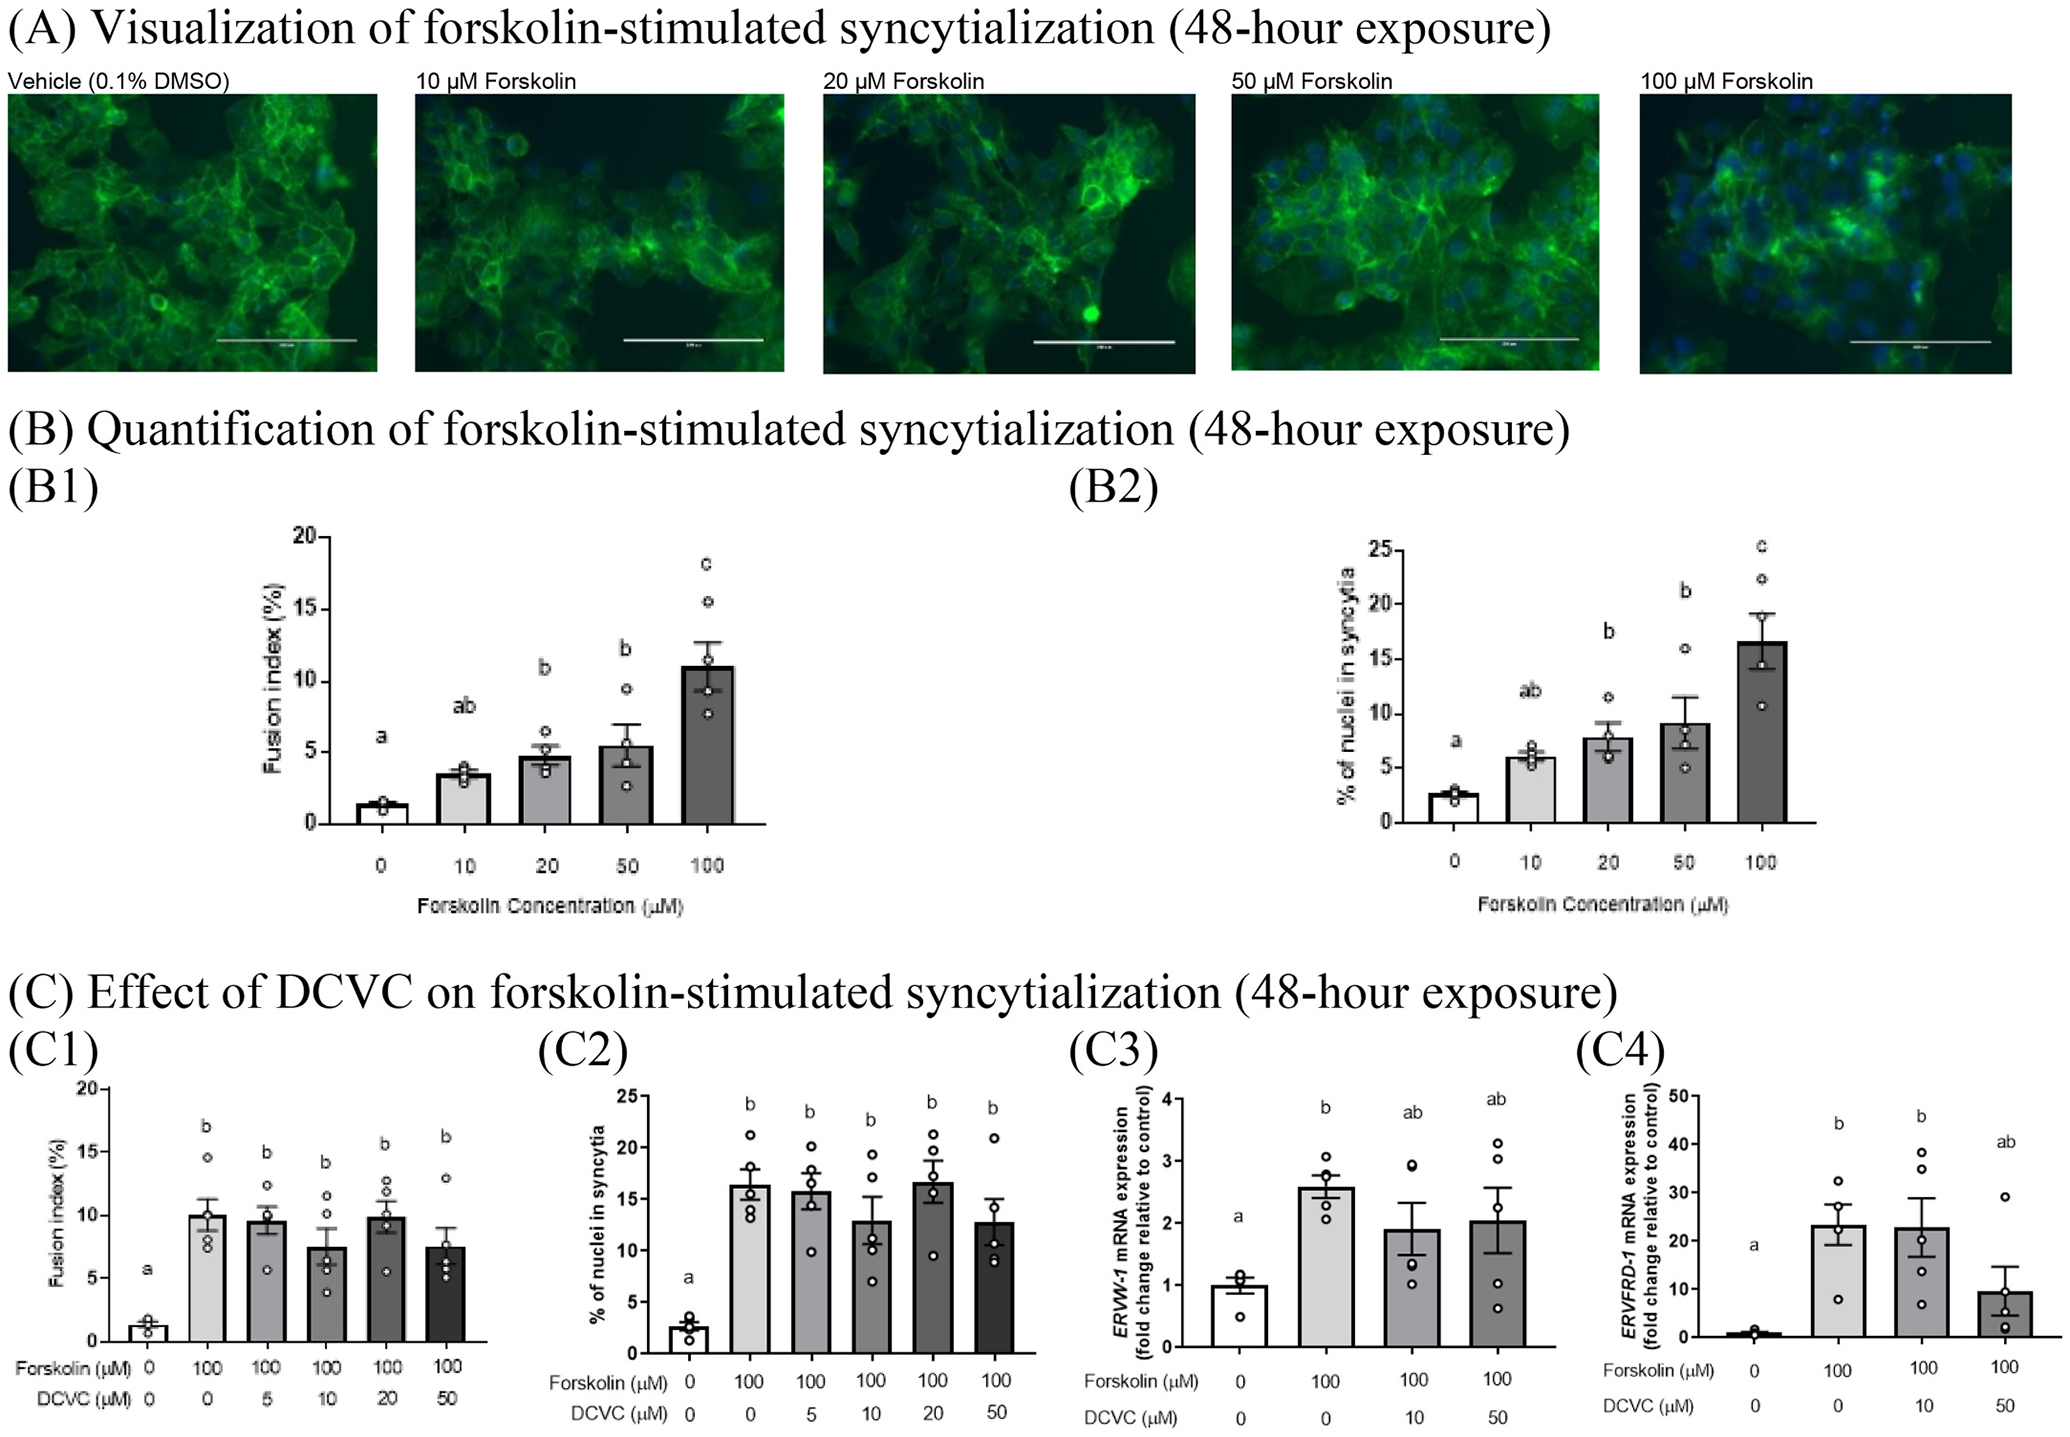
Concentration-dependent effects of forskolin on syncytialization with and without DCVC co-exposure. (A) Visualization of BeWo cell syncytialization. The green stain is a phalloidin-FITC membrane stain, and the blue stain corresponds to a 4′,6-diamidino-2-phenylindole, dihydrochloride (DAPI) nuclear stain. White scale bar represents 200 μm. (B) Quantification of staining assessment of syncytialization using the fusion index and percentage of nuclei in syncytia. N = 4 independent experiments. (C) DCVC effects on forskolin-stimulated syncytialization. N = 5 independent experiments. Controls were treated with 0.1% DMSO (vehicle control for forskolin) and are indicated as Vehicle (Fig. A), treatment with 0 μM forskolin alone (Figs. B1 and B2), or 0 μM DCVC +0 μM forskolin (Figs. C1-C4). Statistical analysis was performed using one-way ANOVA followed by Tukey’s post-hoc multiple comparisons of means. Statistical significance is indicated by non-overlapping letters. Error bars represent mean ± SEM.
To investigate DCVC effects on BeWo syncytialization, 5 μM to 50 μM DCVC was added as a co-exposure with 100 μM forskolin. As expected, forskolin treatment alone increased indices of syncytialization relative to vehicle control (0 μM of forskolin +0 μM DCVC with 0.1% DMSO, the vehicle control of forskolin), including: (1) increased fusion index by 7.26 fold (p < 0.0001), (2) increased percentage of nuclei in syncytia by 6.11 fold (p < 0.0001), (3) increased ERVW-1 (syncytin-1) mRNA expression by 2.60 fold (p = 0.0276), and (4) increased ERVFRD-1 (syncytin-2) mRNA expression by 23.4 fold (p = 0.0130) (Figs. 1 C1, 1C2, 1C3, and 1C4, respectively). However, treatment with DCVC did not significantly alter responses compared with forskolin-only treatment (Figs. 1 C1–1C4). The reduced mean expression of forskolin-stimulated ERVFRD-1 mRNA expression by co-treatment with 50 μM DCVC was not statistically significant (p = 0.1714) (Fig. 1 C4). In the absence of forskolin, treatment of unsyncytialized BeWo cells with 5, 10, 20, or 50 μM DCVC for 48 h failed to significantly affect syncytialization as measured by fusion index, percentage of nuclei in syncytia, ERVW-1 mRNA expression, or ERVFRD-1 mRNA expression (Supplemental Fig. 1), supporting the absence of a confounding effect by DCVC on syncytialization.
3.2. Effects of DCVC on cell viability and cytotoxicity
Treatment for 48 h with 50 μM but not lower concentrations of DCVC decreased cell viability regardless of whether the cells were unsyncytialized, undergoing syncytialization, or were syncytialized at the time of exposure. Specifically, cell viability decreased by 28.4% in unsyncytialized cells relative to control (0 μM DCVC exposure) (p < 0.0001) (Fig. 2 A1), by 42.6% in cells undergoing forskolin-stimulated syncytialization relative to forskolin-only treatment control (p < 0.0001) (Fig. 2 C1), and by 45.2% in syncytialized cells relative to control (0 μM DCVC) (p < 0.0001) (Fig. 2 D1).
Fig. 2.

Concentration-dependent effects of DCVC on cell viability and cytotoxicity. (A) Unsyncytialized BeWo cells exposed to DCVC for 48 h. (B) Unsyncytialized BeWo cells exposed to DCVC for 72 h. (C) BeWo cells co-exposed to DCVC while undergoing forskolin-stimulated syncytialization for 48 h. (D) Syncytialized BeWo cells exposed to DCVC for 48 h. For all graphs, the control group is indicated as treatment with 0 μM DCVC alone or 0 μM DCVC +0 μM forskolin. In experiments that included forskolin co-treatment, cells in the 0 μM DCVC +0 μM forskolin control group were treated with 0.1% DMSO (vehicle control for forskolin). Statistical analysis was performed using mixed models ANOVA followed by Tukey’s post-hoc comparison of means. Statistical significance is denoted by non-overlapping letters. N = 3 independent experiments with triplicate wells for each experiment. Error bars represent mean ± SEM. Cell viability was measured as relative fluorescence units (RFU) and cytotoxicity was measured as relative luminescence units (RLU)/mg protein using the Multitox-Glo Multiplex Cytotoxicity Assay as described in Materials and Methods. Camptothecin (CPT) was included as a positive control.
Differences were observed for cytotoxicity, which was used as a proxy for dead cells, depending on the differentiation state of BeWo cells during a 48-h exposure to DCVC. Consistent with cell viability responses, 48-h treatment with 50 μM DCVC, but not lower concentrations, increased cytotoxicity in unsyncytialized cells by 1.85 fold relative to control (0 μM DCVC) (p < 0.0001) (Fig. 2 A2). However, in cells undergoing syncytialization at the time of DCVC exposure, treatment with 20 μM and 50 μM DCVC increased cytotoxicity by 1.36 and 2.53 fold, respectively, relative to forskolin-only treatment control (p = 0.001 and < 0.0001, respectively) (Fig. 2 C2). DCVC concentrations lower than 20 μM had no significant effects on cytotoxicity in cells exposed during syncytialization (Fig. 2 C2). Moreover, cytotoxicity increased in syncytialized cells treated with 10 μM, 20 μM, and 50 μM DCVC by 1.34 fold, 1.81 fold, and 2.52 fold relative to control (0 μM DCVC) (p = 0.0003, <0.0001, and < 0.0001, respectively) (Fig. 2 D2). Concentrations lower than 10 μM DCVC had no significant effects on cytotoxicity in cells exposed after syncytialization (Fig. 2 D2). Although forskolin-only treatment in cells undergoing syncytialization increased cytotoxicity 1.76 fold relative to vehicle control (0.1% DMSO) (p < 0.0001) (Fig. 2 C2), no change in cell viability was observed (Fig. 2 C1).
To determine if a longer exposure duration would alter responses, unsyncytialized BeWo cells were exposed to DCVC for 72 h. Treatment with 10, 20 and 50 μM DCVC significantly reduced cell viability relative to control (0 μM DCVC) by 12.2% (p = 0.023), 27.8% (p < 0.0001) and 57.4% (p < 0.0001), respectively (Fig. 2 B1). In contrast, the cytotoxicity response with 72-h DCVC exposure significantly increased only at 50 μM DCVC relative to control (0 μM DCVC) by 2.92 fold (p < 0.0001), similar to that observed with 48-h exposure (Fig. 2 B2).
3.3. Effects of DCVC on caspase 3/7 activity
Caspase 3/7 activity was assayed to investigate apoptosis involvement in DCVC-stimulated cell death. Treatment of unsyncytialized BeWo cells with 50 μM DCVC for 48 h increased caspase 3/7 activity by 1.58 fold relative to control (0 μM DCVC) (p < 0.0001) (Fig. 3A). When DCVC exposure was concurrent with forskolin-stimulated cell syncytialization, 50 μM DCVC increased caspase 3/7 activity relative to forskolin-only treatment (1.85-fold increase; p < 0.0001) (Fig. 3C). In syncytialized cells, 48-h exposure to 50 μM DCVC also increased caspase 3/7 activity relative to control (0 μM DCVC) (2.02-fold increase, p < 0.0001) (Fig. 3D). Small but statistically significant decreases of caspase 3/7 activity were observed with 48-h treatment with lower DCVC concentrations under all experimental conditions relative to controls, but the magnitudes of these differences were slight, especially in comparison with the increases observed at 50 μM DCVC (Fig. 3C). Forskolin treatment by itself had no significant effect on caspase 3/7 activity relative to vehicle control (0.1% DMSO) in cells undergoing syncytialization (Fig. 3C).
Fig. 3.
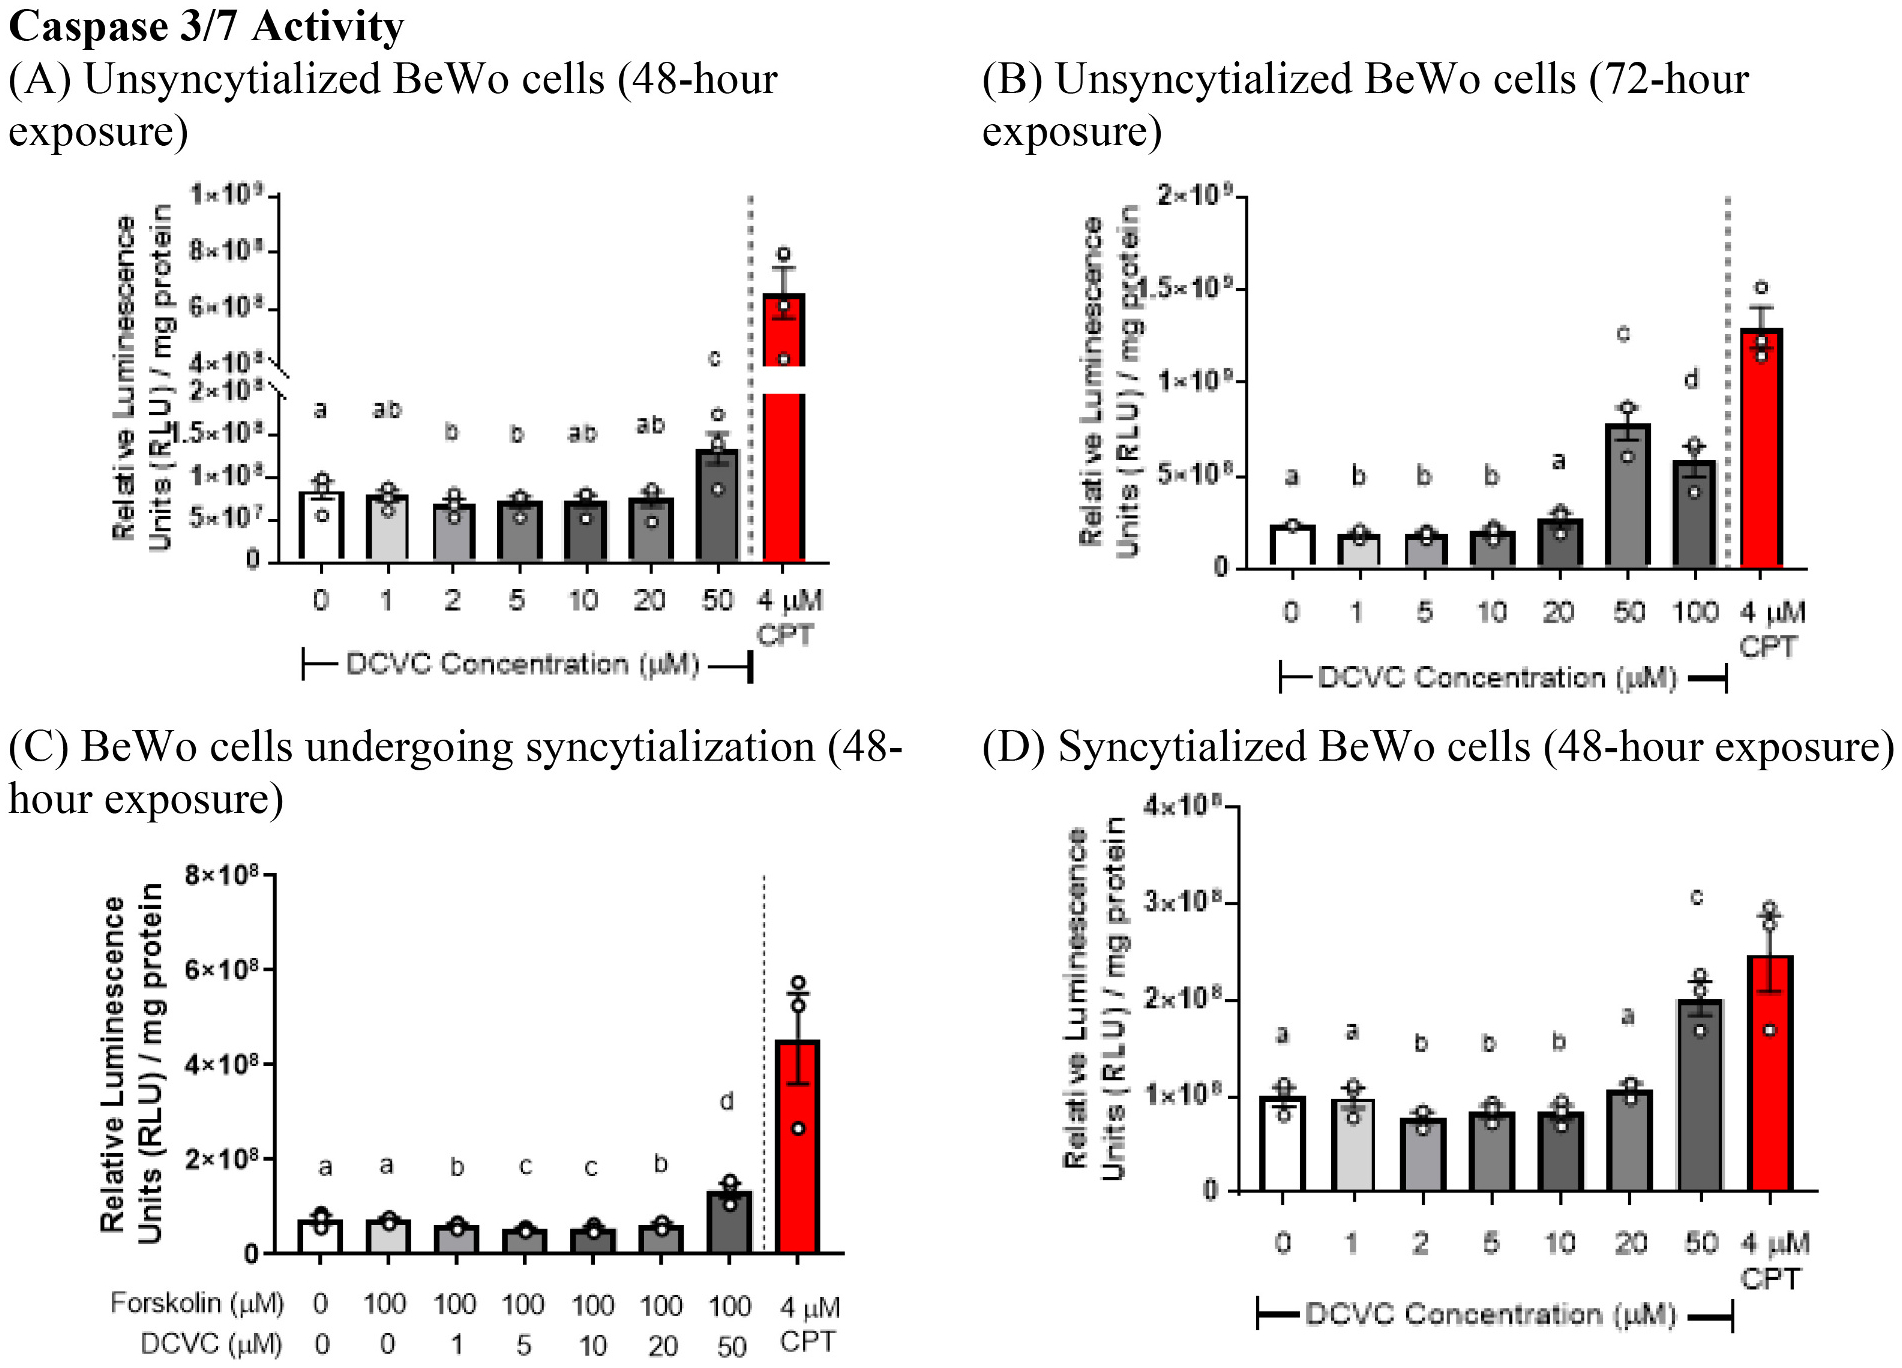
Effects of DCVC on caspase 3/7 activity. (A) Unsyncytialized BeWo cells exposed to DCVC for 48 h. (B) Unsyncytialized BeWo cells exposed to DCVC for 72 h. (C) BeWo cells co-exposed to DCVC while undergoing forskolin-stimulated syncytialization for 48 h. (D) Syncytialized BeWo cells exposed to DCVC for 48 h. For all graphs, the control group is indicated as treatment with 0 μM DCVC alone or 0 μM DCVC +0 μM forskolin. In experiments that included forskolin co-treatment, cells in the 0 μM DCVC +0 μM forskolin control group were treated with 0.1% DMSO (vehicle control for forskolin). Statistical analysis was performed using mixed models ANOVA followed by Tukey’s post-hoc comparison of means. Statistical significance is denoted by non-overlapping letters. N = 4 independent experiments for (A) and N = 3 independent experiments for (B—D), performed in triplicate for each experiment. Error bars represent mean ± SEM. Camptothecin (CPT) was included as a positive control.
Increasing the DCVC exposure duration to 72 h did not change the concentration response to DCVC of unsyncytialized cells: 50 μM DCVC, but not lower DCVC concentrations, increased caspase 3/7 activity by 3.31 fold relative to control (0 μM DCVC) (p < 0.0001) (Fig. 3B). Furthermore, increasing the DCVC concentration to 100 μM for 72 h stimulated an increase of caspase 3/7 activity by 2.45 fold relative to control (0 μM DCVC) (p < 0.0001) that was less than the peak activation observed with 50 μM DCVC (Fig. 3B).
3.4. Effects of DCVC on nuclear condensation or fragmentation
To further explore apoptosis, BeWo cells were stained with Hoechst 33342 trihydrochloride, trihydrate to visualize DCVC-stimulated nuclear condensation or fragmentation (Fig. 4A). Unsyncytialized cells exposed for 24 h to 20 μM DCVC exhibited significantly increased percent of nuclei that were condensed or fragmented compared to control (0 μM DCVC) (2.40-fold increase, p = 0.0491), although the effect of 50 μM DCVC was not statistically significant relative to the control (p = 0.0536) (Fig. 4 B1). For all other experimental conditions, 50 μM DCVC was the lowest effective concentration that significantly increased nuclear condensation or fragmentation. Unsyncytialized cells exposed for 48 h to 50 μM DCVC exhibited significantly increased percent of nuclei that were condensed or fragmented compared to control (0 μM DCVC) (3.92-fold increase, p = 0.0475) (Fig. 4 B2). Similarly, in BeWo cells undergoing forskolin-stimulated syncytialization, 50 μM DCVC significantly increased the percent of condensed or fragmented nuclei compared with forskolin alone control (3.08-fold increase, p = 0.0065) (Fig. 4 B3). Forskolin by itself did not increase nuclear condensation or fragmentation relative to the unexposed control group. Furthermore, 24- and 48-h DCVC exposures of syncytialized BeWo cells significantly increased nuclear condensation or fragmentation at 50 μM DCVC (2.01- and 3.74-fold increase, respectively; p = 0.0214 and 0.0256, respectively) (Figs. 4 B4 and 4B5 , respectively).
Fig. 4.

Effects of DCVC on nuclear condensation or fragmentation in BeWo cells. (A) Representative images of Hoechst 33342 staining to visualize nuclear condensation or fragmentation in unsyncytialized BeWo cells following 48-h exposure to DCVC. White scale bar represents 100 μm. (B) Quantification of DCVC effects on nuclear condensation or fragmentation in (B1) unsyncytialized BeWo cells exposed to DCVC for 24 h, (B2) unsyncytialized BeWo cells exposed to DCVC for 48 h, (B3) BeWo cells undergoing syncytialization for 48 h, (B4) syncytialized BeWo cells exposed to DCVC for 24 h, and (B5) syncytialized BeWo cells exposed to DCVC for 48 h. For all graphs, the control group is indicated as treatment with 0 μM DCVC alone or 0 μM DCVC +0 μM forskolin. In experiments that included forskolin co-treatment, cells in the 0 μM DCVC +0 μM forskolin control group were treated with 0.1% DMSO (vehicle control for forskolin). The percentage data were converted to fractions and arcsine transformed prior to statistical analysis. Statistical analysis was performed using one-way ANOVA. Statistically significant differences are indicated by non-overlapping letters. N = 4–5 independent experiments. Error bars represent mean ± SEM.
We performed the CyQuant assay for DNA quantity to evaluate the contribution of cell division to nuclear condensation. We observed no change in CyQuant detection of DNA quantity after 48-h DCVC exposure of unsyncytialized BeWo cells, BeWo cells undergoing syncytialization, and syncytialized BeWo cells (Supplemental Figs. 2A, 2C, and 2D, respectively). At the 72-h time point of exposure to unsyncytialized BeWo cells, however, 50 and 100 μM DCVC exposure decreased DNA quantity relative to control (0 μM DCVC) by 49.8% and 66.1%, respectively (p < 0.0001) (Supplemental Fig. 2B).
3.5. Effects of DCVC on biomarkers of oxidative stress
In unsyncytialized BeWo cells, DCVC exposure increased generation of hydrogen peroxide (H2O2) after 48 h of exposure to 20 and 50 μM DCVC by 1.47 and 3.59 fold, respectively, relative to control (0 μM DCVC) (p = 0.046 and < 0.0001, respectively) (Fig. 5 A3). The hydrogen peroxide stimulation in unsyncytialized cells was accompanied by decreased PRDX2 mRNA expression at 10, 20 and 50 μM DCVC relative to control (0 μM DCVC) by 20.5%, 23.9%, and 44.6%, respectively (p = 0.0202, 0.0057, and < 0.0001, respectively) (Fig. 5 A2). However, PRDX1 mRNA expression was unchanged by DCVC in unsyncytialized cells (Fig. 5 A1).
Fig. 5.

DCVC effects on H2O2 abundance, PRDX1 mRNA expression, and PRDX2 mRNA expression as biomarkers of oxidative stress. (A) Unsyncytialized BeWo cells exposed to DCVC for 48 h. (B) BeWo cells co-treated with DCVC while undergoing forskolin-stimulated syncytialization. (C) Syncytialized BeWo cells exposed to DCVC for 24 h. (D) Syncytialized BeWo cells exposed to DCVC for 48 h. For all graphs, the control group is indicated as treatment with 0 μM DCVC alone or 0 μM DCVC +0 μM forskolin. In experiments that included forskolin co-treatment, cells in the 0 μM DCVC +0 μM forskolin control group were treated with 0.1% DMSO (vehicle control for forskolin). For the mRNA expression data, statistical analysis was performed using one-way ANOVA followed by Tukey’s post-hoc comparison of means, with N = 4–5 independent experiments. For the H2O2 abundance data, statistical analysis was performed using mixed models ANOVA followed by Tukey’s post-hoc comparison of means, with N = 3 independent experiments performed in triplicate. Statistically significant differences are indicated by non-overlapping letters. Error bars for all graphs represent mean ± SEM. Menadione (MD) was included as a positive control for the experiments involving measurement of H2O2.
In BeWo cells undergoing syncytialization, 50 μM DCVC increased generation of H2O2 by 2.48 fold relative to forskolin-only treatment control (p < 0.0001) (Fig. 5 B3). Interestingly, syncytialization by forskolin treatment alone decreased H2O2 generation by 51.5% relative to untreated vehicle control (p < 0.0001) (Fig. 5 B3). Similar to unsyncytialized cells, 50 μM DCVC decreased PRDX2 mRNA expression in cells undergoing syncytialization (62.9% decrease relative to forskolin-only treatment, p = 0.0091) (Fig. 5 B2). No differences in PRDX1 mRNA expression were found for DCVC effects on cells undergoing syncytialization (Fig. 5 B1).
In syncytialized cells, 24 h of DCVC exposure decreased mRNA expression of PRDX1 and PRDX2 relative to control (0 μM DCVC). Treatment with 10, 20, and 50 μM DCVC significantly decreased PRDX1 mRNA expression 50.6%, 39.6%, and 44.1%, respectively (p = 0.0067, 0.0427, and 0.0202, respectively), and treatment with 20 and 50 μM DCVC decreased PRDX2 mRNA expression 33.0% and 38.6%, respectively (p = 0.0223 and 0.0064, respectively) (Figs. 5 C1 and 5C2, respectively). In syncytialized cells exposed to DCVC for 48 h, 50 μM DCVC increased H2O2 by 2.74 fold relative to control (0 μM DCVC) (p < 0.0001) (Fig. 5 D3), with no significant changes observed at lower DCVC concentrations. In contrast to 24-h exposure, syncytialized cells showed no significant changes in PRDX1 and PRDX2 mRNA abundance after 48 h of DCVC exposure (Figs. 5 D1 and 5D2, respectively).
3.6. Effects of DCVC on pro-inflammatory responses
To assess pro-inflammatory responses, tumor necrosis factor-receptor 1 (TNF-R1), interleukin-6 (IL-6), interferon-γ (IFN-γ), and C-reactive protein (CRP) were measured in cell culture media, and changes in NFKB1 mRNA expression were assessed, also. Pro-inflammatory marker responses to DCVC were observed in syncytialized BeWo cells but not in unsyncytialized cells or in cells undergoing syncytialization. Specifically, syncytialized cells exhibited decreased NFKB1 mRNA expression after 24 h of exposure to 5, 20, and 50 μM DCVC relative to unexposed control (44.8%, 45.1%, and 49.5% decrease, respectively; p = 0.0367, 0.0351, and 0.0181, respectively) (Fig. 6 C1). After 48 h of exposure, NFKB1 mRNA expression was significantly decreased in syncytialized cells only with 10 μM DCVC exposure relative to unexposed control (47.8% decrease, p = 0.0247) (Fig. 6 C2). In addition, 48-h treatment of syncytialized cells with 50 μM DCVC, but not lower DCVC concentrations, decreased TNF-R1 in cell media by 48.4%, compared with unexposed control (p = 0.0140) (Fig. 6 C3). Cell media concentrations of TNF-R1, IL-6, CRP, and IFN-γ were not measured for syncytialized BeWo cells at the 24-h time point of DCVC exposure. DCVC exposure for 48 h at concentrations up to 50 μM had no significant effects on IFN-γ, IL-6, and CRP in BeWo cells irrespective of syncytialization status (Supplemental Fig. 3). An interesting observation unrelated to DCVC but relevant to syncytialization is that forskolin-induced syncytialization stimulated IL-6 release into media 1.91 fold (comparing forskolin-only treatment to vehicle control; p = 0.0028) (Supplemental Figure 3B1).
Fig. 6.

DCVC effects on NFKB1 mRNA expression and cell media concentrations of TNF-R1 as biomarkers of pro-inflammatory response. (A) Unsyncytialized BeWo cells exposed to DCVC for 48 h. (B) BeWo cells co-treated with DCVC while undergoing forskolin-stimulated syncytialization for 48 h. (C1) Syncytialized BeWo cells exposed to DCVC for 24 h. (C2-C3) Syncytialized BeWo cells exposed to DCVC for 48 h. For all graphs, the control group is indicated as treatment with 0 μM DCVC alone or 0 μM DCVC +0 μM forskolin. In experiments that included forskolin co-treatment, cells in the 0 μM DCVC +0 μM forskolin control group were treated with 0.1% DMSO (vehicle control for forskolin). Data were analyzed using one-way ANOVA followed by Tukey’s post-hoc comparison of means. Statistically significant differences are indicated by non-overlapping letters. For the TNF-R1 data, N = 5, 5, and 3 independent experiments for unsyncytialized BeWo cells, BeWo cells undergoing syncytialization, and syncytialized BeWo cells, respectively. For the NFKB1 mRNA expression data, N = 5 independent experiments for all except N = 3 for exposures on syncytialized cells for 48-h duration. Error bars represent mean ± SEM.
3.7. Effects of DCVC on expression of apoptotic pathway genes
We evaluated changes in mRNA expression of the apoptotic pathway genes BCL2 (codes for B-cell lymphoma 2, apoptosis regulator), BAK1 (codes for BCL2 antagonist/killer 1), and LGALS3 (codes for Galectin-3). In unsyncytialized cells, DCVC decreased LGALS3 mRNA expression 38.3% relative to control at 20 μM DCVC (p = 0.0066) (Fig. 7 A2), but had no statistically significant effects on BCL2 and BAK1 mRNA expression compared with controls (Figure 7 A1 and Supplemental Fig. 4A, respectively). In cells undergoing syncytialization, forskolin treatment alone increased BCL2 mRNA expression relative to untreated control (0.1% DMSO) (5.41-fold increase, p = 0.0030) (Fig. 7 B1). Exposure to 20 μM and 50 μM DCVC depressed forskolin-stimulated BCL2 mRNA abundance increase by 60.0% and 74.1%, respectively (p = 0.0364 and 0.0073, respectively) (Fig. 7 B1). LGALS3 and BAK1 mRNA expression were unchanged by forskolin treatment alone or by DCVC co-treatment during forskolin-stimulated syncytialization (Figs. 7 B2 and Supplemental Fig. 4B, respectively).
Fig. 7.

Effects of DCVC on apoptotic pathway genes BCL2 and LGALS3. (A) Unsyncytialized BeWo cells exposed to DCVC for 48 h. (B) BeWo cells co-treated with DCVC while undergoing forskolin-stimulated syncytialization for 48 h. (C) Syncytialized BeWo cells exposed to DCVC for 24 h. (D) Syncytialized BeWo cells exposed to DCVC for 48 h. For all graphs, the control group is indicated as treatment with 0 μM DCVC alone or 0 μM DCVC +0 μM forskolin. In experiments that included forskolin co-treatment, cells in the 0 μM DCVC +0 μM forskolin control group were treated with 0.1% DMSO (vehicle control for forskolin). Data were analyzed using one-way ANOVA followed by Tukey’s post-hoc comparison of means. Statistical significance is indicated by non-overlapping letters. Error bars represent mean ± SEM. N = 5 independent experiments for the experiments in (A) and (B). N = 4 independent experiments for the experiments in (C). N = 3 and N = 4 independent experiments for the BCL2 and LGALS3 outcomes, respectively, in Panel (D).
Similarly, syncytialized BeWo cells exhibited decreased BCL2 mRNA expression following exposure to 20 and 50 μM DCVC for 24 h relative to control (0 μM DCVC) (50.7% and 60.8% decrease, respectively; p = 0.0156 and 0.0037, respectively) (Fig. 7 C1). BCL2 mRNA expression also decreased with 5, 10, and 20 μM DCVC treatments for 48 h relative to control (0 μM DCVC) (65.5%, 74.7%, and 66.7% decrease, respectively; p = 0.0004, 0.0002, and 0.0004, respectively) (Fig. 7 D1). LGALS3 mRNA expression was unchanged by DCVC treatment in syncytialized BeWo cells after 24 and 48 h of exposure (Figs. 7 C2 and 7D2, respectively). In experiments involving 48-h DCVC exposure of syncytialized BeWo cells, the RNA yield for the 50 μM DCVC concentration was insufficient (Figs. 7 D1 and 7D2); therefore, no mRNA expression data could be obtained with the 50 μM DCVC concentration group.
3.8. Comparison of DCVC effects across the three BeWo models
To evaluate DCVC-stimulated effects across BeWo models, we compared ratios of DCVC response relative to control response for the 48-h time point (Supplemental Table 2). DCVC stimulated greater cytotoxicity and caspase 3/7 activity in syncytializing BeWo cells and syncytialized BeWo cells when each were compared to unsyncytialized BeWo cells (cytotoxicity, p < 0.001 and p < 0.001, respectively; caspase 3/7, p = 0.004 and p < 0.001, respectively). DCVC-induced suppression of BCL2 mRNA expression was greater in syncytializing BeWo cells compared to unsyncytialized BeWo cells (p = 0.0426). The response to DCVC for unsyncytialized BeWo cells compared to syncytializing and syncytialized BeWo cells for LGALS3 mRNA expression was statistically significant (p = 0.0016 and 0.0007, respectively); however, we cannot state which model was more susceptible to DCVC because the response within unsyncytialized BeWo cells was opposite in direction to that in syncytializing and syncytialized BeWo cells. Also, the response to DCVC for unsyncytialized BeWo cells compared to syncytializing BeWo cells for ERVFRD-1 mRNA expression was statistically significant (p = 0.0158); however, we cannot state which model was more susceptible to DCVC because the response was opposite in directions. DCVC-induced suppression of TNF-R1 in cell media was greater in syncytialized BeWo cells compared to unsyncytialized BeWo cells or syncytializing BeWo cells (p = 0.0116 and 0.0012, respectively). No other comparisons performed were statistically significant among the BeWo models (Supplemental Table 2).
4. Discussion
This study used BeWo cells as an in vitro model of first-trimester placental villous cytotrophoblasts (Pattillo and Gey, 1968; Wice et al., 1990) to study toxicity of the trichloroethylene metabolite DCVC. The study took advantage of the ability to stimulate single cell BeWo cultures to fuse and form syncytia, similar to fusion of cytotrophoblasts that forms the syncytiotrophoblasts of the maternal-fetal interface. We observed that DCVC stimulated cell death and cell death-related responses in a manner dependent on whether the BeWo cells were unsyncytialized, were undergoing syncytialization, or were syncytialized at the time of DCVC exposure.
Syncytializing BeWo cells and syncytialized BeWo cells exhibited greater DCVC-stimulated cell death compared to unsyncytialized BeWo cells, as measured by a cytotoxicity assay of disrupted cell membrane integrity. The same pattern was observed for activation of apoptotic cell death caspases 3/7, with syncytializing cells and syncytialized cells exhibiting a greater response than unsyncytialized cells. Furthermore, similar concentration-responses were observed for increased cytotoxicity and increased nuclear condensation or fragmentation in all three different BeWo models.
Because caspase 3/7 is an executioner caspase downstream at the point of convergence of the intrinsic and extrinsic apoptotic pathways (Parrish et al., 2013), it is plausible that DCVC stimulated apoptosis. The increased percentage of nuclear condensation or fragmentation further supports the conclusion that DCVC stimulated apoptosis. Because neither condensation nor fragmentation alone is sufficient as an index of apoptosis (Matassov et al., 2004; Errami et al., 2013; Crowley et al., 2016) and apoptosis can occur in the presence of only one but not the other (Zhang et al., 2001), we assessed the percentage of condensed or fragmented nuclei as an index that would capture most apoptotic nucleic while minimizing the chance of omission. Moreover, we suggest that changes in percentage of condensed or fragmented nuclei most likely reflect apoptosis as opposed to cell division because DCVC-stimulated changes to DNA quantity were not observed at 48 h regardless of BeWo cell differentiation state.
Responses upstream in the apoptotic pathway were stimulated at lower concentrations and earlier time points of DCVC exposure compared with downstream responses in the apoptotic signaling pathway. As an example, in the unsyncytialized cells, 10 μM DCVC decreased PRDX2 mRNA expression after 48 h of exposure but did not decrease viability until the 72-h time point. Similarly, in syncytialized cells, 20 and 50 μM DCVC decreased PRDX2 mRNA expression at 24 h of exposure whereas decreased viability, increased cytotoxicity, and increased caspase 3/7 activity from 50 μM DCVC exposure were observed at the 48-h time point. These findings suggest that transcriptional changes led to the downstream changes of viability, cytotoxicity, and caspase 3/7 activity.
Both PRDX1 and PRDX2 are highly expressed in the placenta (Fagerberg et al., 2014), although PRDX1 is expressed at roughly twice the level of PRDX2 (Fagerberg et al., 2014). Prior studies showed that these peroxiredoxins play critical roles in syncytialization. Specifically, both peroxiredoxin proteins decrease in BeWo cells when syncytialization is inhibited by hypoxia (Hu et al., 2007), and BeWo cells with PRDX2 knocked down are unable to syncytialize (Wu et al., 2017). Our finding that DCVC decreased PRDX2 in all three BeWo models but decreased PRDX1 only in syncytialized BeWo cells may suggest that PRDX1 may be more essential to villous cytotrophoblasts than PRDX2. Further understanding of mechanisms and consequences of DCVC inhibition of PRDX1 and PRDX2 expression requires additional research.
Our finding that the direction of change stimulated by DCVC for PRDX1 and PRDX2 expression was opposite that for H2O2 abundance and apoptosis is consistent with prior reports, independent of DCVC. Both peroxiredoxin 1 and 2 scavenge H2O2, reduce other enzymes such as thioredoxins, and are anti-apoptotic through similar mechanisms (Ishii et al., 2012). Whereas the anti-apoptotic mechanism for peroxiredoxin 1 involves ASK1 and JNK suppression, the anti-apoptotic mechanism for peroxiredoxin 2 involves ASK1 suppression (Ishii et al., 2012). Both peroxiredoxins also prevent apoptosis in a Bcl-2-dependent manner (Jin et al., 2017; Lu et al., 2019; Lu et al., 2020; Yang et al., 2020). Because we found that DCVC induced PRDX1, PRDX2, H2O2, and BCL2 responses, the impact of DCVC on ASK1 and JNK could be worthy considerations for future investigations of DCVC-stimulated cell death.
BCL2 and LGALS3 are critical in apoptosis and were modified by DCVC dependent on BeWo cell differentiation state. BCL2 and LGALS3 code for Bcl-2 and Galectin-3, respectively, proteins important with anti-apoptotic functions and capable of heterodimerization to inhibit apoptosis (Yang et al., 1996; Yang et al., 2008; Newlaczyl and Yu, 2011). Because the BCL2 and LGALS3 protein products are structurally and functionally similar (Yang et al., 1996; Akahani et al., 1997; Colnot et al., 1998; Yang et al., 2008; Newlaczyl and Yu, 2011), our observation that DCVC decreased either BCL2 or LGALS3 mRNA expression in BeWo cells in each syncytialization state suggests a possible mechanism for apoptosis if sufficient inhibition of expression of either gene occurred.
Decreased TNF-R1 media concentration and NFKB1 mRNA expression were observed in the syncytialized BeWo cells but not in BeWo cells undergoing syncytialization or in unsyncytialized BeWo cells. In the case of DCVC exposure of syncytialized BeWo cells, the mechanism of NF-κB seems to favor a mechanism in which NF-κB reduces ROS (Papa et al., 2005; Bubici et al., 2006) with DCVC-stimulated suppression of NFKB1. Indeed, DCVC decreased NFKB1 mRNA expression, increased H2O2 generation, and increased apoptosis, suggesting that NFKB1 may have a role in ROS reduction (Papa et al., 2005; Bubici et al., 2006) in the syncytialized BeWo cells as part of an anti-apoptotic response. Although not directly shown in the current study, a more detailed mechanism may involve NF-κB reduction of ROS by NF-κB interaction with ferritin heavy chain or manganese superoxide dismutase (Papa et al., 2005; Bubici et al., 2006). Alternatively, in response to ROS, TNF-R1 becomes activated (Papa et al., 2005), which would increase NF-κB and its transcription (Bubici et al., 2006; Wajant and Scheurich, 2011; Annibaldi and Meier, 2018). Because TNF-R1 is a positive regulator of NFKB transcription (Bubici et al., 2006; Wajant and Scheurich, 2011; Annibaldi and Meier, 2018), our findings of decreased TNF-R1 and decreased NFKB1 mRNA expression suggest that NFKB1 may be regulated by TNF-R1 in syncytialized BeWo cells. However, the extent to which TNF-R1 may respond to ROS in the context of DCVC exposure is currently unknown.
The DCVC findings in the present study have relevance to prior reports of DCVC-elicited responses in other in vitro models. Higher concentrations and longer exposures of DCVC were required to increase caspase 3/7, an apoptotic biomarker, in BeWo cells in our study compared with the HTR-8/SVneo placental cell line (Elkin et al., 2018; Elkin et al., 2022), human placental villous explant cultures (Elkin et al., 2022), and human proximal tubular kidney cells (Xu et al., 2008), suggesting that BeWo cells may be less sensitive to DCVC than the cells and tissues in these other in vitro models. Furthermore, lower DCVC exposure concentrations and durations disrupt energy metabolism in HTR-8/SVneo cells (Elkin et al., 2020) and mitochondrial dysfunction in HTR-8/SVneo cells (Elkin et al., 2019) and human proximal tubular kidney cells (Xu et al., 2008): however, the present study did not assess mitochondrial function. Responses to sub-micromolar DCVC concentrations have been scarcely investigated, yet could be most environmentally-relevant and are worthy for future studies.
Evaluating differences in DCVC-stimulated responses across passage generation in human proximal tubular kidney cells, Lash et al. found that cells at passage 4 exhibit greater DCVC-stimulated apoptosis compared to earlier passage cells, especially at the 25 and 50 μM DCVC concentrations (Lash et al., 2014b). This finding highlights that DCVC toxicity changes with cell status at DCVC concentrations similar to effective concentrations in BeWo, whether it is differentiation state as seen in the present study or passage number as reported by Lash et al.. Differences in response to DCVC that are dependent on differentiation state may have relevance to TCE toxicity to various organs, including kidney (Green et al., 1997a; Xu et al., 2008; Lash et al., 2014b), liver (Bull, 2000), and lungs (Forkert et al., 1985; Green et al., 1997b), with respect to sensitive cell populations.
BeWo cell models have strengths as well as limitations. Forskolin stimulates unsyncytialized BeWo cells to adopt characteristics that are consistent with in vivo syncytialization and syncytiotrophoblasts, including increased cell fusion and multinucleation (Wice et al., 1990; Wang et al., 2014). Forskolin is more effective than other agents for stimulating cell fusion and other characteristics in BeWo cells that are consistent with normal syncytialization, including increased synthesis and secretion of human chorionic gonadotrophin (hCG) (Wice et al., 1990). However, syncytiotrophoblasts in primary cell culture exhibit some different characteristics from syncytialized BeWo b30 cells (a clone of BeWo cells), including altered expression of placental alkaline phosphatase, human placental lactogen, and Schwangerschafts protein 1 (Wice et al., 1990). It has been proposed that syncytiotrophoblasts obtained from differentiating BeWo cells are biochemically representative of an early placenta stage near 10 weeks gestation age (Wice et al., 1990).
Although this is primarily a toxicology study, we report here novel findings that contribute to our understanding of BeWo cell syncytialization. We found that forskolin-stimulated BeWo cell syncytialization decreased H2O2 abundance, which has not been previously reported. This finding is consistent with literature indicating the importance in syncytialization of peroxiredoxin 1 and peroxiredoxin 2, which scavenge H2O2 (Hu et al., 2007; Wu et al., 2017). We also found that syncytialization increased interleukin-6 (IL-6) release, which has not been previously reported. Our finding of increased BCL2 mRNA expression with syncytialization is not novel but is consistent with a prior report that syncytialization increases BCL2 mRNA expression in BeWo cells and human primary cytotrophoblasts (Zheng et al., 2016).
The DCVC concentrations used in the current study are relevant with respect to human occupational exposure to TCE. Women exposed by inhalation to 100 ppm TCE, which is the United States Occupational Safety and Health Administration (OSHA) permissible exposure level (PEL) (Agency for Toxic Substances and Disease Registry, 2007), had an average of 13.4 μM of DCVG in their blood serum (Lash et al., 1999). Because DCVG is the TCE metabolic precursor to DCVC in a 1:1 stoichiometric ratio (Lash et al., 2014a), the concentration range of 1–50 μM used in the present study encompasses blood concentrations relevant for occupational exposures to TCE. Although TCE is metabolized to other important metabolites in addition to DCVC, such as dichloroacetic acid (DCA) and trichloroacetic acid (TCA) (Fisher et al., 1989; Lash et al., 2014a), we have observed that DCA and TCA elicit nominal effects in unsyncytialized BeWo cells (Elkin et al., 2022).
5. Conclusions
The current study provides new information comparing DCVC-stimulated apoptotic responses in BeWo cells in three different states of differentiation: unsyncytialized cells, cells undergoing syncytialization, and syncytialized cells. Our results uncovered new targets of DCVC (e.g., peroxiredoxins) that are well-known in the syncytialization but not DCVC literature and are consistent with the biology of syncytialization as reliant on redox and apoptosis regulation. Our findings suggest that syncytiotrophoblasts may be more sensitive to DCVC than villous cytotrophoblasts, evidenced by differences in responses of syncytialized BeWo cells compared to unsyncytialized BeWo cells. The mechanisms proposed by which DCVC-stimulated apoptosis may occur differed by differentiation state of the BeWo cells (Figs. 8). Whereas the proposed mechanism involves PRDX2 and H2O2 alterations in unsyncytialized cells (Fig. 8) and cells undergoing syncytialization (Fig. 8), the mechanism proposed in syncytialized cells (Fig. 8) involves TNF-R1 and NFKB1, in addition to PRDX2 and H2O2. We chose our endpoints to encompass both syncytialization and DCVC literature, but it should be noted that apoptotic mechanisms in BeWo cells likely extend significantly beyond what was assessed in the current study. As a whole, this study suggests differing mechanisms of DCVC toxicity based on placental cell type. These findings can inform future studies of possible interventions for reducing TCE- and DCVC-stimulated toxicity, as well as expand upon the sequence of events leading to apoptosis in placental cells.
Fig. 8.

Summarized mechanism of apoptosis stimulated by DCVC in unsyncytialized BeWo cells, BeWo cells undergoing syncytialization, and syncytialized BeWo cells. Whereas hydrogen peroxide increase and PRDX2 mRNA decrease were observed in all BeWo models, a decrease of PRDX1 mRNA, TNF-R1, and NFKB1 mRNA were only observed in syncytialized BeWo cells. A decrease of BCL2 mRNA was observed for BeWo cells undergoing syncytialization and syncytialized BeWo cells. A decrease of LGALS3 mRNA was observed only for unsyncytialized BeWo cells. Together, this suggests that mechanisms towards apoptosis differ depending on the BeWo model.
Supplementary Material
Acknowledgements
The authors thank the University of Michigan Immunology Core for assistance with cytokine ELISA. We express gratitude to Drs. Sean M. Harris, Elana R. Elkin, Lawrence H. Lash, Justin A. Colacino, and Kelly A. Hogan for helpful discussions. We give special thanks to Catherine Robeson for technical assistance.
Funding information
This work was supported by the National Institute of Environmental Health Sciences (NIEHS), National Institutes of Health (NIH), with a research project to RL-C, (P42ES017198), training grant fellowship support to ALS (T32ES007062), and additional project support from the Michigan Center for Lifestage Environmental Exposure and Disease (P30ES017885). Additional training grant fellowship support for ALS was from the Eunice Kennedy Shriver National Institute of Child Health and Human Development (NICHD), NIH (T32HD079342). The authors gratefully acknowledge support from the University of Michigan Rackham Graduate Student Research Grants. The content is solely the responsibility of the authors and does not necessarily represent the official views of the NIEHS, NICHD, NIH, or the University of Michigan.
Grants and financial support
National Institute of Environmental Health Sciences (NIEHS) (P42ES017198).
National Institute of Environmental Health Sciences (NIEHS) (T32ES007062).
National Institute of Environmental Health Sciences (NIEHS) (P30ES017885).
Eunice Kennedy Shriver National Institute of Child Health and Human Development (NICHD) (T32HD079342).
University of Michigan Rackham Graduate Student Research Grants.
Abbreviations:
- ANOVA
analysis of variance
- B2M
Beta-2-microglobulin
- BAK1
BCL2 antagonist/killer 1
- BCA
bicinchoninic acid
- BCL2
B-cell lymphoma 2, apoptosis regulator
- CPT
camptothecin
- CRP
C-reactive protein
- DAPI
4′,6-diamidino-2-phenylindole, dihydrochloride
- DCVC
S-(1,2-dichlorovinyl)-L-cysteine
- DEVD
Asp-Glu-Val-Asp
- DMSO
dimethyl sulfoxide
- ERVFRD-1
Syncytin-2
- ERVW-1
Syncytin-1
- FBS
fetal bovine serum
- FITC
fluorescein isothiocyanate
- IFN-γ
interferon-gamma
- IL-6
interleukin-6
- LGALS3
Galectin-3
- MD
menadione
- NFKB1
Nuclear factor kappa B subunit 1
- P/S
penicillin/streptomycin
- PBS
phosphate buffered saline
- PRDX1
Peroxiredoxin 1
- PRDX2
Peroxiredoxin 2
- ROS
reactive oxygen species
- TNF-R1
tumor necrosis factor receptor 1
Footnotes
Declaration of Competing Interest
The authors declare that they have no known competing financial interests or personal relationships that could have appeared to influence the work reported in this paper.
Appendix A. Supplementary data
Supplementary data to this article can be found online at https://doi.org/10.1016/j.tiv.2022.105514.
Data availability
Data will be made available on request.
References
- Agency for Toxic Substances and Disease Registry, 2007. In: E.H.a.M.E. (Ed.), Trichloroethylene Toxicity: What are the U.S. Standards for Trichloroethylene Exposure?. Agency for Toxic Substances and Disease Registry (ATSDR), Atlanta, GA. [Google Scholar]
- Akahani S, Nangia-Makker P, Inohara H, Kim HR, Raz A, 1997. Galectin-3: a novel antiapoptotic molecule with a functional BH1 (NWGR) domain of Bcl-2 family. Cancer Res. 57, 5272–5276. [PubMed] [Google Scholar]
- Al-Nasiry S, Spitz B, Hanssens M, Luyten C, Pijnenborg R, 2006. Differential effects of inducers of syncytialization and apoptosis on BeWo and JEG-3 choriocarcinoma cells. Hum. Reprod 21, 193–201. [DOI] [PubMed] [Google Scholar]
- Annibaldi A, Meier P, 2018. Checkpoints in TNF-induced cell death: implications in inflammation and Cancer. Trends Mol. Med 24, 49–65. [DOI] [PubMed] [Google Scholar]
- Bubici C, Papa S, Pham CG, Zazzeroni F, Franzoso G, 2006. The NF-kappaB-mediated control of ROS and JNK signaling. Histol. Histopathol 21, 69–80. [DOI] [PubMed] [Google Scholar]
- Bull RJ, 2000. Mode of action of liver tumor induction by trichloroethylene and its metabolites, trichloroacetate and dichloroacetate. Environ. Health Perspect 108 (Suppl. 2), 241–259. [DOI] [PMC free article] [PubMed] [Google Scholar]
- Castellucci M, Kaufmann P, Bischof P, 1990. Extracellular matrix influences hormone and protein production by human chorionic villi. Cell Tissue Res. 262, 135–142. [DOI] [PubMed] [Google Scholar]
- Colnot C, Fowlis D, Ripoche MA, Bouchaert I, Poirier F, 1998. Embryonic implantation in galectin 1/galectin 3 double mutant mice. Dev. Dyn 211, 306–313. [DOI] [PubMed] [Google Scholar]
- Crowley LC, Marfell BJ, Waterhouse NJ, 2016. Analyzing cell death by nuclear staining with Hoechst 33342. Cold Spring Harb Protoc 2016. [DOI] [PubMed] [Google Scholar]
- Daly JW, 1984. Forskolin, adenylate cyclase, and cell physiology: an overview. Adv Cyclic Nucleotide Protein Phosphorylation Res 17, 81–89. [PubMed] [Google Scholar]
- DiFederico E, Genbacev O, Fisher SJ, 1999. Preeclampsia is associated with widespread apoptosis of placental cytotrophoblasts within the uterine wall. Am. J. Pathol 155, 293–301. [DOI] [PMC free article] [PubMed] [Google Scholar]
- Elkin ER, Harris SM, Loch-Caruso R, 2018. Trichloroethylene metabolite S-(1,2-dichlorovinyl)-l-cysteine induces lipid peroxidation-associated apoptosis via the intrinsic and extrinsic apoptosis pathways in a first-trimester placental cell line. Toxicol. Appl. Pharmacol 338, 30–42. [DOI] [PMC free article] [PubMed] [Google Scholar]
- Elkin ER, Bridges D, Loch-Caruso R, 2019. The trichloroethylene metabolite S-(1,2-dichlorovinyl)-L-cysteine induces progressive mitochondrial dysfunction in HTR-8/SVneo trophoblasts. Toxicology 427, 152283. [DOI] [PMC free article] [PubMed] [Google Scholar]
- Elkin ER, Bridges D, Harris SM, Loch-Caruso RK, 2020. Exposure to trichloroethylene metabolite S-(1,2-Dichlorovinyl)-L-cysteine causes compensatory changes to macronutrient utilization and energy metabolism in placental HTR-8/SVneo cells. Chem. Res. Toxicol 33, 1339–1355. [DOI] [PMC free article] [PubMed] [Google Scholar]
- Elkin ER, Su AL, Kilburn BA, Bakulski KM, Armant DR, Loch-Caruso R, 2022. Toxicity assessments of selected trichloroethylene and perchloroethylene metabolites in three in vitro human placental models. Reprod. Toxicol 109, 109–120. [DOI] [PMC free article] [PubMed] [Google Scholar]
- Errami Y, Naura AS, Kim H, Ju J, Suzuki Y, El-Bahrawy AH, Ghonim MA, Hemeida RA, Mansy MS, Zhang J, Xu M, Smulson ME, Brim H, Boulares AH, 2013. Apoptotic DNA fragmentation may be a cooperative activity between caspase-activated deoxyribonuclease and the poly(ADP-ribose) polymerase-regulated DNAS1L3, an endoplasmic reticulum-localized endonuclease that translocates to the nucleus during apoptosis. J. Biol. Chem 288, 3460–3468. [DOI] [PMC free article] [PubMed] [Google Scholar]
- Fagerberg L, Hallstrom BM, Oksvold P, Kampf C, Djureinovic D, Odeberg J, Habuka M, Tahmasebpoor S, Danielsson A, Edlund K, Asplund A, Sjostedt E, Lundberg E, Szigyarto CA, Skogs M, Takanen JO, Berling H, Tegel H, Mulder J, Nilsson P, Schwenk JM, Lindskog C, Danielsson F, Mardinoglu A, Sivertsson A, von Feilitzen K, Forsberg M, Zwahlen M, Olsson I, Navani S, Huss M, Nielsen J, Ponten F, Uhlen M, 2014. Analysis of the human tissue-specific expression by genome-wide integration of transcriptomics and antibody-based proteomics. Mol. Cell. Proteomics 13, 397–406. [DOI] [PMC free article] [PubMed] [Google Scholar]
- Fisher JW, Whittaker TA, Taylor DH, Clewell HJ 3rd, Andersen ME, 1989. Physiologically based pharmacokinetic modeling of the pregnant rat: a multiroute exposure model for trichloroethylene and its metabolite, trichloroacetic acid. Toxicol. Appl. Pharmacol 99, 395–414. [DOI] [PubMed] [Google Scholar]
- Forand SP, Lewis-Michl EL, Gomez MI, 2012. Adverse birth outcomes and maternal exposure to trichloroethylene and tetrachloroethylene through soil vapor intrusion in New York state. Environ. Health Perspect 120, 616–621. [DOI] [PMC free article] [PubMed] [Google Scholar]
- Forkert PG, Sylvestre PL, Poland JS, 1985. Lung injury induced by trichloroethylene. Toxicology 35, 143–160. [DOI] [PubMed] [Google Scholar]
- Fox H, 1970. Effect of hypoxia on trophoblast in organ culture. A morphologic and autoradiographic study. Am. J. Obstet. Gynecol 107, 1058–1064. [DOI] [PubMed] [Google Scholar]
- Garcia-Lloret MI, Winkler-Lowen B, Guilbert LJ, 2000. Monocytes adhering by LFA-1 to placental syncytiotrophoblasts induce local apoptosis via release of TNF-alpha. A model for hematogenous initiation of placental inflammations. J. Leukoc. Biol 68, 903–908. [PubMed] [Google Scholar]
- Genbacev O, DiFederico E, McMaster M, Fisher SJ, 1999. Invasive cytotrophoblast apoptosis in pre-eclampsia. Hum. Reprod 14 (Suppl. 2), 59–66. [DOI] [PubMed] [Google Scholar]
- Green T, Dow J, Ellis MK, Foster JR, Odum J, 1997a. The role of glutathione conjugation in the development of kidney tumours in rats exposed to trichloroethylene. Chem. Biol. Interact 105, 99–117. [DOI] [PubMed] [Google Scholar]
- Green T, Mainwaring GW, Foster JR, 1997b. Trichloroethylene-induced mouse lung tumors: studies of the mode of action and comparisons between species. Fundam. Appl. Toxicol 37, 125–130. [DOI] [PubMed] [Google Scholar]
- Hassan I, Kumar AM, Park HR, Lash LH, Loch-Caruso R, 2016. Reactive oxygen stimulation of Interleukin-6 release in the human trophoblast cell line HTR-8/SVneo by the Trichlorethylene metabolite S-(1,2-Dichloro)-l-cysteine. Biol. Reprod 95, 66. [DOI] [PMC free article] [PubMed] [Google Scholar]
- Hu R, Jin H, Zhou S, Yang P, Li X, 2007. Proteomic analysis of hypoxia-induced responses in the syncytialization of human placental cell line BeWo. Placenta 28, 399–407. [DOI] [PubMed] [Google Scholar]
- Ilekis JV, Tsilou E, Fisher S, Abrahams VM, Soares MJ, Cross JC, Zamudio S, Illsley NP, Myatt L, Colvis C, Costantine MM, Haas DM, Sadovsky Y, Weiner C, Rytting E, Bidwell G, 2016. Placental origins of adverse pregnancy outcomes: potential molecular targets: an executive workshop summary of the Eunice Kennedy Shriver National Institute of Child Health and Human Development. Am. J. Obstet. Gynecol 215, S1–S46. [DOI] [PMC free article] [PubMed] [Google Scholar]
- Imperio GE, Javam M, Lye P, Constantinof A, Dunk CE, Reis FM, Lye SJ, Gibb W, Matthews SG, Ortiga-Carvalho TM, Bloise E, 2019. Gestational age-dependent gene expression profiling of ATP-binding cassette transporters in the healthy human placenta. J. Cell. Mol. Med 23, 610–618. [DOI] [PMC free article] [PubMed] [Google Scholar]
- Inadera H, Tachibana S, Takasaki I, Tatematsu M, Shimomura A, 2010. Hyperglycemia perturbs biochemical networks in human trophoblast BeWo cells. Endocr. J 57, 567–577. [DOI] [PubMed] [Google Scholar]
- Ishihara N, Matsuo H, Murakoshi H, Laoag-Fernandez JB, Samoto T, Maruo T, 2002. Increased apoptosis in the syncytiotrophoblast in human term placentas complicated by either preeclampsia or intrauterine growth retardation. Am. J. Obstet. Gynecol 186, 158–166. [DOI] [PubMed] [Google Scholar]
- Ishii T, Warabi E, Yanagawa T, 2012. Novel roles of peroxiredoxins in inflammation, cancer and innate immunity. J. Clin. Biochem. Nutr 50, 91–105. [DOI] [PMC free article] [PubMed] [Google Scholar]
- Jin X, Chen C, Li D, Su Q, Hang Y, Zhang P, Hu W, 2017. PRDX2 in myocyte hypertrophy and survival is mediated by TLR4 in acute infarcted myocardium. Sci. Rep 7, 6970. [DOI] [PMC free article] [PubMed] [Google Scholar]
- Khera A, Vanderlelie JJ, Holland O, Perkins AV, 2017. Overexpression of endogenous anti-oxidants with selenium supplementation protects trophoblast cells from reactive oxygen species-induced apoptosis in a Bcl-2-dependent manner. Biol. Trace Elem. Res 177, 394–403. [DOI] [PubMed] [Google Scholar]
- Kohler PO, Bridson WE, 1971. Isolation of hormone-producing clonal lines of human choriocarcinoma. J. Clin. Endocrinol. Metab 32, 683–687. [DOI] [PubMed] [Google Scholar]
- Kohler PO, Bridson WE, Hammond JM, Weintraub B, Kirschner MA, Van Thiel DH, 1971. Clonal lines of human choriocarcinoma cells in culture. Acta Endocrinol. Suppl. (Copenh) 153, 137–153. [DOI] [PubMed] [Google Scholar]
- Lash LH, Anders MW, 1986. Cytotoxicity of S-(1,2-dichlorovinyl)glutathione and S(1,2-dichlorovinyl)-L-cysteine in isolated rat kidney cells. J. Biol. Chem 261, 13076–13081. [PubMed] [Google Scholar]
- Lash LH, Elfarra AA, Anders MW, 1986. Renal cysteine conjugate beta-lyase. Bioactivation of nephrotoxic cysteine S-conjugates in mitochondrial outer membrane. J. Biol. Chem 261, 5930–5935. [PubMed] [Google Scholar]
- Lash LH, Sausen PJ, Duescher RJ, Cooley AJ, Elfarra AA, 1994. Roles of cysteine conjugate beta-lyase and S-oxidase in nephrotoxicity: studies with S-(1,2-dichlorovinyl)-L-cysteine and S-(1,2-dichlorovinyl)-L-cysteine sulfoxide. J. Pharmacol. Exp. Ther 269, 374–383. [PubMed] [Google Scholar]
- Lash LH, Putt DA, Brashear WT, Abbas R, Parker JC, Fisher JW, 1999. Identification of S-(1,2-dichlorovinyl)glutathione in the blood of human volunteers exposed to trichloroethylene. J Toxicol Environ Health A 56, 1–21. [DOI] [PubMed] [Google Scholar]
- Lash LH, Chiu WA, Guyton KZ, Rusyn I, 2014a. Trichloroethylene biotransformation and its role in mutagenicity, carcinogenicity and target organ toxicity. Mutat. Res. Rev. Mutat. Res 762, 22–36. [DOI] [PMC free article] [PubMed] [Google Scholar]
- Lash LH, Putt DA, Benipal B, 2014b. Multigenerational study of chemically induced cytotoxicity and proliferation in cultures of human proximal tubular cells. Int. J. Mol. Sci 15, 21348–21365. [DOI] [PMC free article] [PubMed] [Google Scholar]
- Le Vee M, Kolasa E, Jouan E, Collet N, Fardel O, 2014. Differentiation of human placental BeWo cells by the environmental contaminant benzo(a)pyrene. Chem. Biol. Interact 210, 1–11. [DOI] [PubMed] [Google Scholar]
- Li L, Dong M, Wang XG, 2016. The implication and significance of Beta 2 microglobulin: a conservative multifunctional regulator. Chin. Med. J 129, 448–455. [DOI] [PMC free article] [PubMed] [Google Scholar]
- Li Y, Zheng R, Wang R, Lu X, Zhu C, Lin HY, Wang H, Yu X, Fu J, 2015. Involvement of nephrin in human placental trophoblast syncytialization. Reproduction 149, 339–346. [DOI] [PubMed] [Google Scholar]
- Lu E, Hu X, Pan C, Chen J, Xu Y, Zhu X, 2020. Up-regulation of peroxiredoxin-1 promotes cell proliferation and metastasis and inhibits apoptosis in cervical cancer. J. Cancer 11, 1170–1181. [DOI] [PMC free article] [PubMed] [Google Scholar]
- Lu Y, Zhang XS, Zhou XM, Gao YY, Chen CL, Liu JP, Ye ZN, Zhang ZH, Wu LY, Li W, Hang CH, 2019. Peroxiredoxin 1/2 protects brain against H2O2-induced apoptosis after subarachnoid hemorrhage. FASEB J. 33, 3051–3062. [DOI] [PubMed] [Google Scholar]
- Matassov D, Kagan T, Leblanc J, Sikorska M, Zakeri Z, 2004. Measurement of apoptosis by DNA fragmentation. Methods Mol. Biol 282, 1–17. [DOI] [PubMed] [Google Scholar]
- Matsuura K, Jigami T, Taniue K, Morishita Y, Adachi S, Senda T, Nonaka A, Aburatani H, Nakamura T, Akiyama T, 2011. Identification of a link between Wnt/beta-catenin signalling and the cell fusion pathway. Nat. Commun 2, 548. [DOI] [PubMed] [Google Scholar]
- McKinney LL, Picken JC Jr., Weakley FB, Eldridge AC, Campbell RE, Cowan JC, Biester HE, 1959. Possible toxic factor of trichloroethylene-extracted soybean oil meal. J. Am. Chem. Soc 81, 909–915. [Google Scholar]
- Newlaczyl AU, Yu LG, 2011. Galectin-3–a jack-of-all-trades in cancer. Cancer Lett 313, 123–128. [DOI] [PubMed] [Google Scholar]
- Niles AL, Moravec RA, Hesselberth PE, Scurria MA, Daily WJ, Riss TL, 2007. A homogenous assay to measure live and dead cells in the same sample by detecting different protease markers. Anal. Biochem 366, 197–206. [DOI] [PubMed] [Google Scholar]
- Niles AL, Moravec RA, Riss TL, 2008. Caspase activity assays. Methods Mol. Biol 414, 137–150. [DOI] [PubMed] [Google Scholar]
- Panigel M, Myers RE, 1972. Histological and ultrastructural changes in rhesus monkey placenta following interruption of fetal placental circulation by fetectomy or interplacental umbilical vessel ligation. Acta Anat. (Basel) 81, 481–506. [DOI] [PubMed] [Google Scholar]
- Papa S, Bubici C, Pham CG, Zazzeroni F, Franzoso G, 2005. NF-kappaB meets ROS: an ‘iron-ic’ encounter. Cell Death Differ 12, 1259–1262. [DOI] [PubMed] [Google Scholar]
- Parrish AB, Freel CD, Kornbluth S, 2013. Cellular mechanisms controlling caspase activation and function. Cold Spring Harb. Perspect. Biol 5, a008672. [DOI] [PMC free article] [PubMed] [Google Scholar]
- Pattillo RA, Gey GO, 1968. The establishment of a cell line of human hormone-synthesizing trophoblastic cells in vitro. Cancer Res. 28, 1231–1236. [PubMed] [Google Scholar]
- Potgens AJ, Schmitz U, Bose P, Versmold A, Kaufmann P, Frank HG, 2002. Mechanisms of syncytial fusion: a review. Placenta 23 Suppl A, S107–S113. [DOI] [PubMed] [Google Scholar]
- Rodenbeck SE, Sanderson LM, Rene A, 2000. Maternal exposure to trichloroethylene in drinking water and birth-weight outcomes. Arch. Environ. Health 55, 188–194. [DOI] [PubMed] [Google Scholar]
- Ruckart PZ, Bove FJ, Maslia M, 2014. Evaluation of contaminated drinking water and preterm birth, small for gestational age, and birth weight at marine Corps Base camp Lejeune, North Carolina: a cross-sectional study. Environ. Health 13, 99. [DOI] [PMC free article] [PubMed] [Google Scholar]
- Saquib Q, Al-Khedhairy AA, Ahmad J, Siddiqui MA, Dwivedi S, Khan ST, Musarrat J, 2013. Zinc ferrite nanoparticles activate IL-1b, NFKB1, CCL21 and NOS2 signaling to induce mitochondrial dependent intrinsic apoptotic pathway in WISH cells. Toxicol. Appl. Pharmacol 273, 289–297. [DOI] [PubMed] [Google Scholar]
- Sharp AN, Heazell AE, Crocker IP, Mor G, 2010. Placental apoptosis in health and disease. Am. J. Reprod. Immunol 64, 159–169. [DOI] [PMC free article] [PubMed] [Google Scholar]
- Sun QH, Peng JP, Xia HF, Yang Y, 2007. IFN-gamma promotes apoptosis of the uterus and placenta in pregnant rat and human cytotrophoblast cells. J. Interf. Cytokine Res 27, 567–578. [DOI] [PubMed] [Google Scholar]
- Vargas A, Moreau J, Landry S, LeBellego F, Toufaily C, Rassart E, Lafond J, Barbeau B, 2009. Syncytin-2 plays an important role in the fusion of human trophoblast cells. J. Mol. Biol 392, 301–318. [DOI] [PubMed] [Google Scholar]
- Wajant H, Scheurich P, 2011. TNFR1-induced activation of the classical NF-kappaB pathway. FEBS J. 278, 862–876. [DOI] [PubMed] [Google Scholar]
- Wang R, Dang YL, Zheng R, Li Y, Li W, Lu X, Wang LJ, Zhu C, Lin HY, Wang H, 2014. Live cell imaging of in vitro human trophoblast syncytialization. Biol. Reprod 90, 117. [DOI] [PubMed] [Google Scholar]
- Wang ZY, Lu J, Zhang YZ, Zhang M, Liu T, Qu XL, 2015. Effect of bisphenol a on invasion ability of human trophoblastic cell line BeWo. Int. J. Clin. Exp. Pathol 8, 14355–14364. [PMC free article] [PubMed] [Google Scholar]
- Wice B, Menton D, Geuze H, Schwartz AL, 1990. Modulators of cyclic AMP metabolism induce syncytiotrophoblast formation in vitro. Exp. Cell Res 186, 306–316. [DOI] [PubMed] [Google Scholar]
- Wu F, Tian F, Zeng W, Liu X, Fan J, Lin Y, Zhang Y, 2017. Role of peroxiredoxin2 downregulation in recurrent miscarriage through regulation of trophoblast proliferation and apoptosis. Cell Death Dis. 8, e2908. [DOI] [PMC free article] [PubMed] [Google Scholar]
- Xu F, Papanayotou I, Putt DA, Wang J, Lash LH, 2008. Role of mitochondrial dysfunction in cellular responses to S-(1,2-dichlorovinyl)-L-cysteine in primary cultures of human proximal tubular cells. Biochem. Pharmacol 76, 552–567. [DOI] [PMC free article] [PubMed] [Google Scholar]
- Yang GQ, Huang JC, Yuan JJ, Zhang Q, Gong CX, Chen Q, Xie Q, Xie LX, Chen R, Qiu ZM, Zhou K, Xu R, Jiang GH, Xiong XY, Yang QW, 2020. Prdx1 reduces intracerebral hemorrhage-induced brain injury via targeting inflammation- and apoptosis-related mRNA stability. Front. Neurosci 14, 181. [DOI] [PMC free article] [PubMed] [Google Scholar]
- Yang RY, Hsu DK, Liu FT, 1996. Expression of galectin-3 modulates T-cell growth and apoptosis. Proc. Natl. Acad. Sci. U. S. A 93, 6737–6742. [DOI] [PMC free article] [PubMed] [Google Scholar]
- Yang RY, Rabinovich GA, Liu FT, 2008. Galectins: structure, function and therapeutic potential. Expert Rev. Mol. Med 10, e17. [DOI] [PubMed] [Google Scholar]
- Yuan JS, Reed A, Chen F, Stewart CN Jr., 2006. Statistical analysis of real-time PCR data. BMC Bioinforma. 7, 85. [DOI] [PMC free article] [PubMed] [Google Scholar]
- Zhang L, Shiverick KT, 1997. Benzo(a) pyrene, but not 2,3,7,8-tetrachlorodibenzo-p-dioxin, alters cell proliferation and c-myc and growth factor expression in human placental choriocarcinoma JEG-3 cells. Biochem. Biophys. Res. Commun 231, 117–120. [DOI] [PubMed] [Google Scholar]
- Zhang L, Connor EE, Chegini N, Shiverick KT, 1995. Modulation by benzo[a] pyrene of epidermal growth factor receptors, cell proliferation, and secretion of human chorionic gonadotropin in human placental cell lines. Biochem. Pharmacol 50, 1171–1180. [DOI] [PubMed] [Google Scholar]
- Zhang M, Li Y, Zhang H, Xue S, 2001. BAPTA blocks DNA fragmentation and chromatin condensation downstream of caspase-3 and DFF activation in HT-induced apoptosis in HL-60 cells. Apoptosis 6, 291–297. [DOI] [PubMed] [Google Scholar]
- Zheng R, Li Y, Sun H, Lu X, Sun BF, Wang R, Cui L, Zhu C, Lin HY, Wang H, 2016. Deep RNA sequencing analysis of syncytialization-related genes during BeWo cell fusion. Reproduction 153, 35–48. [DOI] [PubMed] [Google Scholar]
Associated Data
This section collects any data citations, data availability statements, or supplementary materials included in this article.
Supplementary Materials
Data Availability Statement
Data will be made available on request.