

Abstract
The goal of this study was to examine associations between accelerometer-measured physical activity (PA) and sedentary time (ST) with mortality by a genetic risk score (GRS) for longevity. Among 5,446 women, (mean [standard deviation] age, 78.2 [6.6] years), 1,022 deaths were observed during 33,350 person-years of follow-up. Using multivariable Cox proportional hazards models, higher light PA and MVPA were associated with lower mortality across all GRS for longevity categories (low/medium/high; ptrend < .001, all). Higher ST was associated with higher mortality (ptrend across all GRS categories < .001). Interaction tests for PA and ST with the GRS were not statistically significant. Findings support the importance of higher PA and lower ST for reducing mortality risk in older women, regardless of genetic predisposition for longevity.
Keywords: healthy aging, physical activity, sedentary behavior, mortality, women’s health
Engaging in physical activity (PA) and reducing sedentary time (ST) are important to achieve healthy aging (U.S. Department of Health and Human Services, 2018). Several studies have reported inverse associations between PA and mortality (Almeida et al., 2014; Lee et al., 2018; Mok et al., 2019; Oguma et al., 2002). Moderate-to-vigorous PA (MVPA), even below the recommended amount of 150 minutes per week for older adults (U.S. Department of Health and Human Services, 2018), was associated with 22% lower mortality risk in a meta-analysis (Hupin et al., 2015). Another meta-analysis showed that individuals at the highest levels of accelerometer-measured ST had higher mortality risk (Ekelund et al., 2019).
Longevity is likely due to environmental (e.g., lifestyle behaviors) and genetic factors (Hjelmborg et al., 2006). Genome-wide association studies (GWAS) have identified multiple single nucleotide polymorphisms (SNPs) associated with longevity (Deelen et al., 2019; Pilling et al., 2017; Shadyab & LaCroix, 2015). Despite consistent evidence of associations of PA and ST with mortality, it is unknown whether associations of PA and ST with mortality vary by genetic predisposition for longevity. If these associations do not vary by genetic predisposition for longevity, then this would provide further support for the importance of a physically active lifestyle, regardless of genetic tendency for greater longevity.
Previous studies examining the Objective Physical Activity and Cardiovascular Health (OPACH) cohort of older women found strong associations of accelerometer-measured light PA, MVPA, and ST with all-cause mortality during a mean follow-up of 3.1 years (LaMonte et al., 2018). However, no attempt was made to understand the genetic contribution to these associations. Therefore, the goal of this study was to leverage a longer mean follow-up of 6.1 years in the OPACH cohort to replicate these associations and extend them by determining the extent to which findings vary by a weighted genetic risk score (GRS) for longevity. We also tested for effect modification by GRS for longevity in these associations.
Methods
Study Participants
OPACH is an ancillary study to the Women’s Health Initiative (WHI) designed to investigate accelerometer-measured PA and ST in relation to cardiovascular and fall events among 7,058 United States postmenopausal women aged ≥63 years. Complete details on study design have been extensively reported elsewhere for the WHI (Anderson et al., 2003) and OPACH study (LaCroix et al., 2017). Briefly, OPACH participants were recruited from a subset of the WHI Clinical Trial or the Observational Study from 40 clinical sites throughout the United States from 1993 to 1998. WHI participants were followed annually until 2005, with extension studies that enrolled consenting participants for continued follow-up through 2010, 2015, and 2020. OPACH women were enrolled from March 2012 to April 2014 and followed through February 28, 2020 at the time of this analysis. All baseline covariate information was obtained using self-report questionnaires and an in-home clinical examination. Covariates from OPACH baseline assessments were used in the present analysis.
OPACH participants were provided an ActiGraph GT3X+ triaxial accelerometer (ActiGraph, Pensacola, FL), which they were instructed to wear over their right hip for 24 hours per day (except when bathing or swimming) for 7 consecutive days. Participants reported in-bed and out-of-bed times using sleep logs on days of accelerometer wear. Of the 7,058 enrolled OPACH sample, 10 died before receiving OPACH materials, 327 did not return the accelerometer, 232 returned the accelerometer with unusable data, and 363 had non-adherent wear (i.e., they did not wear accelerometers for at least 10 hours for 4 days, which is the recommended period for accurately measuring usual behavior) (Migueles et al., 2017). Of the 6,126 with adherent accelerometer wear, 680 did not have genotyping data, yielding an analytic sample of 5,446 women for the present study (Figure 1). The WHI program, including the collection of genetic data, and the OPACH study were reviewed and approved by the Fred Hutchinson Cancer Research Center Institutional Review Board in Seattle, WA in accordance with the U.S. Department of Health and Human Services regulations at 45 CFR 46 (approval number 3467-EXT). All participants provided informed consent either in writing, or via a telephone-based consent process.
Figure 1 —
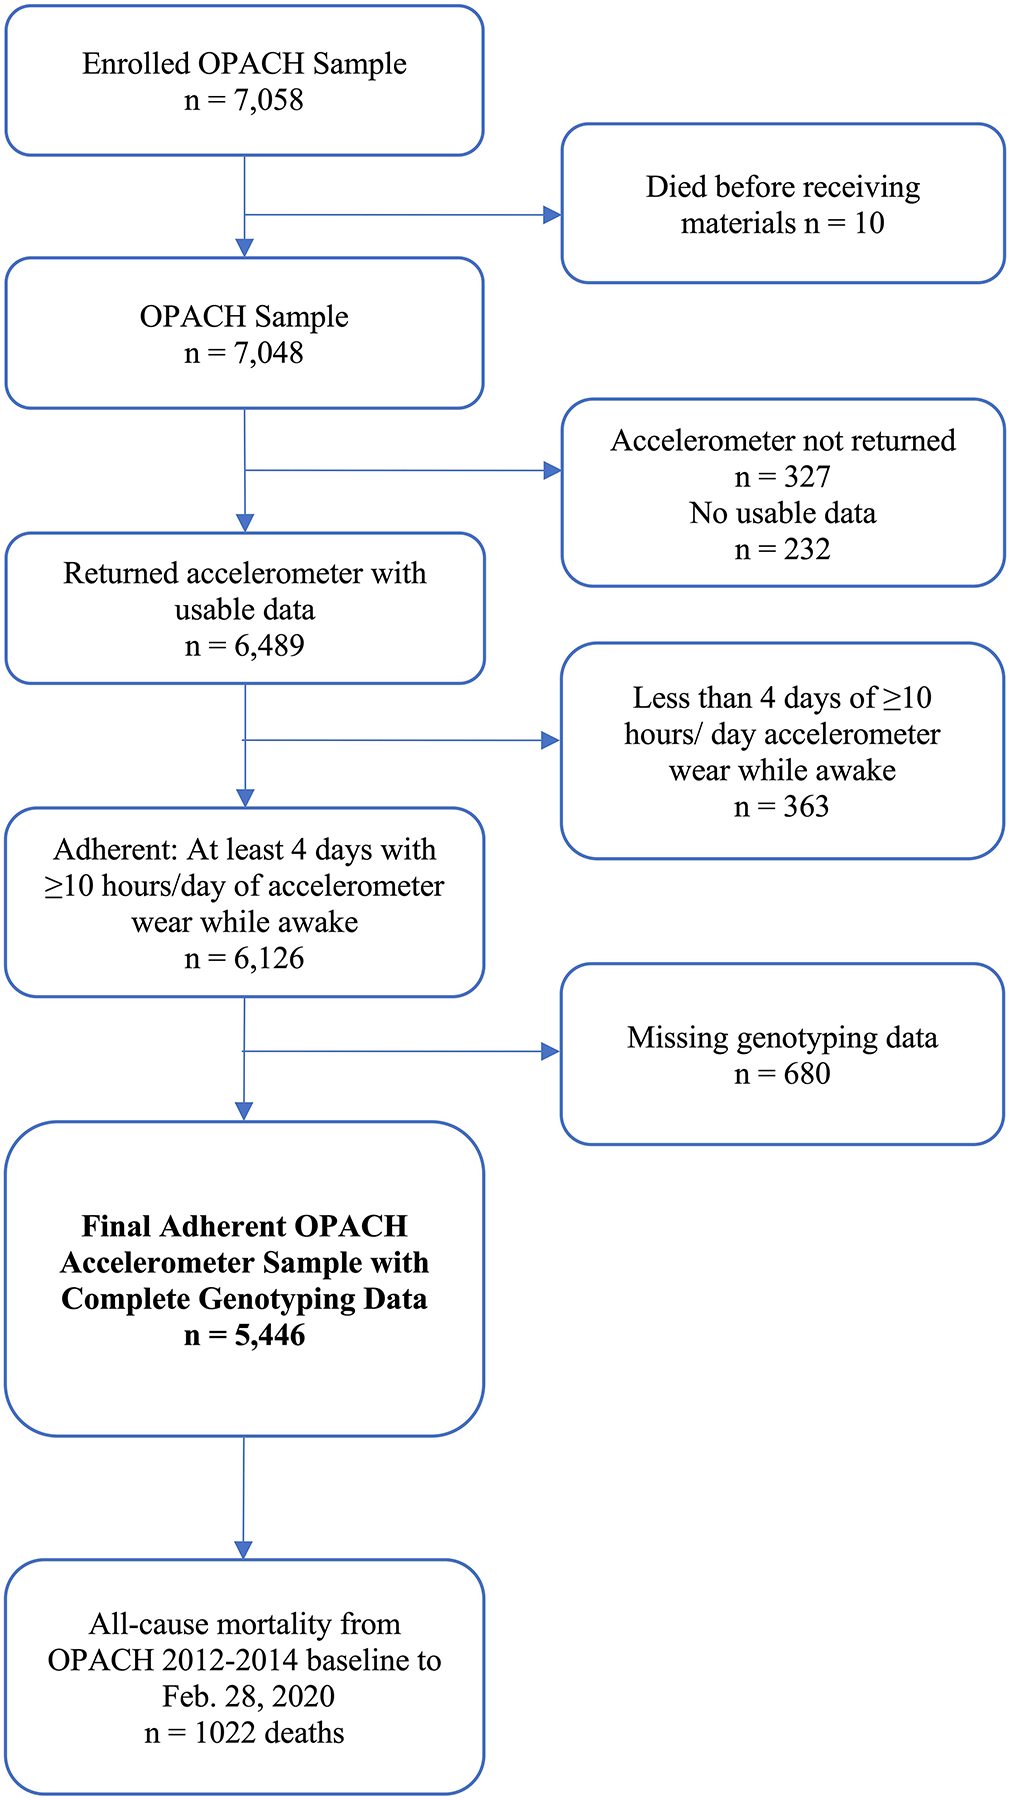
Strengthening the Reporting of Observational Studies in Epidemiology (STROBE) diagram for derivation of analytic sample with accelerometer and genotyping data in the OPACH study, 2012–2014 baseline through February 28, 2020. OPACH = Objective Physical Activity and Cardiovascular Health.
Outcome: All-Cause Mortality
The primary outcome of interest was all-cause mortality from 2012–2014 baseline through February 28, 2020. In the WHI, mortality surveillance is conducted using annual mailed outcomes questionnaires supplemented by National Death Index searches, proxy queries, obituaries, and hospital records (Curb et al., 2003).
Exposures: Physical Activity and Sedentary Time
The primary exposures of interest were time spent in light PA, MVPA, and total ST, defined as the average of each behavior over all adherent days. Accelerometer data were converted to 15-second epochs using ActiLife v6, processed using the Choi algorithm to flag non-wear time with a 90-minute window, 30-minute streamframe, and 2-minute tolerance (Choi et al., 2011). The 15-second epochs allowed for lower misclassification of movement that may have been missed in longer epochs and is consistent with prior OPACH work (LaMonte et al., 2018). In-bed time was identified using sleep diaries. Awake-time epochs were classified into ST and PA intensities using cutpoints determined in a previous calibration study (Evenson, Wen, Herring, et al., 2015). Total PA was defined as movement resulting in energy expenditure of ≥1.6 metabolic equivalents (METs). PA intensity and ST minutes were categorized using calibrated cutpoints applied to 15-second epochs of vector magnitude accelerometer counts as follows: light PA (1.6–2.9 METs) defined as 19–518 counts/15s, MVPA (≥3.0 METs) as ≥519 counts/15s, and total ST as ≤18 counts/15s.
Effect Modifier: Genetic Risk Score for Longevity
The weighted GRS for longevity included three SNPs significantly associated with longevity in a large meta-analysis of 18 GWAS that included 11,262 cases surviving to the 90th percentile (defined by study population census data) and 25,483 controls of European ancestry: rs429358, rs7412, and rs7676745 (Deelen et al., 2019). rs429358 and rs7412 are SNPs for the APOE gene (Mahley & Rall, 2000).
In the overall WHI sample, 27,131 women had relevant genotyping data from previous core and ancillary studies (see https://www.whi.org/gwas; accessed 4/25/2021; Supplementary Methods 1). For the present study, directly genotyped SNPs were coded as 0, 1 or 2, indicating the number of longevity alleles present, and imputed SNPs used mean dosages between 0 and 2. The GRS was calculated by weighting the sum of longevity-influencing alleles for each SNP by their estimated effect sizes reported in the meta-analysis of GWAS described above (see Supplementary Methods 2). We validated this GRS for longevity in the WHI cohort (described below).
Covariates
Covariates were selected based on previous literature (LaMonte et al., 2018) and included age (years), race/ethnicity (White, Black, Hispanic), education (≤high school, some college, ≥college graduate), body mass index (BMI; kg/m2), self-reported health status (excellent or very good, good, fair or poor), physical functioning as defined by the RAND-36 questionnaire (Hays & Morales, 2001), alcohol consumption (non-drinker, <1, 1–4, ≥5 drinks per week), smoking status (current, past, former), and comorbidities (0, 1, ≥2). Comorbidities were analyzed as the sum of nine chronic conditions present at or before accelerometer wear: cancer, cardiovascular disease, cerebrovascular disease, chronic obstructive pulmonary disease, cognitive impairment, depression, diabetes, frequent falls, and osteoarthritis (Rillamas-Sun et al., 2016).
Statistical Analysis
The GRS was split into tertiles (low, medium, or high genetic predisposition for longevity). Participant characteristics were described across tertiles of GRS and total PA. Comparisons across tertiles of GRS and total PA were performed using analysis of variance or Kruskal-Wallis tests for normally distributed and non-normally distributed continuous variables, respectively, and Pearson’s χ2 for categorical variables.
The GRS was validated in the overall WHI sample and in the OPACH cohort. To validate the GRS in the present study, odds ratios (ORs) and 95% confidence intervals (CIs) were estimated for relations between the GRS for longevity and survival to age 90 vs. death before this age using logistic regression models in OPACH (n=1,641) and the overall WHI sample (n=11,660). Women who were born on or before February 28, 1930, who had the ability to survive to age 90 as of the last date of follow-up, were eligible to be included in this analysis. Both models adjusted for age, race/ethnicity, and the first five principal components (PCs) to control for population stratification (i.e., differences in allele frequency due to ancestry) and account for genetic ancestry (Price et al., 2006).
Associations of PA and ST with mortality were estimated using Cox proportional hazards regression models. Time to mortality was defined as number of days from first day of accelerometer wear at OPACH baseline to date of death, loss to follow-up, or February 28, 2020, whichever came first. Two sequentially adjusted models were computed. Model 1 adjusted for accelerometer wear time, age, race/ethnicity, education, BMI, smoking status, self-reported health status, alcohol consumption, and comorbidities. Model 2 additionally adjusted for physical functioning. To examine whether these associations varied by a GRS for longevity, we stratified models by GRS tertiles. Two sequentially adjusted models were computed. Model 1 adjusted for accelerometer wear time, age, race/ethnicity, and the first five PCs to control for population stratification; Model 2 additionally adjusted for education, BMI, smoking status, self-reported health status, alcohol consumption, comorbidities, and physical functioning. To test for effect modification by GRS, Wald test statistics compared Model 2 with and without a multiplicative interaction term between continuous PA/ST and GRS using p values for interaction (pinteraction). Linear trends for PA and ST were evaluated by treating PA and ST as continuous variables in the models using p values for trend (ptrend). To account for missing covariate data, we employed multiple imputation analysis by chained equations using the mice package (van Buuren & Groothuis-Oudshoorn, 2011). There were 9 imputed datasets, corresponding to the highest proportion of covariate missingness (i.e., 9% missing smoking status). For visualization, we plotted dose-response associations of PA/ST with mortality by GRS tertiles using complete case, cubic spline analysis with the rms package (Harrell, 2020). We used Akaike’s information criterion to help determine whether 3 or 4 knots provided the optimal fit, and used 3 knots at the 10th, 50th, and 95th percentiles (Harrell, 2015). The proportional hazards assumption was tested using Schoenfeld residuals; however, no violations of this assumption were observed (Therneau et al., 2021).
Several sensitivity analyses were performed. To evaluate potential survival bias due to selection of older women, we plotted survival curves by GRS tertiles for the first 10 years of WHI enrollment and among those who survived >10 years, which was approximately the time of OPACH enrollment. We also plotted survival curves based on Cox proportional hazards regression models adjusted for age, race/ethnicity, and the first five principal components in OPACH. To evaluate reverse causation, primary analyses were repeated after excluding participants who died within two years of OPACH baseline. Because GRS SNPs were derived from individuals of European descent, primary analyses were repeated after restricting to women of White race/ethnicity. Lastly, we tested interactions between PA/ST and the APOE ε2/ε4 genotype given their contribution to the GRS (Deelen et al., 2019).
All statistical analyses were conducted in R version 4.0.3 (R Core Team, 2020). Statistical tests were two-tailed and p values were considered significant at p < .05.
Results
Descriptive Characteristics
Of the 5,446 women in the analytic sample, there were 1,022 deaths during 33,350 person-years of follow-up (mean follow-up = 6.1 years; range = 0.1–7.9 years). Based on GRS tertile distributions in the WHI (N=27,131), 36.0% of OPACH women were classified as high genetic predisposition for longevity (i.e., high GRS), 33.1% as medium GRS for longevity, and 30.9% as low GRS for longevity (Table 1). The number of deaths (rate per 1,000 person-years) in the low, medium, and high GRS groups were 295 (28.6), 381 (34.6), and 346 (28.8), respectively. Women in the low GRS group were younger, had higher physical functioning scores, lower ST time, higher total PA time, and higher light PA time relative to other GRS groups. Women in the low GRS group were more likely to be of Black race/ethnicity (42.4%) than the medium and high GRS groups. Women of White race/ethnicity constituted most of the medium (55.8%) and high (42.7%) GRS groups compared to the low GRS group.
Table 1.
Baseline sociodemographic and health-related characteristics by genetic risk score for longevity among OPACH participants, 2012–2014 (N=5,446)
| Tertiles of genetic risk score for longevitya | p valueb | |||
|---|---|---|---|---|
| Characteristics | Low (n = 1,681) | Medium (n = 1,804) | High (n = 1,961) | |
| Age (years) | 77.6 (6.7) | 79.1 (6.5) | 78.0 (6.5) | <.001 |
| Follow-up time (years), median (IQR) | 6.5 (1.3) | 6.7 (1.3) | 6.6 (1.3) | 0.63 |
| Accelerometer wear time (hours/day) | 14.86 (1.3) | 14.92 (1.3) | 14.89 (1.3) | 0.37 |
| Race/ethnicity, n (%) | <.001 | |||
| White | 686 (40.8%) | 1006 (55.8%) | 838 (42.7%) | |
| Black | 713 (42.4%) | 448 (24.8%) | 765 (39.0%) | |
| Hispanic | 282 (16.8%) | 350 (19.4%) | 358 (18.3%) | |
| Highest education level, n (%) | 0.37 | |||
| ≤ High school/GED | 324 (19.4%) | 377 (21.0%) | 409 (21.0%) | |
| Some college | 638 (38.2%) | 706 (39.4%) | 728 (37.5%) | |
| ≥ College graduate | 710 (42.5%) | 710 (39.6%) | 807 (41.5%) | |
| BMI (kg/m2), median (IQR) | 27.2 (7.4) | 27.2 (7.0) | 27.5 (7.1) | 0.07 |
| Self-reported health status | 0.56 | |||
| Excellent or very good | 859 (51.3%) | 939 (52.2%) | 969 (49.5%) | |
| Good | 659 (39.4%) | 688 (38.3%) | 793 (40.5%) | |
| Fair or poor | 156 (9.3%) | 171 (9.5%) | 194 (9.9%) | |
| Comorbiditiesc, n (%) | 0.58 | |||
| 0 | 388 (23.1%) | 401 (22.2%) | 439 (22.4%) | |
| 1 | 673 (40.0%) | 700 (38.8%) | 748 (38.1%) | |
| ≥2 | 620 (36.9%) | 703 (39.0%) | 774 (39.5%) | |
| Physical functioning (RAND-36), median (IQR) | 80.0 (35.0) | 75.0 (40.0) | 75.0 (40.0) | .007 |
| Alcohol consumption (per week) | 0.07 | |||
| non-drinker | 604 (40.1%) | 588 (35.3%) | 677 (37.8%) | |
| <1 drink | 498 (33.1%) | 578 (34.7%) | 627 (35.0%) | |
| 1–4 drinks | 254 (16.9%) | 293 (17.6%) | 305 (17.0%) | |
| ≥5 drinks | 149 (9.9%) | 205 (12.3%) | 182 (10.2%) | |
| Smoking status, n (%) | 0.92 | |||
| Not current | 1457 (97.0%) | 1619 (97.2%) | 1735 (97.2%) | |
| Current | 45 (3.0%) | 46 (2.8%) | 50 (2.8%) | |
| Total ST (min/day) | 546.2 (100.2) | 558.6 (97.9) | 556.1 (100.5) | <.001 |
| PA (min/day) | ||||
| Total | 345.1 (98.2) | 336.5 (97.4) | 337.4 (96.5) | 0.02 |
| Light | 292.6 (77.3) | 286.1 (78.3) | 286.5 (76.6) | 0.02 |
| Moderate-to-vigorous, median (IQR) | 45.8 (45.5) | 43.0 (43.5) | 44.2 (44.9) | 0.46 |
Note. Total ST is average minutes per day with accelerometer counts of ≤18 counts/15 seconds. Total PA is defined as average minutes per day with accelerometer counts of ≥18 counts/15s, low light PA is 19 to 225 counts/15s, high light PA is 226 to 518 counts/15s, and moderate-to-vigorous PA is ≥519 counts/15s. n missing: education = 37 (0.7%); BMI = 346 (6.4%); self-reported health status = 18 (0.3%); physical functioning = 60 (1.1%); alcohol consumption = 486 (8.9%); smoking status = 494 (9.1%). BMI = body mass index; GED = General Educational Development; IQR = interquartile range; OPACH = Objective Physical Activity and Cardiovascular Health; PA = physical activity; ST = sedentary time; WHI = Women’s Health Initiative.
Higher genetic risk score is indicative of higher genetic predisposition for longevity. Tertile cutpoints based on larger WHI population with genetic data, resulting in slightly uneven tertiles in OPACH study.
p value derived from F-tests or Kruskal-Wallis tests for continuous variables or χ2 categorical variables.
Comorbidities is defined as the sum of the following chronic conditions present at or before accelerometer wear: cancer, cardiovascular disease, cerebrovascular disease, chronic obstructive pulmonary disease, cognitive impairment, depression, diabetes, frequent falls, and osteoarthritis.
Women in the highest tertile of accelerometer-measured total PA were younger, rated their health more favorably, and reported fewer comorbidities compared to women in the lower total PA tertiles (Table 2). They were also least likely to be current smokers but reported more alcohol consumption than women in the lower tertiles of PA. They had greater physical functioning scores and lower BMI. GRS for longevity did not vary across total PA tertiles.
Table 2.
Baseline sociodemographic and health-related characteristics by tertiles of total PA among OPACH participants, 2012–2014 (N=5,446)
| Tertiles of total PAa | p valueb | |||
|---|---|---|---|---|
| Characteristics | T1 (n = 1,816) | T2 (n = 1,815) | T3 (n = 1,815) | |
| Genetic risk score for longevity, median (IQR) | 1.8 (0.2) | 1.8 (0.2) | 1.8 (0.3) | 0.17 |
| Age (years) | 80.2 (6.5) | 78.0 (6.4) | 76.4 (6.3) | <.001 |
| Accelerometer wear time (hours/day) | 14.4 (1.3) | 14.9 (1.2) | 15.4 (1.1) | <.001 |
| Race/ethnicity, n (%) | <.001 | |||
| White | 1000 (55.1%) | 815 (44.9%) | 715 (39.4%) | |
| Black | 604 (33.3%) | 675 (37.2%) | 647 (35.7%) | |
| Hispanic | 212 (11.7%) | 325 (17.9%) | 453 (25.0%) | |
| Highest education level, n (%) | .005 | |||
| ≤ High school/GED | 384 (21.3%) | 352 (19.6%) | 374 (20.7%) | |
| Some college | 735 (40.8%) | 688 (38.2%) | 649 (35.9%) | |
| ≥ College graduate | 681 (37.8%) | 760 (42.2%) | 786 (43.5%) | |
| BMI (kg/m2), median (IQR) | 29.2 (8.1) | 27.4 (6.8) | 25.7 (6.0) | <.001 |
| Self-reported health status | <.001 | |||
| Excellent or very good | 704 (38.9%) | 956 (52.9%) | 1107 (61.2%) | |
| Good | 836 (46.2%) | 706 (39.0%) | 598 (33.0%) | |
| Fair or poor | 269 (14.9%) | 147 (8.1%) | 105 (5.8%) | |
| Comorbiditiesc, n (%) | <.001 | |||
| 0 | 294 (16.2%) | 411 (22.6%) | 523 (28.8%) | |
| 1 | 643 (35.4%) | 729 (40.2%) | 749 (41.3%) | |
| ≥2 | 879 (48.4%) | 675 (37.2%) | 543 (29.9%) | |
| Physical functioning (RAND-36), median (IQR) | 60.0 (45.0) | 80.0 (35.0) | 85.0 (25.0) | <.001 |
| Alcohol consumption (per week) | <.001 | |||
| non-drinker | 704 (43.4%) | 606 (36.5%) | 559 (33.4%) | |
| <1 drink | 565 (34.8%) | 597 (35.9%) | 541 (32.3%) | |
| 1–4 drinks | 209 (12.9%) | 294 (17.7%) | 349 (20.8%) | |
| ≥5 drinks | 146 (9.0%) | 164 (9.9) | 226 (13.5%) | |
| Smoking status, n (%) | 0.02 | |||
| Not current | 1564 (96.3%) | 1609 (97.2%) | 1638 (98.0%) | |
| Current | 60 (3.7%) | 47 (2.8%) | 34 (2.0%) | |
Note. Total PA is defined as average minutes per day with accelerometer counts of ≥18 counts/15s, low light PA is 19 to 225 counts/15s, high light PA is 226 to 518 counts/15s, and moderate-to-vigorous PA is ≥519 counts/15s. n missing: education = 37 (0.7%); BMI = 346 (6.4%); self-reported health status = 18 (0.3%); physical functioning = 60 (1.1%); alcohol consumption = 486 (8.9%); smoking status = 494 (9.1%). BMI = body mass index; GED = General Educational Development; IQR = interquartile range; OPACH = Objective Physical Activity and Cardiovascular Health; PA = physical activity; T = tertiles.
Total physical activity (min/day) tertiles are defined as follows: T1 ≤ 295.58; T2 = 295.59 to 379.42; T3 ≥ 379.43.
p value derived from F-tests or Kruskal-Wallis tests for continuous variables or χ2 categorical variables.
Comorbidities is defined as the sum of the following chronic conditions present at or before accelerometer wear: cancer, cardiovascular disease, cerebrovascular disease, chronic obstructive pulmonary disease, cognitive impairment, depression, diabetes, frequent falls, and osteoarthritis.
Validation of GRS
The GRS for longevity was associated with survival to age 90 in the overall WHI (ptrend < .001) and OPACH (ptrend = .04; Supplementary Table 1). WHI women in the medium GRS group had 29% (OR = 1.29, 95% CI [1.18, 1.41]) higher odds of survival to age 90 (vs. death before this age) relative to the low GRS group. WHI women in the high GRS group had 37% (OR = 1.37, 95% CI [1.25, 1.50]) higher odds of survival to age 90 compared to the low GRS group. In OPACH, the odds of survival to age 90 were 68% (OR = 1.68, 95% CI [1.14, 2.48]) higher for the high compared to low GRS group.
Association between light PA, MVPA, and ST with Mortality
Accelerometer-measured amounts of light PA and MVPA per day were inversely associated with mortality (ptrend < .001, all; Table 3). After adjusting for accelerometer wear time, age, race/ethnicity, education, BMI, smoking status, self-reported health status, alcohol consumption, and comorbidities, women in higher quartiles of light PA had lower risk of mortality compared to the lowest quartile of light PA (quartiles 2, 3, and 4 hazard ratios [HRs] [95% CI] vs. quartile 1: 0.72 [0.61, 0.84]; 0.70 [0.59, 0.84]; 0.55 [0.45, 0.67]). These associations were attenuated but remained statistically significant after further adjustment for physical functioning. For MVPA, women in higher quartiles of MVPA had lower risk of mortality compared to the lowest quartile of MVPA in fully adjusted models (quartiles 2, 3, and 4 HRs [95% CI] vs. quartile 1: 0.76 [0.65, 0.90]; 0.60 [0.49, 0.73]; 0.46 [0.36, 0.58]).
Table 3.
Hazard ratios and 95% confidence intervals relating PA with mortality: OPACH women enrolled in 2012–2014 and followed through February 28, 2020 (N=5,446)
| Quartiles of PA | p value for trenda | ||||
|---|---|---|---|---|---|
| Q1 | Q2 | Q3 | Q4 | ||
| (n=1,362) | (n=1,362) | (n=1,361) | (n=1,361) | ||
| Light PA | |||||
| Mortality events, n (rate) | 399 (51.0) | 258 (30.9) | 207 (24.4) | 158 (18.2) | |
| Model 1 | 1.00 [ref.] | 0.72 [0.61, 0.84] | 0.70 [0.59, 0.84] | 0.55 [0.45, 0.67] | <.001 |
| Model 2 | 1.00 [ref.] | 0.76 [0.64, 0.89] | 0.75 [0.63, 0.90] | 0.59 [0.48, 0.72] | <.001 |
| Moderate-to-vigorous PA | |||||
| Mortality events, n (rate) | 482 (63.9) | 267 (32.0) | 169 (19.5) | 104 (11.8) | |
| Model 1 | 1.00 [ref.] | 0.72 [0.62, 0.84] | 0.55 [0.45, 0.66] | 0.41 [0.32, 0.52] | <.001 |
| Model 2 | 1.00 [ref.] | 0.76 [0.65, 0.90] | 0.60 [0.49, 0.73] | 0.46 [0.36, 0.58] | <.001 |
Note. Measures of effect from multivariable Cox proportional hazards regression models. Light PA (min/day) Q are defined as follows: Q1 ≤ 233.96; Q2 = 233.97 to 287.13; Q3 = 287.14 to 337.94; Q4 ≥ 337.95. Moderate-to-vigorous PA (min/day) Q are defined as follows: Q1 ≤ 25.17; Q2 = 25.18 to 44.33.; Q3 = 44.34 to 69.75; Q4 ≥ 69.76. Data for mortality events are n (crude rate per 1,000 person-years). Model 1 includes PA as the exposure of interest and adjusts for accelerometer wear time, age, race/ethnicity, education, BMI, smoking status, self-reported health status, alcohol consumption, and comorbidities. Model 2 includes Model 1 and additionally adjusts for physical functioning. Comorbidities is defined as the sum of the following chronic conditions present at or before accelerometer wear: cancer, cardiovascular disease, cerebrovascular disease, chronic obstructive pulmonary disease, cognitive impairment, depression, diabetes, frequent falls, and osteoarthritis. BMI = body mass index; OPACH = Objective Physical Activity and Cardiovascular Health; PA = physical activity; Q = quartile.
p values from Cox multivariable regression models using continuous light PA or moderate-to-vigorous PA.
Higher ST per day was associated with higher mortality risk (ptrend < .001; Table 4). After adjusting for accelerometer wear time, age, race/ethnicity, education, BMI, smoking status, self-reported health status, alcohol consumption, and comorbidities, women in higher quartiles of ST had higher risk of mortality compared to the lowest quartile of ST (quartiles 2, 3, and 4 HRs [95% CI] vs. quartile 1: 1.22 [0.99, 1.50]; 1.69 [1.38, 2.07]; 2.05 [1.65, 2.56]). Associations remained statistically significant after further adjustment for physical functioning.
Table 4.
Hazard ratios and 95% confidence intervals relating ST with mortality: OPACH women enrolled in 2012–2014 and followed through February 28, 2020 (N=5,446)
| Quartiles of ST | p value for trenda | ||||
|---|---|---|---|---|---|
| Q1 | Q2 | Q3 | Q4 | ||
| (n=1,362) | (n=1,362) | (n=1,361) | (n=1,361) | ||
| Mortality events, n (rate) | 168 (19.4) | 216 (25.4) | 294 (35.9) | 344 (42.9) | |
| Model 1 | 1.00 [ref.] | 1.22 [0.99, 1.50] | 1.69 [1.38, 2.07] | 2.05 [1.65, 2.56] | <.001 |
| Model 2 | 1.00 [ref.] | 1.17 [0.95, 1.43] | 1.59 [1.30, 1.96] | 1.83 [1.47, 2.29] | <.001 |
Note. Measures of effect from multivariable Cox proportional hazards regression models. ST (min/day) Q are defined as follows: Q1 ≤ 489.04; Q2 = 489.05 to 555.85; Q3 = 555.86 to 620.50; Q4 ≥ 620.51. Data for mortality events are n (crude rate per 1,000 person-years). Model 1 includes ST as the exposure of interest and adjusts for accelerometer wear time, age, race/ethnicity, education, BMI, smoking status, self-reported health status, alcohol consumption, and comorbidities. Model 2 includes Model 1 and additionally adjusts for physical functioning. Comorbidities is defined as the sum of the following chronic conditions present at or before accelerometer wear: cancer, cardiovascular disease, cerebrovascular disease, chronic obstructive pulmonary disease, cognitive impairment, depression, diabetes, frequent falls, and osteoarthritis. BMI = body mass index; OPACH = Objective Physical Activity and Cardiovascular Health; ST = sedentary time; Q = quartile.
p values from Cox multivariable regression models using continuous ST.
Association between light PA and MVPA with Mortality by GRS Categories
Inverse associations between PA and mortality followed a similar pattern after stratification by GRS tertiles (Table 5; shown in Figure 2). Among women in the high GRS group, the highest quartile of light PA was associated with 56% (HR = 0.44, 95% CI [0.31, 0.63]) lower risk of mortality compared to the lowest quartile, after adjustment for accelerometer wear time, age, race/ethnicity, and the first five PCs. This association was slightly attenuated but remained statistically significant after further adjustment for education, BMI, smoking status, self-reported health status, alcohol consumption, comorbidities, and physical functioning (HR = 0.55, 95% CI [0.38, 0.80]). In the high GRS group, the highest quartile of MVPA was associated with 57% (HR = 0.43; 95% CI [0.28, 0.65]) lower risk of mortality relative to the lowest quartile in fully adjusted models. In the low GRS group, the highest vs. the lowest quartile of MVPA was associated with 51% (HR = 0.49; 95% CI [0.30, 0.77]) lower mortality risk in fully adjusted models. Interactions between continuous light PA (pinteraction = .66) and MVPA (pinteraction = .24) with the GRS were not statistically significant.
Table 5.
Hazard ratios and 95% confidence intervals relating PA and ST with mortality stratified by GRS for longevity: OPACH women enrolled in 2012–2014 and followed through February 28, 2020 (N=5,446)
| Tertiles of GRS for longevitya | p interaction b | ||||
|---|---|---|---|---|---|
| Low (n = 1,681) | Medium (n = 1,804) | High (n = 1,961) | |||
| Mortality events, n (rate per 1,000 person-years) | 295 (28.6) | 381 (34.6) | 346 (28.8) | ||
| PAc | |||||
| Light | 0.66 | ||||
| Model 1 | Q1 | 1.00 [ref.] | 1.00 [ref.] | 1.00 [ref.] | |
| Q2 | 0.80 [0.59, 1.08] | 0.60 [0.47, 0.78] | 0.71 [0.54, 0.94] | ||
| Q3 | 0.76 [0.55, 1.06] | 0.49 [0.36, 0.66] | 0.74 [0.55, 0.99] | ||
| Q4 | 0.57 [0.40, 0.83] | 0.53 [0.39, 0.72] | 0.44 [0.31, 0.63] | ||
| Model 2 | Q1 | 1.00 [ref.] | 1.00 [ref.] | 1.00 [ref.] | |
| Q2 | 0.84 [0.61, 1.14] | 0.65 [0.50, 0.86] | 0.74 [0.56, 0.98] | ||
| Q3 | 0.82 [0.58, 1.15] | 0.56 [0.41, 0.77] | 0.91 [0.67, 1.24] | ||
| Q4 | 0.59 [0.40, 0.87] | 0.58 [0.41, 0.81] | 0.55 [0.38, 0.80] | ||
| Moderate-to-vigorous | 0.24 | ||||
| Model 1 | Q1 | 1.00 [ref.] | 1.00 [ref.] | 1.00 [ref.] | |
| Q2 | 0.83 [0.62, 1.10] | 0.64 [0.50, 0.82] | 0.49 [0.38, 0.65] | ||
| Q3 | 0.59 [0.42, 0.83] | 0.43 [0.31, 0.58] | 0.40 [0.29, 0.55] | ||
| Q4 | 0.39 [0.25, 0.60] | 0.34 [0.24, 0.49] | 0.28 [0.19, 0.41] | ||
| Model 2 | Q1 | 1.00 [ref.] | 1.00 [ref.] | 1.00 [ref.] | |
| Q2 | 0.93 [0.69, 1.25] | 0.78 [0.60, 1.01] | 0.61 [0.46, 0.81] | ||
| Q3 | 0.71 [0.50, 1.02] | 0.55 [0.40, 0.77] | 0.56 [0.40, 0.77] | ||
| Q4 | 0.49 [0.30, 0.77] | 0.47 [0.32, 0.69] | 0.43 [0.28, 0.65] | ||
| Total STd | 0.64 | ||||
| Model 1 | Q1 | 1.00 [ref.] | 1.00 [ref.] | 1.00 [ref.] | |
| Q2 | 0.90 [0.62, 1.31] | 1.21 [0.86, 1.69] | 1.73 [1.21, 2.49] | ||
| Q3 | 1.58 [1.12, 2.23] | 1.81 [1.29, 2.53] | 2.27 [1.59, 3.23] | ||
| Q4 | 1.83 [1.27, 2.65] | 2.28 [1.62, 3.21] | 2.91 [2.01, 4.21] | ||
| Model 2 | Q1 | 1.00 [ref.] | 1.00 [ref.] | 1.00 [ref.] | |
| Q2 | 0.86 [0.59, 1.26] | 1.17 [0.83, 1.66] | 1.46 [1.01, 2.11] | ||
| Q3 | 1.54 [1.07, 2.22] | 1.58 [1.11, 2.23] | 1.74 [1.21, 2.50] | ||
| Q4 | 1.72 [1.14, 2.60] | 1.81 [1.25, 2.63] | 1.99 [1.34, 2.95] | ||
Note. Measures of effect from multivariable Cox proportional hazards regression models. p for trend for light PA, moderate-to-vigorous PA, or ST for all 18 models < .01. Model 1 adjusts for accelerometer wear time, age, race/ethnicity, and the first five principal components to control for population stratification. Model 2 includes Model 1 and additionally adjusts for education, BMI, smoking status, self-reported health status, alcohol consumption, comorbidities, and physical functioning. Comorbidities is defined as the sum of the following chronic conditions present at or before accelerometer wear: cancer, cardiovascular disease, cerebrovascular disease, chronic obstructive pulmonary disease, cognitive impairment, depression, diabetes, frequent falls, and osteoarthritis. BMI = body mass index; GRS = genetic risk score; PA = physical activity; OPACH = Objective Physical Activity and Cardiovascular Health; ST = sedentary time; Q = quartile.
Higher GRS is indicative of higher genetic predisposition for longevity.
pinteraction corresponds to the Wald test statistic comparing the model 2 with and without the interaction continuous PA/ST by GRS terms.
Light PA (min/day) Q are defined as follows: Q1 ≤ 233.96; Q2 = 233.97 to 287.13; Q3 = 287.14 to 337.94; Q4 ≥ 337.95. Moderate-to-vigorous PA (min/day) Q are defined as follows: Q1 ≤ 25.17; Q2 = 25.18 to 44.33.; Q3 = 44.34 to 69.75; Q4 ≥ 69.76.
ST (min/day) Q are defined as follows: Q1 ≤ 489.04; Q2 = 489.05 to 555.85; Q3 = 555.86 to 620.50; Q4 ≥ 620.51.
Figure 2 —
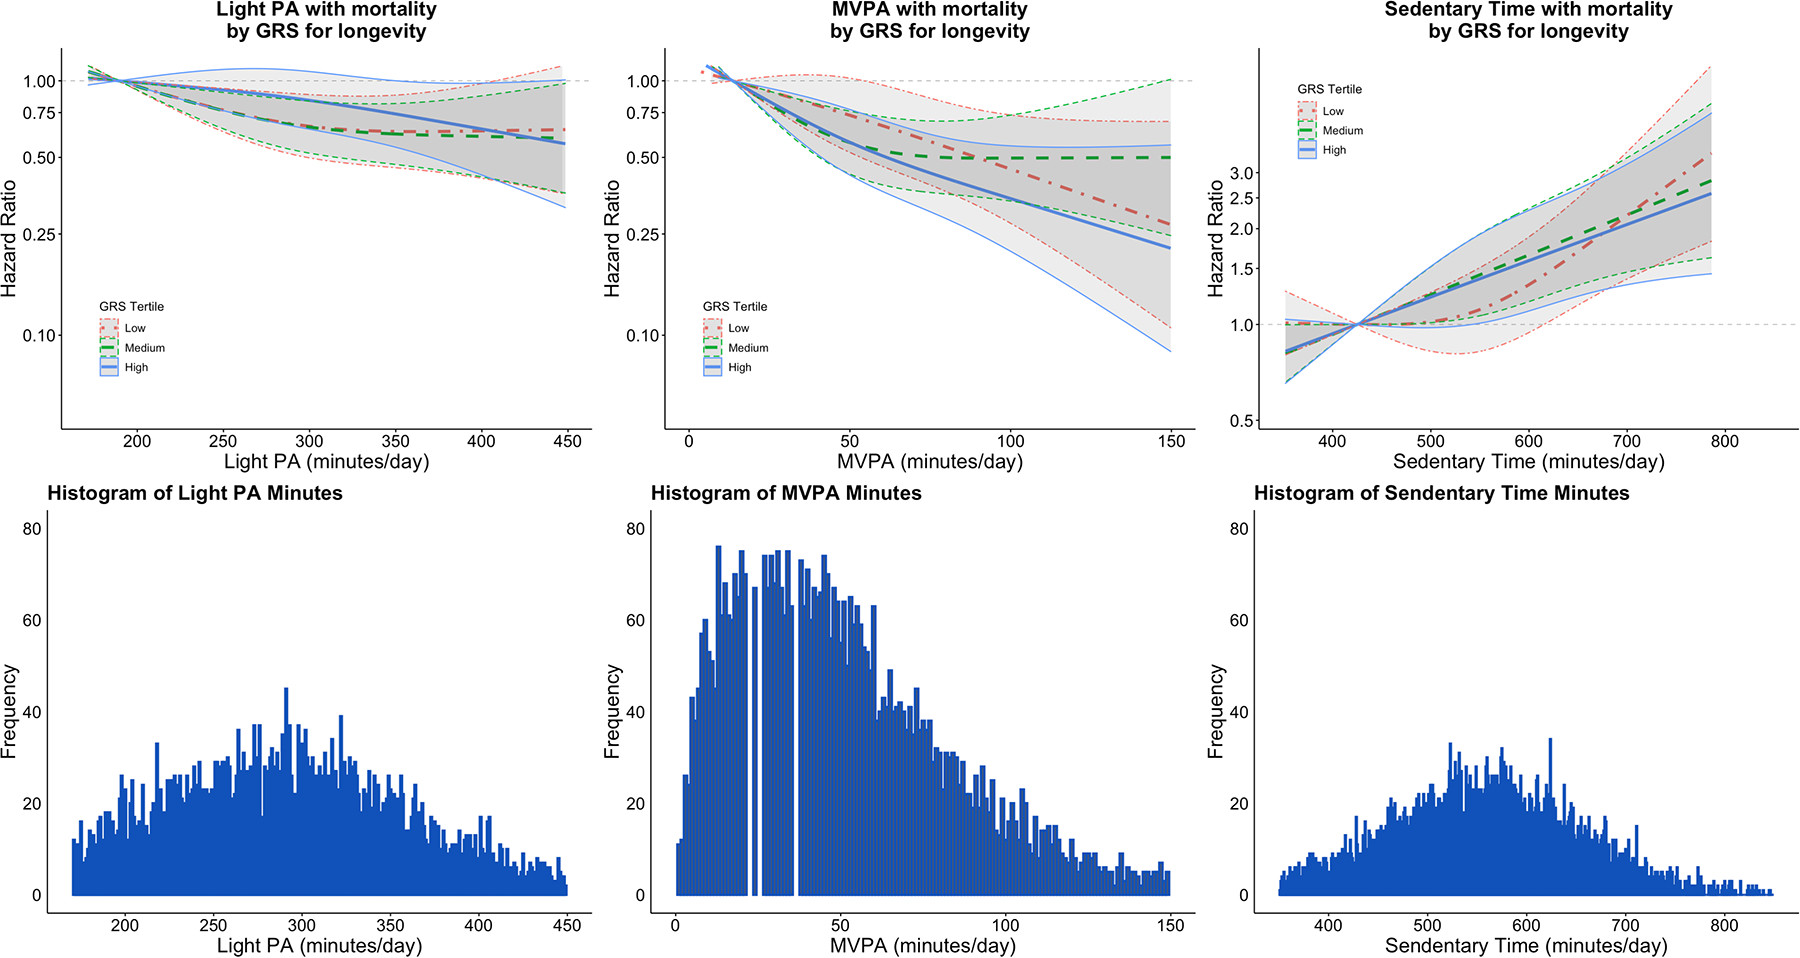
Continuous dose–response association of PA and ST with mortality stratified by GRS for longevity tertiles for longevity among OPACH women enrolled in 2012–2014 and followed through February 28, 2020 (N = 5,446). Red and dot dashed, green and dashed, and blue and solid lines indicate low, medium, and high GRS tertiles, respectively. Dose–response curves are derived from multivariable Cox proportional hazards regression models for each GRS for longevity group (low/medium/high). The 10th percentile of each behavior is treated as the reference category for each GRS subgroup. Dose–response plots are trimmed at the first and 99th percentile. All models are adjusted for the first five principal components to control for population stratification, accelerometer wear time, age, race/ethnicity, education, BMI, smoking status, self-reported health status, alcohol consumption, comorbidities, and physical functioning. Comorbidities are defined as the sum of the following chronic conditions present at or before accelerometer wear: cancer, cardiovascular disease, cerebrovascular disease, chronic obstructive pulmonary disease, cognitive impairment, depression, diabetes, frequent falls, and osteoarthritis. n missing: education = 37 (0.7%); BMI = 346 (6.4%); self-reported health status = n (0.3%); physical functioning = 60 (1.1%); alcohol consumption = 486 (8.9%); and smoking status = 494 (9.1%). OPACH = Objective Physical Activity and Cardiovascular Health; PA = physical activity; ST = sedentary time; GRS = genetic risk score; BMI = body mass index; MVPA = moderate to vigorous PA; HR = hazard ratios.
Association between ST and Mortality by GRS Categories
Associations were similar across GRS categories (Table 5, shown in Figure 2). Among women in the high GRS group, the highest total ST quartile had 2.91 (95% CI [2.01, 4.21]) times higher risk of mortality compared to the lowest quartile after adjustment for accelerometer wear time, age, race/ethnicity, and the first five PCs. This association was attenuated but remained statistically significant in fully adjusted models (HR = 1.99, 95% CI [1.34, 2.95]). The interaction between continuous ST and the GRS was not statistically significant (pinteraction = .64).
Sensitivity Analyses
Women in the high GRS group had the highest survival probabilities in WHI and OPACH (Supplementary Figures 1–2). After excluding deaths within the first 2 years of follow-up, HRs for associations of light PA, MVPA, and ST with mortality across all GRS categories were slightly attenuated (Supplementary Table 2). Analyses repeated after restriction to White women yielded similar results (Supplementary Table 3). Interactions of PA/ST with APOE ε2 or ε4 were not statistically significant (Supplementary Table 4).
Discussion
In this prospective study of 5,446 older women, higher accelerometer-measured light PA and MVPA were associated with lower risk of mortality, and higher ST was associated with higher risk of mortality, during an average follow-up of 6.1 years. Further, we found that these associations persisted irrespective of one’s genetic predisposition for longevity. These findings extend previous OPACH studies with shorter follow-up (LaMonte et al., 2018) and provide strong support for the importance of engaging in PA to lower risk of mortality among older women.
The current findings suggest that there was little, if any, variation in the association of accelerometer-measured PA and ST with mortality according to a longevity GRS. Because survival into advanced age was an inherent characteristic of women who enrolled in OPACH and completed accelerometer assessments of free-living PA and ST, it is plausible that genetic survival advantage may be a key factor underlying mortality risks attributed to greater PA or ST (Dato et al., 2017; Rankinen & Bouchard, 2007). However, results of the present study indicate that a GRS, based on three selected SNPs, did not modify the strong multivariable adjusted associations with all-cause mortality for either PA or ST among women at older age.
Our results align with literature showing that greater light PA and MVPA are associated with lower risk of mortality among middle-aged and older adults (Ekelund et al., 2019), including older women (LaMonte et al., 2018). In a meta-analysis of 36,383 participants from 8 studies (Ekelund et al., 2019), accelerometer-measured light PA and MPVA were associated with 62% and 48% lower risk of mortality at the highest (vs. the lowest) quartiles of activity, respectively. Additionally, our results align with evidence showing that the highest (vs. the lowest) quartiles of ST were associated with greater risk of mortality in middle-aged and older adults (Diaz et al., 2017; Ekelund et al., 2019). Given the aging of the US adult population (Medina et al., 2020) and longer time spent in lower-intensity activities (LaMonte et al., 2018; Matthews et al., 2008), these results support recommendations that older women should engage in PA, regardless of intensity, to reduce their mortality risk.
Because genetic factors likely contribute both to longevity (Deelen et al., 2019) and PA habits (Lin et al., 2017), it is possible that genes modify associations between PA and longevity (Rankinen & Bouchard, 2007). However, we did not find statistically significant interactions between PA or ST with the GRS for longevity, possibly due to inadequate power or unaccounted rare longevity-influencing variants (Broer et al., 2015). Several prior studies have examined gene by environment (GxE) interactions in the relationships between physical activity and adverse health outcomes. For example, in GxE studies of PA and cognition, others found that relations between PA and cognitive decline (Stringa et al., 2020) and Alzheimer’s disease (Luck et al., 2014) did not vary by APOE ε4 status. Another study found lifestyle factors (e.g., cigarette smoking, regular exercise, etc.) in relation to lifespan did not vary by a BMI GRS (Sakaue et al., 2020). In another study, genes for physical fitness did not modify associations between PA and coronary heart disease risk (Chomistek et al., 2013). These findings taken together with our results highlight the importance of engaging in PA and positive lifestyle behaviors to reduce risk of disease and premature mortality even among those who may have genetic traits that may be associated with certain health outcomes.
This study has some limitations. In this study, total sedentary time is classified based on a calibrated cutpoint that captures all waking time spent below the threshold of light physical activity. Accelerometers may not be sensitive to posture, thus potentially misclassifying standing still as sedentary time (Lyden et al., 2012). More sophisticated methods of processing accelerometer data are emerging that should improve accurate classification of sedentary time in the future (Greenwood-Hickman et al., 2021). Such methods are likely to amplify the associations seen in the present study. Additionally, our findings may have been biased by reverse causation due to changes in PA that possibly influenced factors underlying mortality. However, excluding women who died within the first 2 years of follow-up yielded similar results. The OPACH cohort included 33% Black women and 17% Hispanic women; however, we were not powered to examine GRS by PA/ST interactions within strata of race/ethnicity. Moreover, our GRS was derived from European populations and may not apply to non-European populations. Future GWAS are needed to identify longevity-associated SNPs specific to diverse populations (Sirugo et al., 2019). Notably, previous OPACH reports have shown similar associations between PA and ST behaviors and mortality (LaMonte et al., 2018), incident cardiovascular disease (Bellettiere, Lamonte, et al., 2019; LaCroix et al., 2019) and diabetes (Bellettiere, Healy, et al., 2019) in white, Black and Hispanic women. Because our study population included older women in WHI, generalizability of these results to men and other populations are unknown and should be investigated. Future studies should also evaluate sex differences, as other studies have reported sex differences in genetic associations with longevity (Zeng et al., 2018).
Our study has several strengths. Data were obtained from women in the OPACH study, a large, diverse, and well-characterized cohort of older women across the United States with long-term follow-up. The longitudinal dataset allowed for sufficient sample size to assess associations across three GRS for longevity groups. Additionally, PA and ST were measured objectively using accelerometry and cutpoints specific to older women (Evenson, Wen, Herring, et al., 2015), allowing us to minimize recall bias and measurement error, which often occur with self-reported PA and ST (Sylvia et al., 2014), especially among older adults (Evenson, Wen, Metzger, et al., 2015).
In conclusion, among older women, higher accelerometer-measured light PA and MVPA were associated with lower risk of mortality, and higher accelerometer-measured ST was associated with higher risk of mortality during an average follow-up of 6.1 years. Findings were consistent across categories of a GRS for longevity. These results offer strong support that PA at older ages is associated with reduced risk of death. The complexity of longevity warrants further GxE interaction studies to improve our understanding of longevity, cause-specific mortality, and the intersecting roles of genes and lifestyle behaviors in achieving a long and healthy life.
Supplementary Material
Acknowledgements
The OPACH Study is funded by the National Heart, Lung, and Blood Institute, National Institutes of Health, U.S. Department of Health and Human Services through RO1 HL105065 (PI: A.Z.L.). Funding also came from 2 grants supported by the National Institute on Aging: A program project (P01 AG052352 to A.Z.L.) and a T32 Predoctoral Training Fellowship (T32 AG058529 to A.I.B.P.). The WHI program is funded by the National Heart, Lung, and Blood Institute, National Institutes of Health, U.S. Department of Health and Human Services through 75N92021D00001, 75N92021D00002, 75N92021D00003, 75N92021D00004, and 75N92021D00005. All funding agencies had no role in the design of the study and collection, analysis, or interpretation of the data and no role in writing the manuscript. The authors would like to acknowledge the WHI participants and staff for their participation. The authors would also like to acknowledge the WHI investigators in the short list below. The full list can be found at the following site: https://s3-us-west-2.amazonaws.com/www-whi-org/wp-content/uploads/WHI-Investigator-Long-List.pdf.
The Women’s Health Initiative Investigators: Program Office: (National Heart, Lung, and Blood Institute, Bethesda, Maryland) Jacques Rossouw, Shari Ludlam, Joan McGowan, Leslie Ford, and Nancy Geller. Clinical Coordinating Center: (Fred Hutchinson Cancer Research Center, Seattle, WA) Garnet Anderson, Ross Prentice, Andrea LaCroix, and Charles Kooperberg. Investigators and Academic Centers: (Brigham and Women’s Hospital, Harvard Medical School, Boston, MA) JoAnn E. Manson; (MedStar Health Research Institute/Howard University, Washington, DC) Barbara V. Howard; (Stanford Prevention Research Center, Stanford, CA) Marcia L. Stefanick; (The Ohio State University, Columbus, OH) Rebecca Jackson; (University of Arizona, Tucson/Phoenix, AZ) Cynthia A. Thomson; (University at Buffalo, Buffalo, NY) Jean Wactawski-Wende; (University of Florida, Gainesville/Jacksonville, FL) Marian Limacher; (University of Iowa, Iowa City/Davenport, IA) Jennifer Robinson; (University of Pittsburgh, Pittsburgh, PA) Lewis Kuller; (Wake Forest University School of Medicine, Winston-Salem, NC) Sally Shumaker; (University of Nevada, Reno, NV) Robert Brunner. Women’s Health Initiative Memory Study: (Wake Forest University School of Medicine, Winston-Salem, NC) Mark Espeland
References
- Almeida OP, Khan KM, Hankey GJ, Yeap BB, Golledge J, & Flicker L (2014). 150 minutes of vigorous physical activity per week predicts survival and successful ageing: a population-based 11-year longitudinal study of 12 201 older Australian men. British Journal of Sports Medicine, 48(3), 220–225. 10.1136/bjsports-2013-092814 [DOI] [PubMed] [Google Scholar]
- Anderson GL, Manson J, Wallace R, Lund B, Hall D, Davis S, Shumaker S, Wang CY, Stein E, & Prentice RL (2003). Implementation of the Women’s Health Initiative study design. Annals of Epidemiology, 13(9 SUPPL.). 10.1016/S1047-2797(03)00043-7 [DOI] [PubMed] [Google Scholar]
- Bellettiere J, Healy GN, LaMonte MJ, Kerr J, Evenson KR, Rillamas-Sun E, Di C, Buchner DM, Hovell MF, & LaCroix AZ (2019). Sedentary behavior and prevalent diabetes in 6,166 older women: the objective physical activity and cardiovascular health study. Journals of Gerontology - Series A Biological Sciences and Medical Sciences, 74(3), 387–395. 10.1093/gerona/gly101 [DOI] [PMC free article] [PubMed] [Google Scholar]
- Bellettiere J, Lamonte MJ, Evenson KR, Rillamas-Sun E, Kerr J, Lee IM, Di C, Rosenberg DE, Stefanick ML, Buchner DM, Hovell MF, & Lacroix AZ (2019). Sedentary behavior and cardiovascular disease in older women: the OPACH study. Circulation, 139(8), 1036–1046. 10.1161/CIRCULATIONAHA.118.035312 [DOI] [PMC free article] [PubMed] [Google Scholar]
- Broer L, Buchman AS, Deelen J, Evans DS, Faul JD, Lunetta KL, Sebastiani P, Smith JA, Smith AV, Tanaka T, Yu L, Arnold AM, Aspelund T, Benjamin EJ, De Jager PL, Eirkisdottir G, Evans DA, Garcia ME, Hofman A, … Murabito JM (2015). GWAS of longevity in CHARGE Consortium confirms APOE and FOXO3 candidacy. The Journals of Gerontology: Series A, 70(1), 110–118. 10.1093/gerona/glu166 [DOI] [PMC free article] [PubMed] [Google Scholar]
- Choi L, Liu Z, Matthews CE, & Buchowski MS (2011). Validation of accelerometer wear and nonwear time classification algorithm. Medicine and Science in Sports and Exercise, 43(2), 357–364. 10.1249/MSS.0b013e3181ed61a3 [DOI] [PMC free article] [PubMed] [Google Scholar]
- Chomistek AK, Chasman DI, Cook NR, Rimm EB, & Lee IM (2013). Physical activity, genes for physical fitness, and risk of coronary heart disease. Medicine and Science in Sports and Exercise, 45(4), 691–697. 10.1249/MSS.0B013E3182784E9F [DOI] [PMC free article] [PubMed] [Google Scholar]
- Curb JD, Mctiernan A, Heckbert SR, Kooperberg C, Stanford J, Nevitt M, Johnson KC, Proulx-Burns L, Pastore L, Criqui M, & Daugherty S (2003). Outcomes ascertainment and adjudication methods in the Women’s Health Initiative. Annals of Epidemiology, 13(9 SUPPL.). 10.1016/S1047-2797(03)00048-6 [DOI] [PubMed] [Google Scholar]
- Dato S, Rose G, Crocco P, Monti D, Garagnani P, Franceschi C, & Passarino G (2017). The genetics of human longevity: an intricacy of genes, environment, culture and microbiome. In Mechanisms of Ageing and Development (Vol. 165, pp. 147–155). Elsevier Ireland Ltd. 10.1016/j.mad.2017.03.011 [DOI] [PubMed] [Google Scholar]
- Deelen J, Evans DS, Arking DE, Tesi N, Nygaard M, Liu X, Wojczynski MK, Biggs ML, van der Spek A, Atzmon G, Ware EB, Sarnowski C, Smith AV, Seppälä I, Cordell HJ, Dose J, Amin N, Arnold AM, Ayers KL, … Murabito JM (2019). A meta-analysis of genome-wide association studies identifies multiple longevity genes. Nature Communications, 10(1), 1–14. 10.1038/s41467-019-11558-2 [DOI] [PMC free article] [PubMed] [Google Scholar]
- Diaz KM, Howard VJ, Hutto B, Colabianchi N, Vena JE, Safford MM, Blair SN, & Hooker SP (2017). Patterns of sedentary behavior and mortality in U.S. middle-aged and older adults. Annals of Internal Medicine, 167(7), 465. 10.7326/M17-0212 [DOI] [PMC free article] [PubMed] [Google Scholar]
- Ekelund U, Tarp J, Steene-Johannessen J, Hansen BH, Jefferis B, Fagerland MW, Whincup P, Diaz KM, Hooker SP, Chernofsky A, Larson MG, Spartano N, Vasan RS, Dohrn IM, Hagströmer M, Edwardson C, Yates T, Shiroma E, Anderssen SA, & Lee IM (2019). Dose-response associations between accelerometry measured physical activity and sedentary time and all cause mortality: systematic review and harmonised meta-analysis. The BMJ, 366. 10.1136/bmj.l4570 [DOI] [PMC free article] [PubMed] [Google Scholar]
- Evenson KR, Wen F, Herring AH, Di C, LaMonte MJ, Tinker LF, Lee IM, Rillamas-Sun E, LaCroix AZ, & Buchner DM (2015). Calibrating physical activity intensity for hip-worn accelerometry in women age 60 to 91years: the Women’s Health Initiative OPACH Calibration Study. Preventive Medicine Reports, 2, 750–756. 10.1016/j.pmedr.2015.08.021 [DOI] [PMC free article] [PubMed] [Google Scholar]
- Evenson KR, Wen F, Metzger JS, & Herring AH (2015). Physical activity and sedentary behavior patterns using accelerometry from a national sample of united states adults. International Journal of Behavioral Nutrition and Physical Activity, 12(1). 10.1186/s12966-015-0183-7 [DOI] [PMC free article] [PubMed] [Google Scholar]
- Greenwood-Hickman MA, Nakandala S, Jankowska MM, Rosenberg DE, Tuz-Zahra F, Bellettiere J, Carlson J, Hibbing PR, Zou J, Lacroix AZ, Kumar A, & Natarajan L (2021). The CNN Hip Accelerometer Posture (CHAP) method for classifying sitting patterns from hip accelerometers: a validation study. Medicine and Science in Sports and Exercise, 53(11), 2445–2454. 10.1249/MSS.0000000000002705 [DOI] [PMC free article] [PubMed] [Google Scholar]
- Harrell FE (2015). Regression modeling strategies: with applications to linear models, logistic regression, and survival analysis (2nd ed.). Springer. 10.1007/978-3-319-19425-7 [DOI] [Google Scholar]
- Harrell FE (2020). rms: regression modeling strategies. https://hbiostat.org/R/rms/
- Hays RD, & Morales LS (2001). The RAND-36 measure of health-related quality of life. Annals of Medicine, 33(5), 350–357. 10.3109/07853890109002089 [DOI] [PubMed] [Google Scholar]
- Hjelmborg JB, Iachine I, Skytthe A, Vaupel JW, McGue M, Koskenvuo M, Kaprio J, Pedersen NL, & Christensen K (2006). Genetic influence on human lifespan and longevity. Human Genetics, 119(3), 312–321. 10.1007/s00439-006-0144-y [DOI] [PubMed] [Google Scholar]
- Hupin D, Roche F, Gremeaux V, Chatard JC, Oriol M, Gaspoz JM, Barthélémy JC, & Edouard P (2015). Even a low-dose of moderate-to-vigorous physical activity reduces mortality by 22% in adults aged ≥60 years: a systematic review and meta-analysis. In British Journal of Sports Medicine (Vol. 49, Issue 19, pp. 1262–1267). BMJ Publishing Group. 10.1136/bjsports-2014-094306 [DOI] [PubMed] [Google Scholar]
- LaCroix AZ, Bellettiere J, Rillamas-Sun E, Di C, Evenson KR, Lewis CE, Buchner DM, Stefanick ML, Lee IM, Rosenberg DE, & LaMonte MJ (2019). Association of light physical activity measured by accelerometry and incidence of coronary heart disease and cardiovascular disease in older women. JAMA Network Open, 2(3), e190419. 10.1001/jamanetworkopen.2019.0419 [DOI] [PMC free article] [PubMed] [Google Scholar]
- LaCroix AZ, Rillamas-Sun E, Buchner D, Evenson KR, Di C, Lee IM, Marshall S, LaMonte MJ, Hunt J, Tinker LF, Stefanick M, Lewis CE, Bellettiere J, & Herring AH (2017). The Objective Physical Activity and Cardiovascular Disease Health in Older Women (OPACH) Study. BMC Public Health, 17(1), 1–12. 10.1186/s12889-017-4065-6 [DOI] [PMC free article] [PubMed] [Google Scholar]
- LaMonte MJ, Buchner DM, Rillamas-Sun E, Di C, Evenson KR, Bellettiere J, Lewis CE, Lee I-M, Tinker LF, Seguin R, Zaslovsky O, Eaton CB, Stefanick ML, & LaCroix AZ (2018). Accelerometer-measured physical activity and mortality in women aged 63 to 99. Journal of the American Geriatrics Society, 66(5), 886–894. 10.1111/jgs.15201 [DOI] [PMC free article] [PubMed] [Google Scholar]
- Lee IM, Shiroma EJ, Evenson KR, Kamada M, LaCroix AZ, & Buring JE (2018). Accelerometer-measured physical activity and sedentary behavior in relation to all-cause mortality: the Women’s Health Study. Circulation, 137(2), 203–205. 10.1161/CIRCULATIONAHA.117.031300 [DOI] [PMC free article] [PubMed] [Google Scholar]
- Lin X, Eaton CB, Manson JAE, & Liu S (2017). The genetics of physical activity. Current Cardiology Reports, 19(12), 1–10. 10.1007/s11886-017-0938-7 [DOI] [PubMed] [Google Scholar]
- Luck T, Riedel-Heller SG, Luppa M, Wiese B, Köhler M, Jessen F, Bickel H, Weyerer S, Pentzek M, König HH, Prokein J, Ernst A, Wagner M, Mösch E, Werle J, Fuchs A, Brettschneider C, Scherer M, Maier W, … Van Den Bussche H (2014). Apolipoprotein e epsilon 4 genotype and a physically active lifestyle in late life: analysis of gene-environment interaction for the risk of dementia and Alzheimer’s disease dementia. Psychological Medicine, 44(6), 1319–1329. 10.1017/S0033291713001918 [DOI] [PubMed] [Google Scholar]
- Lyden K, Kozey Keadle SL, Staudenmayer JW, & Freedson PS (2012). Validity of two wearable monitors to estimate breaks from sedentary time. Medicine and Science in Sports and Exercise, 44(11), 2243–2252. 10.1249/MSS.0b013e318260c477 [DOI] [PMC free article] [PubMed] [Google Scholar]
- Mahley RW, & Rall SC (2000). Apolipoprotein E: far more than a lipid transport protein. Annual Review of Genomics and Human Genetics, 1(2000), 507–537. 10.1146/annurev.genom.1.1.507 [DOI] [PubMed] [Google Scholar]
- Matthews CE, Chen KY, Freedson PS, Buchowski MS, Beech BM, Pate RR, & Troiano RP (2008). Amount of time spent in sedentary behaviors in the United States, 2003–2004. American Journal of Epidemiology, 167(7), 875–881. 10.1093/aje/kwm390 [DOI] [PMC free article] [PubMed] [Google Scholar]
- Medina LD, Sabo S, & Vespa J (2020). Living Longer: Historical and Projected Life Expectancy in the United States, 1960 to 2060. https://www.census.gov/content/dam/Census/library/publications/2020/demo/p25-1145.pdf
- Migueles JH, Cadenas-Sanchez C, Ekelund U, Delisle Nyström C, Mora-Gonzalez J, Löf M, Labayen I, Ruiz JR, & Ortega FB (2017). Accelerometer data collection and processing criteria to assess physical activity and other outcomes: a systematic review and practical considerations. In Sports Medicine (Vol. 47, Issue 9, pp. 1821–1845). Springer International Publishing. 10.1007/s40279-017-0716-0 [DOI] [PMC free article] [PubMed] [Google Scholar]
- Mok A, Khaw KT, Luben R, Wareham N, & Brage S (2019). Physical activity trajectories and mortality: population based cohort study. The BMJ, 365. 10.1136/bmj.l2323 [DOI] [PMC free article] [PubMed] [Google Scholar]
- Oguma Y, Sesso HD, Paffenbarger RS, & Lee IM (2002). Physical activity and all cause mortality in women: a review of the evidence. In British Journal of Sports Medicine (Vol. 36, Issue 3, pp. 162–172). British Association of Sport and Excercise Medicine. 10.1136/bjsm.36.3.162 [DOI] [PMC free article] [PubMed] [Google Scholar]
- Pilling LC, Kuo CL, Sicinski K, Tamosauskaite J, Kuchel GA, Harries LW, Herd P, Wallace R, Ferrucci L, & Melzer D (2017). Human longevity: 25 genetic loci associated in 389,166 UK Biobank participants. Aging, 9(12), 2504–2520. 10.18632/aging.101334 [DOI] [PMC free article] [PubMed] [Google Scholar]
- Price AL, Patterson NJ, Plenge RM, Weinblatt ME, Shadick NA, & Reich D (2006). Principal components analysis corrects for stratification in genome-wide association studies. Nature Genetics, 38(8), 904–909. 10.1038/ng1847 [DOI] [PubMed] [Google Scholar]
- R Core Team. (2020). R: A language and environment for statistical computing. R Foundation for Statistical Computing. https://www.r-project.org/ [Google Scholar]
- Rankinen T, & Bouchard C (2007). Invited commentary: physical activity, mortality, and genetics. American Journal of Epidemiology, 166(3), 260–262. 10.1093/aje/kwm130 [DOI] [PubMed] [Google Scholar]
- Rillamas-Sun E, LaCroix AZ, Bell CL, Ryckman K, Ockene JK, & Wallace RB (2016). The impact of multimorbidity and coronary disease comorbidity on physical function in women aged 80 years and older: the Women’s Health Initiative. The Journals of Gerontology Series A: Biological Sciences and Medical Sciences, 71(Suppl 1), S54–S61. 10.1093/gerona/glv059 [DOI] [PMC free article] [PubMed] [Google Scholar]
- Sakaue S, Kanai M, Karjalainen J, Akiyama M, Kurki M, Matoba N, Takahashi A, Hirata M, Kubo M, Matsuda K, Murakami Y, Daly MJ, Kamatani Y, & Okada Y (2020). Trans-biobank analysis with 676,000 individuals elucidates the association of polygenic risk scores of complex traits with human lifespan. Nature Medicine, 26(4), 542–548. 10.1038/s41591-020-0785-8 [DOI] [PubMed] [Google Scholar]
- Shadyab AH, & LaCroix AZ (2015). Genetic factors associated with longevity: a review of recent findings. In Ageing Research Reviews (Vol. 19, pp. 1–7). Elsevier Ireland Ltd. 10.1016/j.arr.2014.10.005 [DOI] [PubMed] [Google Scholar]
- Sirugo G, Williams SM, & Tishkoff SA (2019). The missing diversity in human genetic studies. In Cell (Vol. 177, Issue 1, pp. 26–31). Cell Press. 10.1016/j.cell.2019.02.048 [DOI] [PMC free article] [PubMed] [Google Scholar]
- Stringa N, van Schoor NM, Milaneschi Y, Ikram MA, Del Panta V, Koolhaas CM, Voortman T, Bandinelli S, Wolters FJ, & Huisman M (2020). Physical activity as moderator of the association between APOE and cognitive decline in older adults: results from three longitudinal cohort studies. The Journals of Gerontology: Series A, 75(10), 1880–1886. 10.1093/gerona/glaa054 [DOI] [PMC free article] [PubMed] [Google Scholar]
- Sylvia LG, Bernstein EE, Hubbard JL, Keating L, & Anderson EJ (2014). Practical guide to measuring physical activity. Journal of the Academy of Nutrition and Dietetics, 114(2), 199–208. 10.1016/j.jand.2013.09.018 [DOI] [PMC free article] [PubMed] [Google Scholar]
- Therneau T, Crowson C, & Atkinson E (2021). Using time dependent covariates and time dependent coefficients in the cox model. https://cran.r-project.org/web/packages/survival/vignettes/timedep.pdf
- U.S. Department of Health and Human Services. (2018). Physical Activity Guidelines for Americans, 2nd edition. https://health.gov/sites/default/files/2019-09/Physical_Activity_Guidelines_2nd_edition.pdf#page=68
- van Buuren S, & Groothuis-Oudshoorn K (2011). mice: multivariate imputation by chained equations in R. Journal of Statistical Software, 45(3), 1–67. [Google Scholar]
- Zeng Y, Nie C, Min J, Chen H, Liu X, Ye R, Chen Z, Bai C, Xie E, Yin Z, Lv Y, Lu J, Li J, Ni T, Bolund L, Land KC, Yashin A, O’Rand AM, Sun L, … Vaupel J (2018). Sex differences in genetic associations with longevity. JAMA Network Open, 1(4), e181670. 10.1001/jamanetworkopen.2018.1670 [DOI] [PMC free article] [PubMed] [Google Scholar]
Associated Data
This section collects any data citations, data availability statements, or supplementary materials included in this article.