

Summary
The human gut virome and its early life development are poorly understood. Prior studies have captured single-point assessments with the evolution of the infant virome remaining largely unexplored. We performed viral metagenomic sequencing on stool samples collected longitudinally from a cohort of 53 infants from age 2 weeks to 3 years (80.7 billion reads), and from their mothers (9.8 billion reads) to examine and compare viromes. The asymptomatic infant virome consisted of bacteriophages, nonhuman dietary/environmental viruses, and human-host viruses, predominantly picornaviruses. In contrast, human-host viruses were largely absent from the maternal virome. Previously undescribed, sequence-divergent vertebrate viruses were detected in the maternal but not infant virome. As infants aged, the phage component evolved to resemble the maternal virome, but by age 3, the human-host component remained dissimilar from the maternal virome. Thus, early life virome development is determined predominantly by dietary, infectious, and environmental factors rather than direct maternal acquisition.
Keywords: infant gut virome, bacteriophages, metagenomic sequencing, maternal virome, microviruses, picornaviruses, principal component analysis, alpha diversity, beta diversity, SURPI, microbiome, parechovirus
Graphical abstract
Highlights
-
•
Stool virome analysis was performed on 53 infants from birth to age 3 and their mothers
-
•
Human-host viruses, particularly picornaviruses, are prevalent in the infant virome
-
•
Sequence-divergent viruses were detected in the maternal but not infant virome
-
•
Virome development in early life is not determined by direct maternal acquisition
Walters et al. examine the evolution of the infant virome in early life in comparison to the maternal virome. The infant virome remained dissimilar from the maternal virome to age 3, showing that the infant virome is not maternally acquired but is rather determined by dietary, infectious, and environmental factors.
Introduction
Within hours of delivery, infants are colonized by bacteria and viruses.1,2,3 A growing body of literature indicates that the structure and function of the microbiome early in life influences immunologic development and, potentially, clinical outcomes later in life.4,5 Although viral particles in the gut vastly outnumber bacteria, little is known about the infant gastrointestinal virome (bacteriophages, archaeal, and eukaryotic viruses), its variability, and its influence on growth and development in early childhood.
Several technical limitations have hampered virome description. In prior metagenomic analyses, a large proportion of viral sequences have not aligned to known reference genomes,6 likely due to high viral genome sequence diversity and/or poor representation of viruses such as bacteriophages (phages) in existing databases such as National Center for Biotechnology Information (NCBI)’s GenBank.7 RNA viruses have been poorly studied because RNA is less stable in samples collected primarily for DNA-based metagenomic studies, and RNA and/or DNA contamination from laboratory reagents can also interfere with virome analyses.8 Thus, RNA viruses remain under-sampled in most virome studies.9,10 To address these challenges, targeted viral enrichment methods using thousands of biotinylated probes to capture the diversity of the virome have been used,11 but these approaches have generally focused on enrichment of mammalian viruses and not phages. Improved bioinformatics methods for annotating sequences and analyzing metagenomic data, including protein prediction, de novo assembly of contiguous sequences (contigs), filtering to remove spurious alignments, and more accurate taxonomic classification algorithms, have also been developed.8,12,13
Most studies in infants that investigate the early development of the virome have included small sample sizes over short time frames (a few months to a year).2,3,14 These studies have identified the appearance of phages such as Siphoviridae, Inoviridae, Myoviridae, Podoviridae, and Microviridae, as well as the sporadic occurrence of eukaryotic viruses such as Adenoviridae, Astroviridae, Caliciviridae, Parvoviridae, Picornaviridae, and Polyomaviridae.2,8,15,16,17 Longer longitudinal investigations of the virome in healthy and diverse populations and comparative studies in children and adults can expand our knowledge of human-microbe interactions in childhood development. In addition, prior studies of infant and maternal viromes to date have focused on single time points, such as at birth3 and thus longitudinal comparative studies of the evolution of infant and maternal viromes are lacking.
In this study, we utilized metagenomic viral sequencing to characterize the gastrointestinal virome in longitudinally collected stools from an ethnically and socioeconomically diverse cohort of infants in California over the first 3 years of life. The availability of this cohort offers a unique opportunity to study the longitudinal progression of the infant virome in early childhood and to compare the viromes of mother-infant pairs.
Results
The study included 53 infants born between August 2011 and July 2015 (Table S1). Mothers were primarily Hispanic/LatinX (58.5%), and more than a quarter (26.4%) of mothers did not complete high school. The median household size was four people, with approximately 25% having no other children in the household. Of the 53 infants, 45% were female, and 98.1% (52/53) identified with a similar race and ethnicity as the mother. Two-thirds of infants were delivered vaginally; all but one had received at least some breast milk. Almost all infants (48/53; 90.6%) had at least one identified medical care visit for illness, and 60% of these were prescribed antibiotics at least once. The most common diagnoses at physician offices were upper respiratory infection (n = 252), “viral syndrome” or “fever, unspecified” (n = 99), rash including eczema (n = 94), otitis media (n = 69), and gastroenteritis (n = 55) (Table S2).
Infants provided a median of 9 stool samples over 3 years, starting from 2 to 3 months after birth and every 4 months after that until their third birthday (Table 1). Among those with medical care visits for illness, the mean time between the visit date and the next stool sampling date was 59 days. Mothers provided a median of 5 stool samples over approximately 15 months, starting in the third trimester (1–2 samples), and a paired sample alongside the infants in the first year.
Table 1.
Age and visit ID details for STORK subjects (mothers and infants)
| Variable | Visita | Median (Q1–Q3) [range] |
|---|---|---|
| Infants | – | – |
| Total number of samples used | – | 454 |
| Samples per infant | – | 9 (8–9) [5–10] |
| Age in months at each stool collection time point | B1 | 2.8 (1.7–3.2) [0.3–4.9] |
| B2 | 6.7 (5.7–7.1) [4.4–8.6] | |
| B3 | 10.7 (9.4–11.1) [7.8–13.3] | |
| B4 | 14.7 (13.5–16.7) [12.4–16.7] | |
| B5 | 18.6 (17.4–19.0) [16.5–24.3] | |
| B6 | 22.6 (21.5–23.1) [20–26.8] | |
| B7 | 26.6 (25.4–27.0) [24.1–29.2] | |
| B8 | 30.6 (29.2–31.0) [28.2–33.4] | |
| B9 | 34.5 (33.1–35.0) [ 32.1–37.9] | |
| For infants with illness visits, days from a visit to the next collection time point | – | 59 (27–89) [0–275] |
| Mothers | – | – |
| Total number of samples used | – | 232 |
| Samples per mother | – | 4 (4–5) [2–5] |
| Age in years at each stool collection time point | MTrim2 | 32.2 (27.7–36.2) [18.4–42.6] |
| MTrim3 | 32.9 (29.4–38.6) [18.7–42.8] | |
| MB1 | 34.1 (30.0–36.9) [19.1–43.1] | |
| MB2 | 34.7 (32.5–36.9) [25.8–42.7] | |
| MB3 | 35.2 (30.8–39.6) [21.7–43.8] |
Visits MTrim2 and MTrim3 occurred before delivery (maternal sampling only); B1–B9 occurred post-delivery (maternal sampling for infant’s first year of life only).
Viral metagenomic sequencing analysis of 454 stool samples from the infants yielded a total of 80.7 billion sequence reads, with an average of 177.8 million reads per sample (Table S3). Metagenomic sequence data were analyzed using the SURPI+ (sequence-based ultra-rapid pathogen identification) bioinformatics pipeline.13 The mean percentages of mapped viral, bacterial, human, and other (archaea, fungi, protists, or plants) preprocessed reads across all samples were 6.3%, 23.5%, 13.7%, and 23.5%, respectively. An average of 33.0% of reads did not map to any reference sequence in NCBI nucleotide (NT).
Analysis of 233 stool samples belonging to mothers yielded a total of 9.8 billion sequence reads, with an average of 42.4 million reads per sample (Table S4). The mean percentages of matched viral, bacterial, and human reads across all samples were 7.0%, 45.0%, and 10.0% of preprocessed reads, respectively. An average of 37.1% of reads did not map to any reference sequence in NCBI NT.
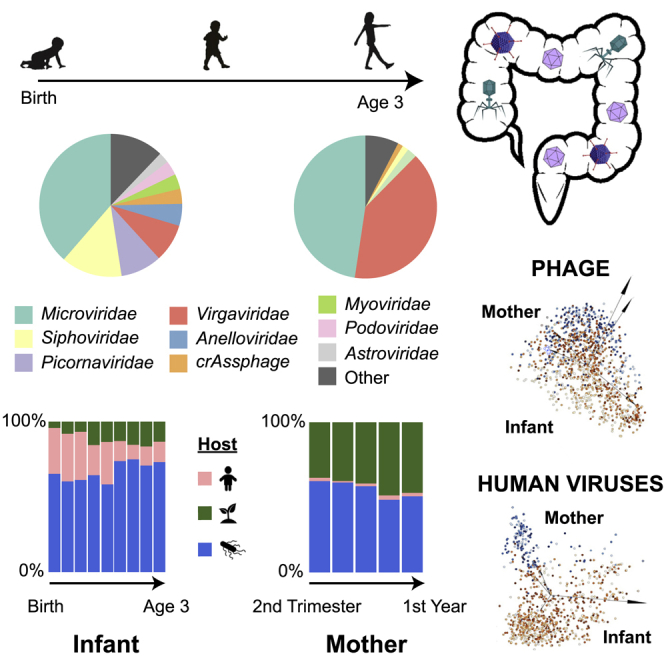
The infant virome consists of various eukaryotic viruses, nearly all presumptively human-host, and prokaryotic viruses (phages). The most abundant viruses were phages in the Microviridae and Siphoviridae families and vertebrate host viruses in the Picornaviridae and Anelloviridae families (Figure 1B). In contrast, the maternal virome consisted predominantly of dietary/environmental viruses (e.g., tomato mosaic virus), including Virgaviridae, and phages such as Microviridae and Inoviridae (Figure 1C). Over 3 years, the relative proportions of human-host viruses in the infant virome decreased, while those of dietary/environmental viruses and phages increased, with phages remaining as the most abundant (Figure 1D). In contrast, the maternal virome had a consistently low level of human-host viruses before (MTrim2 and MTrim3) and after (M1–M3) giving birth.
Figure 1.

Overview of STORK sample and data collection and virome composition in infants and mothers over time
(A) Stool samples for mothers and infants were collected at each household visit. Time points are shown by visit, including visits to the mother during the second trimester (Mtrim2), third trimester (Mtrim3), and in year 1 of infant life (M1–M3) and visits to the infant in year 1 (B1–B3), year 2 (B4–B6) and year 3 (B7–B9) of infant life. Medical records for the infants were reviewed and clinical metadata extracted at the time points indicated by “Chart Review.”
(B) Distribution of the most abundant phage/viral families in infants based on mean relative abundance. P indicates prokaryotic host range, while E indicates eukaryotic host range.
(C) Distribution of the most abundant viral families in mothers based on mean relative abundance. P indicates prokaryotic host range, while E indicates eukaryotic host range.
(D and E) Fractional abundance of eukaryotic (human pathogenic), diet/environmental, and prokaryotic viruses in infants and mothers.
Using linear mixed models, we observed that phage abundance, normalized per million preprocessed reads, increased over time, while phage alpha diversity (Shannon diversity metric) decreased over time in infants’ stools during the first 3 years of life (Figures 2A and 2B; Table S5). For human-host viruses, however, we observed overall decreases in abundance during this time frame and no significant change in viral diversity (Figures 2C and 2D; Table S5). Mothers’ samples showed no significant change in either abundance or diversity over their five visits (MTrim2, MTrim3, and M1–M3) (Table S5).
Figure 2.

Abundance (log10), alpha diversity, and beta diversity over the first 3 years of life
(A–D) Box and whiskers plot, by DNA or RNA genome, of (A) phage abundance, (B) phage Shannon diversity, (C) human-host virus abundance, and (D) human-host virus Shannon diversity.
(E) Principal coordinate analysis (PCoA) plot showing infants clustered by Jaccard distances from bacteriophage.
(F) PCoA plot of infants clustered by Jaccard distances of human-host viruses. Samples are colorized with an age gradient (light to dark orange representing the visits of B1–B9, see Table 1 for age ranges). The top 5 taxa driving clustering are shown as a biplot. Abbreviations: AN, Anelloviridae sp.; EA, Enterovirus A; GO: human gut gokushovirus; GW, gokushovirus WZ-2015a; LP, Lactococcus phage 936 sensu lato; PA, parechovirus A; PO, Poophage MBI-2016a; TT, torque teno virus-like mini virus; TV, Torque teno virus; VI, Vibrio phage JSF5. ∗p < 0.01, ∗∗p < 0.001, NS, no significance. Wald test (see Table S5).
Using principal coordinates analysis (PCoA), we observed Lactococcus/Vibrio and gokushovirus phages driving the ordination of the younger and older infant prokaryotic viromes, respectively (Figure 2E). The ordination for human-host viruses did not exhibit a viral taxa gradient that was as pronounced as that seen for phages (Figure 2F). We did not observe any change in the abundance of DNA dietary/environmental viruses as the infants aged (p = 0.637, Wald test). In contrast, RNA viruses significantly increased in abundance (p < 0.001, Wald test), perhaps reflecting the transition to a solid food diet harboring plant RNA virus such as pepper mild mottle virus and tomato mosaic virus (Figures S1A and S2A; Table S5). Diversity, however, did not significantly increase over time for infant dietary and environmental viruses (p = 0.0757, Wald test) (Figure S1B; Table S5). Although analyses of beta diversity did not reveal any definitive patterns with age, we did observe tomato mosaic virus in the family Virgaviridae associated with clusters of older infants (Figure S1C).
In infants, the viral families over the study period primarily consisted of Siphoviridae, Microviridae, Picornaviridae, Virgaviridae, and Anelloviridae (Figure 3). The dominant individual virus species identified in infants were gokushovirus (Microviridae), parechovirus (Picornaviridae), other Microviridae sp., pepper mild mottle virus (Virgaviridae), and other phages such as Sk1virus and CrAssphage sp. (Figure S3). In general, gokushovirus WZ-2015a and Microviridae sp. increased in proportion over the 3-year study period, whereas parechovirus A decreased in proportion (Figure S3).
Figure 3.

Distribution of viral families in infants
Heatmap distribution of the log10 abundance of the top 14 viral and phage families in infants for visits B1–B9. Black indicates zero counts.
We compared the alpha and beta diversity of the infants and the mothers in the first year of life (visits B1/M1, B2/M2, and B3/M3). DNA phages were significantly more abundant in infant than maternal samples (p < 0.001, Wald test), whereas RNA phages showed no significant differences (p = 0.980, Wald test) (Figure 4A; Table S5). Infant samples also exhibited higher phage diversity than maternal samples (p < 0.0001 for DNA phages and p = 0.0017 for RNA phages, Wald test) (Figure 4B; Table S5). The infant virome also harbored more abundant human viruses than the maternal virome (p < 0.001, Wald test, DNA and RNA viruses), with human DNA virus diversity significantly higher in infants compared with mothers (p < 0.001, Wald test); human RNA virus diversity was not significantly different (p = 0.55, Wald test) (Figures 4C and 4D; Table S5).
Figure 4.

Comparison of viral abundance, alpha diversity, and beta diversity between infants and mothers
(A–D) Box and whiskers plot of (A) prokaryotic phage abundance, (B) prokaryotic phage Shannon diversity, (C) human-host-virus abundance, and (D) human-host-virus Shannon diversity.
(E) PCoA plot of infant and mother samples, clustered by Jaccard distances of bacteriophage and archaeal viral counts.
(F) PCoA plot of infant and mother samples using human virus counts clustered with Jaccard distances. Samples are colorized with an age gradient, with a light to dark orange representing the visit ID of the infants, and a range of light to dark blue representing samples from the mothers (infants B1–B9, mothers MTrim2–MTrim3 and M1–M3, see Table 1 for age ranges). The top 5 taxa driving clustering are shown as a biplot. Abbreviations: CR, circular rep-encoding single-stranded (CRESS) virus sp.; GW, gokushovirus WZ-2015a; GO, human gut gokushovirus; HP, human picobirnavirus; LP, Lactococcus phage 936 sensu lato; MI, Microviridae sp.; PA, parechovirus A; PI, picobirnavirus sp.; PO, Poophage MBI-2016a; TT, torque teno virus-like mini virus. D, DNA virus/phage; R, RNAvirus/phage, ∗p < 0.005, ∗∗p < 0.0001, NS, no significance. Wald test (see Table S5).
The beta diversity of phages from infants was observed to cluster in parallel with that from mothers as the infants aged (Figure 4E). The greater dispersion from the mothers of younger infants (B1) versus older (B2–B3) infants was driven by the presence of Lactococcus phage, likely acquired from breast feeding. Clustering of phages from older infants (B2–B3) and their mothers (M1–M3) was driven by the presence of gokushoviruses, poophages, and other species in the Microviridae family (Figure 4E).
In contrast to phages, there was much stronger separation of human-host viruses between infants and their mothers that persisted over time (Figure 4F). This separation was driven by the presence of parechovirus A and torque teno virus (TTV)-like mini virus, a non-pathogenic virus in the Anelloviridae family, in the infants, versus picobirnavirus and circular rep-encoding single-stranded (CRESS) virus, a circovirus with a broad eukaryotic host range, in the mothers (Figure 4F). Alpha diversity of dietary and environmental viruses in the mothers remained stable during and after pregnancy, predominated by RNA plant viruses (Figures S2A and S2B; Table S5). Infants largely clustered apart from mothers based on differences in the composition of dietary/environmental viruses, with tomato mosaic virus driving the clustering in the mothers (Figure S2C).
Next, we compared the infant virome near the end of the third year (B9) with the mother’s last sequenced time point (M3) (Figures 5A–5H). DNA and RNA human virus and phage communities had higher abundance in infants compared with mothers (p < 0.001 for DNA human-host viruses, p < 0.001 or RNA human-host viruses, p = 0.0030 for DNA phages, p = 0.0064 for RNA phages, Kruskal-Wallis test), but differences in Shannon alpha diversity were significant only for human DNA viruses (p = 0.023, Kruskal-Wallis test) and not for human RNA viruses (p = 0.44, Kruskal-Wallis test), DNA phage (p = 0.93, Kruskal-Wallis test) or RNA phage (p = 0.34, Kruskal-Wallis test). Both mothers and infants had high abundance of Microviridae, Virgaviridae, Siphoviridae, and crAssphage. Mothers harbored fewer Anelloviridae, Caliciviridae, Picornaviridae, and Podoviridae than infants (Figure 5I).
Figure 5.

Comparison of mothers (M3) and infants (B9) sampled at the last time point
Box and whiskers plot of (A) phage DNA abundance, (B) phage RNA abundance, (C) phage DNA Shannon diversity, (D) phage RNA Shannon diversity, (E) DNA human virus abundance, (F) RNA human virus abundance, (G) DNA human virus Shannon diversity, (H) RNA human virus Shannon diversity, (I) heatmap of phage/viral family abundances at B9 for infants and M3 for mothers (see Table 1 for visit ID details). Black indicates zero counts. Significance is via Kruskal-Wallis tests. ∗p < 0.05, ∗∗p < 0.005.
By analysis of similarities (ANOSIM) testing, we compared the similarity or dissimilarity of younger (B1–B3) and older (B9) infant to maternal viromes (Table S6). RNA viruses and human-host DNA viruses showed significant differences between infants at both younger and older time points and their mothers (p = 0.001, 999 ANOSIM permutations), indicating that dissimilarities between groups were greater than within groups. However, the viromes of the infants and mothers became more similar as the infants aged, as indicated by a decline in ANOSIM R values (Table S6).
Finally, to identify sequence-divergent vertebrate viruses infecting infants and mothers, we performed de novo assembly of all viral and unmatched reads, the latter defined as reads that failed to match any taxonomic identifier in GenBank. The de novo assembly was followed by NT and translated NT (amino acid) alignments of the assembled contiguous sequences (contigs) to the GenBank NR viral protein database (Figure 6A). Viral or unmatched reads from babies (n ∼ 2 billion) and mothers (n ∼ 440 million) were assembled into ∼790k and ∼2.2 million contigs, respectively. Among the assembled contigs, 146,663 contigs (N50 = 941 bp) and 64,046 contigs (N50 = 1,470 bp) from infants and mothers, respectively, mapped with high (>90%) NT identity to known vertebrate viral genomes (Figure 6B). The breadth of viral taxa identified from the contigs (Figure 6B) was comparable to those identified from read-level alignments (Figure 1B; Data S1). A total of 1,610 contigs (N50 = 254 bp) and 37 contigs (N50 = 369 bp) from infants and mothers, respectively, mapped with low (52%–90%) identity, thus representing previously undescribed vertebrate viruses (Figure 6C). In infants, the 1,610 contigs all mapped to divergent regions of known viral genomes (Figure 6C, left). However, in mothers, the 37 contigs exhibited weak homology to sequence regions from three viruses: chicken picobirnavirus, a circovirus species, and an unclassified picornavirus. Notably, contigs from these 3 viruses did not align to any reference viral genome in GenBank at the NT level and aligned with only 30%–70% identity at the amino acid level (Figure 6C, right), suggesting the detection of previously undescribed, sequence-divergent viruses in mothers but not infants.
Figure 6.

Identification of sequence-divergent vertebrate viruses in infant and maternal viromes
(A) De novo assembly of viral and unmatched reads into contiguous sequences (contigs) using de Bruijn graphs was performed, followed by contig alignment to the GenBank protein database. After filtering out spurious hits to non-viral organisms, contigs were classified as derived from canonical or sequence-divergent viruses based on degree of sequence homology.
(B) Canonical vertebrate viruses.
(C) Sequence-divergent vertebrate viruses. Note that the 13 individual viruses identified from babies (left) exhibit 52%–90% nucleotide sequence identity to reference viruses in GenBank, while the 3 viruses from mothers (right, highlighted in red boldfaced text) only exhibit sequence identity at the amino acid level (30%–70%).
Discussion
We used metagenomic sequencing of fecal viromes derived from a cohort of 53 infants sampled quarterly over 3 years (July 2011 to August 2015) to characterize the progression of the infant gut virome. We also described the gut viromes of their mothers in the infants’ first year to compare composition, abundance, and diversity. Unlike the maternal virome, consisting primarily of phage and nonhuman dietary/environmental viruses, the infant virome consisted of a mixture of phage and human-host viruses. As infants aged, the phage component of the virome shifted from being dominated by Lactococcus phage to gokushoviruses, poophages, and Microviridae species, resembling the composition of the maternal phage virome. In contrast, the eukaryotic components of the infant virome, consisting of human-host and nonhuman dietary/environmental viruses, remained distinct from those of the maternal virome, both in abundance and composition.
The presence of Lactococcus phage at the earliest time point (B1) drove the separation of the phage component of the infant compared with maternal virome. These phages belong to the Siphoviridae family and infect the bacterium Lactococcus lactis an organism that is vital for the fermentation of milk/dairy products.18 Our cohort reported breastfeeding in 98% of infants, with 89% breastfeeding for at least 3 weeks; the high prevalence of Lactococcus spp. phage demonstrates how diet can establish the virome early in life.
As the children aged, viruses in the family Microviridae, primarily gokushoviruses and poophages, became the dominant phages in the gut.1,2,19 Although little is known about the recently identified poophages,20 gokushoviruses have been characterized in several recent publications.21,22,23 These phages were initially identified in Bdellovibrio and Chlamydophila bacteria but have now been described in Escherichia coli, surviving in the cytoplasm.22 The use of multiple, disparate survival strategies permits these phages to persist in many environments, suggesting that they may have been acquired by the infants from various dietary and environmental sources. Future analyses are needed to determine how an increase in abundance of these microviruses affects the development of the bacterial microbiome. In contrast to infants, we observed that the maternal virome is stable in composition for at least a year, from the second trimester to 1-year post-partum. However, unlike in the virome, changes in the bacterial microbiome have been documented during pregnancy trimester,24 with an increase in proteobacteria and actinobacteria and reduced richness from the first to third trimester.
Breast milk is known to have a protective effect against disease from human pathogenic viruses and is associated with decreased infant mortality in developed and developing countries.1 Many studies, however, have also identified asymptomatic carriage of these human pathogenic viruses in the infant gut.1,25,26,27 Comparable to what was previously described in infants from Bangladesh,27 we found that picornaviruses, particularly parechoviruses and enteroviruses, dominated the human-host virome in infants from California, suggesting that these viruses commonly colonize the gut regardless of geographic region. Infants also asymptomatically shed caliciviruses (noroviruses and sapoviruses), astroviruses, and rotaviruses in their stools. In the current study, although 48 (92.3%) of 52 infants reported an episode of acute respiratory or gastrointestinal illness during the first 3 years of life, all infants were asymptomatic at the time of sample collection, indicating that our results were likely not skewed by an active infection.
Our findings are limited by indirect comparisons of the infant to the adult virome in the third year, a lack of early pregnancy samples in the mothers or samples from other household members, as well as limited racial diversity in our sampled population. Nevertheless, the multiple time points collected in both infants and mothers allow us to observe meaningful trends in the virome. Future investigations of the Stanford’s Outcomes Research in Kids (STORK) cohort will investigate the mechanics of bacterial and viral interactions, infection and the virome, and the relationship between the virome and weight gain and immune development.
In conclusion, we determined that the infant virome changes dramatically in early life, although remains distinct in composition and diversity from the maternal virome by age 3. Viral abundance in infants increased over time, as reported in other studies.3,28 Although the infant prokaryotic virome became more “adult-like” in composition by the third year, the infant human-host virome remained distinct, predominated by picornaviruses and anelloviruses in infants but not in mothers. Interestingly, although human-host viruses were much more prevalent in infants than mothers, we identified several sequence-divergent, possibly novel vertebrate viruses in mothers but none in infants. Potential explanations for this finding include detection of novel animal viruses that are merely dietary components or the acquisition of infections from novel, human-host viruses, given the expanded diet in mothers and increased time of exposure to viruses in mothers compared with infants. A previous report determined that the neonatal virome is only 15% related to the mother’s virome3 and concluded that colonization most likely occurs through other environments such as breast milk, skin, and contaminated surfaces. Similarly, we found that the diversity of the infant virome was not driven by exposure to the mother but is more likely determined by dietary, environmental, and infectious exposures. Future studies are needed to determine how the presence/absence or persistence of certain pathogenic viruses ultimately contributes to disease later in life.
STAR★Methods
Key resources table
| REAGENT or RESOURCE | SOURCE | IDENTIFIER |
|---|---|---|
| Biological samples | ||
| Stool samples | Obtained from mothers and infants under IRB-approved collection and biobanking protocols | N/A |
| Extraction and Sequencing Reagents | ||
| TURBO DNase | Thermo Fisher | Cat #AM2238 |
| Baseline Zero DNase | Thermo- Fisher | Cat #NC1424104 |
| Benzonase | Novagen | Cat #70-664-3 |
| RNaseA | Roche | Cat #11119915001 |
| EZ1 Virus Mini Kit 2.0 | Qiagen | Cat #955134 |
| Superscript III reverse transcriptase | Invitrogen | Cat #18080044 |
| Sequenase | Thermo Fisher | Cat #70775Y200UN |
| AMPure XP beads | Beckman- Coulter | Cat #A63880 |
| Nextera Flex kit | Illumina | Cat #20025523 |
| Qubit dsDNA HS Assay | Thermo Fisher | Cat #Q33231 |
| Metagenomic sequencing data from stool samples consisting of preprocessed FASTQ reads with human sequences removed | NIH BioProject accession number PRJNA916952 | https://www.ncbi.nlm.nih.gov/bioproject/916952 |
| QIIME2 ommands and scripting code for de novo assembly and translated nucleotide (amino acid) alignment for identification of sequence-divergent viruses | Data S1 | N/A |
| Software and algorithms | ||
| R v3.6.2 | Open-source software | https://www.R-project.org/ |
| SURPI+ software for pathogen identification from metagenomic sequencing data | In-house software developed by University of California, San Francisco (UCSF) | code can be made available upon request to the UCSF Office of Technology Management. |
| QIIME2 (2021.11 release) | Open-source software | https://qiime2.org/ |
Resource availability
Lead contact
Further information and requests for resources and reagents should be directed to and will be fulfilled by the lead contact, Charles Chiu (cchiu@ucsf.edu).
Materials availability
This study did not generate new unique reagents.
Experimental model and subject details
Human subjects
Stanford’s Outcomes Research in Kids (STORK) is a multiethnic cohort of mothers and their infants from the second trimester of pregnancy through their third birthday. Demographics of mothers and infants can be found in Table 1 and age at the time of sample collection can be found in Table S1. As previously described,30 subject recruitment for the cohort was performed at two obstetric clinics, one at the Stanford School of Medicine and the other within Santa Clara Valley Medical Center, via posters and flyers. Any healthy pregnant woman aged 18-42 with a single fetus who wished to participate was enrolled in the study; infants were enrolled approximately 2 weeks post-delivery. A randomized intervention of triclosan and triclocarban-containing (TC) household and personal cleaning products over the first 12 months of life was nested within the cohort.31
Relative to the overall population of the United States, the cohort is overrepresented by Hispanic/LatinX families and families of lower socioeconomic status. Households were visited during the mother’s second and third trimesters and every four months for 3 years after birth of the infant (Figure 1, mother: Mtrim2, Mtrim3, M1-3; babies, B1-9). At the initial second trimester household visit, the mothers were given a detailed household questionnaire including demographic information, information on the household structure (including inhabitants), and indicators of socioeconomic status. Starting at the first household visit after delivery (B1/M1) (Figure 1A), stool, urine, and blood samples were obtained from both the mother (M1-3, collected only in trimester 2 and 3 and the first year of life) and the infant (B1-9, collected over the first 3 years of life), placed on ice packs, and frozen within 24 h of collection. Frozen stool samples were stored at –80 °C before processing. Weekly automated telephone or email surveys were used to assess for signs of infectious disease in the children. These surveys recorded total days per week of vomiting, fever, diarrhea, and symptoms suggesting upper respiratory infection (URI), including cough, nasal congestion, and ear pulling. If the children were reported as healthy, parents were asked about milk intake and amount of sleep to ensure equal amounts of time were spent answering questions regardless of the child’s health status. A review of physicians’ medical records from any well-baby visits or visits for illness reported by the mother at each household visit was performed every six months as available.
Recruitment of subjects, documentation of informed consent, collection of stool samples, sample processing, and metagenomic analyses were carried out with Institutional Review Board approval from Stanford University (Stanford, CA, USA), the Santa Clara Valley Medical Center (SCVMC) (San Jose, CA, USA) and University of California, San Francisco (San Francisco, CA, USA).
Method details
Extraction
Stool samples (200 μg) were diluted 20% in phosphate-buffered saline (PBS) to a final volume of 1000 mL and and centrifuged for 5 min at 10,000g, followed by filtration using a 0.45 μm filter and treatment utilizing a nuclease cocktail of TURBO DNase (Thermo Fisher), Baseline Zero DNase (Thermo Fisher), Benzonase (Novagen) and RNase A (Roche) for 30 min at 37°C. This procedure digested host cells and non-protected (naked) viral nucleic acids while maintaining viral nucleic acids in particles protected from the action of nucleases. Nuclease activity was immediately inactivated by adding guanidium-thiocyanate containing lysis buffer (Qiagen), followed by total nucleic acid extraction of 400 μL of pretreated stool using the EZ1 Virus Mini Kit v2.0 (Qiagen). Extracts were eluted in 60 μL volume.
Library preparation
Amplified complementary DNA (cDNA) was prepared from RNA as previously described.12 Briefly, extracted RNA was converted to cDNA using random nonamer primers attached to a linker adapter sequence in a reverse transcription reaction with Superscript III reverse transcriptase (Thermo Fisher) followed by second-strand synthesis using Sequenase 2.0 (Thermo Fisher) and 25 cycles of PCR amplification using the linker adapter as both a forward and reverse primer. Amplified cDNA was purified using AMPure XP beads (Beckman-Coulter) on the EpMotion 5075 (Eppendorf). The cDNA (from extracted RNA) or extracted DNA was then used for NGS library generation using the Nextera Flex Library Preparation Kit (Illumina) and purified using AMPure XP beads (Beckman Coulter) on the EpMotion 5073 (Eppendorf). Libraries were quantified using the Qubit dsDNA HS Assay (Thermo Fisher) on the Qubit Flex (Thermo Fisher). Samples were sequenced on the NovaSeq 6000 (Illumina) using 150 bp paired-end sequencing at the UCSF Center for Advanced Technology (CAT). Samples were batched (80-96 per lane), with negative control (nuclease-free water) and a positive control containing six microorganisms non-pathogenic to humans (virus – cyprinid herpesvirus 3, gram-negative bacterium Rhodobacter sphaeroides, gram-positive bacterium Streptococcus uberis, yeast – Millerozyma farinosa, mold – Aspergillus oryzae, and parasite – Neospora caninum). This control was previously validated and used as an external positive control in a next-generation sequencing assay for metagenomic pathogen detection from body fluids.32 Environmental and laboratory contaminants found in the negative control such as murine leukemia virus33 were excluded from further analysis.
Metagenomic analysis
Metagenomic next-generation sequencing (mNGS) data from all samples were analyzed for viral nucleic acids using SURPI+ (v1.0.7-build.4),13,34 a bioinformatics pipeline for pathogen detection and discovery from metagenomic data, modified to incorporate enhanced filtering and classification algorithms. Briefly, reads were first preprocessed by primer trimming and removal of low-complexity and low-quality sequences using a quality cutoff of 18. Preprocessed reads were then aligned to the human genome using the SNAP nucleotide aligner,35 followed by the more sensitive Bowtie2 aligner,29 and aligned human reads were computationally subtracted (removed) from the dataset. Next, the SNAP nucleotide aligner was used to align the remaining human-subtracted reads against a subset of the comprehensive National Center for Biotechnology Information (NCBI) nucleotide (NT) database consisting of all viral, bacterial, fungal, and parasitic reads in GenBank (release 230, February 2019). This alignment enabled the detection of reads with ≥90% identity to reference sequences in the database. Aligned viral reads to the modified NT database were then filtered to remove spurious hits using confirmatory nucleotide BLAST alignment to top scoring matches at an e-value cutoff of 10-8,36 and were classified to the species, genus, or family level, with the taxonomic level based on the lowest common ancestor of matching taxa, as previously described.13 Final count data tables were separated into human-host virus, phage, and nonhuman dietary / environmental virus categories by taxonomy (Table S7). The pre-established criterion for viral detection by SNAP was the presence of reads mapping to at least three non-overlapping regions of the viral genome.13 SURPI normalized counts data were imported into QIIME2 (2021.11 release)37 to calculate Jaccard presence/absence distance matrices. These distances and the relative abundances were used to create principal component analysis (PCoA) visualization artifacts with biplots showing the top 5 taxa driving clustering. The values were not rarefied, as they were already fractional values normalized by reads per million preprocessed counts. ANOSIM results were calculated using the diversity beta-group-significance plugin. Alpha diversity indices (Shannon index) was calculated using the R package vegan2.5-3.38
Contig de novo assembly and translated nucleotide (amino acid) alignment
De novo assembly of viral and unmatched reads into contiguous sequences (contigs) using de Bruijn graphs was performed using the SPADES assembler at default settings using the “—sc” option for assembly of single-cell data39 and only retaining contigs with a length of >200 bp, followed by translated nucleotide alignment of the assembled contigs to the viral amino acid (protein) database in GenBank (release 230, February 2019) using the DIAMOND aligner,40 with an e-value significance cutoff of 0.001. Misalignments to non-viral organisms were filtered out by DIAMOND alignment at an e-value cutoff of 0.001 to the GenBank (release 230, February 2019) non-redundant (NR) protein database. Based on amino acid sequence homology to the closest match in the virus reference database, contigs were classified as derived from canonical viruses (e-value<1e-06) or candidate, sequence-divergent viruses (e-value <0.0001 and ≥1e-06). Contigs were manually spot checked against the NCBI NT database using the BLAST algorithm.36 Results were parsed using in-house shell scripts, and data were visualized using GraphPad Prism (version 9.3.1) (pie charts) and Microsoft Excel (line/bar plots).
Quantification and statistical analysis
Linear mixed models were performed in R 3.6.2.41 Abundance data (normalized SURPI data) were split into groups for linear fits (e.g., infant phage DNA samples for testing longitudinal changes or mother and infant visit B1-B3 phage RNA samples for testing between mother and infant groups). These groups were then normalized via the bestNormalize 1.8.2 package.42 The optimal data transformation selected by bestNormalize was used. Linear mixed models were then calculated by the glmmTMB 1.1.2.3 package with “family=gaussian”43.
The formula for fitting data over time was:
The formula for comparing infant and mother groups was:
where VisitNum is a value of 1-9 corresponding to visits B1-B9, SubjectID is the identifier for the individual, and SampleType is the mother or infant group.
Significant p-values (<0.05) for linear mixed models are reported from the Wald test output of glmmTMB and optimal data transformation type were those calculated using bestNormalize (Table S5). Residuals of the model were tested for normality via the DHARMa 0.4.4 package.44 Residual normality was confirmed with the DHARMA residual test for dispersion, Kolmogorov-Smirnov (KS) test, and by Q-Q plot visual inspection. In one case, infant RNA dietary/environmental virus Shannon diversity over visits, a significant value was detected with a Wald test, but KS tests indicated that the residuals deviated significantly from normality. As multiple data transformations also yielded significant KS results, we considered this particular result as non-significant due to violation of data distribution assumptions. Pairwise comparisons of virome log10 abundance data and alpha diversity between infant B9 and mother M3 groups were analyzed using the Kruskal-Wallis test, using R’s kruskal.test() function.
Acknowledgments
We thank the staff at the UCSF Center for Advanced Technology for sequencing transcriptome libraries using the Illumina NovaSeq 6000. This study was funded by National Institutes of Health (NIH) grants R01 HD063142 (to J.P.), R01 HD008837 (to J.P. and C.Y.C.), the Max Planck Society (R.E.L.), and the Bill and Melinda Gates Foundation (to J.P. and C.Y.C.).
Author contributions
J.P. and C.Y.C. conceived and designed the experiments. A.C.G., C.L., T.H., and A.S.-G. performed the experiments. W.A.W., S.F., Y.S., V.S., R.E.L., J.P., and C.Y.C. analyzed data. R.E.L., J.P., and C.Y.C. contributed reagents/materials/analysis tools. A.C.G., W.A.W., J.P., and C.Y.C. wrote the paper. All authors reviewed the manuscript and agreed to its contents.
Declaration of interests
S.F., D.S., and C.Y.C. are co-inventors on US patent 11,380,421, “Pathogen Detection using Next Generation Sequencing,” under which algorithms for taxonomic classification, filtering, and pathogen detection are used by SURPI+ software for virus identification from metagenomic data.
Published: February 8, 2023
Footnotes
Supplemental information can be found online at https://doi.org/10.1016/j.chom.2023.01.003.
Supplemental information
The linear mixed models are shown by abundance and Shannon alpha diversity over time for infants, followed by mother and infant pairs (visits B1–B3, M1–M3 only) to tests of differences between groups.
Pairwise results between visits B1–M1, B3–M3, and B9–M3 are shown for Jaccard distances, along with ANOSIM test statistics. Age ranges are described for visit IDs in Table S1.
Data and code availability
-
•
Metagenomic sequencing data consisting of preprocessed reads with human sequences removed by local alignment of the human genome (GRChg38 build) using Bowtie229 have been deposited into the National Center for Biotechnology Information (NCBI) Sequence Read Archive (SRA) (BioProject accession number PRJNA916952, under umbrella BioProject accession number PRJNA171119), and are publicly available as of the publication date. Count tables by virus type and QIIME2 compatible tab-delimited counts, metadata, and taxonomy files are provided in Data S1.
-
•
QIIME2 commands and scripting code for de novo assembly and translated nucleotide (amino acid) alignment for identification of novel and/or divergent viruses are provided in Data S1.
-
•
Any additional information required to re-analyze the data reported in this paper is available from the lead contact upon request.
References
- 1.Liang G., Zhao C., Zhang H., Mattei L., Sherrill-Mix S., Bittinger K., Kessler L.R., Wu G.D., Baldassano R.N., DeRusso P., et al. The stepwise assembly of the neonatal virome is modulated by breastfeeding. Nature. 2020;581:470–474. doi: 10.1038/s41586-020-2192-1. [DOI] [PMC free article] [PubMed] [Google Scholar]
- 2.Lim E.S., Zhou Y., Zhao G., Bauer I.K., Droit L., Ndao I.M., Warner B.B., Tarr P.I., Wang D., Holtz L.R. Early life dynamics of the human gut virome and bacterial microbiome in infants. Nat. Med. 2015;21:1228–1234. doi: 10.1038/nm.3950. [DOI] [PMC free article] [PubMed] [Google Scholar]
- 3.Maqsood R., Rodgers R., Rodriguez C., Handley S.A., Ndao I.M., Tarr P.I., Warner B.B., Lim E.S., Holtz L.R. Discordant transmission of bacteria and viruses from mothers to babies at birth. Microbiome. 2019;7:156. doi: 10.1186/s40168-019-0766-7. [DOI] [PMC free article] [PubMed] [Google Scholar]
- 4.Milani C., Duranti S., Bottacini F., Casey E., Turroni F., Mahony J., Belzer C., Delgado Palacio S., Arboleya Montes S., Mancabelli L., et al. The first microbial colonizers of the human gut: composition, activities, and health implications of the infant gut microbiota. Microbiol. Mol. Biol. Rev. 2017;81 doi: 10.1128/MMBR.00036-17. e00036-17. [DOI] [PMC free article] [PubMed] [Google Scholar]
- 5.Moore R.E., Townsend S.D. Temporal development of the infant gut microbiome. Open Biol. 2019;9:190128. doi: 10.1098/rsob.190128. [DOI] [PMC free article] [PubMed] [Google Scholar]
- 6.Liang G., Bushman F.D. The human virome: assembly, composition and host interactions. Nat. Rev. Microbiol. 2021;19:514–527. doi: 10.1038/s41579-021-00536-5. [DOI] [PMC free article] [PubMed] [Google Scholar]
- 7.Cook R., Brown N., Redgwell T., Rihtman B., Barnes M., Clokie M., Stekel D.J., Hobman J., Jones M.A., Millard A. INfrastructure for a phage REference database: identification of large-scale biases in the current collection of cultured phage genomes. Phage (New Rochelle) 2021;2:214–223. doi: 10.1089/phage.2021.0007. [DOI] [PMC free article] [PubMed] [Google Scholar]
- 8.Santiago-Rodriguez T.M., Hollister E.B. Human virome and disease: high-throughput sequencing for virus discovery, identification of phage-bacteria dysbiosis and development of therapeutic approaches with emphasis on the human gut. Viruses. 2019;11:656. doi: 10.3390/v11070656. [DOI] [PMC free article] [PubMed] [Google Scholar]
- 9.Callanan J., Stockdale S.R., Shkoporov A., Draper L.A., Ross R.P., Hill C. Expansion of known ssRNA phage genomes: from tens to over a thousand. Sci. Adv. 2020;6:eaay5981. doi: 10.1126/sciadv.aay5981. [DOI] [PMC free article] [PubMed] [Google Scholar]
- 10.Krishnamurthy S.R., Wang D. Origins and challenges of viral dark matter. Virus Res. 2017;239:136–142. doi: 10.1016/j.virusres.2017.02.002. [DOI] [PubMed] [Google Scholar]
- 11.Briese T., Kapoor A., Mishra N., Jain K., Kumar A., Jabado O.J., Lipkin W.I. Virome capture sequencing enables sensitive viral diagnosis and comprehensive virome analysis. mBio. 2015;6 doi: 10.1128/mBio.01491-15. e01491–e01415. [DOI] [PMC free article] [PubMed] [Google Scholar]
- 12.Legoff J., Resche-Rigon M., Bouquet J., Robin M., Naccache S.N., Mercier-Delarue S., Federman S., Samayoa E., Rousseau C., Piron P., et al. The eukaryotic gut virome in hematopoietic stem cell transplantation: new clues in enteric graft-versus-host disease. Nat. Med. 2017;23:1080–1085. doi: 10.1038/nm.4380. [DOI] [PubMed] [Google Scholar]
- 13.Miller S., Naccache S.N., Samayoa E., Messacar K., Arevalo S., Federman S., Stryke D., Pham E., Fung B., Bolosky W.J., et al. Laboratory validation of a clinical metagenomic sequencing assay for pathogen detection in cerebrospinal fluid. Genome Res. 2019;29:831–842. doi: 10.1101/gr.238170.118. [DOI] [PMC free article] [PubMed] [Google Scholar]
- 14.Taboada B., Morán P., Serrano-Vázquez A., Iša P., Rojas-Velázquez L., Pérez-Juárez H., López S., Torres J., Ximenez C., Arias C.F. The gut virome of healthy children during the first year of life is diverse and dynamic. PLoS One. 2021;16 doi: 10.1371/journal.pone.0240958. e0240958. [DOI] [PMC free article] [PubMed] [Google Scholar]
- 15.Rascovan N., Duraisamy R., Desnues C. Metagenomics and the human virome in asymptomatic individuals. Annu. Rev. Microbiol. 2016;70:125–141. doi: 10.1146/annurev-micro-102215-095431. [DOI] [PubMed] [Google Scholar]
- 16.Shkoporov A.N., Clooney A.G., Sutton T.D.S., Ryan F.J., Daly K.M., Nolan J.A., McDonnell S.A., Khokhlova E.V., Draper L.A., Forde A., et al. The human gut virome is highly diverse, stable, and individual specific. Cell Host Microbe. 2019;26:527–541.e5. doi: 10.1016/j.chom.2019.09.009. e525. [DOI] [PubMed] [Google Scholar]
- 17.Zuo T., Sun Y., Wan Y., Yeoh Y.K., Zhang F., Cheung C.P., Chen N., Luo J., Wang W., Sung J.J.Y., et al. Human-gut-DNA virome variations across geography, ethnicity, and urbanization. Cell Host Microbe. 2020;28:741–751.e4. doi: 10.1016/j.chom.2020.08.005. [DOI] [PubMed] [Google Scholar]
- 18.Mahony J., Cambillau C., van Sinderen D. Host recognition by lactic acid bacterial phages. FEMS Microbiol. Rev. 2017;41:S16–S26. doi: 10.1093/femsre/fux019. [DOI] [PubMed] [Google Scholar]
- 19.Takahashi K., Iwasa Y., Hijikata M., Mishiro S. Identification of a new human DNA virus (TTV-like mini virus, TLMV) intermediately related to TT virus and chicken anemia virus. Arch. Virol. 2000;145:979–993. doi: 10.1007/s007050050689. [DOI] [PubMed] [Google Scholar]
- 20.Santiago-Rodriguez T.M., Garoutte A., Adams E., Nasser W., Ross M.C., La Reau A., Henseler Z., Ward T., Knights D., Petrosino J.F., et al. Metagenomic information recovery from human stool samples is influenced by sequencing depth and profiling method. Genes (Basel) 2020;11:1380. doi: 10.3390/genes11111380. [DOI] [PMC free article] [PubMed] [Google Scholar]
- 21.Creasy A., Rosario K., Leigh B.A., Dishaw L.J., Breitbart M. Unprecedented diversity of ssDNA phages from the family Microviridae detected within the gut of a protochordate model organism (Ciona robusta) Viruses. 2018;10:404. doi: 10.3390/v10080404. [DOI] [PMC free article] [PubMed] [Google Scholar]
- 22.Kirchberger P.C., Ochman H. Resurrection of a global, metagenomically defined gokushovirus. eLife. 2020;9 doi: 10.7554/eLife.51599. e51599. [DOI] [PMC free article] [PubMed] [Google Scholar]
- 23.Székely A.J., Breitbart M. Single-stranded DNA phages: from early molecular biology tools to recent revolutions in environmental microbiology. FEMS Microbiol. Lett. 2016;363:fnw027. doi: 10.1093/femsle/fnw027. [DOI] [PubMed] [Google Scholar]
- 24.Koren O., Goodrich J.K., Cullender T.C., Spor A., Laitinen K., Backhed H.K., Gonzalez A., Werner J.J., Angenent L.T., Knight R., et al. Host remodeling of the gut microbiome and metabolic changes during pregnancy. Cell. 2012;150:470–480. doi: 10.1016/j.cell.2012.07.008. [DOI] [PMC free article] [PubMed] [Google Scholar]
- 25.Kapusinszky B., Minor P., Delwart E. Nearly constant shedding of diverse enteric viruses by two healthy infants. J. Clin. Microbiol. 2012;50:3427–3434. doi: 10.1128/JCM.01589-12. [DOI] [PMC free article] [PubMed] [Google Scholar]
- 26.McCann A., Ryan F.J., Stockdale S.R., Dalmasso M., Blake T., Ryan C.A., Stanton C., Mills S., Ross P.R., Hill C. Viromes of one year old infants reveal the impact of birth mode on microbiome diversity. PeerJ. 2018;6:e4694. doi: 10.7717/peerj.4694. [DOI] [PMC free article] [PubMed] [Google Scholar]
- 27.Tan S.K., Granados A.C., Bouquet J., Hoy-Schulz Y.E., Green L., Federman S., Stryke D., Haggerty T.D., Ley C., Yeh M.T., et al. Metagenomic sequencing of stool samples in Bangladeshi infants: virome association with poliovirus shedding after oral poliovirus vaccination. Sci. Rep. 2020;10:15392. doi: 10.1038/s41598-020-71791-4. [DOI] [PMC free article] [PubMed] [Google Scholar]
- 28.Yatsunenko T., Rey F.E., Manary M.J., Trehan I., Dominguez-Bello M.G., Contreras M., Magris M., Hidalgo G., Baldassano R.N., Anokhin A.P., et al. Human gut microbiome viewed across age and geography. Nature. 2012;486:222–227. doi: 10.1038/nature11053. [DOI] [PMC free article] [PubMed] [Google Scholar]
- 29.Langmead B., Salzberg S.L. Fast gapped-read alignment with Bowtie 2. Nat. Methods. 2012;9:357–359. doi: 10.1038/nmeth.1923. [DOI] [PMC free article] [PubMed] [Google Scholar]
- 30.Ley C., Sanchez Mde L., Mathur A., Yang S., Sundaram V., Parsonnet J. Stanford’s Outcomes Research in Kids (STORK): a prospective study of healthy pregnant women and their babies in Northern California. BMJ Open. 2016;6 doi: 10.1136/bmjopen-2015-010810. e010810. [DOI] [PMC free article] [PubMed] [Google Scholar]
- 31.Ley C., Sundaram V., Sanchez M.L., Desai M., Parsonnet J. Triclosan and triclocarban exposure, infectious disease symptoms and antibiotic prescription in infants-A community-based randomized intervention. PLoS One. 2018;13 doi: 10.1371/journal.pone.0199298. e0199298. [DOI] [PMC free article] [PubMed] [Google Scholar]
- 32.Gu W., Deng X., Lee M., Sucu Y.D., Arevalo S., Stryke D., Federman S., Gopez A., Reyes K., Zorn K., et al. Rapid pathogen detection by metagenomic next-generation sequencing of infected body fluids. Nat. Med. 2021;27:115–124. doi: 10.1038/s41591-020-1105-z. [DOI] [PMC free article] [PubMed] [Google Scholar]
- 33.Erlwein O., Robinson M.J., Dustan S., Weber J., Kaye S., McClure M.O. DNA extraction columns contaminated with murine sequences. PLoS One. 2011;6 doi: 10.1371/journal.pone.0023484. e23484. [DOI] [PMC free article] [PubMed] [Google Scholar]
- 34.Naccache S.N., Federman S., Veeraraghavan N., Zaharia M., Lee D., Samayoa E., Bouquet J., Greninger A.L., Luk K.C., Enge B., et al. A cloud-compatible bioinformatics pipeline for ultrarapid pathogen identification from next-generation sequencing of clinical samples. Genome Res. 2014;24:1180–1192. doi: 10.1101/gr.171934.113. [DOI] [PMC free article] [PubMed] [Google Scholar]
- 35.Zaharia M., Bolosky B., Curtis K., Patterson D., Fox A., Patterson D., Shenker S., Stoica I., Sittler T. Alignment in a SNAP: cancer diagnosis in the genomic age. Lab. Investig. 2012;92:458a. [Google Scholar]
- 36.Altschul S.F., Gish W., Miller W., Myers E.W., Lipman D.J. Basic local alignment search tool. J. Mol. Biol. 1990;215:403–410. doi: 10.1016/S0022-2836(05)80360-2. [DOI] [PubMed] [Google Scholar]
- 37.Bolyen E., Rideout J.R., Dillon M.R., Bokulich N.A., Abnet C.C., Al-Ghalith G.A., Alexander H., Alm E.J., Arumugam M., Asnicar F., et al. Reproducible, interactive, scalable and extensible microbiome data science using QIIME 2. Nat. Biotechnol. 2019;37:852–857. doi: 10.1038/s41587-019-0209-9. [DOI] [PMC free article] [PubMed] [Google Scholar]
- 38.Oksanen J., Simpson G.L., Blanchet G., Kindt R., Legendre P., Minchin P., O’Hara R., Solymos P., Stevens M.H.H., Szoecs E., et al. 2017. vegan: community Ecology Package.https://cran.r-project.org/web/packages/vegan/index.html [Google Scholar]
- 39.Bankevich A., Nurk S., Antipov D., Gurevich A.A., Dvorkin M., Kulikov A.S., Lesin V.M., Nikolenko S.I., Pham S., Prjibelski A.D., et al. SPAdes: a new genome assembly algorithm and its applications to single-cell sequencing. J. Comput. Biol. 2012;19:455–477. doi: 10.1089/cmb.2012.0021. [DOI] [PMC free article] [PubMed] [Google Scholar]
- 40.Buchfink B., Xie C., Huson D.H. Fast and sensitive protein alignment using DIAMOND. Nat. Methods. 2015;12:59–60. doi: 10.1038/nmeth.3176. [DOI] [PubMed] [Google Scholar]
- 41.R Development Core Team . R Foundation for Statistical Computing; 2010. R: a language and environmental for statistical computing. [Google Scholar]
- 42.Peterson R.A. Finding optimal normalizing transformations via bestNormalize. R J. 2021;13:310. [Google Scholar]
- 43.Brooks M., Kristensen K., van Benthem K., Magnusson A., Berg C.W., Nielsen A., Skaug H., Mächler M., Bolker B. glmmTMB balances speed and flexibility among packages for zero-inflated generalized linear mixed modeling. R J. 2017;9:378–400. doi: 10.32614/RJ-2017-066. [DOI] [Google Scholar]
- 44.Hartig F. R Foundation for Statistical Computing; 2022. Dharma: residual diagnostics for hierarchical (multi-level/mixed) regression models. [Google Scholar]
Associated Data
This section collects any data citations, data availability statements, or supplementary materials included in this article.
Supplementary Materials
The linear mixed models are shown by abundance and Shannon alpha diversity over time for infants, followed by mother and infant pairs (visits B1–B3, M1–M3 only) to tests of differences between groups.
Pairwise results between visits B1–M1, B3–M3, and B9–M3 are shown for Jaccard distances, along with ANOSIM test statistics. Age ranges are described for visit IDs in Table S1.
Data Availability Statement
-
•
Metagenomic sequencing data consisting of preprocessed reads with human sequences removed by local alignment of the human genome (GRChg38 build) using Bowtie229 have been deposited into the National Center for Biotechnology Information (NCBI) Sequence Read Archive (SRA) (BioProject accession number PRJNA916952, under umbrella BioProject accession number PRJNA171119), and are publicly available as of the publication date. Count tables by virus type and QIIME2 compatible tab-delimited counts, metadata, and taxonomy files are provided in Data S1.
-
•
QIIME2 commands and scripting code for de novo assembly and translated nucleotide (amino acid) alignment for identification of novel and/or divergent viruses are provided in Data S1.
-
•
Any additional information required to re-analyze the data reported in this paper is available from the lead contact upon request.