

Abstract
Background:
Previous studies identified racial and ethnic disparities in childhood acute lymphoblastic leukaemia (ALL) survival. We aimed to determine whether disparities persist in contemporaneous cohorts and if present, are attributable to differences in leukemia biology or insurance status.
Methods:
Patients with newly diagnosed ALL, 0–30 years of age, enrolled on completed Children’s Oncology Group (COG) trials between 2004–2019 were included (NCT00103285, NCT00075725, NCT00408005, NCT01190930, NCT02883049, NCT02112916, NCT02828358, NCT00557193). Race/ethnicity was categorized as non-Hispanic White, Hispanic, non-Hispanic Black, non-Hispanic Asian, and non-Hispanic Other. Event-free and overall survival (EFS, OS) were compared across race/ethnicity. The relative contribution of clinical and biologic disease prognosticators and insurance status was examined through multivariable regression models.
Findings:
The cohort included 21,152 patients [11,849 (56·0%) male]. Non-Hispanic White patients comprised the largest racial/ethnic group (13,872, 65·6%), followed by Hispanic (4,354, 20·6%) and non-Hispanic Black patients (1,517, 7·2%). Five-year EFS was 87·4% (95% CI 86·7–88·0) among non-Hispanic White patients vs. 82·8% (95% CI 81·4–84·1) [HR 1·37, 95% confidence interval (95CI) 1·26–1·49; p<0·0001] among Hispanic patients and 81·8% (95% CI 79·3–84·0) (HR 1·45, 95CI 1·28–1·56; p<0·0001) among non-Hispanic Black patients. Inferior EFS among Hispanic patients was substantially attenuated by disease prognosticators and insurance status (HR decreased from 1·37 (p<0·0001) to 1·11 (p=0·045)). The increased risk among non-Hispanic Black patients was minimally attenuated (HR 1·45 (p<0·0001) to 1·32 (p<0·0001)). Disparities in OS were wider than EFS. Disparities were restricted to B-ALL patients as no differences in EFS or OS were seen in T-ALL based on race/ethnicity.
Interpretation:
Substantial disparities in outcome for B-ALL persist by race and ethnicity, but are not observed in T-ALL. Underlying mechanisms may vary between disadvantaged groups. Future studies of relapsed patients, access to and quality of care, and other potential aspects of structural racism are warranted to inform interventions aimed at dismantling racial and ethnic disparities.
Funding:
National Cancer Institute, St. Baldrick’s Foundation.
INTRODUCTION
Health disparities affecting racial, ethnic, and socioeconomically marginalized groups are a major concern.1 Prior analysis of children with acute lymphoblastic leukaemia (ALL), the most common paediatric cancer, treated 20–40 years ago, demonstrated disparities across racial, ethnic, and socioeconomic groups, finding inferior ALL survival among Black and Hispanic children, and among children from low socioeconomic status (SES) backgrounds.2,3 Event-free and overall survival (EFS, OS) for children and young adults with ALL have improved significantly over the past 20–30 years with optimization of cytotoxic chemotherapy, and improved risk stratification based on advances in assessment of minimal residual disease (MRD) and recognition of additional prognostic recurrent cytogenetic lesions.4 Whether inequities experienced by disadvantaged groups persist in the current era despite overall improving outcomes is unknown.
Ethnicity and self-reported race are increasingly recognized as social constructs created or imposed by societies and its systems, institutions, and laws, as opposed to biological constructs which are linked to genetic ancestry.5,6 Certain disease prognosticators, such as high-risk leukaemia cytogenetics, are differentially distributed across racial and ethnic groups, however they may be defined.7 Previous authors have hypothesized that racial and ethnic disparities in childhood ALL outcomes are mainly secondary to differences in disease biology, SES, or both, but have neglected the role that these social constructs may independently play in outcomes.2,8–10 We therefore assembled a largely North American contemporaneous cohort of children, adolescents, and young adults (CAYA) with ALL and treated on clinical trials to determine whether racial and ethnic disparities in outcomes persist with current therapy. We also attempted to determine the extent to which any identified disparities were explained by traditional disease prognosticators or insurance status. We hypothesized that disparities would exist in our cohort and that they would not be fully explained by imbalances in disease prognosticators or insurance status.
METHODS
Study Patients
Between January 1, 2004 and December 31, 2019, children (aged 0–14 years) and adolescents and young adults (aged 15–30 years) with newly diagnosed ALL were eligible for enrollment onto several Children’s Oncology Group (COG) clinical trials (Appendix p 2). After enrollment onto common classification protocols (AALL03B1, AALL08B1, APEC14B1), patients enrolled on trials for National Cancer Institute (NCI) standard risk (SR) B-ALL [AALL0331 and AALL0932: age >1 year and <10 years and initial white blood cell count (WBC) <50,000/μL], NCI high risk (HR) B-ALL (AALL0232, AALL1131: age 10–30 years or initial WBC ≥50,000/μL and any age), T-ALL (AALL0434, AALL1231: age 1–30 years), or infant ALL (AALL0631, AALL15P1: B-ALL and age <1 year old). All trials have completed, and details previously published.11–15 Studies were approved by the NCI, Pediatric Central Institutional Review Board (IRB), and/or IRB of participating centres. Written informed consent and assent (if applicable) were obtained. As the analyses in this manuscript represented secondary analyses of existing trial data, additional IRB approval was not required. Trial data were frozen on June 30, 2021.
Induction therapy with either three [NCI SR B-ALL – Dexamethasone or Prednisone, Vincristine, and Asparaginase], four [NCI HR B-ALL or T-ALL – addition of daunorubicin], or five (infant ALL – addition of cytarabine) drugs was followed by post-induction therapy, the intensity of which was dependent on risk stratification. The final phase of therapy (Maintenance), comprised a prolonged period of antimetabolite-based oral chemotherapy with pulses of vincristine and 5-days of corticosteroid, generally given every 4 weeks. The duration of Maintenance therapy was sex-dependent, with non-infant boys receiving an additional year. Though initial dosing of antimetabolites was based on body surface area and pharmacogenomics, doses were adjusted over the course of treatment to meet a target absolute neutrophil count (ANC) of 0·5–1·5 ×109/L.
Outcomes
All patients with race/ethnicity data were assessed for all primary and secondary outcomes. Primary outcomes were EFS and OS. EFS was defined as time in years, from study enrollment to first event [induction death, failure to attain complete remission, relapse, remission death, or the development of a second malignant neoplasm (SMN)]. OS was defined as the time from study enrollment to death from any cause. Patients were censored at their dates of last follow-up, none of which were missing. Secondary outcomes included relapse [overall and by site (isolated bone marrow, CNS, or testicular)], induction death (any death during Induction therapy), death in complete remission (any death after achieving remission in the absence of disease relapse), and SMN. End-Induction MRD was both a covariate for our primary outcomes (see below) and a secondary outcome.
Covariates
The key predictor of interest was race/ethnicity, as determined from demographic case report forms at the time of study enrollment. These forms provided a limited number of possible categories of both race and ethnicity. Though self-report is now acknowledged as the ideal way to collect race and ethnicity, it is unknown how many forms were completed through self-report versus other methods. Race and ethnicity were combined and categorized as non-Hispanic White, Hispanic, non-Hispanic Black, and non-Hispanic Asian. The remaining categories (Native Hawaiian or other Pacific Islander, American Indian or Alaska Native, multiple races) were combined as non-Hispanic Other given small sample sizes. Health insurance status at the time of study enrollment was categorized as: US Medicaid only, US private (comprising mainly those with private insurance and including those with both Medicaid and private insurance or with military insurance) and International (universal health insurance systems such as Canada, Australia, and New Zealand).
Various disease prognosticators were defined, including age and WBC at diagnosis, lineage (B-ALL, T-ALL), central nervous system (CNS) status [CNS1 (no blasts) vs. CNS2 vs. CNS3], and end-Induction MRD. Cytogenetics in B-ALL were categorized as favorable (ETV6-RUNX1 fusion or simultaneous trisomies of chromosomes 4, 10 and 17, later re-defined as trisomies of chromosomes 4 and 10) vs. unfavorable (hypodiploidy with modal chromosome number <44 and/or DNA index <0.81, intrachromosomal amplification of chromosome 21 (iAMP21), KMT2A rearrangements, or BCR-ABL1 fusion) vs. neutral (all others).
Analyses
Differences in the distribution of covariates by race/ethnicity and insurance status were examined using chi-squared tests or t-tests. Survival rates were estimated using the Kaplan-Meier method with standard errors of Peto16,17 and compared using log-rank tests. The relative contribution of each of the three categories (race/ethnicity, insurance status, disease prognosticators) was estimated using change-in-estimate approaches employing several Cox proportional hazard models including different combinations of the categories. These analyses were conducted for both EFS and OS for the overall cohort and stratified by B- vs. T-ALL.
Cumulative incidence functions determined risk of secondary outcomes, including relapse (with death and SMN treated as competing events), death in continuous remission (with relapse and SMN treated as competing events); and SMN (death and relapse as competing events). These cumulative incidences were compared between groups using Gray’s test.18 Median time to relapse was compared using t-tests.
Prognosticators in acute leukemia are based on analyses of past cohorts comprising mainly non-Hispanic white patients, which may or may not hold the same prognostic value in other populations, as has been seen in adult acute myeloid leukemia.19 The prognostic significance of disease characteristics across race/ethnicity was thus determined by stratifying multivariable Cox proportional hazard models of EFS and OS by each racial/ethnic group. Logistic regression analyses determined the association of race/ethnicity and insurance status with end of Induction MRD [positive (≥0·01%) vs. negative (<0·01%)], adjusting for all disease prognosticators. Statistical significance was defined as p<0·05. As the number of patients was determined by number participating in each included trial, no sample size calculation was performed. Analyses were performed using SAS® software (version 9·4; SAS Institute, Cary, NC). Graphics were generated using R (http://www.R-project.org, version 2·13·1).
Role of Funding Source
The funding source played no role in study design, the collection, analyses, and interpretation of data, the writing of the report, or the decision to submit.
RESULTS
Of 24,979 eligible CAYA with ALL, 21,152 (84·6%) had race/ethnicity data available (Appendix p 1,3). Characteristics of the final study cohort are shown in Table 1. Non-Hispanic White patients comprised the largest racial/ethnic group (13,872, 65·6%), followed by Hispanic (4,354, 20·6%) and non-Hispanic Black patients (1,517, 7·2%). Hispanic and non-Hispanic Black patients comprised 2·4% (57/2,377) and 1·7% (41/2,377) of International patients respectively, versus 22·9% (4,297/18,775) and 7·9% (1,476/18,775) of US patients (p<0·0001). Of the study cohort, 1,350 (6·4%) were from Canada, 586 (2·8%) from Australia, and 241 (1·1%) from New Zealand. Excepting sex, disease prognosticators were differentially distributed across race/ethnicity (Table 1). T-ALL accounted for 17·6% (253/1,1517), 9·4% (1,238/13,872), and 6·6% (264/4,354) of cases among non-Hispanic Black, non-Hispanic White, and Hispanic patients, respectively (p<0·0001). Insurance status also varied by race/ethnicity; half (2,178/4,354) of Hispanic and non-Hispanic Black (741/1,517) children were insured by Medicaid, versus 18·6% (2,584/13,872) of non-Hispanic White children (p<0·0001). The median follow up for the cohort was 6.3 years [interquartile range (IQR) 4.1–9.1 years].
Table 1.
Cohort characteristics, stratified by race/ethnicity [N (%)]
| Race/Ethnicity | |||||||
|---|---|---|---|---|---|---|---|
| Total cohort (N=21,152) |
Non-Hispanic White (N=13,872) |
Hispanic (N=4,354) |
Non-Hispanic Black (N=1,517) |
Non-Hispanic Asian (N=1,071) |
Non-Hispanic Other (N=338) |
P value | |
| Age at diagnosis (years) | <0·0001 | ||||||
| <1 | 245 (1·1) | 158 (1·1) | 51 (1·2) | 19 (1·3) | 14 (1·3) | 3 (0·9) | |
| 1–4 | 9878 (46·7) | 6,716 (48·4) | 1849 (42·5) | 627 (41·3) | 536 (50·0) | 150 (44·4) | |
| 5–9 | 5618 (26·6) | 3,653 (26·3) | 1199 (27·5) | 400 (26·4) | 265 (24·7) | 101 (29·9) | |
| 10–14 | 3066 (14·5) | 1,881 (13·6) | 699 (16·1) | 290 (19·1) | 150 (14·0) | 46 (13·6) | |
| 15–30 | 2345 (11·1) | 1,464 (10·6) | 556 (12·8) | 181 (11·9) | 106 (9·9) | 38 (11·2) | |
| Sex | 0·14 | ||||||
| Male | 11849 (56·0) | 7,695 (55·5) | 2464 (56·6) | 889 (58·6) | 606 (56·6) | 195 (57·7) | |
| Female | 9303 (44·0) | 6,177 (44·5) | 1890 (43·4) | 628 (41·4) | 465 (43·4) | 143 (42·3) | |
| WBC at presentation (×109/L) | 0·0001 | ||||||
| <50 | 17065 (80·7) | 11,298 (81·4) | 3440 (79·0) | 1177 (77·6) | 871 (81·4) | 279 (82·5) | |
| ≥50 | 4,084 (19·3) | 2,574 (18·6) | 913 (21·0) | 339 (22·4) | 199 (18·6) | 59 (17·5) | |
| Lineage | <0·0001 | ||||||
| B | 18031 (90·5) | 11,911 (90·6) | 3757 (93·4) | 1184 (82·4) | 905 (89·4) | 274 (90·1) | |
| T | 1892 (9·5) | 1,238 (9·4) | 264 (6·6) | 253 (17·6) | 107 (10·6) | 30 (9·9) | |
| CNS status | <0·0001 | ||||||
| CNS1 | 18216 (86·4) | 12,083 (87·4) | 3662 (84·4) | 1267 (83·9) | 921 (86·2) | 283 (83·7) | |
| CNS2 | 2447 (11·6) | 1,490 (10·8) | 582 (13·4) | 199 (13·2) | 125 (11·7) | 51 (15·1) | |
| CNS3 | 420 (2·0) | 254 (1·8) | 95 (2·2) | 45 (3·0) | 22 (2·1) | 4 (1·2) | |
| Cytogenetics | <0·0001 | ||||||
| Favorable | 8754 (41·4) | 5,994 (43·2) | 1622 (37·3) | 537 (35·4) | 470 (43·9) | 150 (44·4) | |
| Neutral | 10566 (49·9) | 6,718 (48·4) | 2321 (53·3) | 843 (55·6) | 529 (49·4) | 155 (45·9) | |
| Unfavorable | 1832 (8·7) | 1,160 (8·4) | 411 (9·4) | 137 (9·0) | 72 (6·7) | 33 (9·8) | |
| End induction BM MRD | <0·0001 | ||||||
| <0·01% | 15102 (75·9) | 10012 (76·6) | 2997 (73·6) | 1068 (75·5) | 801 (79·3) | 224 (70·2) | |
| 0·01–<0·1% | 2,074 (10·4) | 1386 (10·6) | 418 (10·3) | 132 (9·3) | 102 (10·1) | 36 (11·3) | |
| 0·1%–<1% | 1,502 (7·6) | 958 (7·3) | 352 (8·6) | 102 (7·2) | 51 (5·0) | 39 (12·2) | |
| ≥1% | 11,209 (6·1) | 717 (5·5) | 304 (7·5) | 112 (7·9) | 56 (5·5) | 20 (6·3) | |
| Insurance status | <0·0001 | ||||||
| US Private | 13,043 (61·7) | 9390 (67·7) | 2119 (48·7) | 735 (48·4) | 655 (61·2) | 144 (42·6) | |
| US Medicaid | 5,732 (27·1) | 2584 (18·6) | 2178 (50·0) | 741 (48·8) | 150 (14·0) | 79 (23·4) | |
| International | 2,377 (11·2) | 1898 (13·7) | 57 (1·3) | 41 (2·7) | 266 (24·8) | 115 (34·0) | |
BM – Bone marrow; CNS – Central nervous system; MRD – Minimal residual disease; N – Number; US – United States; WBC – White blood cell
EFS and OS differed across racial/ethnic groups (Figure 1, Table 2). Non-Hispanic White and non-Hispanic Asian patients (N=1,071; 5·1%) experienced the best outcomes (5-year EFS 87·4% (95% CI 86·7–88·0) and 88·1% (95% CI 85·5–90·3) respectively). Inferior outcomes were seen among the remaining groups (Hispanic: 82·8% (95% CI 81·4–84·1) non-Hispanic Black 81·8% (95% CI 79·3–84·0) non-Hispanic Other 82·8% (95% CI 76·4–87·6) ; p<0·0001). Similar patterns were seen in 5-year OS, with superior survival seen in non-Hispanic White and non-Hispanic Asian patients (93·3% (95% CI 92·8–93·7) and 93·6% (95% CI 91·5–95·1) ) and inferior survival seen in Hispanic (89·9% (95% CI 88·7–90·9) ), non-Hispanic Black (89·7% (95% CI 87·6–91·4) ) and non-Hispanic Other (88·9% (95% CI 83·2–92·7) patients (p<0·0001). The number of specific events and their distribution across racial/ethnic group is shown in the Appendix (p. 3,4). Stratification by lineage revealed that racial/ethnic-based disparities were restricted to patients with B-ALL. EFS and OS were inferior in T- vs. B-ALL, but notably there were no significant differences in EFS or OS among different racial/ethnic groups of T-ALL patients (Figure 1, Table 2).
Figure 1.
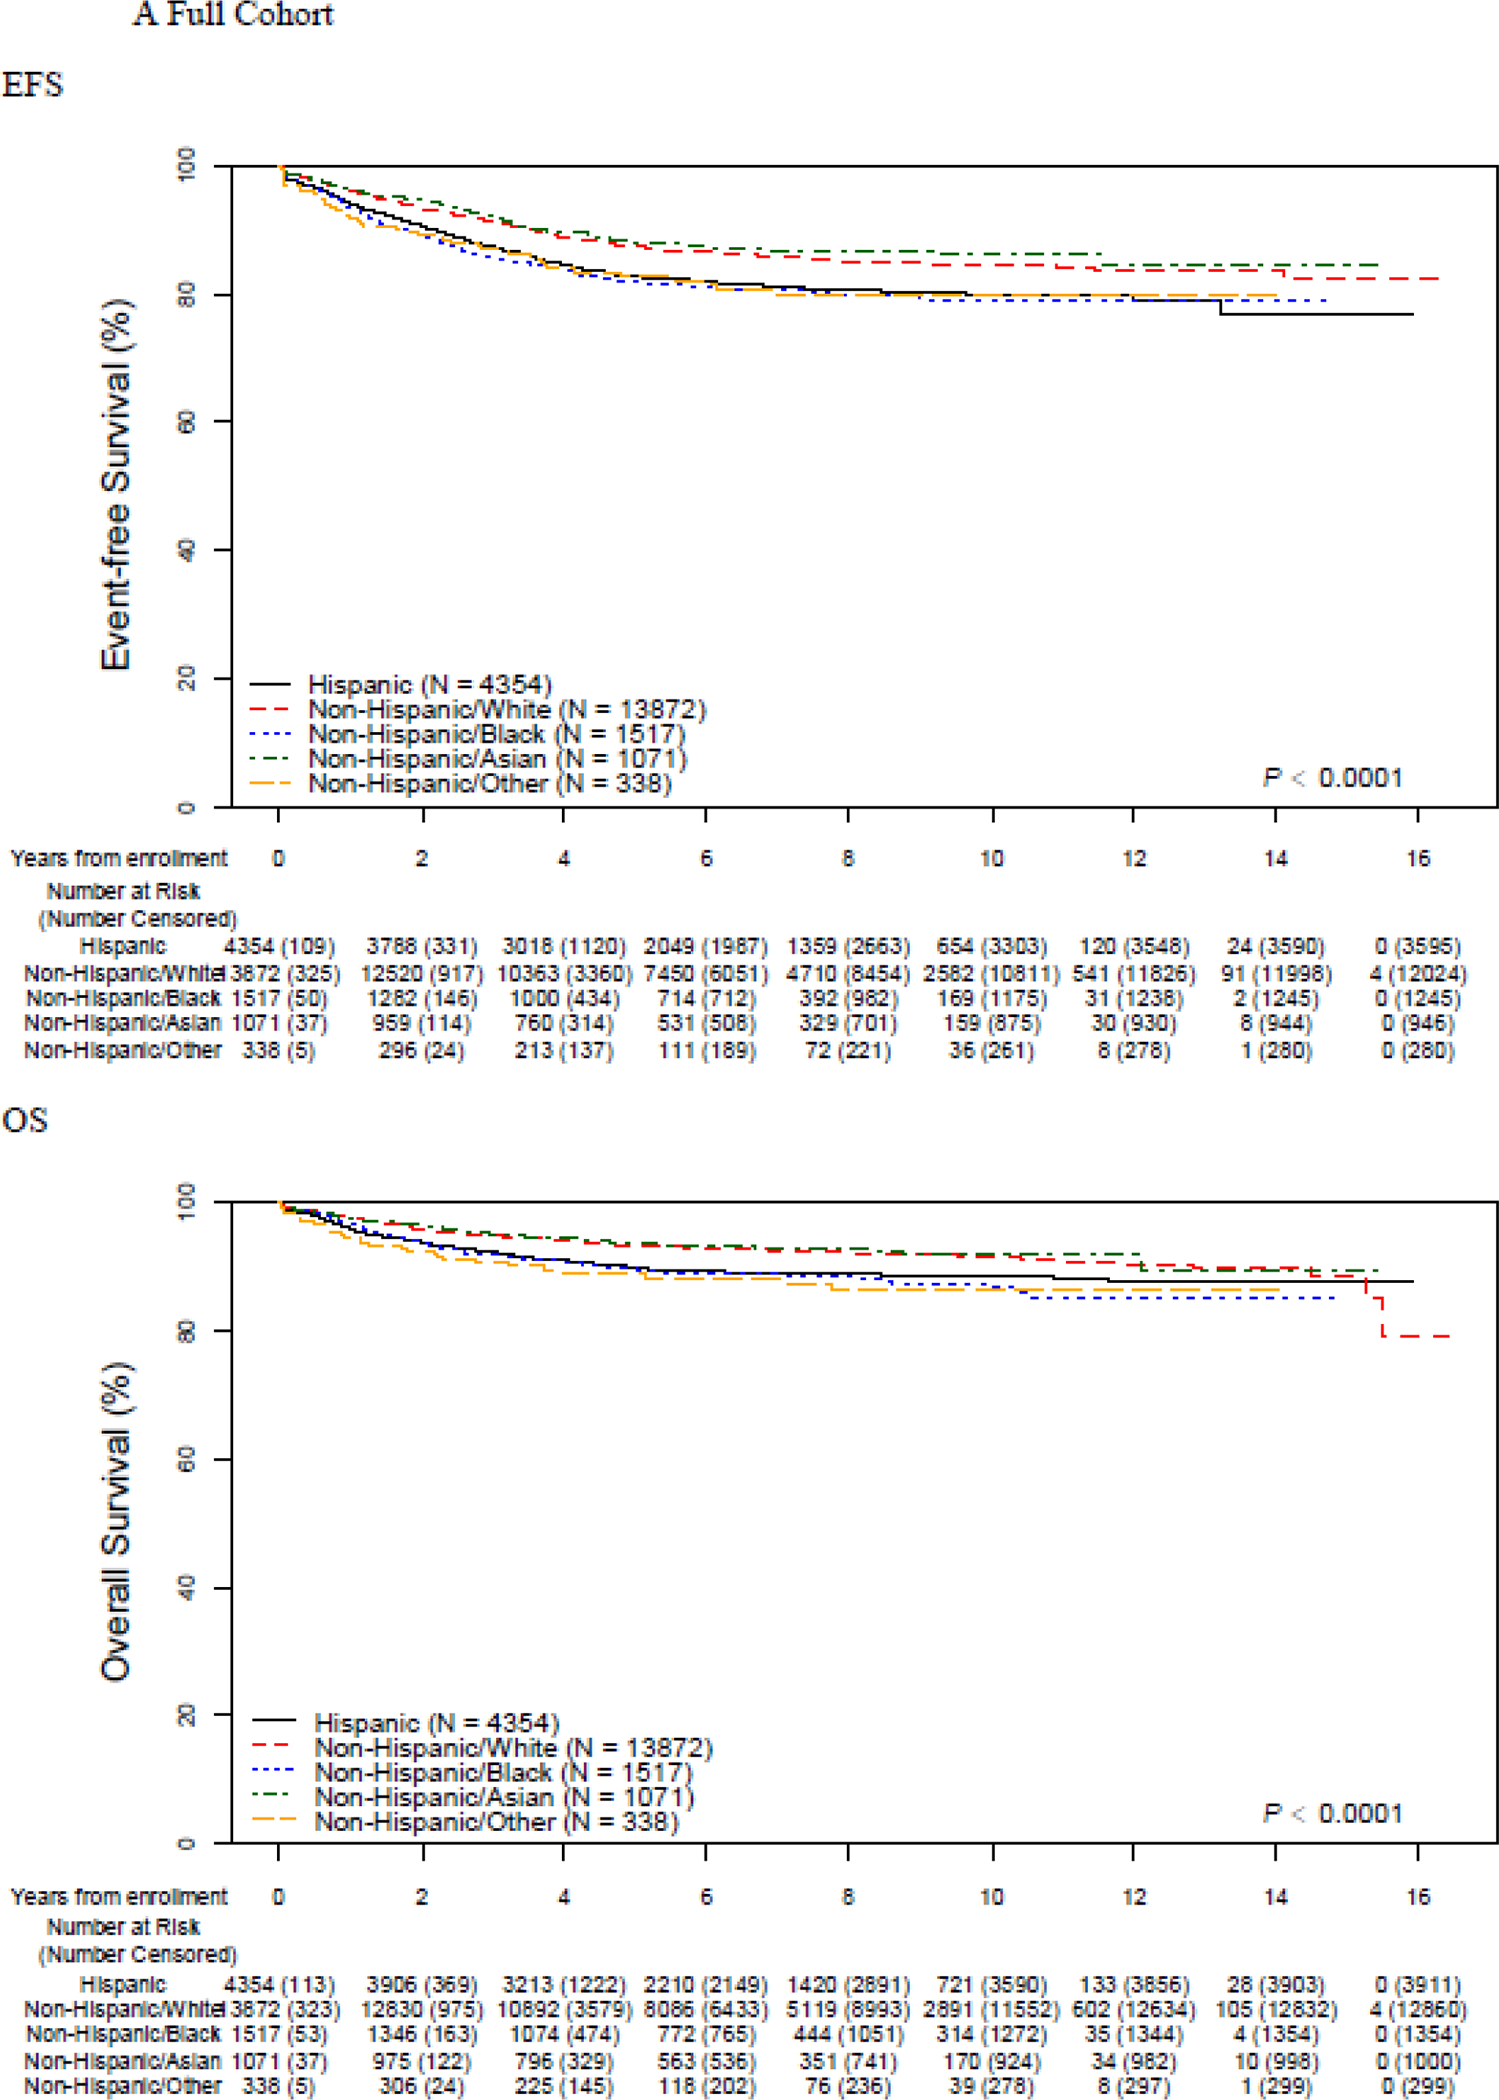
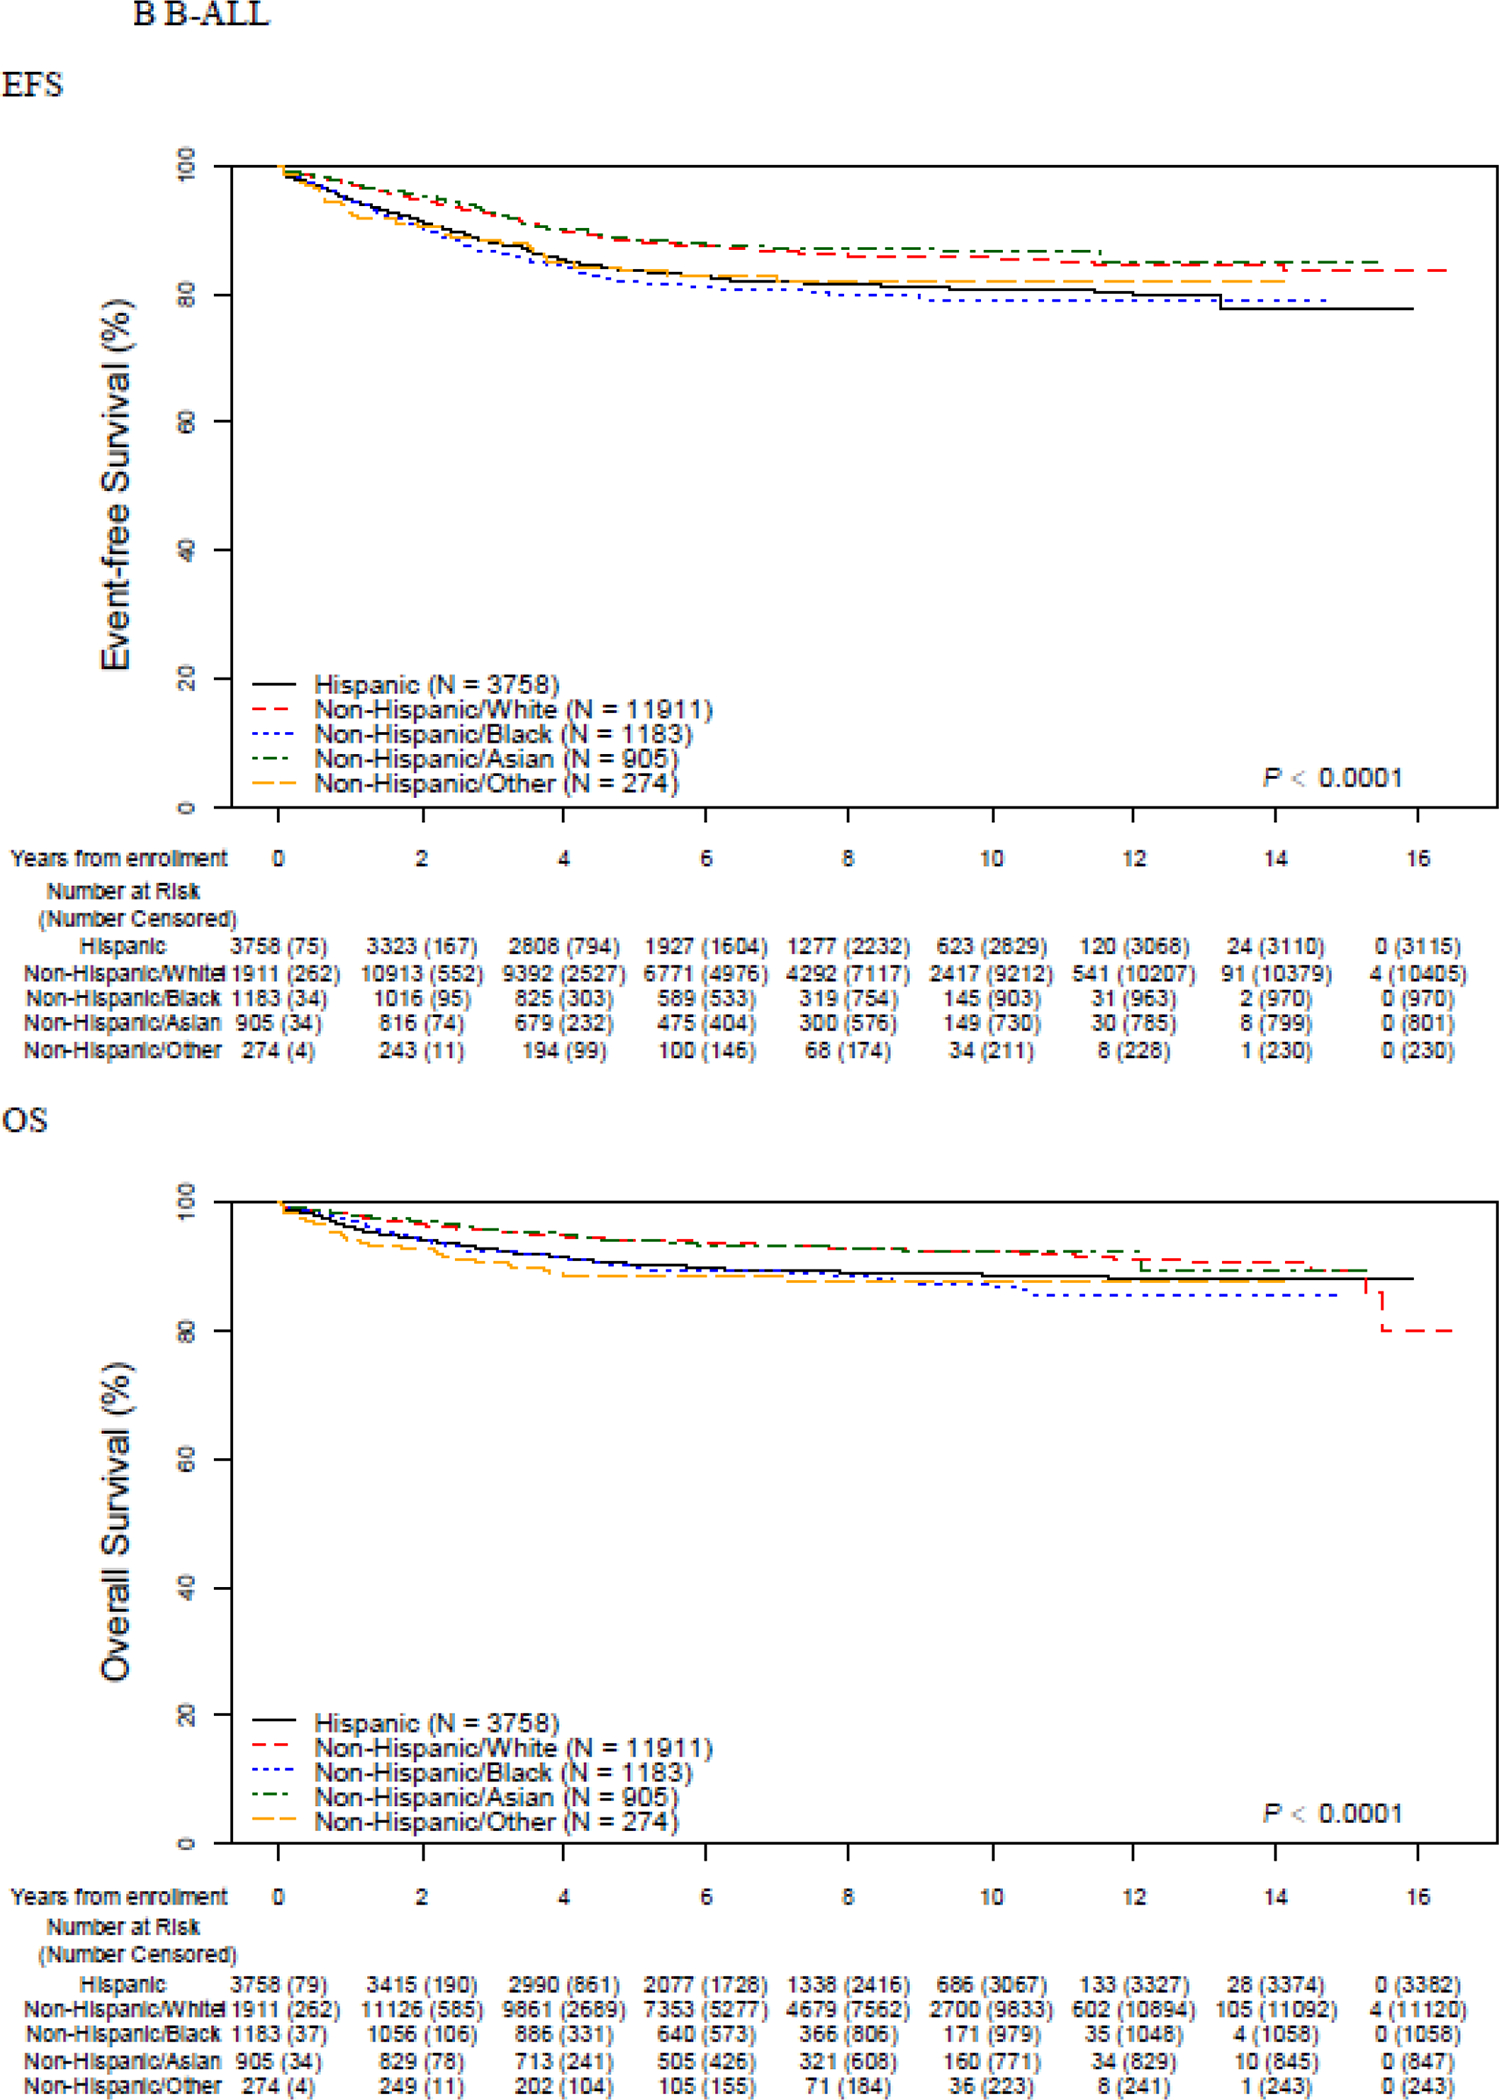
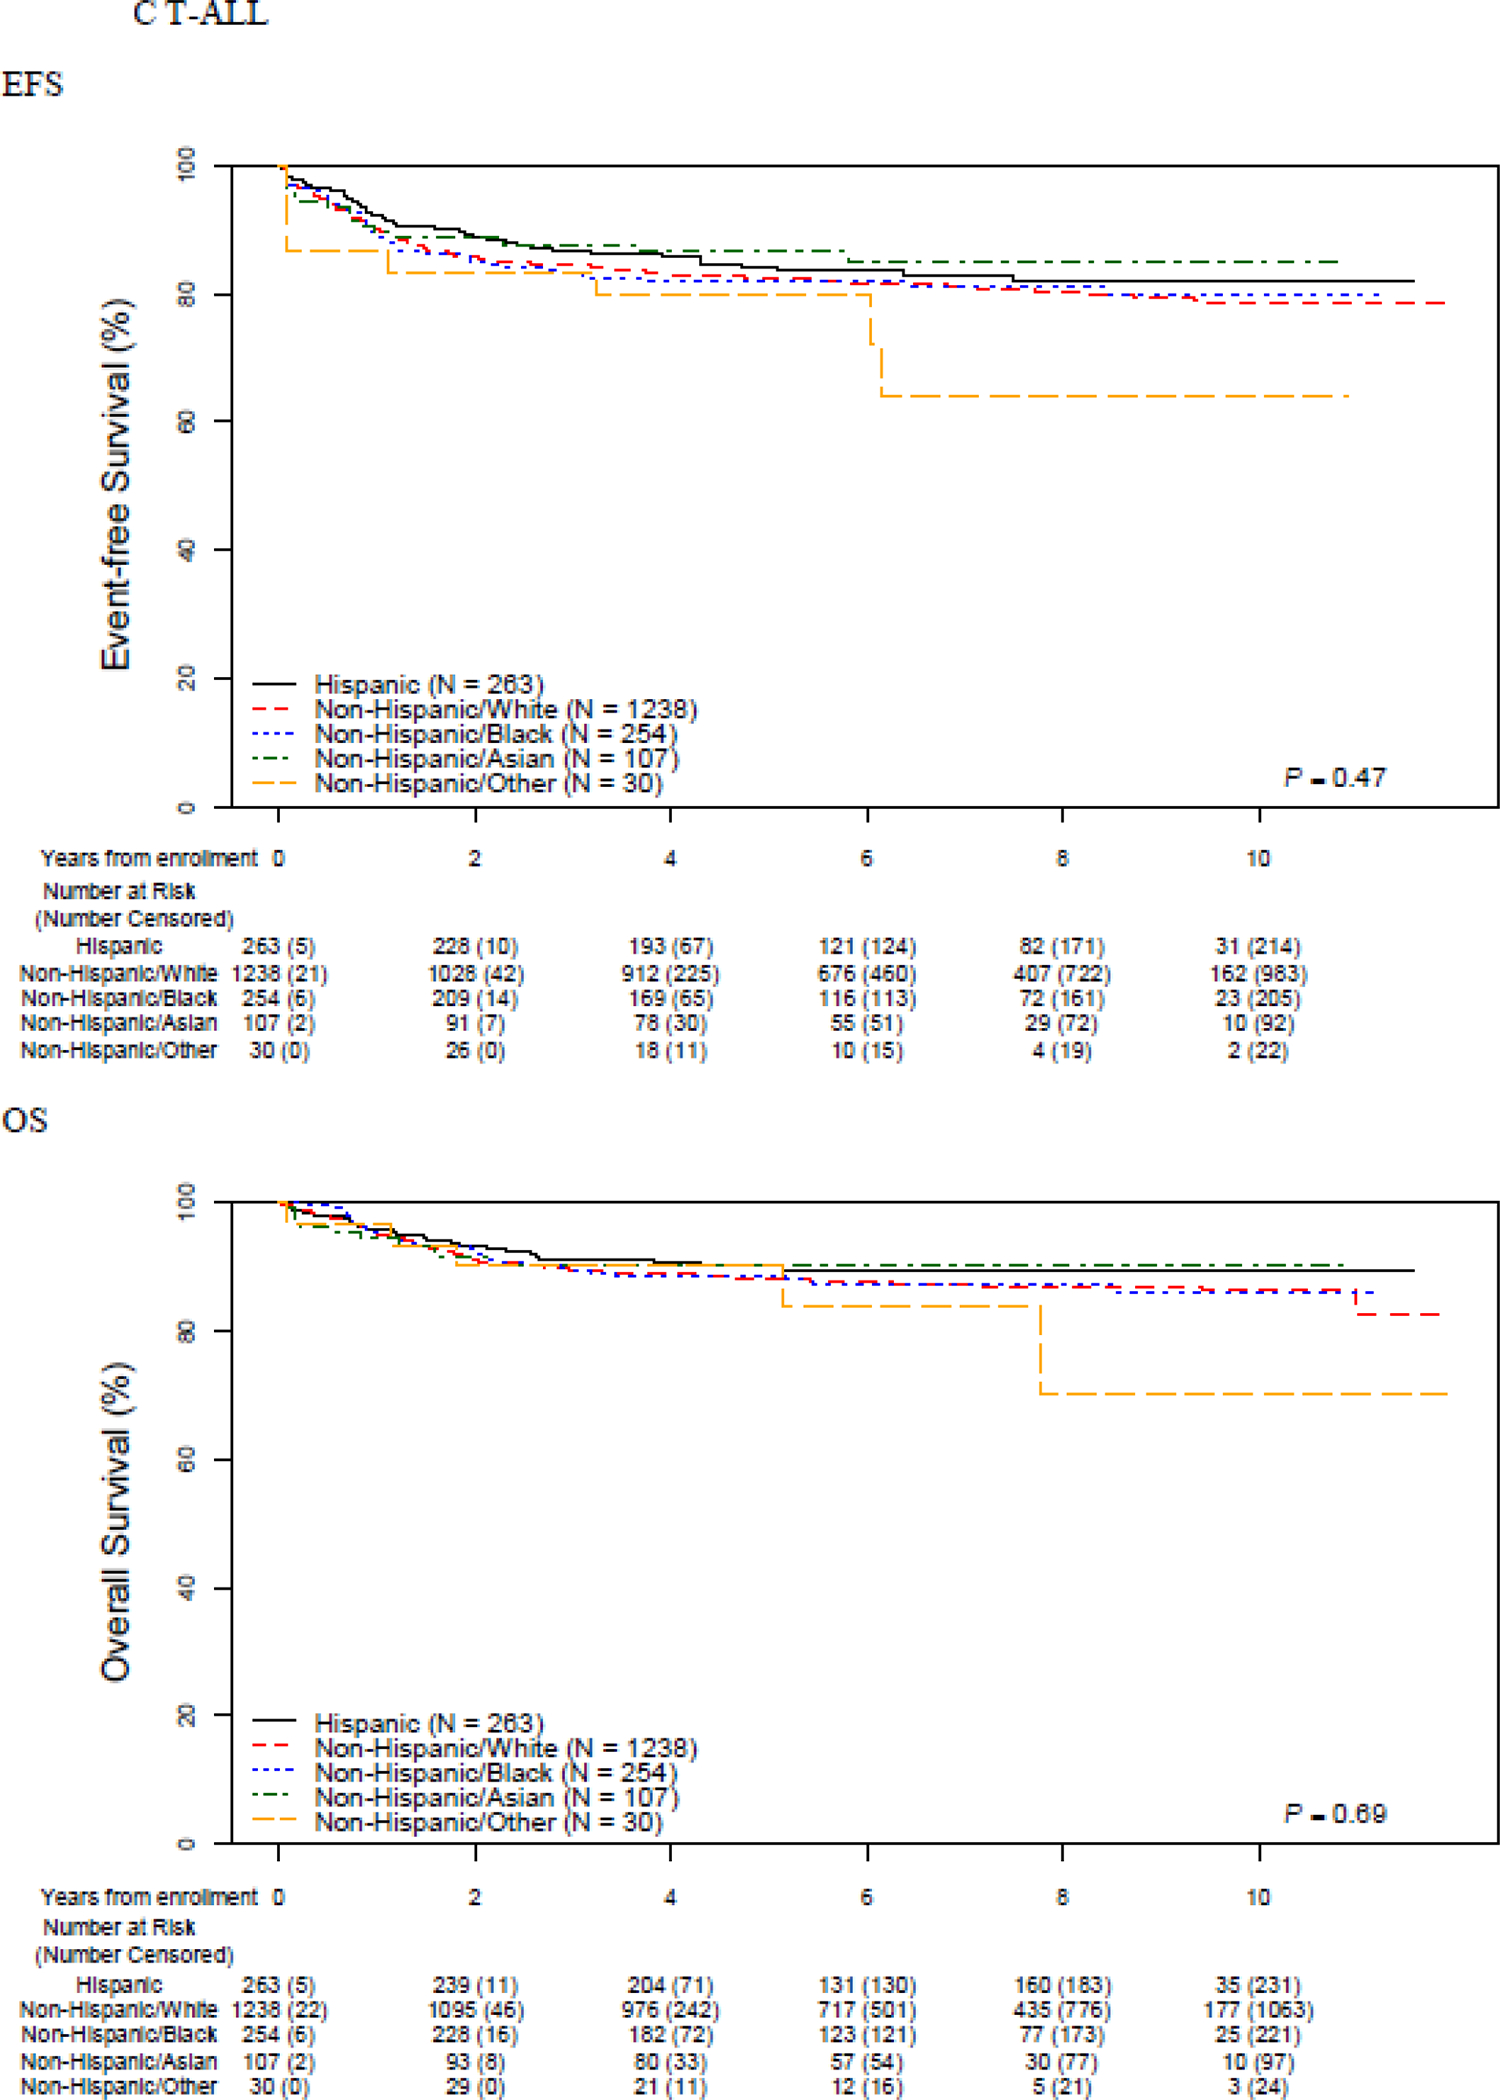
Event-free and overall survival by race and ethnicity, overall and stratified by B vs. T-ALL
Table 2.
5-year event free survival and overall survival rates (95% CI); by race and ethnicity, and insurance status
| Overall Cohort | B-ALL | T-ALL | ||||||||||
|---|---|---|---|---|---|---|---|---|---|---|---|---|
| 5-year EFS | p | 5-year OS | p | 5-year EFS | p | 5-year OS | p | 5-year EFS | p | 5-year OS | p | |
| Race/Ethnicity | ||||||||||||
| Non-Hispanic White | 87·4 (86·7–88·0) |
<0·0001 | 93·3 (92·8–93·7) |
<0·0001 | 88·3 (87·6– 88·9) |
<0·0001 | 94·1 (93·6–94·6) |
<0·0001 | 82·4 (79·9–84·7) |
0·47 | 87·9 (85·7–89·8) |
0·69 |
| Hispanic | 82·8 (81·4–84·1) |
89·9 (88·7–90·9) |
83·6 (82·2– 84·9) |
90·4 (89·3–91·4) |
84·2 (78·1–88·7) |
90·2 (84·9–93·7) |
||||||
| Non-Hispanic Black | 81·8 (79·3–84·0) |
89·7 (87·6–91·4) |
82·0 (79·2– 84·4) |
90·1 (87·9–92·0) |
81·9 (75·3–86·8) |
88·6 (82·9–92·5) |
||||||
| Non-Hispanic Asian | 88·1 (85·5–90·3) |
93·6 (91·5–95·1) |
88·5 (85·7– 90·7) |
94·1 (92·0–95·7) |
86·6 (76·3–92·6) |
90·4 (80·7–95·4) |
||||||
| Non-Hispanic Other | 82·8 (76·4–87·6) |
88·9 (83·2–92·7) |
83·7 (76·9–88·6) |
89·0 (83·0–93·0) |
80·0 (51·5–92·8) |
90·0 (63·2–97·6) |
||||||
| Socioeconomic Status | ||||||||||||
| US Medicaid | 83·1 (82·0–84·2) |
<0·0001 | 90·2 (89·4–91·1) |
<0·0001 | 83·9 (82·8–85·0) |
<0·0001 | 90·9 (90·0–91·7) |
<0·0001 | 82·6 (78·4–86·1) |
0·42 | 87·9 (84·2– 90·8) |
0·66 |
| US Private | 86·3 (85·6–86·9) |
92·5 (91·9–92·9) |
87·0 (86·3–87·6) |
93·2 (92·6– 93·6) |
84·1 (81·7–86·2) |
89·6 (87·6–91·3) |
||||||
| International | 89·0 (87·7–90·2) |
95·0 (94·0–95·8) |
90·2 (88·8–91·4) |
95·9 (95·0–96·7) |
80·3 (73·6–85·4) |
86·9 (81·0–91·1) |
||||||
EFS – Event-free survival; N – Number; OS – Overall survival; US – United States; P - log rank test p values
Five-year EFS was highest in International patients (89·0% (95% CI 87·7–90·2) ) and lowest among US patients with Medicaid (83·1% (95% CI 82·0–84·2) ) while those US patients with other types of insurance (mainly private) had intermediate outcomes (86·3% (95% CI 85·6–86·9) ) (p<0·0001). The same pattern was seen in 5-year OS (International 95·0 (95% CI 94·0–95·8)) vs. 92·5% (95% CI 91·9–92·9) vs. US Medicaid 90·2% (95% CI 89·4–91·1) p<0·0001). When stratified by B- vs. T-ALL, disparities were again restricted to patients with B-ALL and not seen among T-ALL patients (Table 2).
Appendix p 6 shows the results of multivariable models of EFS and OS including different combinations of race/ethnicity, insurance status, and disease prognosticators among the full cohort. Patterns of attenuation varied by race/ethnicity. The increased risk of an event experienced by Hispanic patients [hazard ratio (HR) 1·37, 95th confidence interval (95CI) 1·26–1·49; p<0·0001) was partially attenuated by adjusting for disease prognosticators [ adjusted HR (aHR) 1·17, 95CI 1·06–1·29; p<0·0001) or insurance status (aHR 1·30, 95CI 1·19–1·42; p<0·0001), and largely attenuated by both (aHR 1·11, 95CI 1·00–1·22; p=0·045). In contrast, the increased risk experienced by non-Hispanic Black patients was only minimally attenuated by adjusting for insurance status and disease prognosticators, decreasing from a HR of 1·45 (95CI 1·28–1·65; p<0·0001) to 1·32 (95CI 1·14–1·52; p<0·0001). Across racial/ethnic groups experiencing inferior outcomes, disparities in OS exceeded those in EFS. This was particularly notable among patients categorized as non-Hispanic Other (N=338), with an adjusted HR in EFS of 1·33 (95CI 0·98–1·79; p=0·068) but an adjusted HR in OS of 1·77 (95CI 1·21–2·59; p=0·0030). Patterns of attenuation in OS were similar to those seen in EFS (Appendix p 6). The above patterns of disparities and attenuation were restricted to B-ALL patients (Table 3) and not observed in T-ALL (Appendix p 7). Among non-Hispanic Black B-ALL patients, the unadjusted EFS risk (HR 1·55, 95CI 1·34–1·79; p<0·001) decreased only minimally when adjusted for disease prognosticators and insurance status (HR 1·46, 95CI 1·24–1·71; p<0·001). By contrast, among non-Hispanic Black T-ALL patients, the lack of any increased EFS risk seen in unadjusted analyses (HR 1·00, 95CI 0·73–1·37; p=0·99) remained unchanged after adjustment (HR 0·96, 95CI 0·69–1·34; p=0·81). Similarly, in contrast to those with B-ALL, Hispanic children with T-ALL showed equivalent EFS to non-Hispanic White children in both unadjusted (HR 0·86, 95CI 0·62–1·19; p=0·37) and adjusted (aHR 0·87, 95CI 0·61–1·23; p=0·81) analyses. Among B-ALL patients, Hispanic, non-Hispanic Black, and non-Hispanic Other patients experienced higher cumulative incidences of relapse, isolated bone marrow relapse, relapses involving the CNS, testicular relapse, and death in remission (Table 4). Relapses in these three ethnic/racial groups occurred earlier than in non-Hispanic White or non-Hispanic Asian patients (Table 4 and Appendix p 8). The proportion of relapses occurring late (>36 months from diagnosis) was 50·3% (557/1,107), 39·9% (173/434), and 34·4% (57/166) among non-Hispanic White, Hispanic, and non-Hispanic Black children respectively (p<0·0001). The risk of Induction failure did not statistically significantly differ by race/ethnicity, though a non-significant higher rate was seen among non-Hispanic Other patients. No differences in specific causes of treatment failure were seen in T-ALL. As expected, the median [Q1-Q3] time to relapse was shorter in T-ALL (425 days [257–825]) than B-ALL (1018 days [588–1449], p<0·0001), but there was no significant difference in median time to relapse among different racial/ethnic groups in T-ALL.
Table 3.
Multivariable models of event-free and overall survival among patients with B-ALL
| Model 1 | Model 2 | Model 3 | Model 4 | |
|---|---|---|---|---|
| Race/Ethnicity | Race/Ethnicity and Disease Prognosticators | Race/Ethnicity and Insurance Status | Race/Ethnicity, Insurance Status, and Disease Prognosticators | |
| Event-Free Survival | ||||
| Non-Hispanic White | Ref | Ref | Ref | Ref |
| Hispanic | 1·41 | 1·21 | 1·36 | 1·13 |
| 1·29–1·55 (p<0·001) | 1·79–2·28 (p<0·001) | 1·22–1·51 (p<0·001) | 1·01–1·25 (p=0·030) | |
| Non-Hispanic Black | 1·55 | 1·55 | 1·53 | 1·46 |
| 1·34–1·79 (p<0·001) | 1·33–1·81 (p<0·001) | 1·30–1·79 (p<0·001) | 1·24–1·71 (p<0·001) | |
| Non-Hispanic Asian | 0·94 | 1·04 | 1·00 | 1·06 |
| 0·77–1·14 (p=0·52) | 0·84–1·28 (p=0·73) | 0·81–1·24 (p=0·99) | 0·86–1·31 (p=0·60) | |
| Non-Hispanic Other | 1·39 | 1·3 | 1·39 | 1·31 |
| 1·03–1·88 (p=0·030) | 0·93–1·81 (p=0·13) | 1·00–1·93 (p=0·053) | 0·94–1·82 (p=0·12) | |
| Overall Survival | ||||
| Non-Hispanic White | Ref | Ref | Ref | Ref |
| Hispanic | 1·56 | 1·36 | 1·52 | 1·22 |
| 1·38–1·77 (p<0·001) | 1·18–1·56 (p<0·001) | 1·32–1·75 (p<0·001) | 1·06–1·41 (p=0·0070) | |
| Non-Hispanic Black | 1·7 | 1·77 | 1·74 | 1·62 |
| 1·41–2·06 (p<0·001) | 1·44–2·18 (p<0·001) | 1·41–2·15 (p<0·001) | 1·31–2·01 (p<0·001) | |
| Non-Hispanic Asian | 1·00 | 1·09 | 1·1 | 1·12 |
| 0·77–1·31 (p=1·00) | 0·81–1·46 (p=0·59) | 0·82–1·48 (p=0·54) | 0·83–1·51 (p=0·47) | |
| Non-Hispanic Other | 1·88 | 1·86 | 1·94 | 1·94 |
| 1·31–2·69 (p=0·0010) | 1·23–2·82 (p=0·0040) | 1·28–2·94 (p=0·0020) | 1·27–2·95 (p=0·0020) | |
Numbers represent hazard ratios and 95th percentile confidence intervals. Bolded values represent p<0.05
Models including “Disease Prognosticators” included age (<1 year vs. 1–4 vs. 5–9 vs. 10–14 vs. ≥15), sex, white blood cell count (<50 vs. ≥50), central nervous system status (CNS1 vs. CNS2 vs. CNS3), cytogenetics (favorable vs. neutral vs. unfavorable), and end-Induction minimal residual disease (<0.01% vs. 0.01–<0.1 vs. 0.1–<1 vs. ≥1)
Table 4.
5-year cumulative incidence rates of various causes of treatment failure(95% CI), by race/ethnicity
| Overall (N=21,152) |
Non-Hispanic White (N=13,872) |
Hispanic (N=4,354) |
Non-Hispanic Black (N=1,517) |
Non-Hispanic Asian (N=1,071) |
Non-Hispanic Other (N=338) |
P | |
|---|---|---|---|---|---|---|---|
| B-ALL | |||||||
| Relapse | 9·5 (9·1–9·9) | 8·6 (8·1–9·1) | 11·2 (10·1–12·2) | 14·3 (12·3–16·5) | 7·6 (5·9–9·5) | 10·8 (7·3–15·1) | <0·001 |
| Isolated BM relapse | 5·5 (5·2– 5·9) | 5·0 (4·6–5·4) | 6·5 (5·8–7·4) | 8·5 (7·0–10·3) | 4·6 (3·3–6·2) | 6·5 (3·8–10·1) | <0·001 |
| Relapse involving the CNS | 2·9 (2·6–3·1) | 2·6 (2·4–2·9) | 3·5 (2·9–4·1) | 3·9 (2·9–5·2) | 1·6 (0·9–2·6) | 3·6 (1·7–6·4) | 0·0021 |
| Testicular relapse | 0·4 (0·3– 0·5) | 0·3 (0·2–0·5) | 0·4 (0·2–0·7) | 0·9 (0·5–1·7) | 0·8 (0·3–1·6) | 0·0 (0·0–0·0) | 0·047 |
| Median time to relapse [days, (IQR)] | 1022 (595–1455) | 1099 (630–1522) | 930 (564–1371) | 812·5 (457–1289) | 1106·5 (771–1375) | 882 (585–1343) | <0·001 |
| Induction death | 0·8 (0·7–1·0) | 0·8 (0·6–0·9) | 1·0 (0·8–1·4) | 0·7 (0·3–1·3) | 0·8 (0·4–1·5) | 1·5 (0·5– 3·5) | 0·37 |
| Death in remission | 1·9 (1·7–2·1) | 1·6 (1·4–1·8) | 2·8 (2·3–3·4) | 2·0 (1·3–3·0) | 1·8 (1·1–2·9) | 3·7 (1·9– 6·4) | <0·001 |
| Second malignant neoplasm | 0·5 (0·4–0·6) | 0·4 (0·3– 0·6) | 0·6 (0·4– 0·9) | 0·4 (0·1– 0·9) | 1·0 (0·5– 2·0) | 0·4 (0·0– 1·9) | 0·41 |
| T-ALL | |||||||
| Relapse | 9·3 (8·0–10·7) | 9·9 (8·3– 11·7) | 7·5 (4·7– 11·2) | 9·3(6·1– 13·3) | 6·8 (3·0– 12·8) | 6·7 (1·1– 19·5) | 0·66 |
| Isolated BM relapse | 3·3 (2·5–4·2) | 3·3 (2·4– 4·4) | 2·8 (1·3– 5·5) | 3·7 (1·8– 6·6) | 4·9 (1·8– 10·3) | 0·0 (0·0–0·0) | 0·54 |
| Relapse involving the CNS | 4·5 (3·6–5·5) | 5·0 (3·8– 6·3) | 3·9 (2·0– 6·8) | 4·0 (2·1– 7·0) | 1·9 (0·4– 6·2) | 3·3 (0·2– 14·8) | 0·55 |
| Testicular relapse | 0·1 (0·0–0·3) | 0·1 (0·0–0·5) | 0·0 (0·0–0·0) | 0·0 (0·0–0·0) | 0·0 (0·0–0·0) | 0·0 (0·0–0·0) | 0·97 |
| Median time to relapse [days, (IQR)] | 425 (269–835) | 443·5 (273–868) | 514 (321–1166) | 333·5 (188–491) | 344·5 (156–1089) | 793 (410–1176) | 0·22 |
| Induction death | 0·7 (0·4–1·2) | 0·8 (0·4– 1·4) | 0·8 (0·2– 2·5) | 0·0 (0·0–0·0) | 0·9 (0·1– 4·6) | 3·3 (0·2– 14·8) | 0·31 |
| Death in remission | 3·4 (2·7–4·3) | 2·9 (2·1– 4·0) | 4·3 (2·3– 7·4) | 5·7 (3·2– 9·0) | 2·9 (0·8– 7·5) | 0·0 (0·0–0·0) | 0·19 |
| Second malignant neoplasm | 1·2 (0·8–1·8) | 1·2 (0·7– 2·0) | 1·7 (0·6– 4·0) | 0·8 (0·2– 2·8) | 1·0 (0·1– 4·7) | 0·0 (0·0–0·0) | 0·18 |
BM – Bone marrow; CNS – Central nervous system; IQR – Interquartile range; P – Gray’s test p-value
The association of disease prognosticators with EFS was relatively constant across race/ethnicity (Appendix p 9–10). Univariate and multivariable predictors of end-Induction MRD positivity (≥0·01%) are shown in Appendix p 11. When adjusted for other prognosticators and insurance status, among B-ALL patients and relative to non-Hispanic White patients, non-Hispanic Other children were more likely to be MRD-positive [adjusted odds ratio (aOR) 1·38, 95CI 1·0–1·8; p=0·031], Hispanic children were at no increased risk, and non-Hispanic Black children were less likely to be MRD-positive (aOR 0·81, 95CI 0·69–0·95; p=0·011). Among T-ALL patients, only non-Hispanic Black children were at increased risk of being end-Induction MRD-positive (aOR 1·47, 95CI 1·1–2·0; p=0·0090).
DISCUSSION
We found substantial outcome disparities by race/ethnicity not fully explained by imbalances in traditional disease prognosticators or insurance status. Patterns of attenuation varied between racial/ethnic groups. Disparities were restricted to patients with B-ALL, and disparities were greater in OS than in EFS.
Racial and ethnic disparities in cancer outcomes have been variably attributed to differences in tumour biology, chemotherapy metabolism, comorbidities, adherence, clinical trial enrollment, and access and/or structural barriers to care.20 In an analysis of 8,447 children on ALL clinical trials between 1983–1995, Black and Hispanic patients were at 30–40% increased risk of an event even when adjusted for disease prognosticators.2 Interestingly, in a subgroup analysis, the increased risk seen among Black children persisted when adjusted for parental education and household income, while that of Hispanic children did not.2 A subsequent analysis from St. Jude Children’s Research Hospital found that while Black children in SEER registries experienced inferior survival compared to White children, those at St. Jude did not, leading to the conclusion that “access to comprehensive treatment” may eliminate racial disparities.8 This study was limited by relatively small sample sizes (908 ALL patients, 158 of whom were Black), did not adjust for other prognosticators, likely prone to selection bias, and of uncertain generalizability. Finally, Hunger et al. showed that while outcomes for all racial and ethnic groups with ALL enrolled in COG trials improved between 1990–2005, disparities between groups persisted.3 In our contemporaneous and clinically annotated cohort, the largest assembled for this purpose, substantial outcome differences by race/ethnicity persist. This was particularly notable among Hispanic (aHR 1·11; p=0·045) and non-Hispanic Black (aHR 1·32; p<0·0001) patients. It is possible that residual mediation by disease biology or SES exists despite accounting for multiple disease prognosticators and for insurance status. For example, we did not have data on the presence of Ph-like ALL, a high-risk subtype of B-ALL more prevalent among Hispanic children.7 Importantly, Ph-like and other high-risk subtypes of ALL are associated with traditional adverse outcome predictors (e.g. high WBC, high end-Induction MRD).21 Adjusting for these prognosticators thus partially accounts for unmeasured genetic subtypes that manifest as higher risk disease. This may explain why adjustment led to partial attenuation of risk among Hispanic patients (HR 1·37 (p<0·0001) to 1·11 (p=0·045)). This pattern of attenuation was not seen in non-Hispanic Black patients, suggesting that despite traditional disease factors having prognostic value among such patients as seen in Appendix p 9, other factors are responsible for their inferior outcomes. Indeed, when adjusted for other disease prognosticators, non-Hispanic Black children with B-ALL were more likely to be MRD-negative at end-Induction than non-Hispanic White children. Comorbidities potentially associated with outcome and difference in pharmacogenomics were also unmeasured may account for a portion of the disparities still observed. As insurance status is an imperfect proxy of SES, residual mediation by other social determinants of health almost certainly play a role. Collecting modifiable measures of SES that provide targets for interventions would be of significant benefit.
An important mechanism relates to differences in access to and quality of care across race and ethnicity, which have been demonstrated in general and subspecialty pediatrics,22,23 and adult oncology,24,25 but are relatively unstudied in childhood leukaemia. While treated on clinical trials at centres offering specialized care, there may still have been differences in standardized diagnostic workups, time to treatment initiation, provision of family education, time spent with providers, and supportive care.26 Research focused on racial and ethnic disparities in these metrics is warranted. Indeed, the extent to which and how care provided by childhood cancer institutions systematically differs by race or ethnicity, often termed structural or implicit racism, is an area in urgent need of further investigation to identify solutions and interventions aimed at redressing such differences.
In addition to describing race/ethnicity-based disparities, some of our findings implicate specific underlying mechanisms worthy of further study and which may serve as targets for future interventions. First, our finding that disparities were restricted to B-ALL is surprising given that treatment for B- and T-ALL are similar and delivered by the same institutions.11,12 As cytogenetic risk stratification of T-ALL lags B-ALL, disparities may be obscured if, for example, unknown favorable cytogenetic subgroups of T-ALL occur more frequently among Hispanic or non-Hispanic Black patients. Alternatively, this finding may indicate that a focus on mechanisms at play during Maintenance may be fruitful. The median time to relapse is 58% shorter in T-ALL than in B-ALL, suggesting that Maintenance may play a more important role in children with B-lineage disease; Maintenance-related mechanisms causing outcome disparities would thus be more relevant to B vs. T-ALL.12 Rates of non-adherence with Maintenance antimetabolite therapy are associated with relapse, though its contribution to overall race and ethnicity-based disparities is unknown.27 Care received during Maintenance (e.g. frequency, duration, and content of Maintenance visits, patterns of dose modification of antimetabolite therapy, achievement of target neutrophil ranges) may differ by race and ethnicity with consequent impact on outcome. Another intriguing consideration is whether the neutrophil ranges targeted during Maintenance are appropriate for all children. Baseline neutrophil levels vary by race, with Black persons having lower baseline levels.28 Therapy interruptions for low ANC may thus be more frequent and consequential in this group, a form of implicit bias created by guidelines based on normative values from majority populations. Future studies should examine all of these possibilities and how they may interact with findings of increased rates of and earlier timing of relapses in Hispanic and non-Hispanic Black patients.
Second, our finding of wider disparities in OS vs. EFS is uncommon among ALL risk factors, but is seen in other childhood cancers. Bona et al. found that children with high-risk neuroblastoma exposed to poverty experienced inferior EFS (HR 1·9) with a wider disparity in OS (HR 2·8).29 In ALL, this may in part be due to earlier relapses, seen in our and other cohorts, which are associated with worse prognosis,30 or with differences in cytogenetic risk profiles. However, disparities in access to novel immunotherapies and early phase clinical trials may also play a role and are worth of investigation. Concerningly, recent evidence noted that Black children had received more lines of prior therapy than White children prior to chimeric antigen receptor T-cell therapy, implying that lack of access may be relevant.31 Interestingly, these recent immunotherapies target B and not T-ALL, offering an additional possible mechanism for our findings of survival disparities in the former and not the latter.
Study strengths include the large cohort of uniformly treated children and availability of detailed clinical data. Beyond those mentioned above, additional limitations merit note. First, race and ethnicity data were missing in 15% of patients. Though outcomes were similar, the distribution of race and ethnicity among included and excluded patients may be different. Barriers to either clinical trial enrolment or to accurate reporting of demographics that vary by race and ethnicity limit our understanding of the full spectrum of disease and outcomes across the population. Second, race and ethnicity were obtained from demographic forms completed at the time of diagnosis. Though ideally obtained directly from patients and families, it is possible that other methods may have been used, including chart abstraction or the perception of the person completing the form. Despite this heterogeneity, we demonstrated significant differences in outcome. Studies evaluating genetic ancestry in childhood ALL have also demonstrated disparities in outcome.32 Given this challenge, efforts within COG are underway to improve the quality of race and ethnicity data collection. Third, though our distribution of race/ethnicity reflects that seen in population-based registries,33 patients enrolled on clinical trials may not be representative of the general population in other ways. Disparities in the broader population of children with ALL treated outside the setting of a clinical trial may well be wider than those seen in our cohort. Fourth, though children classified as non-Hispanic Other also had substantially inferior outcomes, this population represents a heterogenous group of patients including Pacific Islanders, Indigenous populations, and patients of multi-racial backgrounds. Similarly, other categories also represent relatively crude groupings of heterogeneous populations. Further study of these smaller groups is required. Fifth, categorization of both insurance status and of race/ethnicity may have been less relevant to international populations. For example, Indigenous and First Nations populations in Canada, Australia, and New Zealand are likely poorly captured using current classifications. Discussions are ongoing on how to improve collection of relevant race and ethnicity data on COG trials going forward. Finally, we did not adjust for multiple comparisons.
In conclusion, disparities in ALL outcomes continue to exist across racial and ethnic groups, with Hispanic and non-Hispanic Black children experiencing inferior outcomes. These disparities are not fully explained by insurance status or disease biology, are restricted to patients with B-ALL, and are wider in OS than in EFS. Future research elucidating the mechanisms underlying these disparities should include studies of access to and quality of care, particularly during Maintenance therapy and among relapsed patients. A comprehensive understanding of race and ethnicity-based disparities will however also require minimizing barriers to clinical trial enrolment, collecting detailed and accurate demographic and socioeconomic data, and treatment guidelines that are proven to be relevant across populations. Together, these steps will ultimately allow the design of interventions that strive to eradicate racial and ethnic differences in outcome.
Supplementary Material
RESEARCH IN CONTEXT.
Evidence before this study
We searched Ovid Medline from database inception to January 1st, 2022 for studies on childhood (“child”) “acute lymphoblastic leukaemia” (ALL) which included as key terms “race” or “ethnicity”. We noted several studies which had previously documented race and ethnicity-based disparities in ALL outcomes that had variously attributed these disparities to imbalances in other disease prognosticators or socioeconomic status. The largest studies were conducted on patients treated 15 years ago or earlier.
Added value of this study
Using a cohort of over 21,000 contemporaneously treated patients, we showed that previously noted race and ethnicity-based disparities continue to persist in the current treatment era. Some of our findings also suggest specific mechanisms that may underlie these disparities not previously noted in the ALL literature. For example, wider disparities in overall vs. event-free survival suggest that mechanisms related to access to or quality of treatments for relapsed disease are important. In addition, we showed that disparities were restricted to patients with B-ALL and were not seen in patients with T-ALL, a novel finding that suggests that mechanisms related to the care received during the Maintenance phase of therapy are important in explaining outcome disparities given the larger role of Maintenance in B-ALL.
Implications of all the available evidence
Our findings combined with the previous literature show that racial and ethnic disparities in ALL outcomes persist in the current era. Specific mechanisms implicated by our findings should be the target of future studies that ultimately aim to inform targeted interventions to eliminate disparities in outcome.
ACKNOWLEDGEMENTS –
This study was supported by research funding from the National Cancer Institute of the National Institutes of Health under award numbers U10CA098543, U10CA098413, U10CA180886, and U10CA180899, and by St. Baldrick’s Foundation. The content is solely the responsibility of the authors and does not necessarily represent the official views of the National Institutes of Health.
Footnotes
DISCLOSURE OF INTERESTS – The authors declare no relevant conflicts of interest.
Publisher's Disclaimer: This is a PDF file of an unedited manuscript that has been accepted for publication. As a service to our customers we are providing this early version of the manuscript. The manuscript will undergo copyediting, typesetting, and review of the resulting proof before it is published in its final form. Please note that during the production process errors may be discovered which could affect the content, and all legal disclaimers that apply to the journal pertain.
DATA SHARING STATEMENT –
De-identified data from each of the included Children’s Oncology Group trials are available upon request to the relevant trial committees
REFERENCES
- 1.Wallace J, Jiang K, Goldsmith-Pinkham P, Song Z. Changes in racial and ethnic disparities in access to care and health among US adults at age 65 years. JAMA Int Med 2021; 181(9): 1207–15. [DOI] [PMC free article] [PubMed] [Google Scholar]
- 2.Bhatia S, Sather HN, Heerema NA, Trigg ME, Gaynon PS, Robison LL. Racial and ethnic differences in survival of children with acute lymphoblastic leukemia. Blood 2002; 100: 1957–64. [DOI] [PubMed] [Google Scholar]
- 3.Hunger SP, Lu X, Devidas M, et al. Improved survival for children and adolescents with acute lymphoblastic leukemia between 1990 and 2005: a report from the children’s oncology group. J Clin Oncol 2012; 30(4): 1663–9. [DOI] [PMC free article] [PubMed] [Google Scholar]
- 4.Hunger SP, Mullighan CG. Acute lymphoblastic leukemia in children. New Engl J Med 2015; 373: 1541–2. [DOI] [PubMed] [Google Scholar]
- 5.Vince RA, Eyrich NW, Mahal BA, Stensland K, Schaeffer EM, Spratt DE. Reporting of racial health disparities research: Are we making progress? J Clin Oncol 2021. [DOI] [PMC free article] [PubMed] [Google Scholar]
- 6.Lee C “Race” and “ethnicity” in biomedical research: how do scientists construct and explain differences in health? Soc Sci Med 2009; 68(6): 1183–90. [DOI] [PubMed] [Google Scholar]
- 7.Raca G, Abdel-Azim H, Yue F, et al. Increased Incidence of IKZF1 deletions and IGH-CRLF2 translocations in B-ALL of Hispanic/Latino children—a novel health disparity. Leukemia 2021; 35: 2399–402. [DOI] [PMC free article] [PubMed] [Google Scholar]
- 8.Pui CH, Pei D, Pappo AD, et al. Treatment outcomes in Black and White children with cancer: Results from the SEER database and St Jude Children’s Research Hospital, 1992 through 2007. J Clin Oncol 2012; 30(16): 2005–12. [DOI] [PMC free article] [PubMed] [Google Scholar]
- 9.Slopen N, Heard-Garris N. Structural racism and pediatric health: A call for research to confront the origins of racial disparities in jealth. JAMA Pediatr 2022; 176(1): 13–5. [DOI] [PubMed] [Google Scholar]
- 10.Bailey ZD, Krieger N, Agenor M, Graves J, Linos N, Bassett MT. Structural racism and health inequities in the USA: evidence and interventions. Lancet 2017; 389(10077): 1453–63. [DOI] [PubMed] [Google Scholar]
- 11.Larsen EC, Devidas M, Chen S, et al. Dexamethasone and High-Dose Methotrexate Improve Outcome for Children and Young Adults With High-Risk B-Acute Lymphoblastic Leukemia: A Report From Children’s Oncology Group Study AALL0232. J Clin Oncol 2016; 34(20): 2380–8. [DOI] [PMC free article] [PubMed] [Google Scholar]
- 12.Winter SS, Dunsmore KP, Devidas M, et al. Improved survival for children and young adults with T-lineage acute lymphoblastic leukemi: Results from the Children’s Oncology Group AALL0434 methotrexate randomization. J Clin Oncol 2018; 36(29): 2926–34. [DOI] [PMC free article] [PubMed] [Google Scholar]
- 13.Angiolillo A, Schore RJ, Kairalla J, et al. Excellent outcomes with reduced frequency of vincristine and dexamethasone pulses in Standard-Risk B-Lymphoblastic leukemia: Results from Children’s Oncology Group AALL0932. J Clin Oncol 2021; 39(13): 1437–47. [DOI] [PMC free article] [PubMed] [Google Scholar]
- 14.Salzer WL, Burke MJ, Devidas M, et al. Impact of intrathecal triple therapy versus intrathecal methotrexate on disease-free survival for high-risk B-lymphoblastic leukemia: Children’s Oncology Group Study AALL1131. J Clin Oncol 2020; 23: 2628–38. [DOI] [PMC free article] [PubMed] [Google Scholar]
- 15.Teachey DT, Devidas M, Wood BL, et al. Children’s Oncology Group trial AALL1231 A phase III clinical trial testing bortezomib in newly diagnosed T-cell acute lymphoblastic leukemia and lymphoma. J Clin Oncol 2022. [DOI] [PMC free article] [PubMed] [Google Scholar]
- 16.Kaplan E, Meier P. Nonparametric estimation from incomplete observations. J Am Stat Assoc 1958; 53: 457–81. [Google Scholar]
- 17.Peto R, Pike MC, Armitage P, et al. Design and analysis of randomized clinical trials requiring prolonged observation of each patient. II. analysis and examples. Br J Cancer 1977; 35(1): 1–39. [DOI] [PMC free article] [PubMed] [Google Scholar]
- 18.Putter H, Fiocco M, Geskus RB. Tutorial in biostatistics: competing risks and multi-state models. Stat Med 2007; 26: 2389–430. [DOI] [PubMed] [Google Scholar]
- 19.Bhatnagar B, Kohlschmidt J, Mrozek K, et al. Poor survival and differential impact of genetic features of Black patietns with acute myeloid leukemia. Cancer Discov 2021; 11(3): 626–37. [DOI] [PMC free article] [PubMed] [Google Scholar]
- 20.Zavala VA, Bracci PM, Carethers JM, et al. Cancer health disparities in racial/ethnic minorities in the United States. Br J Cancer 2021; 124(2): 315–32. [DOI] [PMC free article] [PubMed] [Google Scholar]
- 21.Roberts KG, Li Y, Payne-Turner D, et al. Targetable kinase-activating lesions in Ph-like acute lymphoblastic leukemia. N Engl J Med 2014; 371(11): 1005–15. [DOI] [PMC free article] [PubMed] [Google Scholar]
- 22.Raman J, Johnson TJ, Hayes K, Balamuth. Racial differences in sepsis recognition in the emergency department. Pediatrics 2019; 144(4): e20190348. [DOI] [PubMed] [Google Scholar]
- 23.Lai CW, Lipman TH, Willi SM, Hawkes CP. Racial and ethnic disparities in rates of continuous glucose monitor initiation and continued use in children with type 1 diabetes. Diabetes Care 2020; 44(1): 255–7. [DOI] [PubMed] [Google Scholar]
- 24.Sparano JA, Brawley OW. Deconstructing racial and ethnic disparities in breast cancer. JAMA Oncol 2021; 7(3): 355–6. [DOI] [PubMed] [Google Scholar]
- 25.Adamson BJS, Cohen AB, Gross CP, et al. ACA medicaid expansion association with racial disparity reductions in timely cancer treatment. Am J Manag Care 2021; 27(7): 274–81. [DOI] [PubMed] [Google Scholar]
- 26.Teichman J, Punnett A, Gupta S. Development of quality metrics to evaluate pediatric hematologic oncology care in the outpatient setting. J Pediatr Hematol Oncol 2017; 39(2): 90–6. [DOI] [PubMed] [Google Scholar]
- 27.Bhatia S, Landier W, Hageman L, et al. 6MP adherence in a multiracial cohort of children with acute lymphoblastic leukemia: a Children’s Oncology Group study. Blood 2014; 124(15): 2345–53. [DOI] [PMC free article] [PubMed] [Google Scholar]
- 28.Hsieh MM, Everharr JE, Byrd-Holt DD, Tisdale JF, Rodgers GP. Prevalence of neutropenia in the U.S. population: Age, sex, smoking status, and ethnic differences. Ann Intern Med 2007; 146(7): 486–92. [DOI] [PubMed] [Google Scholar]
- 29.Bona K, Li Y, Winestone LE, et al. Poverty and targeted immunotherapy: Survival in Children’s Oncology Group clinical trials for high-risk neuroblastoma. J Natl Cancer Inst 2021; 113(3): 282–91. [DOI] [PMC free article] [PubMed] [Google Scholar]
- 30.Bona K, Blonquist TM, Neuberg DS, Silverman LB, Wolfe J. Impact of socioeconomic status on timing of relapse and overall survival for children treated on Dana-Farber Cancer Institute ALL Consortium protocols (2000–2010). Pediatr Blood Cancer 2016; 63(6): 1012–8. [DOI] [PubMed] [Google Scholar]
- 31.Baggott C, Prabhu S, Phillips CL, et al. Inferior outcomes among black patients with childhood acute lymphoblastic leukemia following tisagenlecleucel. 2021. https://tct.confex.com/tct/2021/meetingapp.cgi/Paper/18094 (accessed December 20 2021).
- 32.Yang JJ, Cheng C, Devidas M, et al. Ancestry and pharmacogenomics of relapse in acute lymphoblastic leukemia. Nat Genetics 2011; 43(3): 237–41. [DOI] [PMC free article] [PubMed] [Google Scholar]
- 33.Zhao Y, Wang Y, Ma S. Racial differences in four leukemia subtypes: Comprehensive descriptive epidemiology. Sci Rep 2018; 8(548). [DOI] [PMC free article] [PubMed] [Google Scholar]
Associated Data
This section collects any data citations, data availability statements, or supplementary materials included in this article.
Supplementary Materials
Data Availability Statement
De-identified data from each of the included Children’s Oncology Group trials are available upon request to the relevant trial committees