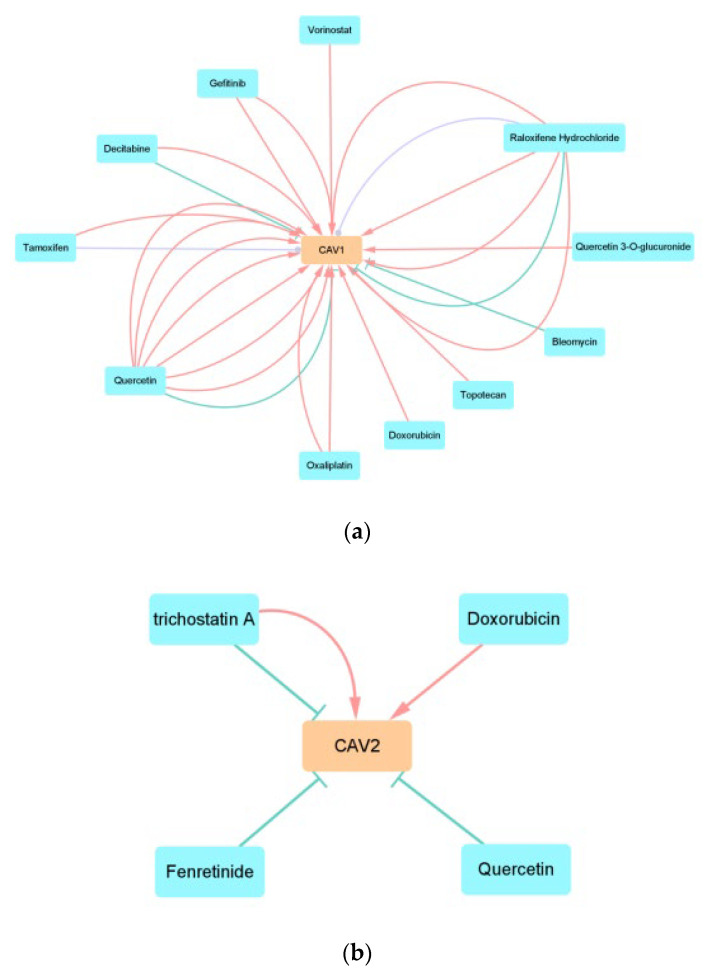
Figure 10.
We construct the CAV–drug interaction network with the two genes and anticancer drugs. (a,b) T represents that the drug can decrease the expression of the gene, delta represents that the drug can increase the expression of the gene, and the circle represents that the drug can affect the expression of the gene. The number of lines represents the number of previous studies.

