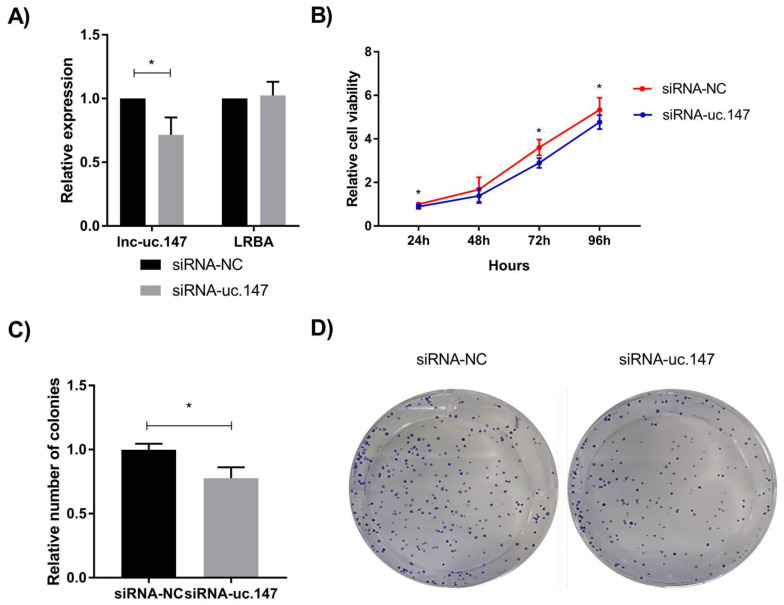
Figure 1.
Cell viability and colony formation assays of lnc-uc.147 in HepG2 cells. (A) Relative expression levels of lnc-uc.147 and the host gene LRBA after treatment with a siRNA-uc.147 compared to negative control (siRNA-NC). Data normalized by the endogenous controls GAPDH/U6 and the negative control. (B) Cell viability in HepG2 cells after treatment with siRNA uc.147 (blue line) and siRNA-NC (red line) at 24, 48, 72, and 96 h. (C) Relative number of HepG2 colonies after siRNA treatment. (D) Representative plates of colony formation. For all experiments, three independent experiments are represented. Statistical differences were evaluated using the Student t-test. * p < 0.05.

