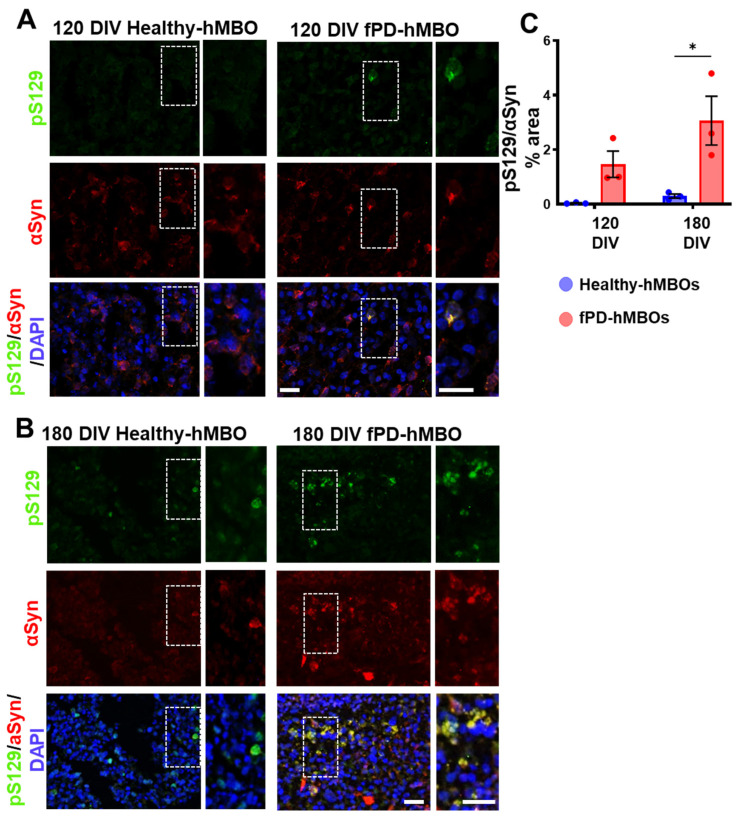
Figure 3.
Accumulation of pathological αSyn in fPD-hMBOs. Representative images from healthy hMBOs and fPD-hMBOs, immunostained for pS129 (green) and αSyn (red), at 120 DIV (A) and 180 DIV (B). Nuclei were stained with DAPI (blue). Dotted squares represent the magnified areas shown on the right side of the main image to highlight the juxtanuclear accumulation of phosphorylated αSyn. The scale bar is 50 µm. (C). Immunostaining quantification at 120 and 180 DIV of pS129 normalized with total αSyn area. Values represent mean +/− standard error of mean (SEM) from n = 3 hMBOs per group. Three sections were analyzed from each hMBO. The results were analyzed using two-way ANOVA [SNCA copy number: F (1, 8) = 16.96, p = 0.0034; time: F (1, 8) = 3.308, p = 0.5318; SNCA copy number x time: F (1, 8) = 1.734, p = 0.2243)] followed by the Tukey post hoc multiple comparisons test. * p < 0.05.

