

Abstract
Integrating light-harvesting materials with microbial biochemistry is a viable approach to produce chemicals with high efficiency from the air, water, and sunlight. Yet it remains unclear whether all absorbed photons in the materials can be transferred through the material-biology interface for solar-to-chemical production and whether the presence of materials beneficially affect the microbial metabolism. Here we report a microbe-semiconductor hybrid by interfacing CO2/N2-fixing bacterium Xanthobacter autotrophicus with CdTe quantum dots for light-driven CO2 and N2 fixation with internal quantum efficiencies of 47.2 ± 7.3% and 7.1 ± 1.1%, respectively, reaching the biochemical limits of 46.1% and 6.9% imposed by the stoichiometry in biochemical pathways. Photophysical studies suggest fast charge-transfer kinetics at the microbe-semiconductor interfaces, while proteomics and metabolomics indicate a material-induced regulation of microbial metabolism favoring higher quantum efficiencies compared to the biological counterparts alone.
Editor summary:
Material-microbe hybrids represent a promising strategy for harnessing biochemical reactivity using sunlight, yet little is known about the effect of the interaction on the organism. Here, the interface of a CO2 and N2 fixing bacterium to CdTe alters its biochemical pathways resulting in quantum efficiency close to the theoretical limit.
Graphical Abstract
Biological fixation of CO2 and N2 is critical in the global carbon and nitrogen cycles1,2 and generates vast amounts of organic matter for agriculture and industry3–6. One key metric in a photosynthetic process is the internal quantum yield (IQY) for the reduction of CO2 and N2, which is the percentage of absorbed photons yielding products through the biochemical machinery3. While natural photosynthetic light-absorbers are generally efficient in utilizing absorbed photons3, the observed quantum yield for CO2 fixation is usually no greater than 10%7,8 with the equivalent quantum yield of N2 fixation on the order of ~1–2 %9,10 (Extended Data Table 1) due to the presence of other biological processes such as the generation of adenosine triphosphate (ATP) via the oxidative phosphorylation process. Fast and targeted delivery of reducing equivalents from light-absorbers to biochemical machinery3,11 and suitable biochemical regulation that minimizes the consumption of reducing equivalents in ATP production12–15 are needed to maximize the IQYs in the biological fixation of CO2 and N2.
We envision that microbe-semiconductor hybrids are capable of approaching the theoretical quantum yield in the biochemical fixation of CO2 and N216–19. In these hybrids, semiconducting materials such as quantum dots (QDs) efficiently convert incident photons to reducing equivalents20,21, a prerequisite for maximizing quantum yield, and deliver the yielded reducing equivalents for the microbial fixation of CO2 and N24,5,19,22,23. It can be further hypothesized that the presence of solid-state materials and their provision of photo-generated reducing equivalents can alter microbial redox balance21,24 and the expression/regulation of biochemical pathways25 to minimize ATP consumption and other peripheral processes, hence potentially lifting the quantum yield of CO2/N2 fixation towards the theoretical limits imposed by the stoichiometry in biochemical reactions. However, the full potential of semiconductor-microbe hybrids in terms of maximizing photosynthetic quantum yields remains to be demonstrated, since the IQY values reported in those semiconductor-microbe hybrid systems are well below the theoretical IQY limits determined by the biochemical stoichiometry (Extended Data Table 1).
Here we report a microbe-QD hybrid for simultaneous photocatalytic fixation of CO2 and N2 with IQYs reaching the theoretical limits dictated by the stoichiometry of the biochemical processes. Integrating cadmium telluride (CdTe) QDs26,27 with CO2/N2-fixing, non-photosynthetic autotrophic bacterium Xanthobacter autotrophicus23,28 leads to a hybrid system with IQYs of 47.2 ± 7.3% and 7.1 ± 1.1% for photosynthetic fixation of CO2 and N2, respectively, comparable with the calculated upper limits of pure biochemical machinery. Results of photophysical, proteomic, and metabolomic characterizations suggest that the observed high IQYs are constructively contributed by the fast charge-transfer kinetics at the biological-material interface as well as the material-induced regulation of microbial metabolism being efficient in the utilization of photogenerated electrons.
Results
Theoretical IQY of biological machinery.
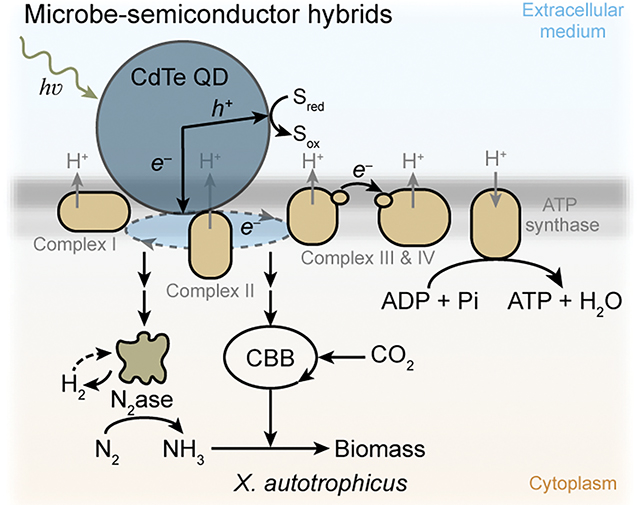
Besides the reducing equivalents directly involved in the reduction of CO2 and N2, the biological fixation of CO2 and N2 also demands ATP generated from oxidative phosphorylation that consumes photo-generated reducing equivalents (Fig. 1a). Therefore, the IQY of the biological machinery is fundamentally determined by the stoichiometry of a specific biological process. Here the definition of IQY follows the convention in photocatalysis20,29–31 and only considers the consumption of reducing equivalents directly involved in the redox-based net reaction (Supplementary Note 1). For the fixation of CO2 into central metabolites like acetyl coenzyme A (acetyl-CoA) by the Calvin-Benson-Bassham (CBB) cycle12, the upper limit of the photo-generated electrons can be used to reduce CO2 is 58.8% under a more favorable phosphate/oxygen ratio (P/O ratio) of 2.5 in oxidative phosphorylation32, even assuming a unity quantum yield for the generation of photo-excited reducing equivalents by light-absorbers in the photosystems3 (Fig. 1b, Supplementary Note 1). When it is desirable to simultaneously fix CO2 and N2 into typical biomass with a C: N molar ratio of 5: 133, the theoretical IQYs are ~46.1% and ~6.9% for the reduction of CO2 and N212, respectively (Fig. 1b, Supplementary Note 1). The oxidative phosphorylation process with a less favorable P/O ratio (e.g., 1.5) would lead to even lower IQYs for the relevant fixation reactions (Fig. 1b, Supplementary Note 1).
Fig. 1. Microbe-semiconductor hybrids for efficient photocatalytic fixation of CO2 and N2.

a, The biochemical pathways, (b) the theoretical upper-bounds of internal quantum yields for the fixation of CO2 and N2 into acetyl-CoA and NH3 (IQYC and IQYN, respectively), and (c) the detailed steps in the photocatalytic hybrid of cadmium telluride (CdTe) quantum dots (QDs) and CO2/N2-fixing bacterium Xanthobacter autotrophicus. Calculations of the theoretical values of IQYC and IQYN are available in Supplementary Note 1. hv, incident photon; e−, reducing equivalent; Sred/Sox, redox species in reduced/oxidized form; ADP/ATP, adenosine diphosphate/triphosphate; ETC, electron transport chain in oxidative phosphorylation; CBB, Calvin-Benson-Bassham cycle; N2ase, nitrogenase; acetyl-CoA, acetyl coenzyme A; P/O, phosphate/oxygen ratio in oxidative phosphorylation; H2 recycle, whether (+) or not (−) the H2 yielded in the step of N2 fixation on nitrogenase is recycled in the microbial metabolism; h+, photo-generated hole; Complex I, NADH-quinone oxidoreductase of ETC; Complex II, succinate dehydrogenase of ETC; Complex III, cytochrome bc1 complex of ETC; Complex IV, cytochrome c oxidase of ETC; Pi, phosphate. Schemes are not drawn to scale.
Light-driven N2 and CO2 fixations by the hybrid system.
A hybrid system composed of X. autotrophicus and CdTe QDs was constructed and subject to photocatalytic experiments with appreciable CO2 and N2 fixations (Fig. 1c). Autotrophically grown X. autotrophicus (ATCC 35674™)23,28 in an inorganic minimal medium without additional nitrogen or organic carbon source was mixed with commercially available CdTe QDs26, which are surface-functionalized with mercaptosuccinic acid for water dispersibility34 with a reported and validated emission quantum efficiency of 60%. Characterizations of electron microscopies revealed CdTe’s (220) crystalline plane in a cubic crystal structure (Extended Data Fig. 1a–1f). A luminescence emission at 566 nm suggests a bandgap of 2.19 eV (Extended Data Fig. 1g), which is consistent with the characterized diameter of ~3 nm35 (Extended Data Fig. 1). With the addition of cysteine as the sacrificial hole-scavenger20,29,36–38 (see more discussion in Supplementary Note 2), the hybrid of X. autotrophicus and CdTe QDs was subject to an illumination of 505 nm light-emitting diode (0.09 mW/cm2) in a gas environment of N2: O2: CO2 (79: 3: 18).
In a 4-day experiment, the optical density at 600 nm (OD600) of the hybrid system, a surrogate of biomass accumulation and hence CO2 fixation, was observed to be increased from 0.2 to 0.67 ± 0.03 with a 4-day microbial CO2 fixation of 242 ± 37 mg L−1 (entry 1 in Fig. 2a, n = 4, same below unless noted). The total nitrogen content (Ntot) of the hybrid-containing solution, including both the biomass and any soluble N contents, was quantified by a colorimetric method after persulfate digestion23. Significant N2 fixation was observed with a total nitrogen increase (ΔNtot) of 15.4 ± 2.4 mg L−1 after 4 days (entry 1 in Fig. 2b). The microbial viability throughout 4-day experiments was confirmed to be greater than 80% by flow cytometry with Live/Dead assay (Extended Data Fig. 2). The omission of QDs, the omission of a light source or the switch of a light source to 657-nm photons (below the bandgap of the QDs) failed to deliver consistent increases of OD600 and Ntot (entry 2, 3, and 4 in Fig. 2a and 2b, respectively). Moreover, introducing 15N-enriched N2 in a 4-day photocatalysis increased the existing biomass’s 15N-isotope abundance to 12.97 ± 0.23% (n = 3) for the microbe-semiconductor hybrid solution, while the absence of exogenous 15N2 only yielded a naturally occurring 15N abundance of 0.37 ± 0.00% (n = 3). Feeding the biohybrids with 15N-enriched N2 and 13CO2 during the photocatalysis led to the enrichment of 15N and 13C in intracellular metabolites such as essential amino acids (Supplementary Data File 1). Those experiments are consistent with a microbial fixation of CO2 and N2 simultaneously driven by photoexcitation on QDs.
Fig 2. The photocatalytic performance and physical interfaces of the microbe-semiconductor hybrids.
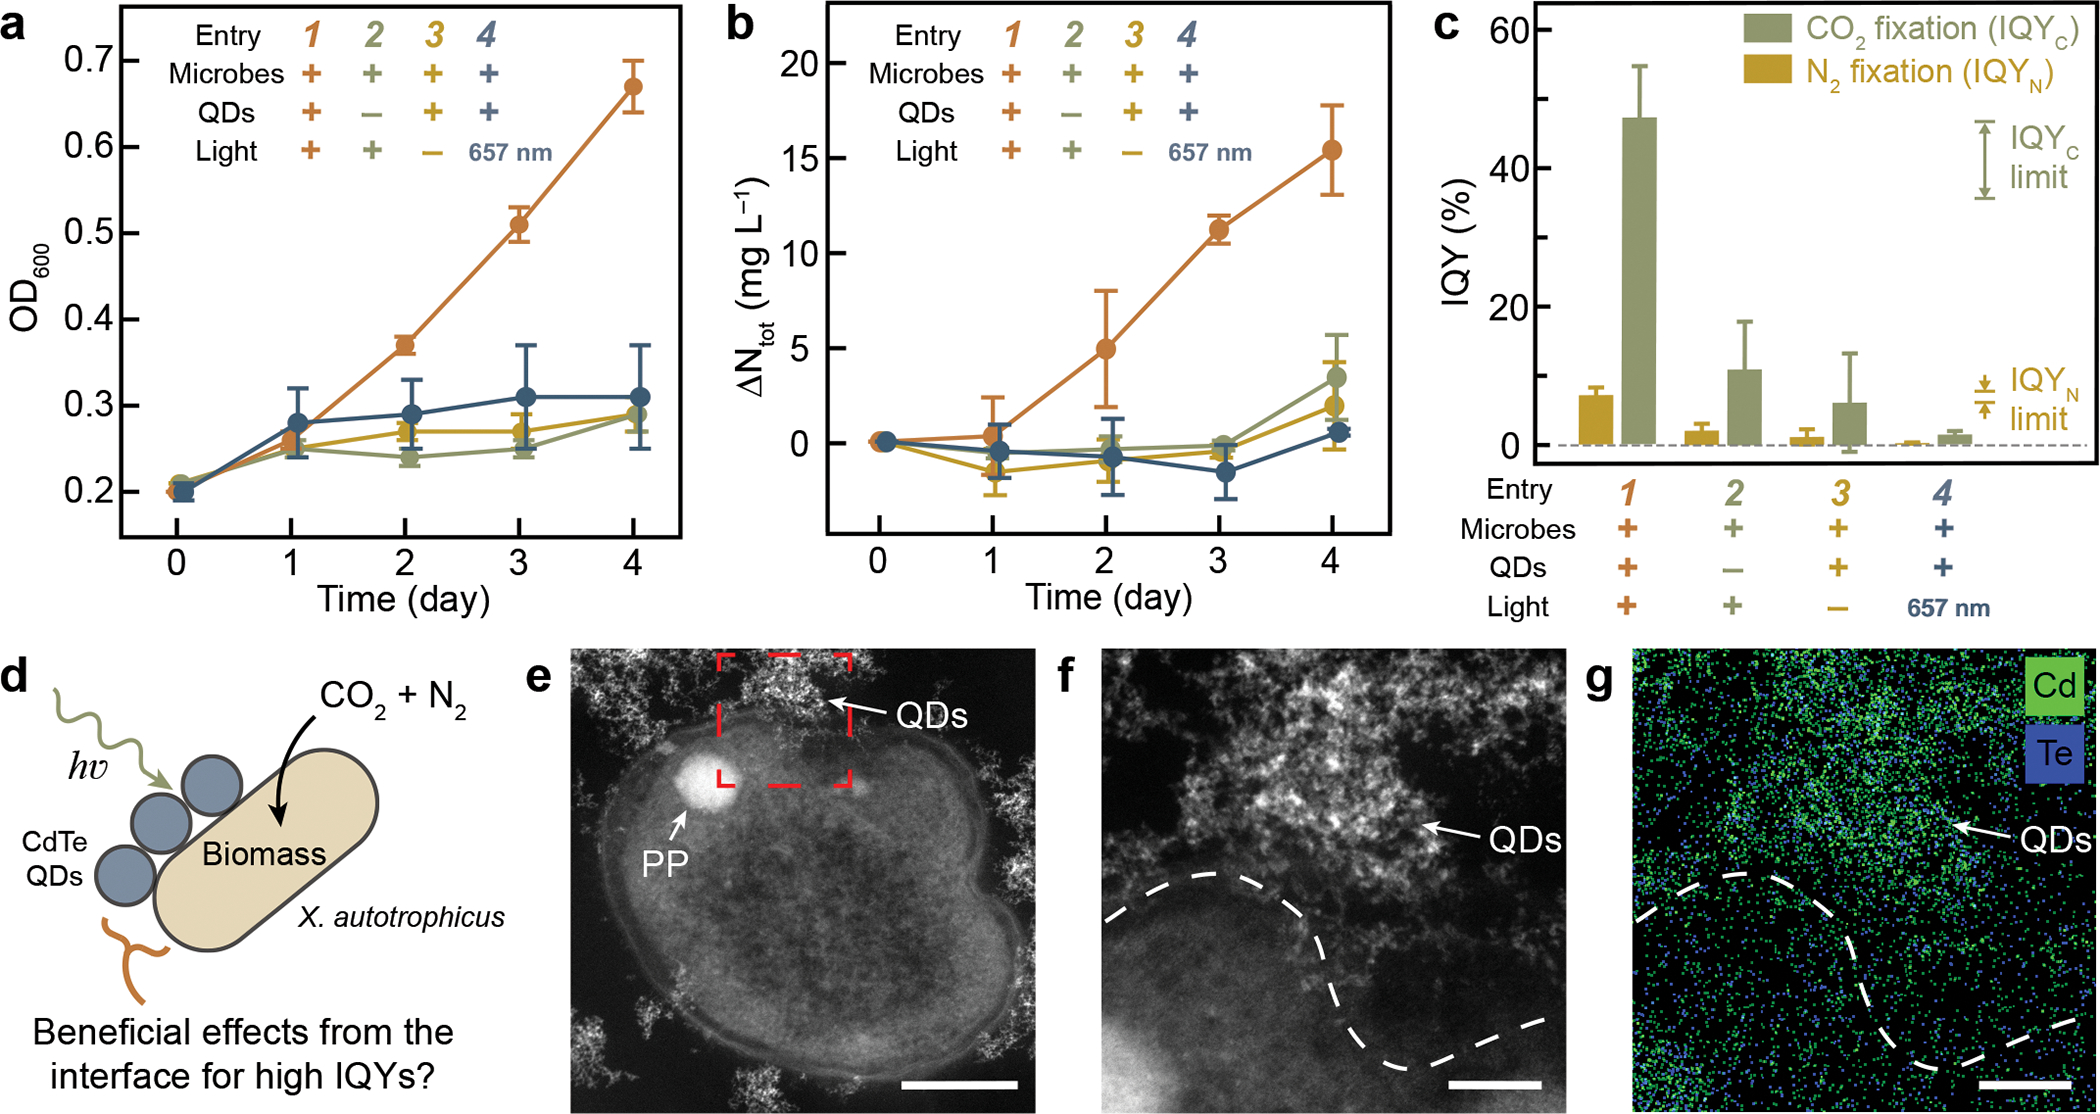
a, Optical density at 600 nm (OD600), (b) total nitrogen increase (ΔNtot), and (c) the experimentally observed IQYC and IQYN of the microbe-semiconductor hybrids (entry 1) along with other control conditions (entries 2–4). The theoretical limits of IQYC and IQYN calculated in Supplementary Note 1 are also displayed in c as references. n = 4 biological replicates, data are presented by the mean values +/− the standard deviations. d, Schematic illustration of the microbe-semiconductor interface. The scheme is not drawn to scale. e, HAADF-STEM image of the sectioned hybrid of X. autotrophicus and QDs (entry 1). PP, polyphosphate granule55. This experiment has been repeated independently for more than 3 times with similar results. f, Magnified HAADF-STEM image of the highlighted region in e. g, Overlapped EDS mappings of cadmium (Cd) and tellurium (Te) in f. The dashed lines represent the cell boundary. Scale bars are 200 nm in e, 50 nm in f and g.
The observed IQYs for both N2 and CO2 fixation reach the theoretical stoichiometric limits of biological N2 and CO2 fixation. Within 4 days, the IQYs for N2 and CO2 fixation are calculated as IQYN = 7.1 ± 1.1% and IQYC = 47.2 ± 7.3% (entry 1 in Fig. 2c) with estimated turnover frequency (TOF) values of 6.3×10³ s−1∙cell−1 and 3.7×10⁴ s−1∙cell−1, respectively. The resultant turnover numbers (TON) of N2 and CO2 fixation per cell within a 4-day experiment are estimated as 4.3×10⁹ cell−1 and 2.6×10¹⁰ cell−1, respectively. The determined IQYN and IQYC in photocatalysis are much higher than the ones in the controls without QDs, without light illumination, or with 657-nm illumination that is below the QD’s bandgap (entry 2, 3, and 4 in Fig. 2c, respectively). The observed IQYs are also higher than the equivalent IQYN and IQYC values of 4.5% and 28.0%, respectively, when H2 was fed as the reducing equivalents for autotrophic fixation of CO2 and N2 in X. autotrophicus23 (Supplementary Note 1). The hybrid system deserves more in-depth mechanistic investigations, as the experimentally obtained values of IQYN and IQYC are comparable to the suggested theoretical limits based on the presumed biological pathways (Fig. 1b and 2c).
Fast charge-transfer at the microbe-material interfaces.
Firstly, analysis of gas chromatography demonstrated no detectable H2 in the headspace of the photocatalytic reactor before and after the photocatalytic reaction (Extended Data Fig. 3), diminishing the prospect of an indirect H2-mediated charge transfer between QDs and microbes13,22,23. Hence, we hypothesize a direct interaction at the microbe-QD interface that is beneficial for the photocatalytic IQYs (Fig. 2d). To this end, high-angle annular dark-field scanning transmission electron microscopy (HAADF-STEM) and the corresponding energy-dispersive X-ray spectroscopy (EDS) (Fig. 2e–2g) studies clearly revealed clustered QDs in close contact with the microbes in the hybrid system, where the individual identity of the QD was retained (Extended Data Fig. 4a–4d). Given the presence of such microbe-semiconductor interfaces with microbial viability > 80% (Extended Data Fig. 2), we set to study the photophysical charge-transfer kinetics at the intimate physical interactions between the microbes and QDs and to investigate how the microbial metabolism responds upon such interaction.
Photophysical characterizations suggest a gradual establishment of fast delivery of photogenerated reducing equivalents at the microbe-semiconductor interface (Fig. 3a). Upon mixing the microbes with QDs under different conditions, we recorded the temporal evolution of the maximal photoluminescence intensity around 566 nm excited by 450-nm photons, which is indicative of the photon-excited states in the QDs (Fig. 3b). The CdTe QDs alone exhibited the strongest emission intensity and was generally photo-physically stable over time with an averaged lifetime of 49.4 ± 0.5 ns measured by a time-correlated single-photon counting technique (entry 5 in Fig. 3b and 3c); the separate additions of X. autotrophicus and cysteine to the QDs’ dispersions cast time-independent emission intensities decreased by about 6% and 43% with averaged lifetimes of 49.6 ± 0.5 ns and 48.3 ± 0.5 ns, respectively (entry 6 and 7 in Fig. 3b and 3c, respectively). Interestingly, combining QDs, microbes, and cysteine together (entry 1 in Fig. 3b) led to an initial emission intensity similar to the case of adding cysteine alone (entry 7 in Fig. 3b) but with a notably different time-dependent feature. In particular, the emission intensity gradually decayed to near nil within 8 hours with a much shorter averaged lifetime of 4.4 ± 0.3 ns after 24 hours (entry 1 in Fig. 3b and 3c). Since QD aggregation per se did not affect the photoluminescence properties (Extended Data Fig. 5), these data suggest that the assembly of QDs, microbes, and cysteine together gradually develops to a fast transfer of the light-induced charges between the QDs and microbes (Fig. 3a). The calculated rate constant of charge-transfer between the microbe-and the QDs, kET (2.1×10⁸ s−1), is much larger than the rate constants of radiative electron-hole recombination (kPL = 1.2×10⁷ s−1), the non-radiative recombination (kNR = 8×10⁶ s−1), and the quenching effect by cysteine (kQ = 1×10⁶ s−1).
Fig. 3. Photophysical characterizations of the microbe-semiconductor interface.

a, The photophysical processes in the photocatalytic hybrid (entry 1) and other controls (entries 5–8). b, The normalized photoluminescence (PL) intensity versus the time after assembly (t) under different conditions. c, The lifetime of photoexcited states at t = 24 hrs determined by the time-correlated single-photon counting, lifetimes are presented as the mean values from bi-exponential fittings +/− uncertainties. d, The time-correlated population distributions of X. autotrophicus bound with QDs under different conditions, as determined by experiments of flow cytometry. The populations on the right side of the dashed line suggest microbes bound with emissive QDs. e, The Stern-Volmer study that plots the inverse of normalized PL intensity (I0/I) versus the relative equivalence of quenchers (Cquencher/Cquencher,0) at t = 24 hrs. f, Schematics of dynamic quenching and static quenching. kET, the charge transfer at the microbe-semiconductor interface; kPL, the electron-hole recombination via radiative process; kNR, the electron-hole recombination via non-radiative process; kQ, the hole passivation by the provided hole scavenger. The schemes are not drawn to scale.
Additional experiments of flow cytometry observed the forward-scattered light (FSC) and the side-scattered light (SSC) of microparticles in the solution therefore identified individual X. autotriohicus cells (Extended Data Fig. 6a–6l), and further depicted the temporal evolution of the hybrid’s assembly. The emission at 525 ± 50 nm upon 488-nm excitation yielded a population distribution of microbes that are bound with enough emissive QDs and whose emission intensities exceed the microbial background at different time t after mixing all components (Fig. 3d). Compared with the bare microbial culture (entry 8 in Fig. 3d), the mixture of QDs and microbes showed an initial population of bacteria interacted with emissive QDs whose population gradually increased over 24 hours (entry 6 in Fig. 3d, Extended Data Fig. 6m). Yet the population of microbes with emissive QDs steadily decreased when microbes, QDs, and cysteine were assembled together (entry 1 in Fig. 3d, Extended Data Fig. 6m). As electron microscopy does not discern any differences for the microbe-QD interfaces with or without cysteine (Extended Data Fig. 4g), the additional cysteine promotes the quenching of QDs upon the attachment onto the microorganisms. The combination of QDs, microbes, and cysteine leads to an assembly of unique microbe-semiconductor interfaces in the reported photocatalysis.
The fast charge transfer at the microbe-semiconductor interface is contributed by the non-diffusive static quenching, concurrent with the microbe-QD interface (Fig. 2e–2g), in addition to the common diffusion-based dynamic quenching. Stern-Volmer plots – the inverse of normalized emission intensity (I0/I) versus the relative equivalence of quenchers (Cquencher/Cquencher,0) – displayed distinctive quenching mechanisms among different entries (Fig. 3e). The microbe-QD mixture without cysteine did not display noticeable quenching (entry 6 in Fig. 3e); the mixture of QDs with cysteine showed a linear relationship before saturation (entry 7 in Fig. 3e, Extended Data Fig. 7), suggesting a classic dynamic quenching originated from diffusive encounters between cysteine and QDs during the lifetime of photoexcited states39 (Fig. 3f). However, the combination of QDs, microbes, and cysteine yielded a super-linear relationship with a much-pronounced quenching effect (entry 1 in Fig. 3e) and indicates the coexistence of dynamic and static quenching mechanisms39. As static quenching originates from the formation of a nonfluorescent ground-state complex between the fluorophore and the quencher39 (Fig. 3f), we propose that the observed strong effect of static quenching, untenable from diffusive redox mediators, is generated from the gradually assembled microbe-semiconductor interfaces in the presence of cysteine and contributes to the large value of kET. As the value of kET is at least one order of magnitude larger than the ones of any other process, it becomes feasible to achieve near-unity efficiency in extracting photo-excited carriers from the QDs and delivering reducing equivalents to the microbes, a prerequisite for high IQYs observed in the photocatalysis.
Material-induced regulation of microbial metabolism.
In addition to the observed fast kinetics at the microbial-material interfaces, we have further conducted proteomic and metabolomic analyses to probe the microbial metabolisms during photocatalytic fixation of N2 and CO2. In particular, we compared the relative abundances of proteins, membrane proteins included, and intracellular metabolites in the microbe-semiconductor hybrids during photocatalysis (Hybrid (entry 1) in Fig. 2 and 4) to the ones in X. autotrophicus that autotrophically grown with H2 (H2-fed microbes in Fig. 4) (n ≥ 3), along with other control samples (Supplementary Data File 2–6). A total of 2,743 proteins and 110 metabolites were detected and identified. The score plots of principal component analysis (PCA) showed that both proteins (Fig. 4a) and metabolites (Fig. 4c) from Hybrid and H2-fed microbes were clustered into discriminative groups (95% confidence). Comparing Hybrid against H2-fed microbes, 727 proteins and 29 metabolites were significantly increased; 53 proteins and 27 metabolites were significantly decreased (fold change (FC) > 1.5 or < 0.66 and p-value < 0.0525) (Fig. 4b, 4d). The UniProt database was used for protein annotation and the Kyoto Encyclopedia of Genes and Genomes (KEGG) database was used for the analysis of biological pathways (Fig. 4e and 4f, Supplementary Data File 2).
Fig. 4. Proteomic and metabolomic analyses of the photocatalytic hybrids.

a, Principal component analysis (PCA) and (b) volcano plot of the results in proteomic analysis between photocatalytic hybrids (Hybrid, entry 1) and the H2-grown bacteria (H2-fed microbes). c, PCA and (d) volcano plot of the results in metabolomic analysis. Heatmaps of some significantly regulated (e) proteins and (f) metabolites (fold change (FC) of photocatalytic Hybrid/H2-fed microbes > 1.5 or < 0.66 and p-value < 0.05 from a two-tailed t-test, unless specifically noted *). The FC and p-value of the plotted proteins or metabolites are shown in b and c based on the color of the text. The data of heatmap have been normalized for representative purposes. PC, principle component; N2ase, nitrogenase; HupV, uptake hydrogenase; RegB/RegA, redox-responding two-component regulatory system; Cyt, cytochrome c; Complex I/II, NADH-quinone oxidoreductase/succinate dehydrogenase; Complex IV, cytochrome c oxidase; ATPase, APT synthase; ADP/ATP, adenosine diphosphate/triphosphate; NADPH, reduced nicotinamide adenine dinucleotide phosphate; NADP+, nicotinamide adenine dinucleotide phosphate.
The proteomic and metabolomic analyses indicate that the metabolic pathways related to nitrogen fixation and electron transport chain were considerably altered in the microbe-semiconductor hybrids (Hybrid) in comparison to the H2-fed microbes, which is believed to be responsible for the high IQYs of N2/CO2 fixation observed in the photocatalysis. In particular, the nitrogenases were significantly upregulated in the Hybrid (Fig. 4e) along with the activation of all necessary enzymes in the CBB cycle (Extended Data Fig. 8a), which supports the observed photocatalytic activities of N2 and CO2 fixation with appreciable performances. The hupV protein in a two-component regulatory system that senses H2 and is known to be repressed by H240 was also significantly upregulated in the Hybrid (Fig. 4e, Extended Data Fig. 8b), indicative of a paucity of H2 as a putative redox mediator near microbes. Such observation is consistent with the undetectability of H2 in the headspace analysis (Extended Data Fig. 3) and supports a likely direct, non-diffusive charge transfer between the microbe-semiconductor interface.
Meanwhile, the RegA protein in the redox-signaling two-component RegA/RegB regulatory system and the correspondingly regulated electron-transfer cytochromes41 were significantly upregulated in the Hybrid (Fig. 4e, Extended Data Fig. 8c). The upstream complex I and complex II in the oxidative phosphorylation were significantly upregulated in the Hybrid, while the downstream complex IV and ATP synthase was significantly downregulated (Fig. 4e, Extended Data Fig. 8d). This change of protein expressions is concurrent with a significantly lower level of ATP concentration in metabolomes, while the concentrations of reduced nicotinamide adenine dinucleotide phosphate (NADPH) (Fig. 4f) and the signal ratio of NADPH/NADP+ (Supplementary Data File 6) were not significantly perturbed. These metabolic changes suggest that the ATP production is limited in the biohybrid under photo-illumination, the cytoplasmic redox state is perturbed, and some of the electrons undergo electron transport chain thus creating cross-membrane proton gradients might be diverted before their final delivery to dioxygen42. The observed biological regulations led us to speculate the possible presence of electron bifurcation or reverse electron transport, which is predicted to be more energy efficient13 (Supplementary Note 1).
A decreased ATP concentration was observed along with an excessive accumulation of amino acids and nucleotides in the photocatalytic hybrids (Hybrid in Fig. 4f). Accounting for the 13 detected amino acids and 3 detected nucleobases as the major N-containing biochemical building blocks43 (Fig. 4f), a 4.4-fold concentration enhancement of those major N-containing building blocks was observed in total for Hybrid sample of X. autotrophicus and QDs in comparison to the H2-fed microbes, while the total nitrogen weight percentages in the biomass remain similar between the two groups. As the synthesis of proteins and polynucleotides are generally more ATP-intensive44, the combined results from proteomics and metabolomics suggest a frugal ATP budget under photocatalytic conditions for downstream biochemical processes, consistent with our observed high IQYs comparable with theoretical limits. Moreover, the ATP-frugal biosynthesis of protein and amino acids suggests the biohybrids as a potential photocatalytic platform of synthesizing amino acids, or more broadly single-cell protein sources45–47 from water, CO2, and N2. The protein concentration in the photocatalytically generated biomass was quantified after establishing a calibration curve between OD600 values and the protein contents in X. autotrophicus (Supplementary Fig. 1). A protein production of 39.6 ±3 mg/L was achieved in a 4-day photocatalysis. Without specific reactor optimization, the corresponding production rate of protein synthesis is 9.9 ± 0.8 mg∙L−1∙day−1, or about 52 g∙m−2∙yr−1, comparable if not higher than most conventional crops such as potato, rice, and wheat, as well as other single-cell protein sources46. The high IQY values intrinsic of the photocatalytic biohybrids suggest room of productivity improvement with additional reactor engineering.
Discussion
In this work, we report a photocatalytic microbe-semiconductor hybrid for simultaneous CO2 and N2 fixation with IQYs reaching the calculated theoretical limits dictated by the intrinsic biochemical pathways. Through an innovative combination of characterizations in nanomaterials, photo-physics, and multi-omics, our results unveil that the introduction of semiconducting nanomaterials brings other impacts to the microbes in addition to light-harvesting and supplying reducing equivalents. Thanks to static quenching, fast charge transfer gradually built up at the microbial-material interface ensuring the efficient delivery of photo-generated reducing equivalents to the microorganisms. An altered microbial metabolism induced by the QDs is believed to favor desired biochemical pathways of CO2 and N2 fixation and disfavor the synthesis of ATP-demanding biochemical molecules in other peripheral reactions that may lower the IQYs. We speculate that such a metabolic response originates from the targeted delivery of reducing equivalents to certain membrane-bound enzymes due to the non-diffusive microbe-semiconductor contacts, as well as the localized stimulation of high-flux reducing equivalents from the light-harvesting QDs under the photocatalytic conditions. It seems feasible to modulate microbial metabolism networks towards specific application goals with a suitably designed nanomaterial-microbe interface.
Our work highlights the integration between nanomaterials and microorganisms, efficient charge transfer, selective biosynthesis, and maximal quantum efficiency for sustainable, light-driven chemical synthesis. The approach of multidisciplinary characterizations from aspects of both materials and biochemistry provides a comprehensive understanding not only of the material-biology interface per se but also of the bidirectional interplay among biotic and abiotic moieties in a hybrid system. In the future, detailed studies accounting for the correlation among the experimentally determined IQYs, the molecular-level characterization of the microbial-material interfaces, and the metabolic kinetics upon such interactions will shed more mechanistic information about the roles of the biological-material interfaces in the energy/signal transduction and the metabolic responses after coupling with materials. The material-induced regulation of biological metabolism will find plentiful use when interfacing light/electricity-responsive materials with biological moieties for applications in the water-food-energy nexus.
Methods
Materials and chemicals.
All materials and chemicals were used as received. Mercaptosuccinic acid functionalized CdTe QDs (777943, Lot# mkch3110), and L-cysteine hydrochloride were purchased from Sigma-Aldrich. 15N2 gas (NLM-363–5, 98%+ 15N) and NaH13CO3 (CLM-441–5, 99% 13C) were purchased from Cambridge Isotope Laboratories Inc. Osmium tetroxide, Araldite 505 kit with DMP-30 (Spurr’s resin, KIT 13900) was purchased from Electron Microscopy Science. Formvar coated Cu grids (01811) for the characterizations of electron microscopy were purchased from Ted Pella Inc. All other chemicals were purchased from Sigma-Aldrich. All deionized (DI) water was obtained from a Millipore Millipak Express 40 system. All gases were passed through a syringe filter with 0.2 μm pore size (VWR 28145–477) to remove the potential microbes before use.
Bacterial strain and growth protocol.
Xanthobacter autotrophicus (ATCC 35674™) was purchased from American Type Culture Collection (ATCC). The growth protocols follow the reported procedures23,28. Briefly, the X. autotrophicus was initially inoculated on the autoclaved super nutrient broth agar plate. The super nutrient broth medium was prepared with 5 g/L nutrient broth, 4 g/L yeast extract, 3 g/L NaCl, 5 g/L sodium succinate, and 15 g/L agar for plates only. Then, an individual colony was picked from the agar plate and inoculated into the super nutrient broth solution for overnight growth at 30 °C with 200 rpm stirring. The pH of the culture was then adjusted to 10 ~ 11 by adding drops of 2 M NaOH. The microbial pellet was collected by centrifugation (4,830 × g, 5 min), followed by resuspending in an autoclaved inorganic minimal medium, which contains 1 g/L K2HPO4, 0.5 g/L KH2PO4, 2 g/L NaHCO3, 0.1 g/L MgSO4⋅7H2O, 0.0316 g/L CaSO4, 0.0115 g/L FeSO4⋅7H2O, and 1 ml/L trace mineral mix. The trace minimal mix was prepared with 2.8 g/L H3BO3, 2.1 g/L MnSO4⋅4H2O, 0.75 g/L Na2MoO4⋅2H2O, 0.24 g/L ZnSO4⋅7H2O, 0.04 g/L Cu(NO3)2⋅3H2O, and 0.13 g/L NiSO4⋅6H2O. The culture in the inorganic minimal medium was incubated (200 rpm stirring) with a gas mixture of N2: H2: CO2: O2 (60: 20: 17: 3) at 30 °C for days before use. The identity of the as-grown X. autotrophicus was confirmed by 16S rRNA sequencing conducted by Laragen Inc.
Assembly of microbe-semiconductor hybrids.
The X. autotrophicus was spun down (4,830 × g, 5 min) and resuspended in the fresh inorganic minimal medium that does not contain any N-containing compounds or organic carbon sources. The CdTe QDs were suspended in the inorganic minimal medium and sonicated to make a uniform suspension. Cysteine hydrochloride was dissolved in the inorganic minimal medium and neutralized by sodium bicarbonate. The hybrids of X. autotrophicus and CdTe QDs were prepared by simply mixing the microbial culture (0.20 final OD600), the CdTe suspension (0.027 g/L final concentration), and the cysteine solution (0.15 g/L final concentration). The added cysteine is supposed to function as a hole scavenger20,29,36–38,48 yet was not assimilated into the microbes during our experiments as a possible N/C source or energy source (See Supplementary Note 2). The sample with the deletion of microbes, QDs, or cysteine follows a similar procedure here with the deletion of microbial culture, CdTe suspension, or cysteine solution.
Experiment procedure for photosynthetic CO2 and N2 fixation.
Unless noted, at least triplicates (n > 3 biological replicates) were conducted for each experiment. In a typical experiment, 7 ml of the prepared hybrid suspension in triplicates was placed in a customized Vacu-Quik anaerobic jar (Almore, 15000) at 30 °C under 200 rpm stirring and a gas mixture of N2: CO2: O2 (80: 17: 3). A uniform light illumination (0.09 mW/cm2) was achieved in the customized anaerobic jar, powered by light-emitting diode sources equipped with a collimator lens (MIGHTEX Systems, 505 nm: PLS-0505–030-S; 657 nm: PLS-0657–030-S). The light intensity was calibrated by a commercial photodetector (Newport 1916-R). In a 4-day experiment of photocatalysis, 1-ml aliquots were sampled daily for the measurement of OD600 (WPA BioChrom CO8000) and other analytical characterizations (see sections “Analytical procedures for aliquots of photosynthetic experiments” in the Supplementary Methods), then the gas was swiftly refilled. Control experiments with the deletion of QDs, the deletion of light, and the switch to a 657-nm light source were achieved following a similar procedure here. In the experiment of 15N-isotope labeling, a 4-day photocatalytic experiment was carried out using an initial gas mixture of 15N2: N2: CO2: O2 (47: 32: 17: 3). Under the condition of simultaneous 15N-isotope and 13C-isotope labeling, a 4-day photocatalytic experiment was carried using an initial gas mixture of 15N2: N2: 13CO2: O2 (47: 32: 17: 3), and the 13CO2 gas were generated by reacting NaH13CO3 with concentrated HCl. The isotope-labeling experiments were conducted without daily sampling or gas refilling. The extensive cost of isotope gases and the practical requirement of using air as the O2 gas source lead to the use of an isotope abundance less than 100% and the absence of gas refilling, which inadvertently leads to a slower-than-usual biological activity hence fixation rates of CO2 and N2 due to the deviation of the gas composition from ideal values.
Total nitrogen test for aliquots of photosynthetic experiments.
The total nitrogen contents (Ntot) in the sampled aliquots were determined by using a commercial reagent set with a standardized protocol (Hach Company 10071)23,49,50. Assisted by calibration curves, the Ntot values were determined from the absorbance at 410 nm for the digested then acidified samples. The increase of total nitrogen contents (ΔNtot) reported in this work was defined as the difference of Ntot values between the sample aliquots, including both the biomass and any soluble N contents, and the one before photocatalysis (day 0). Potential interference from cysteine bio-assimilation was excluded (see details in Supplementary Note 2) and the measured ΔNtot values reflect the net increase of biochemical fixed nitrogen. Moreover, the Ntot in the microbial culture of X. autotrophicus is experimentally proved to be linearly proportional to the cultures’ OD600 values across different experimental conditions. The ratios between Ntot and OD600 (Ntot/OD600) are 36.5 ± 1.9 mg L−1 OD600−1 (n = 4 biological replicates) and 32.7 ± 4.6 mg L−1 OD600−1 (n = 4 biological replicates) under H2-grown condition and photocatalytic condition, respectively, with a p-value of Ntot/OD600 = 0.275 between those two culturing conditions, indicating insignificant differences.
Isotope labeling experiment.
In the experiment of 15N-isotope labeling experiment, the total nitrogen in the aliquoted samples (n = 3 biological replicates) was first converted to nitrate (NO3−) by an alkaline persulfate digestion method49,50. The obtained nitrate solution was then neutralized and filtered for 15N abundance analysis. The 15N abundance was analyzed at the Stable Isotope Facility at the University of California Davis by a GasBench-PreCon-IRMS method. In general, the dissolved nitrates were firstly converted to N2O by denitrification with Pseudomonas chlororaphis subsp. aureofaciens (ATCC 13985)51, then the analysis of generated N2O was performed using a Thermo Finnigan GasBench + PreCon trace gas concentration system interfaced to a ThermoScientific Delta V Plus isotope-ratio mass spectrometer. Under the condition of simultaneous 15N-isotope and 13C-isotope labeling, the intracellular metabolites of the hybrid system before and after photocatalysis (n = 4 biological replicates) were extracted for metabolomic study (see “Analysis of metabolism” in Methods).
Viability test.
The viability of X. autotrophicus in the hybrid samples during photocatalysis and the distribution of photoluminescent emission in the hybrid samples were probed by flow cytometry. 1-ml aliquoted samples were diluted with 1X phosphate-buffered saline (PBS) by a factor of 20. Live dye of SYTO 9 (Fisher Scientific S34854) was added as an indicator of live cells for viability tests specifically. The prepared samples were analyzed by using BD LSRII analytic flow cytometer at UCLA Flow Cytometry Core Facility. The forward-scattered light (FSC), side-scattered light (SSC), and fluorescence emission at (525 ± 50) nm (FITC) of 10,000 particles were measured (excitation: 488 nm) for each sample. The data was collected with BD DIVA software (version 8.0.2) and then analyzed by FlowJo 10. The microbial population was identified by signals of FSC and SSC. The viability percentage was determined as the ratio of FITC-positive microbial events to the total microbial events.
Analysis of headspace gas composition by gas chromatography (GC).
The sample assembly follows the method described above, while the microbe-semiconductor hybrids were sealed in the anaerobic culture tube (Chemglass CLS-4209, 18×150 mm) with an 80:20 mixture gas of N2:CO2 in the headspace, with an additional 10-ml gas injection at the beginning. The gas composition in the headspace was analyzed by a gas chromatograph (GC) (SRI Instruments, Multiple Gas Analyzer #5 GC, 1 8610–0571) with a thermal conductivity detector and a flame ionization detector equipped with a methanizer. The detection limit of H2, the molecule of particular interest, is ~ 10 ppm. The GC instrument was equipped with 3 packed S.S. columns under helium (He) carrier gas with a flow rate of 40 ml min−1. In each analysis, 10-ml gas sample was drawn from the reactor headspace and was manually injected into the GC. After each sample injection, the oven temperature was firstly maintained at 50 °C for 1 min and was increased to 90 °C at a ramping rate of 20 °C/min, then held for 3.75 min. The oven temperature was further increased to 210 °C at a ramping rate of 30 °C/min. The measurements were compared with a standard sample that contains 0.5% (v/v) of each CO, CO2, H2, and O2 in N2 (Supelco 23438).
Calculation of IQY under the photosynthetic CO2 and N2 fixation.
The calculations were conducted following protocols as reported in previous literatures22,33 and follows the convention in photocatalysis30,31. The calculation of IQYs is only considers the consumption of reducing equivalents directly involved in the redox-based net reaction but not the other consumptions in microbial metabolism13, therefore, any consumption of reducing equivalents by the other peripheral reactions which may be essential for maintaining the microbial activity is not considered here.
The IQYs of photocatalytic fixation of N2 (IQYN) and CO2 (IQYC) are defined as the percentage of absorbed photons towards the requirements of reducing equivalents for the yielded products achievable by the microbe-semiconductor hybrid system:
| (1) |
where V is the final volume of the sample (4 ml), NA is the Avogadro’s constant (6.02×10²³ mol−1), Φph is the measured averaged photon flux (2.29×10¹⁴ photons cm−2 s−1 under 505-nm illumination), Δt is the duration of the photocatalytic experiments (4 days or 3.465×10⁵ s), A is the illumination area (4.9 cm2), and T is the transmittance of the QDs was calculated from the optical absorbance in the microbe-semiconductor hybrids at the light-sources’ wavelengths (Extended Data Fig. 9). Here, we consider a simultaneous fixation of CO2 and N2 into biomass (CH1.77O0.49N0.2423). For IQYN, 3 equivalents of electrons (νe,X) are required to reduce 1 N from N2 gas, ΔNtot,day4 with the unit of g/L is the increase of Ntot after 4-day photocatalytic experiments, and MWX is 14 g/mol for the N element. For IQYC, 4 equivalents of electrons (νe,X) are required to reduce 1 C from CO2 gas, ΔCtot,day4 with the unit of g/L is the concentration increase of total carbon contents after 4-day photocatalytic experiments, and MWX is 12 g/mol for the C element. The ΔCtot,day4 is calculated based on the biomass composition of X. autotrophicus that was experimentally determined as CH1.98N0.2S0.01 (see details in “Analytical procedures for harvested biomass” of the Supplementary Methods), and the fact that 1 OD600 = 0.316 g L–1 dry biomass23.
Calculation of TOF and TON.
The 4-day averaged values of TOFs per X. autotrophicus cell for the fixation of N2 and CO2 fixation (TOFN and TOFC, respectively) are calculated following the reported method23:
| (2) |
| (3) |
Here MWX are 14 g/mol and 12 g/mol for the calculation of TOFN and TOFC, respectively. The averaged values of OD600 are employed to reflect the average numbers of bacterial cells in the photocatalytic reaction. The value of 0.922 presents is the averaged viability of the microbes in the duration of a 4-day photocatalytic experiment which was experimentally determined from the viability tests (92.2 ± 7.5% from Extended Data Fig 2, n = 3 biological replicates). The value of 3.8×10⁸ cell/mL reflects that 1.0 OD600 = 3.8×10⁸ cell/mL as reported previously23. Similarly, the 4-day averaged values of TONs per X. autotrophicus cell for the fixation of N2 and CO2 fixation (TONN and TONC, respectively) are calculated by multiplying the values of TOFN and TOFC by the duration of experiments (4 days or 3.456×10⁵ s), respectively.
Characterization protocols of electron microscopy.
The CdTe QDs were dispersed in the inorganic minimal medium, then drop-casted on electron microscopy grids for the characterization of transmission electron microscopy (TEM), including the high-angle annular dark-field scanning transmission electron microscopy (HAADF-STEM), energy-dispersive X-ray spectroscopy (EDS), and high-resolution transmission electron microscopy (HRTEM). The preparation of biological samples for characterizations of electron microscopy can be found in the “Preparation of biological samples for electron microscopy” of the Supplementary Methods. Overall, the TEM imaging was performed at 120 kV with a T12 cryo-electron microscope at UCLA CNSI. The HRTEM, HAADF-STEM, and EDS characterizations were conducted at the Center for High-resolution Electron Microscopy (CℏEM) at ShanghaiTech University. The HRTEM, HAADF-STEM, and EDS imaging were performed with a JEOL-F200 microscope at 200 kV with a field-emission gun. The EDS signal was acquired with JEOL SDD system (100 mm2×1) that was controlled by JED-2200 Analysis Station software.
Measurements of photoluminescence.
The stationary photoluminescence of the microbe-semiconductor hybrids was characterized at room temperature by a USB2000 Fiber Optic Spectrometer from Ocean Optics (excitation: 450 nm). Additional absorbance spectra were recorded using a Cary 60 UV-Vis spectrophotometer. Sample solutions were vortexed then transferred into disposable cuvettes for all the photophysical measurements. Microbe-semiconductor hybrids and other relevant samples were prepared following the aforementioned protocols and their stationary photoluminescence was measured at 0, 0.25, 0.5, 0.75, 1.25, 2.25, 3.25, 5.25, and 7.75 hr after assembly. Additional samples were prepared and tested for the Stern-Volmer analysis. When Stern-Volmer analysis was conducted to evaluate the effect of cysteine as a QD quencher, samples with cysteine concentrations of 1, 0.5, 0.25, 0.1, 0.05, 0.025, 0.01, and 0.005 equivalents were tested. When Stern-Volmer analysis was conducted to evaluate the effect of microbes as a QD quencher under different conditions, samples with X. autotrophicus concentrations of 1.5, 1.25, 1, 0.75, 0.5, 0.45, 0.4, 0.35, 0.3, 0.25, 0.2, 0.15, 0.1, 0.05, 0.025, and 0.005 equivalents were tested.
Measurements of lifetime.
The lifetimes of excited CdTe QDs were recorded by using a time-correlated single-photon counting (TCSPC) technique by using a home-built, all-reflective epifluorescence setup52. The sample solution was excited at the front of a 1 cm quartz cuvette using a 532-nm pulsed diode laser (PicoQuant, LDH-P-FA-530B). The emission was then collected and filtered with a 550-nm long-pass dichroic beamsplitter (Thorlabs, DMLP550R), a 550-nm long-pass filter (Thorlabs, FELH0550) and a 532-nm notch (Thorlabs, NF533–17), and finally focused onto a Si single-photon avalanche photodiode diode (Micro Photon Devices, PD-050-CTD). The TCSPC traces were constructed using HydraHarp 400 and the corresponding software (Picoquant). All measurements were carried out at room temperature. The experimental data were fitted with bi-exponential decays as follows:
| (4) |
where τi are the decay times, αi represent the amplitudes of the components at t = 0, The average lifetimes () were then calculated as follows53:
| (5) |
Calculation of rate constants.
The rate constant of charge-transfer at the microbe-semiconductor interface (kET) was calculated based on a physical model which considered four kinetic processes: the charge-transfer at the microbe-semiconductor interface (kET), the hole passivation by hole scavenger (kQ), the electron-hole recombination via non-radiative process (kNR), and the electron-hole recombination via radiative process (kPL). Hence the quantum yields Φ of photoluminescence under different conditions can be written as,
When only QDs are dispersed,
| (6) |
When both QDs and microbes are present,
| (7) |
When both QDs and hole scavenger are present,
| (8) |
When all components of hybrids are present,
| (9) |
The model considers that the rate constants of nonradiative recombination may be different with or without microbes in the system (kNR and kNR’ respectively), and the kPL is assumed as a constant54. Incorporating the experimental data into the established model leads to the following calculation results. kPL = 1.2×10⁷ s−1, kNR = 8×10⁶ s−1, kNR’= 8×10⁶ s−1, kQ = 1×10⁶ s−1 under one equivalent of cysteine, and kET = 2.1×10⁸ s−1. Such values of kinetic rate constants lead us to evaluate the quantum yield of electron transfer at the material-biology interface, defined as , at a value of 91%. This supports the efficient transfer of photo-excited carriers at the material-biology interface claimed in the main text.
Proteomics and metabolomics.
The preparation of the microbe-semiconductor hybrids and related controls followed the aforementioned protocols (n ≥ 3 biological replicates). The experimental details of proteomics and metabolomics can be found in “Proteomics analysis” and “Metabolomic analysis” from the Supplementary Methods. The principal component analysis was processed using the Sklearn library (version 0.21.3) in Python. The heatmap was performed using Seaborn library (version 0.9.0) in Python, and data used for heatmaps were normalized to the average abundance of the proteins across the samples for illustration purposes. The pathway analysis was performed by using Kyoto Encyclopedia of Genes and Genomes (KEGG) database. Additional pathway analyses, including tricarboxylic acid (TCA) cycle and biosynthesis of amino acids, can be found in Supplementary Fig. 2 and 3, respectively.
Calculation of N abundance in interested metabolites.
The relative abundance ratio of the total N amounts in the major building blocks43, normalized to the biomass as ensured by metabolomic analysis, between the photosynthetic microbe-semiconductor Hybrid (entry 1) and the H2-fed microbes is calculated as,
| (10) |
where the Ni represents the nitrogen amount of a certain amino acid or nucleotide found in E. coli (averaged moles of N element per single E. coli cell)43, the FCi represents the fold change of this amino acid or nucleotide between Hybrid and the H2-fed microbes with p-value < 0.05. For any detected metabolites with p-value > 0.05, the FCi is treated as 1. Characterized metabolites considered as major building blocks – aspartate, alanine, arginine, glutamate, glutamine, glycine, lysine, methionine, phenylalanine, proline, serine, tyrosine, tryptophan, adenine, guanine, and uracil– were included in this calculation (Supplementary Data File 2).
Extended Data
Extended Data Fig. 1. Characterizations of CdTe quantum dots (QDs).

a, HAADF-STEM image of aggregated QDs and the corresponding EDS mapping in the same region for (b) cadmium (Cd) and (c) tellurium (Te). d, HRTEM image of individual CdTe QDs. e, Magnified HRTEM image of the highlighted region in d. f, the corresponding Fourier transform results indicate a lattice spacing of 0.21 nm, agree with the (220) plane of the cubic phase. g, Ultraviolet-visible spectrum (black) overlayed with the emission spectrum (yellow) of CdTe QDs. h, The measurement of dynamic light scattering along with the corresponding size distribution. The experiment of electron microscopy has been repeated independently for more than 3 times with similar results. Scale bars are 30 nm in a-c, 10 nm in d, and 1 nm in e.
Extended Data Fig. 2. Viability results of X. autotrophicus measured by flow cytometry.

a, The gate of X. autotrophicus in the forward-scattered light area/side-scattered light area (FSC-A/SSC-A) plot. b, Fluorescent intensity of SYTO 9 stained (live) X. autotrophicus versus its FSC-A. c, Viability percentage of the microbes under different conditions, n = 3 biological replicates with 10,000 particles recorded before gating (error bars present the standard deviation).
Extended Data Fig. 3. Gas composition analysis of reactors’ headspace by gas chromatography.

Gas chromatograms of photoreactors’ headspace for the microbe-semiconductor hybrids before (light blue) and after (dark blue) a 4-day photocatalytic reaction, along with a standard sample (black) containing O2 and H2 (0.5 v/v% for each component in N2).
Extended Data Fig. 4. Electron microscopy images of the microbe-semiconductor hybrids and controls.
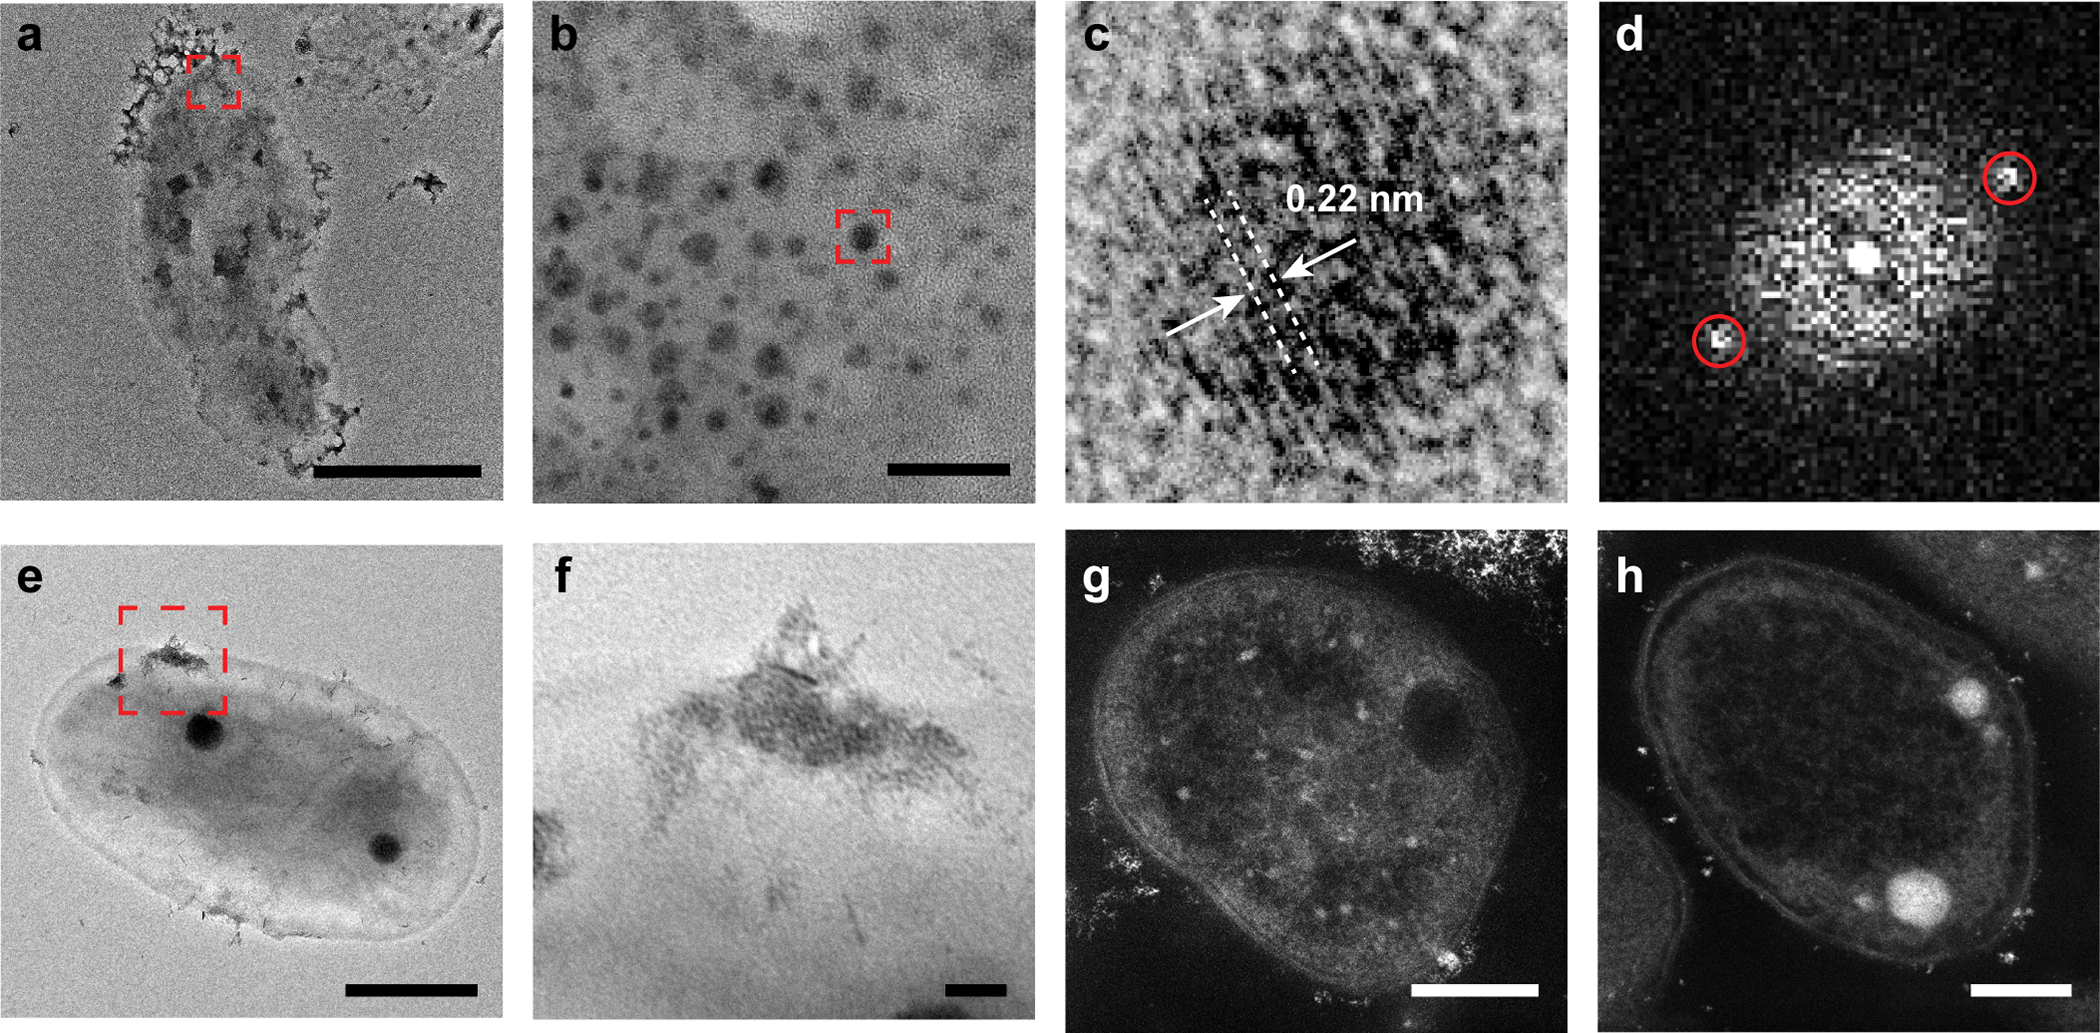
a, HRTEM image of the microbe-semiconductor hybrid. b, The magnified image of the red box in a. c, The magnified image of the red box in b. d, The corresponding Fourier transform results of c indicating a lattice spacing of 0.22 nm for the QDs. e, TEM image of the microbe-semiconductor hybrid. f, The magnified image of the red box in e. g, HAADF-STEM image of sectioned microbe-semiconductor hybrid in the absence of cysteine. h, HAADF-STEM image of sectioned pure microbes. The experiment of electron microscopy has been repeated independently for more than 3 times with similar results. Scale bars are 1 μm in a, 20 nm in b, 500 nm in e, 50 nm in f, and 200 nm in g and h.
Extended Data Fig. 5. Absorption and emission spectra of partially aggregated CdTe QDs.

Absorbance (solid lines) and photoluminescence (PL) (dashed lines) spectra of the well-dispersed QD suspension (black) and the partially aggregated CdTe QDs (yellow). The average particle diameters from the dynamic light scattering measurements are 4.02 ± 0.61 and 62.06 ± 0.18 nm for the well-dispersed and partially aggregated QDs (mean +/− standard deviation), respectively.
Extended Data Fig. 6. Interactions between QDs and microbes studied by flow cytometry.

a and b, Dispersion of pure CdTe QDs. c and d, Microbial culture of X. autotrophicus. The microbe-semiconductor hybrids at (e and f) t = 0 hr and (i and j) t = 24 hrs after assembly. The mixture of QDs and microbes at (g and h) t = 0 hr and (k and l) t = 24 hrs after assembly. a, c, e, g, i, and k are the plots of SSC-A versus FSC-A that illustrate the identity of the microbial population. b, d, f, h, j, and l are the plots of emission at 525 ± 50 nm versus FSC-A that illustrate the distribution of microbial population gated in the SSC-A/FSC-A plot attached with emissive QDs. The circles in the plots illustrate the gated areas corresponding to the microbial populations attached with emissive QDs whose temporal trends were shown in (m). Representative results presented above (n = 3 biological replicates with 10,000 particles recorded before gating, error bars present the standard deviation). Additional quantification of the percentage of QDs closely interacting with microbes are available in Supplementary Fig. 4.
Extended Data Fig. 7. Stern-Volmer study for the mixture of CdTe QDs and cysteine.

The ratios of PL emission intensities of CdTe QDs (I0/I) without and with the addition of different equivalents of cysteine (Cys). A linear relationship was observed at low Cys equivalents, demonstrating a dynamic quenching mechanism orientated from the diffusive encounters between the Cys molecules and the emissive QDs. The saturated values of I0/I under high Cys equivalents due to quencher accessibility are consistent with the literature report64.
Extended Data Fig. 8. Schematic illustrations of the discussed pathways and the relevant metabolic regulations.

The regulation of the (a) Calvin-Benson-Bassham cycle, (b) two-component regulatory system, and (c) oxidative phosphorylation in the Hybrid compared to the H2-fed microbes.
Extended Data Fig. 9. The optical absorbance of the CdTe QDs in the hybrids as a function of microbial inoculation.

The optical absorbances of the CdTe QDs in the microbe-semiconductor hybrids (ODQDs), sensitive to the presence of microbial scattering centers, are plotted against the amounts of microbial inoculation presented as OD600. See section “Analytical procedures for the aliquoted samples in the photosynthetic experiments” in the Methods for details.
| Substratesa | Products | Biochemical machinery | Light absorbers | Illumination condition | IQYs | Reference |
|---|---|---|---|---|---|---|
|
| ||||||
| CO2 | Biomass | Plant Cucumis sativus | Photosystems | 620 ∼ 640 nm | 9.3%b | 7 |
| CO2 | Biomass | Plant C. sativus | Photosystems | 516 nm | 7.2%b | 7 |
| CO2 | Biomass | 37 C3 plant species | Photosystems | Halogen lamp (600 μmol m−2s−1) | 10.6%c | 56 |
| CO2 and N2 | Biomass | Blue-green algae Anabaena cylindrica Lemm | Photosystems | 400–700 nm (1800 LUX) | 1.7% (N2) d
17.7% (CO2) d |
9, 57 |
| CO2 and N2 | Biomass | Natural root nodule systems | Photosystems | Natural sunlight |
0.8∼1.9% (N2) d 9.9∼27.5% (CO2) d |
7, 10, 56, 59 |
| CO2 | Acetic acid | Bacterium Moorella thermoacetica | CdS nanoparticles | Simulated sunlight or LED (2.5 W/cm2) | 2.44±0.62% e, f
85 ±12% e,g |
20 |
| CO2 | Acetic acid | Bacterium M. thermoacetica | Au nanoclusters |
320 ∼ 610 nm (2 W/m2) | 2.86±0.38% e | 29 |
| CO2 | Biomass | Bacterium Rhodopseudomonas palustris | CdS nanoparticles and photosystems | Fluorescent tubes (80 W/cm2) | 5.98% h,i
4.31% h, j |
60 |
| N2 | NH3 and H2 | Protein MoFe nitrogenase | CdS nanorods | 405 nm (3.5 W/cm2) | 3.3% (N2) 20.2% (HERk) |
21 |
| N2 | NH3 and H2 | Bacterium Azotobacter vinelandii with histidine-tagged MoFe nitrogenase | Au nanocrystals | 400 nm (1.6 mM/cm2) | 1.4% l, m | 61 |
| N2 | Biomass | Bacterium R. palustris | CdS nanoparticles and photosystems | Fluorescent tubes (80 W/cm2) | 5.42% h, i
1.04% h, j |
36 |
| N2 | NH3 and H2 | Bacterium A. vinelandii with histidine-tagged MoFe nitrogenase | CdS quantum dots, CdS@ZnS quantum dots | 400 nm (1.6 mM/cm2) | 1.2% l, n | 62 |
|
| ||||||
| CO2 and N2 | Biomass | Bacterium X. autotrophicus | CdTe quantum dots | 505 nm (0.09 mW/cm2) | 7.1±1.1% (N2) 47.2±7.3% (CO2) |
This work |
Only the oxidants that are reduced in the photo catalytic reactions are listed here
Reported based on the number of CO2 molecules fixed per absorbed photon
Reported based on the number of O2 molecules released per absorbed photon
Detailed calculations are available in Supplementary Note 3
It has been reported that the presumed hole scavenger cysteine may contribute significantly to the yielded CH3COOH due to the specific metabolism in M. thermoacetica63, which may lower the reported quantum yields
Low-intensity simulated sunlight
LED light source with 435∼485 nm illumination with a 4-fold increase of Cd loading
QY is not readily available, the listed value is the reported photosynthetic efficiency (PE), which is defined as the ratio of the energy stored as biomass to the net energy input of both absorbed light and organic substrate consumption, in the original literature. Additional organic carbon sources (30 mM 4-aminobenzoic acid and 45 mM DL-malic acid) were added and assimilated by microbes
CdS-R. palustris hybrid, in which both CdS and the phototrophic R. palustris function as light-absorbers
Phototrophic R. palustris alone as the light-absorber
HER, hydrogen evolution reaction
Calculated for the co-production of NH3 and H2. The value reported here is calculated based on a cross-sectional area of 0.785 cm2 (1 cm diameter) for the light-illuminated area, which is different from the literature value of 0.52 cm2
Estimated based on a 92% cellular uptake of Au nanoclusters with the assumption that the other intracellular energy source does not contribute to the NH3 formation within the 5-hour experiment
Recalculated based on a total absorption of the provided quantum dots with the assumption that the other intracellular energy source does not contribute to the NH3 formation within the 4-hour experiment.
Supplementary Material
Supplementary Data 1 LC-MS results of the metabolome in the X. a. | CdTe hybrid system before and after the 15N and 13C isotope-labeling experiment.
Supplementary Data 2 Heatmap data for significantly regulated proteins and metabolites in the microbe-semiconductor hybrids in comparison to the H2-fed microbes.
Supplementary Data 3 LC-MS results of the proteome in X. autotrophicus under different experimental conditions.
Supplementary Data 4 Fold changes of protein expression comparing the microbe-semiconductor hybrids against the H2-fed microbes.
Supplementary Data 5 LC-MS results of the metabolome in X. autotrophicus under different experimental conditions.
Supplementary Data 6 Fold changes of metabolites comparing the microbe-semiconductor hybrids against the H2-fed microbes.
Acknowledgments
We would like to acknowledge Stephanie Tenney for the experiment of quantum yield characterization, Danlei Xiang and Benjamin Natinsky for the experiment of gas chromatography, and Andong Xiao for coding assistance. We thank Prof. Ellen Sletten at UCLA for the use of the fluorometer and dynamic light scattering instrument. We also thank the instrumental support from UCLA Molecular Instrumentation Center, the UCLA Metabolomics Center, UCLA Proteome Research Center, and UCLA California NanoSystems Institute. This study was supported by National Institute of Health grant R35GM138241 (C.L.), Jeffery and Helo Zink Endowed Professional Development Term Chair (C.L.), National Institute of Health S10OD016387 (J.O.P.), Hellman Fellowship (J.O.P.), and UCLA Summer Mentored Research Fellowship (X.G.).
Footnotes
Competing Interests
The authors declare that they have no competing interests.
Additional Information
Supplementary information is available for this paper.
Peer review Information: Nature Catalysis thanks Buz Barstow, Paul King and the other, anonymous, reviewer(s) for their contribution to the peer review of this work.
Data Availability
The proteomic and metabolomic data generated in this study are available in the Supplementary Data files. The reference proteome of X. autotrophicus was obtained from UniProt database (UP000305131), the pathway analysis were performed based on Kyoto Encyclopedia of Genes and Genomes database (https://www.genome.jp/kegg/). Other data that support the plots within this paper and other findings of this study are available from the corresponding author upon reasonable request.
References
- 1.Pan Y et al. A large and persistent carbon sink in the world’s forests. Science 333, 988–993 (2011). [DOI] [PubMed] [Google Scholar]
- 2.Canfield DE, Glazer AN, Falkowski PG The evolution and future of Earth’s nitrogen cycle. Science 330, 192–196 (2010). [DOI] [PubMed] [Google Scholar]
- 3.Blankenship RE et al. Comparing photosynthetic and photovoltaic efficiencies and recognizing the potential for improvement. Science 332, 805–809 (2011). [DOI] [PubMed] [Google Scholar]
- 4.Cestellos-Blanco S, Zhang H, Kim JM, Shen Y, Yang P Photosynthetic semiconductor biohybrids for solar-driven biocatalysis. Nat. Catal. 3, 245–255 (2020). [Google Scholar]
- 5.Chen H, Dong F, Minteer SD The progress and outlook of bioelectrocatalysis for the production of chemicals, fuels and materials. Nat. Catal. 3, 225–244 (2020). [Google Scholar]
- 6.Lu L et al. Wastewater treatment for carbon capture and utilization. Nat. Sustain. 1, 750–758 (2018). [Google Scholar]
- 7.Hogewoning SW et al. Photosynthetic quantum yield dynamics: from photosystems to leaves. Plant Cell. 24, 1921–1935 (2012). [DOI] [PMC free article] [PubMed] [Google Scholar]
- 8.Emerson R The quantum yield of photosynthesis. Annu. Re. Plant Physiol. 9, 1–24 (1958). [Google Scholar]
- 9.Allen MB, Arnon DI Studies on nitrogen-fixing blue-green algae. I. Growth and nitrogen fixation by Anabaena cylindrica Lemm. Plant Physiol. 30, 366–372 (1955). [DOI] [PMC free article] [PubMed] [Google Scholar]
- 10.Lambers H, Ribas-Carbo M in Plant respiration: from cell to ecosystem 195–205, (Springer, Netherlands, 2006). [Google Scholar]
- 11.Foyer CH, Neukermans J, Queval G, Noctor G, Harbinson J Photosynthetic control of electron transport and the regulation of gene expression. J. Exp. Bot. 63, 1637–1661 (2012). [DOI] [PubMed] [Google Scholar]
- 12.Schwander T, Schada von Borzyskowski L, Burgener S, Cortina Niña S, Erb TJ A synthetic pathway for the fixation of carbon dioxide in vitro. Science 354, 900–904 (2016). [DOI] [PMC free article] [PubMed] [Google Scholar]
- 13.Salimijazi F et al. Constraints on the efficiency of engineered electromicrobial production. Joule 4, 2101–2130 (2020). [Google Scholar]
- 14.Wise L et al. Thermodynamic constraints on electromicrobial protein production. bioRxiv 11, 469619 (2021). [DOI] [PMC free article] [PubMed] [Google Scholar]
- 15.Claassens NJ, Sousa DZ, dos Santos VAPM, de Vos WM, van der Oost J Harnessing the power of microbial autotrophy. Nat. Rev. Microbiol. 14, 692–706 (2016). [DOI] [PubMed] [Google Scholar]
- 16.Dogutan DK, Nocera DG Artificial photosynthesis at efficiencies greatly exceeding that of natural photosynthesis. Acc. Chem. Res. 52, 3143–3148 (2019). [DOI] [PubMed] [Google Scholar]
- 17.Sakimoto KK et al. Physical biology of the materials–microorganism interface. J. Am. Chem. Soc. 140, 1978–1985 (2018). [DOI] [PubMed] [Google Scholar]
- 18.Zhang T More efficient together. Science 350, 738–739 (2015). [DOI] [PubMed] [Google Scholar]
- 19.Fang X, Kalathil S, Reisner E Semi-biological approaches to solar-to-chemical conversion. Chem. Soc. Rev. 49, 4926–4952 (2020). [DOI] [PubMed] [Google Scholar]
- 20.Sakimoto KK, Wong AB, Yang PD Self-photosensitization of nonphotosynthetic bacteria for solar-to-chemical production. Science 351, 74–77 (2016). [DOI] [PubMed] [Google Scholar]
- 21.Brown KA et al. Light-driven dinitrogen reduction catalyzed by a CdS: nitrogenase MoFe protein biohybrid. Science 352, 448–450 (2016). [DOI] [PubMed] [Google Scholar]
- 22.Liu C, Colón BC, Ziesack M, Silver PA, Nocera DG Water splitting–biosynthetic system with CO2 reduction efficiencies exceeding photosynthesis. Science 352, 1210–1213 (2016). [DOI] [PubMed] [Google Scholar]
- 23.Liu C, Sakimoto KK, Colón BC, Silver PA, Nocera DG Ambient nitrogen reduction cycle using a hybrid inorganic-biological system. Proc. Natl. Acad. Sci. 114, 6450–6455 (2017). [DOI] [PMC free article] [PubMed] [Google Scholar]
- 24.Cao B et al. Silver nanoparticles boost charge-extraction efficiency in Shewanella microbial fuel cells. Science 373, 1336–1340 (2021). [DOI] [PubMed] [Google Scholar]
- 25.Zhang R et al. Proteomic and metabolic elucidation of solar-powered biomanufacturing by bio-abiotic hybrid system. Chem 6, 234–249 (2020). [Google Scholar]
- 26.Haro-González P, Martínez-Maestro L, Martín IR, García-Solé J, Jaque D High-sensitivity fluorescence lifetime thermal sensing based on CdTe quantum dots. Small 8, 2652–2658 (2012). [DOI] [PubMed] [Google Scholar]
- 27.Brown KA, Song Q, Mulder DW, King PW Diameter dependent electron transfer kinetics in semiconductor–enzyme complexes. ACS Nano 8, 10790–10798 (2014). [DOI] [PubMed] [Google Scholar]
- 28.Wiegel J “The genus Xanthobacter” in The prokaryotes, (eds Dworkin M, Falkow S, Rosenberg E, Schleifer KH, Stackebrandt E) 290–314 (Springer, New York, 2006). [Google Scholar]
- 29.Zhang H et al. Bacteria photosensitized by intracellular gold nanoclusters for solar fuel production. Nat. Nanotechnol. 13, 900–905 (2018). [DOI] [PubMed] [Google Scholar]
- 30.Wang Z et al. Efficiency accreditation and testing protocols for particulate photocatalysts toward solar fuel production. Joule 5, 344–359 (2021). [Google Scholar]
- 31.Hisatomi T, Domen K Reaction systems for solar hydrogen production via water splitting with particulate semiconductor photocatalysts. Nat. Catal. 2, 387–399 (2019). [Google Scholar]
- 32.Ferguson SJ ATP synthase: from sequence to ring size to the P/O ratio. Proc. Natl. Acad. Sci. 107, 16755 (2010). [DOI] [PMC free article] [PubMed] [Google Scholar]
- 33.Rittmann BE et al. in Environmental biotechnology: principles and applications 128–130 (McGraw-Hill, 2001). [Google Scholar]
- 34.Somers RC, Bawendi MG, Nocera DG CdSe nanocrystal based chem-/bio-sensors. Chem. Soc. Rev. 36, 579–591 (2007). [DOI] [PubMed] [Google Scholar]
- 35.Baskoutas S, Terzis AF Size-dependent band gap of colloidal quantum dots. J. Appl. Phys. 99, 013708 (2006). [Google Scholar]
- 36.Wang B et al. Biohybrid photoheterotrophic metabolism for significant enhancement of biological nitrogen fixation in pure microbial cultures. Energy Environ. Sci. 12, 2185–2191 (2019). [Google Scholar]
- 37.Jiang Z et al. AglnS2/In2S3 heterostructure sensitization of Escherichia coli for sustainable hydrogen production. Nano Energy 46, 234–240 (2018). [Google Scholar]
- 38.Gai PP et al. Solar-powered organic semiconductor-bacteria biohybrids for CO2 reduction into acetic acid. Angew. Chem. Int. Ed. 59, 7224–7229 (2020). [DOI] [PubMed] [Google Scholar]
- 39.Lakowicz JR in Principles of Fluorescence Spectroscopy (ed Lakowicz JR) 277–286 (Springer, ed. 3, 2006). [Google Scholar]
- 40.Elsen S, Colbeau A, Chabert K, Vignais PM The hupTUV operon is involved in negative control of hydrogenase synthesis in Rhodobacter capsulatus. J. Bacteriol. 178, 5174 (1996). [DOI] [PMC free article] [PubMed] [Google Scholar]
- 41.Elsen S, Swem LR, Swem DL, Bauer CE RegB/RegA, a highly conserved redox-responding global two-component regulatory system. Microbiol. Mol. Biol. Rev. 68, 263–279 (2004). [DOI] [PMC free article] [PubMed] [Google Scholar]
- 42.Yates MG, Jones CW “Respiration and nitrogen fixation in Azobacter” in Advances in microbial physiology (eds Rose AH, Tempest DW) 71–135 (Academic Press, 1974). [Google Scholar]
- 43.Grosz R, Stephanopoulos G Statistical mechanical estimation of the free energy of formation of E. coli biomass for use with macroscopic bioreactor balances. Biotechnol. Bioeng. 25, 2149–2163 (1983). [DOI] [PubMed] [Google Scholar]
- 44.Stouthamer AH A theoretical study on the amount of ATP required for synthesis of microbial cell material. Antonie Van Leeuwenhoek 39, 545–565 (1973). [DOI] [PubMed] [Google Scholar]
- 45.Jones SW, Karpol A, Friedman S, Maru BT, Tracy BP Recent advances in single cell protein use as a feed ingredient in aquaculture. Curr. Opin. Biotechnol. 61, 189–197 (2020). [DOI] [PubMed] [Google Scholar]
- 46.Leger D et al. Photovoltaic-driven microbial protein production can use land and sunlight more efficiently than conventional crops. Proc. Natl. Acad. Sci. 118 (2021). [DOI] [PMC free article] [PubMed] [Google Scholar]
- 47.Øverland M, Tauson A, Shearer K, Skrede A Evaluation of methane-utilising bacteria products as feed ingredients for monogastric animals. Arch. Anim. Nutr. 64, 171–189 (2010). [DOI] [PubMed] [Google Scholar]
- 48.Peng Y et al. Copper (I) cysteine complexes: Efficient earth-abundant oxidation co-catalysts for visible light-driven photocatalytic H2 production. Chem. Comm. 51, 12556–12559 (2015). [DOI] [PubMed] [Google Scholar]
- 49.Doyle A, Weintraub MN, Schimel JP Persulfate digestion and simultaneous colorimetric analysis of carbon and nitrogen in soil extracts. Soil Sci. Soc. Am. J. 68, 669–676 (2004). [Google Scholar]
- 50.Cabrera ML, Beare MH Alkaline persulfate oxidation for determining total nitrogen in microbial biomass extracts. Soil Sci. Soc. Am. J. 57, 1007–1012 (1993). [Google Scholar]
- 51.Sigman DM el al. A bacterial method for the nitrogen isotopic analysis of nitrate in seawater and freshwater. Anal. Chem. 73, 4145–4153 (2001). [DOI] [PubMed] [Google Scholar]
- 52.Atallah TL et al. Decay-associated fourier spectroscopy: visible to shortwave infrared time-resolved photoluminescence spectra. J. Phys. Chem. A. 123, 6792–6798 (2019). [DOI] [PubMed] [Google Scholar]
- 53.Lakowicz JR in Principles of Fluorescence Spectroscopy (ed Lakowicz JR) 142 (Springer, ed. 3, 2006). [Google Scholar]
- 54.Brown KA, Dayal S, Ai X, Rumbles G, King PW Controlled assembly of hydrogenase-CdTe nanocrystal hybrids for solar hydrogen production. J. Am. Chem. Soc. 132, 9672–9680 (2010). [DOI] [PubMed] [Google Scholar]
- 55.Wiegel J, Wilke D, Baumgarten J, Opitz R, Schlegel HG, Transfer of the nitrogen-fixing hydrogen bacterium Corynebacterium autotrophicum Baumgarten et al. to Xanthobacter gen. nov. Int. J. Syst. Evol. Microbiol, 28, 573–581 (1978). [Google Scholar]
- 56.Björkman O, Demming B Photon yield of O2 evolution and chlorophyll fluorescence characteristics at 77 K among vascular plants of diverse origins. Planta. 170, 489–504 (1987). [DOI] [PubMed] [Google Scholar]
- 57.Redfield AC, Ketchum BH, Richards FA “The influence of organisms on the composition of seawater” in The sea (ed Hill MN) 26–77 (Wiley, New York, 1963). [Google Scholar]
- 58.Lu S, Guan X, Liu C Electricity-powered artificial root nodule. Nat. Commun. 11, 1505 (2020). [DOI] [PMC free article] [PubMed] [Google Scholar]
- 59.Srivastava AK, Ambasht RS Biomass, production, decomposition of and N release from root nodules in two Casuarina equisetifolia plantations in Sonbhadra, India. J. Appl. Ecol. 32, 121–127 (1995). [Google Scholar]
- 60.Wang B, Jiang Z, Yu JCM, Wang J, Wong PK Enhanced CO2 reduction and valuable C2+ chemical production by a CdS-photosynthetic hybrid system. Nanoscale. 19, 9296–9301 (2019). [DOI] [PubMed] [Google Scholar]
- 61.Bertram JR, Ding Y, Nagpal P Gold nanoclusters cause selective light-driven biochemical catalysis in living nano-biohybrid organisms. Nanoscale Adv. 2, 2363–2370 (2020). [DOI] [PMC free article] [PubMed] [Google Scholar]
- 62.Ding Y et al. Nanorg microbial factories: light-driven renewable biochemical synthesis using quantum dot-bacteria nanobiohybrids. J. Am. Chem. Soc. 141, 10272–10282 (2019). [DOI] [PubMed] [Google Scholar]
- 63.Göbbels L et al. Cysteine: an overlooked energy and carbon source. Sci. Rep. 11, 2139 (2021). [DOI] [PMC free article] [PubMed] [Google Scholar]
- 64.Wang Y, Zheng JW, Zhang ZJ, Yuan CW, Fu DG CdTe nanocrystals as luminescent probes for detecting ATP, folic acid and l-cysteine in aqueous solution. Colloids Surf, A Physicochem. Eng. Asp. 342, 102–106 (2009). [Google Scholar]
Associated Data
This section collects any data citations, data availability statements, or supplementary materials included in this article.
Supplementary Materials
Supplementary Data 1 LC-MS results of the metabolome in the X. a. | CdTe hybrid system before and after the 15N and 13C isotope-labeling experiment.
Supplementary Data 2 Heatmap data for significantly regulated proteins and metabolites in the microbe-semiconductor hybrids in comparison to the H2-fed microbes.
Supplementary Data 3 LC-MS results of the proteome in X. autotrophicus under different experimental conditions.
Supplementary Data 4 Fold changes of protein expression comparing the microbe-semiconductor hybrids against the H2-fed microbes.
Supplementary Data 5 LC-MS results of the metabolome in X. autotrophicus under different experimental conditions.
Supplementary Data 6 Fold changes of metabolites comparing the microbe-semiconductor hybrids against the H2-fed microbes.
Data Availability Statement
The proteomic and metabolomic data generated in this study are available in the Supplementary Data files. The reference proteome of X. autotrophicus was obtained from UniProt database (UP000305131), the pathway analysis were performed based on Kyoto Encyclopedia of Genes and Genomes database (https://www.genome.jp/kegg/). Other data that support the plots within this paper and other findings of this study are available from the corresponding author upon reasonable request.