

Abstract
Over the past several decades, there has been considerable interest in the theoretical causes of work–family conflict. Most studies have focused on situational determinants, often ignoring the role of personal factors such as disposition and heritable elements. We increase understanding of person versus situation influences on WFC through estimation of the relationship between role demands and WFC after controlling for genetic confounding, measured personality traits, family confounds, and other stable dispositions. Based on twin data from the National Survey of Midlife Development in the United States (MIDUS), we examine the role of genetic factors in explaining variation in WFC (both work interference with family [WIF] and family interference with work [FIW]). Results support WFC has an additive genetic component, accounting for 31% [95% CI 18%, 45%] and 16% [95% CI 2%, 30%] of the variance in WIF and FIW, respectively. In addition, we test two competing hypotheses with regard to the relationship between role demands and WFC. Results support the phenotypic causal relationship for WIF, consistent with the notion the relationship between work demands and WIF reflect situational processes. However, results support the genetic confounding hypothesis for FIW, indicating observed relationships between family demands and FIW are primarily due to genetic factors. Our results provide new insights into the nature of WFC relationships and underscore that ignoring the influence of heritability can bias estimates of role demand effects in WFC research.
Keywords: work–family conflict, personality, role demands, genetic modeling
The topic of work and family has fueled a large body of scholarship in recent decades. Historically, much of this literature has focused on situational factors such as role demands that help or hinder one’s ability to manage multiple role responsibilities, leading to considerable knowledge regarding associations of work/family demands with outcomes such as work–family conflict (WFC; Allen et al., 2020; Michel, Kotrba, et al., 2011). Because role demands are robust predictors of WFC, attention aimed at identifying ways to reduce WFC has largely centered on organizational practices thought to facilitate role demand management, such as flexible work, dependent care support, and supportive supervision training. However, relationships between such practices and WFC are small and/or inconsistent (Allen et al., 2013; Butts et al., 2013; Hammer et al., 2011). For example, Allen et al. (2013) found mean meta-analytic correlations of and between flextime use and WIF, FIW, respectively and and between flexible location use and WIF, FIW, respectively.
A largely independent line of research has identified dispositional correlates of WFC (e.g., Allen et al., 2012; Cho et al., 2013; Michel, Clark, et al., 2011; Wayne et al., 2004), providing evidence individuals may be predisposed to WFC. For example, Allen et al. (2012) reported meta-analytic mean correlations of between neuroticism and WIF and between neuroticism and FIW. These effect sizes are comparable to those of role demands and WFC. Specifically, recent mean correlations of between work demands and WIF and between family demands and FIW have been reported (Allen et al., 2020). In addition, studies suggest substantial within-person stability of WFC across time (e.g., Matthews et al., 2014; Rantanen et al., 2012; Smith et al., 2022).
Thus, dispositional influences on WFC may be a potent confound for situational drivers such as role demands (Harden & Koellinger, 2020). Role demands are aspects of the work/family role that require sustained physical, emotional, and/or cognitive effort (e.g., Demerouti et al., 2001). Although role demands are considered a product of the environment, it is commonly accepted that individuals play an active role in selecting, modifying, constructing, and perceiving their environment (Kendler & Baker, 2007). Thus, dispositional factors may influence a person’s perception of role demands as well as their perception of WFC experiences. If that were the case, then organizational interventions aimed at managing situational factors such as role demands have less potential for impact. Thus, drawing accurate conclusions about the relationship between role demands and WFC requires accounting for dispositional confounding.
Heretofore, research on dispositional factors in WFC has relied on explicit measurement of specific individual differences traits (e.g., neuroticism). This approach draws on well-developed theoretical models of personality characteristics and their impacts on work behavior (Connelly et al., 2018). However, it is limited in that researchers must identify specific relevant constructs to measure. Other research has used longitudinal designs to model and control for dispositional factors in WFC (Cho et al., 2013; Hecht & McCarthy, 2010). By fitting fixed-effects or random-effects panel models, researchers can use each person as their own control to account for both measured and unmeasured stable factors, allowing them to better estimate if situational variables produce changes in role conflict experiences (Zyphur et al., 2020). Although longitudinal models are powerful, conducting longitudinal research is expensive, time consuming, and logistically challenging. More importantly, research typically includes employees who are already established in their work and family roles—many of the processes linking factors such as role demands with conflict experiences are likely to have reached a level of equilibrium (Smith et al., 2022). Unless there are major shocks that occur during the course of the longitudinal study (e.g., change in employment; birth of a child), there may be little change in relevant constructs for panel models to detect (McArdle, 2009).
A less-used approach to assess presumed causal effects in WFC is genetically-informative family (GIF) designs (McGue et al., 2010). GIF designs are similar to longitudinal designs in that they can account for measured and unmeasured dispositions in estimating theoretical causal relationships. Whereas longitudinal designs use each person as their own control, GIF designs use shared genetic information and developmental experiences across people to isolate unique environmental relationships. GIF designs are increasingly used in organizational psychology (e.g., Arvey et al., 2016; Shane, 2009) and social sciences broadly (Harden & Koellinger, 2020; McGue et al., 2010) to account for dispositional confounding, improving our understanding of the role of situational variables such as role demands.
Given the benefits of genetic modeling, our objective is to contribute new information as to person versus situation influences on WFC through estimation of the unique relationship between role demands and WFC after controlling for genetic confounding that is unique to and shared by both constructs, as well as measured personality traits, family confounds, and other stable dispositions. Notably, we build upon the work of Horwitz et al. (2008), who also used behavioral genetic analyses based on data from Time 1 of the National Survey of Midlife Development in the United States (MIDUS) to test relationships of neuroticism and extraversion with what they termed negative work–family spillover, which we refer to as WFC.1 Horwitz et al. reported WFC had genetic variance independent of personality. 2 We build upon their work with the MIDUS dataset by using more traditional WFC inclusion criteria and additional personality variables, therefore providing a robustness check of their estimates. 3 Most importantly, we test unique hypotheses that focus on the relationship between role demands and WFC.
In doing so, we first use the behavioral genetics method of twin studies to estimate the overall degree of genetic influence on propensity to report WFC, a necessary initial step.4 Next, we explore the degree WFC and purported antecedents, measured personality traits and role demands, overlap in their genetic correlations. These correlations shed light on potential shared developmental antecedents across variables (J. Belsky & Pluess, 2009; Turkheimer, 2000), as well as the degree observed phenotypic relationships may be biased by genetic confounding. In addition, we estimate unique environmental correlations between WFC and role demands after controlling for genetic confounding and measured personality traits, testing two competing hypotheses with regard to observed demands–WFC relationships. Finally, we incorporate multiple waves of data to examine robustness after taking time-invariant confounding factors into account.
Our research makes several key contributions to the work–family literature. First, we examine the robustness of and extend the initial behavioral genetics investigation of WFC conducted by Horwitz et al. (2008). While Horwitz et al. provided an initial cross-sectional examination of the role of genetic factors in WFC that included personality, our genetic investigation centers on an entirely different question. More specifically, we provide a precise estimate of the effects of role demands on WFC after accounting for heritability, moving the work-family literature closer to causal conclusions about this relationship. This is important in that research and theory to date has assumed WFC is primarily induced by situational factors such as role demands and thus can be mitigated through alteration of the environment. However, perceptions of role demands can be influenced by dispositions, as can reports of WFC (Stoeva et al., 2002). Moreover, individuals play an active role in shaping their work and their family situations through the decisions and strategies they deploy throughout the life course (Greenhaus & Powell, 2016). Incorporation of genetics can help to capture the “whole” influence of the person (Li, Zhang, et al., 2016), thereby providing a more integrative and nuanced understanding of the etiological basis of WFC to guide future theory development, research, and practice.
More precisely distinguishing person and situation determinants of WFC is not a trivial exercise in that our results have key implications for work–family research and practice. For example, if the relationship between situational role demands and WFC is greatly reduced after accounting for genetic confounding, this suggests interventions intended to directly impact the management of role demands (e.g., flexible work arrangements; job control) may not be broadly effective. Instead, organizations might focus more on individualized approaches to helping people manage their specific dispositions toward adverse work–family outcomes. Conversely, if the relationship between role demands and WFC largely remains intact, this speaks to the likely efficacy of demands-focused interventions for fostering a healthy work–family interface.
Theoretical Background and Hypotheses
WFC occurs when demands from work and family roles are mutually incompatible in some respect (Greenhaus & Beutell, 1985). Generally, the direction of the conflict is distinguished—work can interfere with family (WIF) and family can interfere with work (FIW). We use work–family conflict (WFC) as an umbrella term that reflects either direction and WIF/FIW to reflect a specific direction. Examining the role of genetic factors and WFC is a worthwhile endeavor. Genetic factors have been implicated in a wide variety of organizational phenomena such as leadership, entrepreneurship, job satisfaction, well-being, and occupational choices (e.g., Arvey et al., 2006, 2007; Li, Stanek, et al., 2016; Li, Zhang, et al., 2016; Nicolaou & Shane, 2010; Zhang et al., 2009), with estimated heritability coefficients around h2 ≈ .28−.48.5 Moreover, genetic influences are also implicated in an array of family-related events and variables, such as parenting behavior and family conflict (h2 ≈ .07–.39; Kendler & Baker, 2007). Characteristics ranging from personality (Amin et al., 2013; Nagel et al., 2018; Vukasović & Bratko, 2015), to mental health (Akingbuwa et al., 2020), and even to social outcomes such as educational attainment (de las Fuentes et al., 2020) are substantially heritable. This does not mean these characteristics or outcomes are predestined, but rather indicates genes have pervasive influences on human behavior (Harden & Koellinger, 2020).
Thus, it is reasonable to expect differences in genes will also impact people’s propensity to perceive WFC. Importantly, we are not suggesting genes independently determine levels of WFC, but rather that genetics can increase the likelihood of perceiving WFC. Genetic influence does not mean WFC or any other characteristic is immutable; it merely indicates apparent variable correlations might reflect both dispositional and situational factors, potentially overestimating the impact of interventions or other situational factors. That is, genetics set the stage for individual tendencies or predispositions that can, in turn, structure environmental experiences in a way that intensifies the likelihood that an individual will think, feel, or act in a certain way (Judge et al., 2012). For example, genes may impact a person’s tendency to select into work and family situations that are more or less conducive to WFC. On the work side, this speculation is supported by findings that indicate genetics help explain job choice, occupational preferences, and social status attainment (Ellis & Bonin, 2003; Shane et al., 2010). On the family side, genetics help explain age at first birth of child and number of children over the course of life (Barban et al., 2016).
Hypothesis 1. Genetic factors account for a significant portion of variance in WFC.
Personality Traits
With the dominant focus on work/family role demands, early work–family models (e.g., Frone et al., 1992), for the most part, did not consider dispositional factors. However, individuals can play an active role in shaping their work and family situations (Greenhaus & Powell, 2016). Personality traits influence how people adapt to and shape their environments (DeYoung, 2015; Wiernik & Kostal, 2019). For example, traits such as agreeableness may predispose people to develop support networks that facilitate multiple role engagement (Allen et al., 2012). Indeed, research has shown personality traits, particularly neuroticism, are robust correlates of WFC (e.g., Allen et al., 2012; Bruck & Allen, 2003; Stoeva et al., 2002; Wayne et al., 2004). As noted above, personality traits are substantially heritable (Vukasović & Bratko, 2015). Genetic influences on work-related variables are often hypothesized to be partially explained by shared genetic variance with personality traits (e.g., Ilies & Judge, 2003; Judge et al., 2012; Shane et al., 2010). Accordingly, we also expect personality traits and WFC share some of their genetic etiologies.
Hypothesis 2. Personality shares genetic correlates with WIF/FIW.
Role Demands
Research consistently shows work role demands are robust predictors of WIF and family role demands are robust predictors of FIW (e.g., Allen et al., 2020; Amstad et al., 2011; Ford et al., 2007; Michel et al., 2010). Explanation of the relationship between role demands and WFC is based on scarcity theory (Goode, 1960), which notes individuals have limited time, attention, and energy resources. Employees experience WFC when they lack sufficient resources to meet competing work and family role demands (Edwards & Rothbard, 2000; Goode, 1960). Although not without controversy, there is a longstanding tradition of studying stressors such as job demands based on subjective self-reports (Demerouti et al., 2001; Perrewé & Zellars, 1999). This approach centers the focus on the individual’s interpretation of the environment rather than on objective features of the job. Importantly, studies that include both objective (observer ratings) and subjective (self-report) ratings of job demands in relation to strain find similar results, lending credence to the notion self-reports of demands reflect the situational context (Demerouti et al., 2001; Spector & Jex, 1998).
As noted previously, it is commonly accepted that individuals actively select, modify, construct, and perceive their environment (Kendler & Baker, 2007). To that end, job demands correlate with genetic factors (Li, Zhang, et al., 2016; Theorell et al., 2016). Moreover, Li et al. estimated heritability of h2 = 25.6% for general job demands, and Theorell et al. reported a heritability estimate of h2 = 29% for psychological work demands. Given genetic factors are likely to affect both role demands and WFC, as well as these variables’ observed (phenotypic) relationships, it is likely they also share some common genetic etiologies (i.e., the same genetic factors influence both characteristics). Accordingly, we expect role demands and WFC to be genetically correlated.
Hypothesis 3. Work demands shares genetic correlates with WIF.
Hypothesis 4. Family demands shares genetic correlates with FIW.
Competing Perspectives: Role Demands Effects Controlling for Genetic Confounding
If role demands and WFC share genetic correlates, then it is possible that observed phenotypic relationships between these variables primarily result from genetic confounding. For example, genetic factors may predispose a person to make more negative evaluations of both role demands and conflict, or they may predispose a person to have more elevated stress responses to both demands and potential conflict situations (e.g., Kohler et al., 2011). If the observed relationship between demands and conflict primarily reflects such shared genetic or otherwise dispositional antecedents, then controlling for these factors would substantially reduce observed demands–conflict relationships. This reduction may be especially apparent if measured dispositional variables (e.g., personality traits) are also controlled. We refer to this as the Genetic Confounding hypothesis.
Hypothesis 5a. Genetic Confounding: The estimated relationship between role demands and WFC will be largely reduced once genetic factors and personality traits are controlled.
On the other hand, the observed relationship between role demands and conflict may truly reflect the primarily situational processes that dominate the work–family literature (Allen et al., 2020). If this is the case, then substantial role demands → WFC relationships may persist even after controlling for genetic confounding or measured dispositional characteristics. This pattern would be aligned with existing work–family theory, which posits that exposure to situational role stressors in one role (e.g., work) limits peoples’ abilities to meet the demands associated with other roles (e.g., family), resulting in WFC (Frone et al., 1992; Greenhaus & Beutell, 1985). If this pattern is observed, causal interpretations of demands–conflict relationships are more warranted (though we note relationships may also reflect other shared environmental shocks distinct from dispositional factors). We refer to this possibility as the Phenotypic Causal hypothesis.
Hypothesis 5b. Phenotypic Causal: The estimated relationship between role demands and WFC will remain largely intact once genetic factors and personality traits are controlled.
Stability of Effects
Although genetically informative models can control for a potentially major source of confounding in variable relationships, residual dispositional confounding can still remain due to each person’s unique developmental experiences (e.g., unique work histories impacting role demands and conflict perceptions). Thus, stronger causal tests can be made by combining genetically-informative and panel designs. To this end, we used three waves of data to account for all possible time-invariant confounding factors (i.e., all persistent dispositions) associated with role demands and WFC relationships. These estimates provide increased clarity as to the impact of role demands on conflict absent dispositional factors. Specifically, if the estimated relationship between role demands and WFC persists after further accounting for time-invariant factors, this would strengthen conclusions about the effects of job and family role demands on WFC.
Research Question 1. Does the relationship between role demands and WFC persist after accounting for all possible time-invariant confounding factors?
Method
Participants and Procedures
Data came from the National Survey of Midlife Development in the United States (MIDUS). MIDUS 1, conducted 1995–1996, and consisted of 7108 randomly-sampled Americans aged 25 to 74 (Brim et al., 2004). Follow up studies with the same participants were conducted in 2004–2006 and in 2013–2014. Data from MIDUS has been used in publications on different topics by the first author (Allen et al., 2017; Cho et al., 2013; French et al., 2019; French et al., 2019). For the current study, participants were non-institutionalized, English-speaking adults who resided in the contiguous United States. Our study was limited to the 998 screened pairs of monozygotic (MZ) or dizygotic (DZ) twins. Researchers called households and asked about the presence and contact information for twins in the respondent’s or spouse’s immediate family. Participants who indicated the presence of twins in the household or who were part of a twin pair themselves were invited to participate in a twin study and to provide contact information for the co-twin. Given our focus on WFC, we applied standard inclusion criteria used in such studies. Participants were required to work 20 or more hours a week in paid employment. In addition, they had to be married/partnered and/or have a child under 18 in the household. This resulted in a final sample at Time 1 of 140 MZ and 185 DZ twin pairs (325 total pairs, 650 total individuals). Zygosity in MIDUS is based on questions about physical similarity and how often people confused the twins when they were growing up (Felson, 2014). Among the DZ twins, 77 dyads were gender-discordant, 64 were both male, and 44 were both female; among the MZ twins, 85 dyads were male and 55 dyads were female. At Time 1, participants ranged in age from 25 to 65 (mean = 42.53, SD = 9.28). The majority (95.7%) were white. At Time 2 there were 113 total dyads (226 total people, 51 MZ dyads, 62 DZ dyads) who met inclusion criteria and at Time 3 the sample consisted of 19 total dyads (38 total people, 14 MZ, 5 DZ).
Measures
Table 1 provides details about each measure used, including five items on work demands, five items on family demands, four items for WIF and FIW, respectively, and the items for each of the Big 5 personality traits. Each personality adjective was rated as resembling the respondent from “A lot” (1) to “Not at all” (4), and subsequently reverse-scored where appropriate, so higher scores indicated greater perceptions of that adjective as representative of the self. See Table 1 for scaling of other measures. We conducted an independent study to assess the validity of the WFC, work demands, and family demands measures, which is detailed in Appendix A.
Table 1.
Measures Used in the Study
| Construct | List of Items |
|---|---|
| Work Interference with Family | How often have you experienced each of the following in the past year? |
| Your job reduces the effort you can give to activities at home. | |
| Stress at work makes you irritable at home. | |
| Your job makes you feel too tired to do the things that need attention at home. | |
| Job worries or problems distract you when you are at home. | |
| Responses ranged from “All the time” (1) to “Never” (5) and were reverse-scored, so higher scores indicated greater WIF. | |
|
| |
| Family Interference with Work | How often have you experienced each of the following in the past year? |
| Responsibilities at home reduce the effort you can devote to your job. | |
| Personal or family worries and problems distract you when you are at work. | |
| Activities and chores at home prevent you from getting the amount of sleep you need to do your job well. | |
| Stress at home makes you irritable at work. | |
| Responses ranged from “All the time” (1) to “Never” (5) and were reverse-scored, so higher scores indicated greater FIW. | |
|
| |
| Job Demands | In the past year, how often has each of the following occurred at your job? |
| You have too many demands made on you. | |
| You have enough time to get everything done | |
| You have a lot of interruptions. | |
| Please indicate how often each of the following is true of your job? | |
| How often do you have to work very intensively – that is, you are very busy trying to get things done? | |
| How often do different people or groups at work demand things from you that you think are hard to combine? | |
| Responses were made on a five-point scale that ranged from “All the time” (1) to “Never” (5) and reverse-scored when appropriate, so higher scores indicated greater work demands. | |
|
| |
| Family Demands | In the past year, how often has each of the following occurred at home? |
| You have too many demands made on you. | |
| You have enough time to get everything done | |
| You have a lot of interruptions. | |
| Please circle the appropriate number for each item. | |
| Not including your spouse or partner, how often do members of your family make too many demands on you? | |
| How often does your spouse or partner make too many demands on you? | |
| First three items based on a five-point scale that ranged from “All the time” (1) to “Never” (5) Last two-items based on a four-point scale that ranged from “Often” (1) to “Never” (4). Given the different number of scale points across the items, items were transformed using the percent of maximum possible (POMP) method (Cohen et al., 1999). Specifically, all items were transformed into a scale that ranged from 0 to 100 using the formula: POMP = 100 × [(Observed score − Min possible)⁄(Max possible − Min possible)]. Using this method, the minimum score across items was equivalent (i.e., 0) as was the maximum score (i.e., 100). Additionally, responses were reverse-scored when appropriate, so higher scores indicated greater family demands. | |
|
| |
| Extraversion | Please indicate how well each of the following describes you. |
| Outgoing | |
| Friendly | |
| Lively | |
| Active | |
| Talkative | |
|
| |
| Agreeableness | Please indicate how well each of the following describes you. |
| Helpful | |
| Warm | |
| Caring | |
| Soft-hearted | |
| Sympathetic | |
|
| |
| Neuroticism | Please indicate how well each of the following describes you. |
| Moody | |
| Worrying | |
| Nervous | |
| Calm | |
|
| |
| Openness | Please indicate how well each of the following describes you. |
| Creative | |
| Imaginative | |
| Intelligent | |
| Curious | |
| Broad-minded | |
| Sophisticated | |
| Adventurous | |
|
| |
| Conscientiousness | Please indicate how well each of the following describes you. |
| Organized | |
| Responsible | |
| Hardworking | |
| Careless | |
Note: All items from MIDUS.
Analyses
We estimated overall correlations and intraclass correlation coefficients (ICCs) for each variable, as well as confidence intervals, using the methods described by Griffin and Gonzalez (1995) to account for dependency of the data within twin pairs. We compared intraclass correlations between MZ and DZ groups using the methods described by Zou (2007).
Biometric Variance Component Analyses
Like previous research (Archontaki et al., 2013; Li, Stanek, et al., 2016), we estimated the relative effects of genetic and environmental factors using ADCE models (Neale & Cardon, 1992). ADCE models aim to decompose observed, or phenotypic, variance into 4 components: additive and non-additive genetic (A and D; reflects effects of shared genetic material), shared environmental (C; reflects environmental factors that cause members of the same household to be more similar), and unique environmental (E; reflects environmental factors that cause members of the same household to be less similar). A bivariate ADCE model for role demands and role conflict is shown in Figure 1.
Figure 1. Biometric Variance Components for Role Demands and WFC.
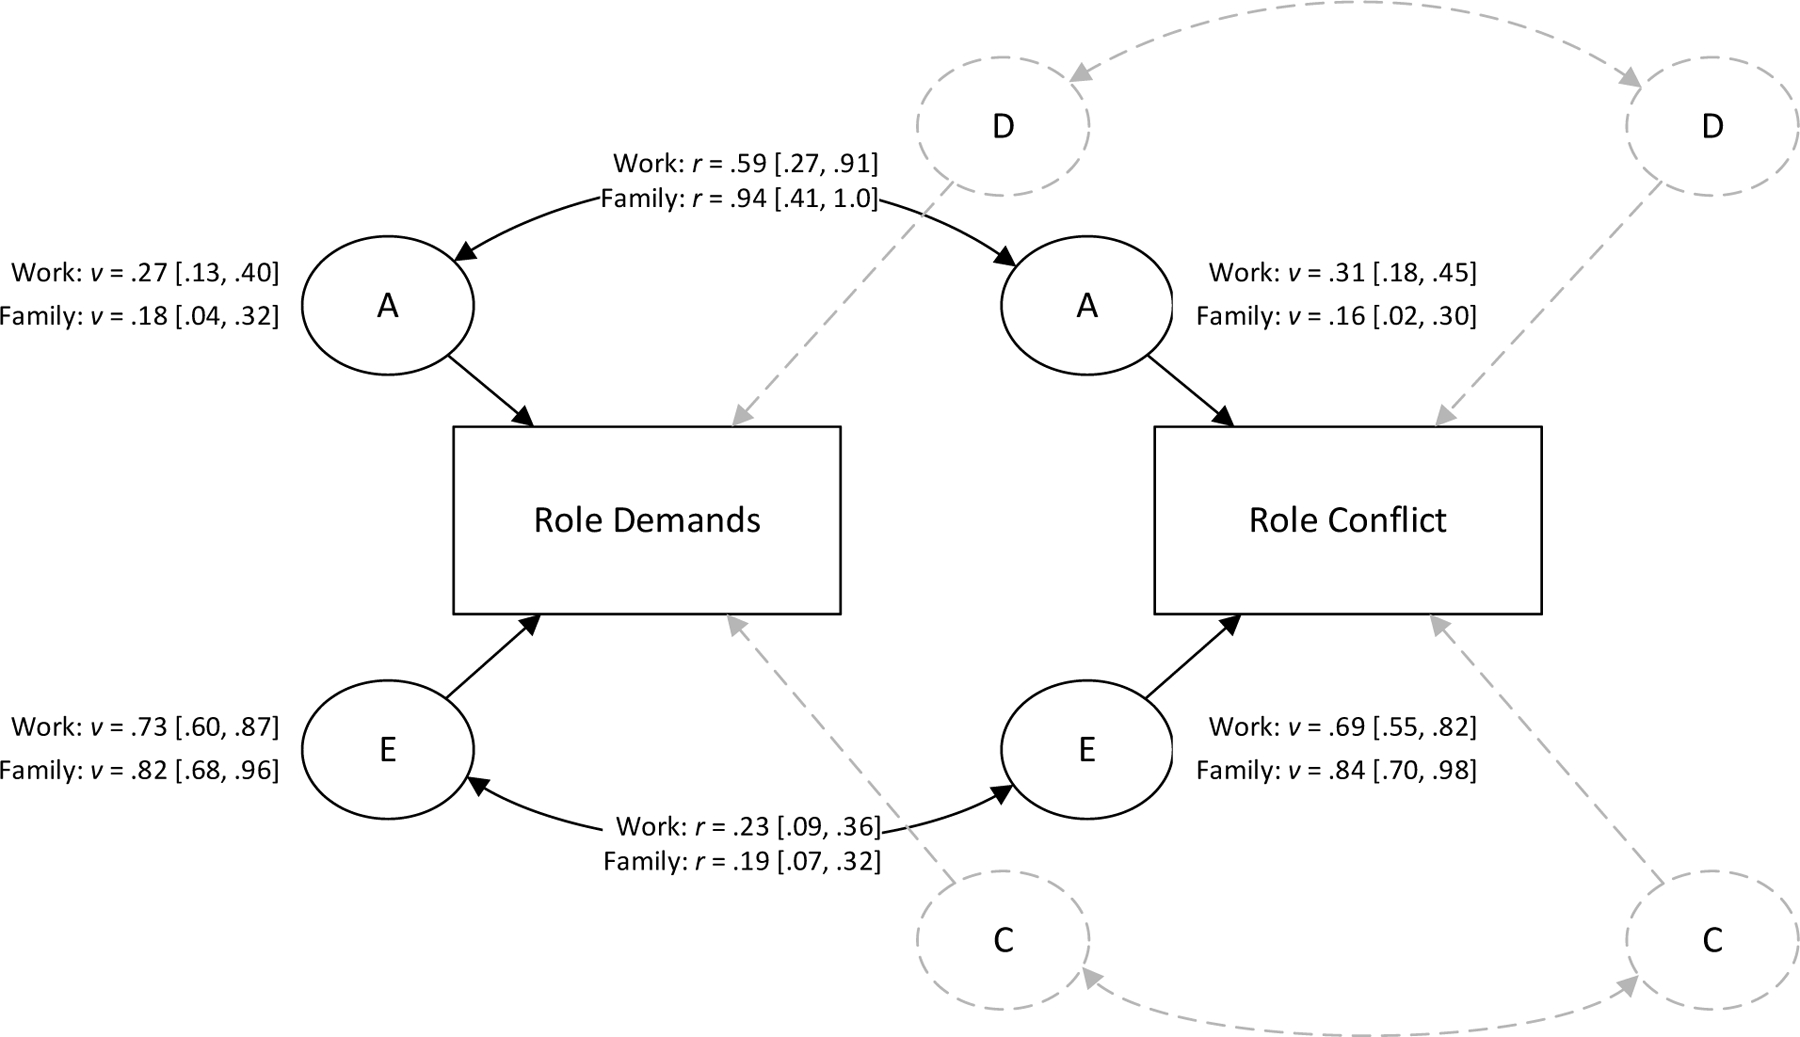
Note. A = additive genetic, D = dominance genetic, C = shared environmental, E = unique environmental. D and C components dropped from the model, so only A and E components remain. Curved paths are latent correlations. Values next to latent variables are estimated variances. Values in brackets are 95% normal-theory confidence intervals. Paths from latent variance components to observed phenotypes fixed to 1.0 for identification.
We used the variance components parameterization of the ADCE model (Neale & Cardon, 1992). In this parameterization, the variances of and covariances among the A, D, C, and E latent variables for each observed scale are estimated directly, similar to how latent variable variances and covariances are estimated in other structural equation models. Variance component parameterization has two advantages over the more common Cholesky parameterization (Neale & Cardon, 1992). First, it has more accurate Type I error rates. Second, it allows variance component estimates to be negative, which can indicate model misspecification. We compared submodels that could be estimated with the MIDUS data (ACE, ADE, AE). For all variables, the AE model containing only additive genetic and unique environmental components fit best and was retained (see Appendix B). This indicates variance is best represented as a combination of (1) additive genetic factors that make family members more similar and (2) environmental experiences that make them more distinct.
After estimating final biometric variance component models for each construct (WIF, FIW, role demands, personality traits), we fit a multivariate biometric variance component model, allowing the variance components of each type to covary across constructs (e.g., A components for WFC, role demands, and personality traits were allowed to intercorrelate). We used this model to estimate the size of variance components (e.g., heritability, unique environmental variance) for each construct, as well as genetic [A] and unique environmental [E] correlations between WIF/FIW and role demands and personality traits. These correlations estimate the degree these phenotypic characteristics share common genetic etiologies or respond to similar environmental shocks. Gender and age can potentially bias estimates of heritability (e.g., because all monozygotic twins are sex-concordant but some dizygotic twins are sex-discordant, failing to control for gender may overestimate heritability), so we controlled for gender, age, and age-squared in all models.
Genetically-Informed Causal Modeling
To estimate the theoretical causal effects of role demands on WIF/FIW, we fit a series of regression models with increasing levels of control for potential confounding factors. First, as a baseline estimate with no controls, we fit a bivariate phenotypic regression model with only role demands as a predictor of role conflict. Second, we added personality traits and cross-domain role demands as controls. Third, we estimated three models that control for genetic confounding: (1) an AE regression model using the AE model unique environment [E] correlations; (2) an AE–β model; and (3) a within-between fixed-effects MZ co-twin control model (Kohler et al., 2011). See Appendix C for greater detail on these models. These models each make different assumptions, so they can be regarded as complementary estimators to examine robustness. Finally, to further control for other stable person-specific unique environmental confounding, we fit a model based on all three waves of MIDUS data. This model included MZ co-twin controls as above, as well person-specific fixed effects using the first-difference estimator (Wooldridge, 2002).
In evaluating whether estimated effects of role demands are biased due to confounding variables, it is critical to focus on effect size magnitude and uncertainty, rather than merely statistical significance (Amrhein et al., 2019; Cumming, 2014). Estimated effects of role demands may be statistically significant even after controlling for confounders, but the size of the effects substantially reduced. To guide our interpretation of effect sizes, we used empirical benchmarks identified by Paterson et al. (2016) who integrated 30 years of meta-analyses and identified values of r = .10, .20, and .30 as the quartiles for the distribution of correlation effect sizes observed in organizational research. We use these values as thresholds for “small”, “medium”, and “large” effects, respectively. If the estimated effects of role demands on WFC are reduced after controlling for confounders such that the estimate falls into a qualitatively different quarter of the effect size distribution, we take this as evidence in favor of the genetic confounding hypothesis—that naïve phenotypic correlations overestimate the causal effect of role demands on WFC.
Transparency and Openness
We described our sampling plan, inclusion criteria, and measures, and we adhered to the methodological checklist. We conducted biometric variance component analyses using the OpenMx (v. 2.19.5; Neale et al., 2016) and umx packages (v. 4.8.0; Bates et al., 2019) in R (v. 4.1.0; R Core Team, 2021). We estimated multilevel models using the glmmTMB package (v. 1.1.1; Magnusson et al., 2021) in R. We did not pre-register. Data, syntax, and annotated output can be found at https://osf.io/dy7m4/?view_only=6ac294b15a0f4fe49e895e4220e21ef9.
Results
Table 2 shows means, standard deviations, intraclass correlations (ICC), and individual-level variable intercorrelations for the full sample. ICCs ranged from .10 (Agreeableness) to .30 (Neuroticism). ICCs were substantially higher among MZ twins (ICCs ranged .29 to .40, mean = .33) than DZ twins (ICCs ranged −.03 to +.21, mean = .11). WFC was more highly correlated within MZ versus DZ twins for both WIF (ICCMZ = .36, ICCDZ = .15, diff = .21 [95% CI .001, .40]) and FIW (ICCMZ = .27, ICCDZ = .07, diff = .20 [95% CI −.01, +.41]). This pattern of results supports a substantial genetic component underlying WFC.
Table 2.
Descriptive Statistics and Correlations Using Full Sample at Time 1
| Variable | M | SD | ICC | 1 | 2 | 3 | 4 | 5 | 6 | 7 | 8 | 9 | 10 | 11 |
|---|---|---|---|---|---|---|---|---|---|---|---|---|---|---|
| 1. Zygosity (0 = DZ, 1 = MZ) | 0.57 | 0.50 | — | — | ||||||||||
| 2. Sex (0 = Male, 1 = Female) | 0.42 | 0.49 | .51 | .04 | — | |||||||||
| 3. Age | 42.53 | 9.28 | .97 | −.02 | −.06 | — | ||||||||
| 4. Agreeableness | 0.06 | 0.97 | .10 | −.03 | .26 | .04 | (.81) | |||||||
| 5. Extraversion | 0.15 | 1.00 | .23 | −.02 | .06 | .02 | .49 | (.79) | ||||||
| 6. Neuroticism | 0.17 | 1.03 | .30 | .08 | .11 | −.16 | −.02 | −.09 | (.75) | |||||
| 7. Openness | 0.17 | 0.96 | .25 | −.07 | −.01 | −.02 | .35 | .51 | −.19 | (.76) | ||||
| 8. Family demands | 0.05 | 0.99 | .18 | .04 | .17 | −.19 | .02 | −.02 | .19 | .05 | (.65) | |||
| 9. Work demands | 0.12 | 0.95 | .18 | .06 | .02 | −.06 | .06 | .06 | .14 | .08 | .25 | (.74) | ||
| 10. Work interference with family (WIF) | 0.10 | 0.94 | .24 | .03 | −.03 | −.14 | −.06 | −.22 | .36 | −.12 | .21 | .34 | (.76) | |
| 11. Family interference with work (FIW) | 0.04 | 0.98 | .16 | .04 | .05 | −.20 | −.11 | −.13 | .29 | −.06 | .35 | .17 | .46 | (.75) |
Note. N = 650; DZ = dizygotic; MZ = monozygotic; ICC = intraclass correlation; 95% confidence intervals for intraclass correlations ≈ ICC ± .10; all ICC confidence intervals except for Agreeableness exclude zero; 95% confidence intervals for variable intercorrelation ≈ rxy ± .08; confidence intervals for | r | ≥ .08 exclude zero; confidence intervals constructed accounting for nesting within families (Griffin & Gonzalez, 1995); values in parentheses on the diagonal are coefficient α. Data are from MIDUS Time 1.
Genetic and Environmental Variance Components for Role Conflict
Hypothesis 1 predicted genetic factors would account for a substantial portion of variance in WFC. Variance component estimates for each characteristic are shown in Table 3 and Figure 1. The additive genetic component accounted for 31% [95% CI 18%, 45%] of WIF variance and 16% [95% CI 2%, 30%] of FIW variance. Accordingly, Hypothesis 1 was supported.
Table 3.
Biometric Variance Components for Study Constructs at Time 1
| Additive genetic [A] |
Unique environment [E] |
|||||
|---|---|---|---|---|---|---|
| Construct | Var. comp. | 95% conf. int. | Var. comp. | 95% conf. int. | ||
| Family demands | 0.18 | 0.04 | 0.32 | 0.82 | 0.68 | 0.96 |
| Work demands | 0.27 | 0.13 | 0.40 | 0.73 | 0.60 | 0.87 |
| Agreeableness | 0.17 | 0.02 | 0.32 | 0.83 | 0.68 | 0.98 |
| Extraversion | 0.35 | 0.22 | 0.48 | 0.65 | 0.52 | 0.78 |
| Neuroticism | 0.39 | 0.27 | 0.51 | 0.61 | 0.49 | 0.73 |
| Openness | 0.35 | 0.23 | 0.48 | 0.65 | 0.52 | 0.77 |
| Work interference with family (WIF) | 0.31 | 0.18 | 0.45 | 0.69 | 0.55 | 0.82 |
| Family interference with work (FIW) | 0.16 | 0.02 | 0.30 | 0.84 | 0.70 | 0.98 |
Note. AIC = Akaike information criterion values based on univariate biometric variance component models. Var. comp. = variance components estimated from the final multivariate AE model including all eight constructs. Confidence intervals are 95% profile likelihood confidence intervals. Results controlling for gender, age, and age-squared. Data are from MIDUS Time 1.
Genetic and Environmental Correlations with Role Demands and Personality Traits
Hypothesis 2, which predicted personality traits have genetic overlap with WIF/FIW, was supported. Genetic correlations (Table 4) were as follows: extraversion (rWIF = −.29, rFIW = −.38), openness (rWIF = .05, rFIW = −.43), neuroticism (rWIF = .36, rFIW = .20), agreeableness (rWIF = .19, rFIW = −.12). Additionally, the four personality traits multiple genetic correlations exceeded that of each variable by itself (RWIF = .61, RFIW = .49).
Table 4.
Genetic and Environmental Correlations among Study Constructs at Time 1
| Variable | 1 | 2 | 3 | 4 | 5 | 6 | 7 | 95% conf. int. | 8 | 95% conf. int. | ||
|---|---|---|---|---|---|---|---|---|---|---|---|---|
| 1. Family demands | .41╲.87 | .10 | −.11 | −.06 | .08 | −.07 | .15 | .01 | .28 | .19 | .07 | .32 |
| 2. Work demands | .75 | .49╲.81 | .11 | .14 | −.06 | .20 | .23 | .09 | .36 | .09 | −.04 | .23 |
| 3. Agreeableness | .38 | −.10 | .39╲.85 | .49 | −.11 | .41 | −.12 | −.26 | .02 | −.12 | −.25 | .02 |
| 4. Extraversion | .11 | −.09 | .54 | .59╲.80 | −.08 | .54 | −.17 | −.31 | −.04 | −.05 | −.19 | .09 |
| 5. Neuroticism | .33 | .52 | .14 | −.13 | .63╲.79 | −.21 | .34 | .22 | .47 | .30 | .18 | .43 |
| 6. Openness | .38 | −.22 | .28 | .49 | −.22 | .57╲.77 | −.21 | −.35 | −.08 | .05 | −.09 | .19 |
| 7. Work interference with family (WIF) 95% conf. int. | .38 | .59 | .19 | −.29 | .36 | .05 | .52╲.77 | .39 | .27 | .51 | ||
| 95% conf. int. | −.03 | .27 | −.28 | −.59 | .11 | −.26 | ||||||
| .78 | .91 | .65 | .003 | .61 | .37 | |||||||
| 8. Family interference with work (FIW) 95% conf. int. | .94 | .41 | −.12 | −.38 | .20 | −.43 | .68 | .38╲.87 | ||||
| 95% conf. int. | .41 | −.08 | −.75 | −.81 | −.18 | −.89 | .32 | |||||
| 1.00 | .89 | .50 | .06 | .58 | .03 | 1.00 | ||||||
Note. Additive genetic [A] correlations below the diagonal. Unique environmental [E] correlations above the diagonal. Values estimated from the final multivariate AE model including all eight constructs. Values on the diagonal for each correlation matrix are latent standard deviations for the A and E factors for each construct. 95% conf. int. = 95% normal-theory confidence intervals. Confidence intervals were constrained to ±1 when reported.
Upper bound for genetic correlations with Agreeableness would not converge due to the small genetic variance component for this trait. Data are from MIDUS Time 1.
Hypothesis 3 predicted work demands share genetic correlates with WIF, and Hypothesis 4 predicted family demands share genetic correlates with FIW. If the confidence interval for the genetic correlation includes 100%, the data are compatible with genetic etiologies of WIF/FIW being entirely shared with role demands. Hypotheses are supported if the genetic correlation is large (e.g., r > .50). Conversely, if the genetic correlation is small (e.g., r < .20), that suggests genetic factors contributing to WIF/FIW are largely distinct from role demands.
WIF and FIW were strongly genetically correlated (r = .68), indicating these two forms of WFC largely share genetic etiologies. FIW also showed a strong genetic correlation with family role demands (r = .94), again indicating the genetic factors predisposing FIW are large and essentially completely overlap with those predisposed to perceiving high family role demands. WIF showed a large genetic correlation with work role demands (r = .59), but this was smaller than for family demands and FIW. Results suggest largely overlapping genetic etiologies for role demand perceptions and WFC, though WIF may have some genetic components unique from role demands.
Genetically-Informed Causal Modeling
Hypothesis 5a, the Genetic Confounding hypothesis posited that the observed demands–conflict relationships primarily reflected shared genetic and other dispositional factors and would thus be largely reduced once genetic factors and personality traits were controlled. Conversely, Hypothesis 5b, the Phenotypic Causal hypothesis posited that the observed relationship primarily reflected causal influences of role demands on WFC experiences (or at least were caused by shared environmental shocks distinct from dispositional factors). Research Question 1 asked if the relationship between role demands and WFC would further persist after accounting for all possible time-invariant confounding factors. Regression analyses testing these hypotheses and the research question are shown in Table 5 and results are illustrated in Figure 2. Data were analyzed to see if the regression estimates from work demands to WIF and home demands to FIW were consistent across the various models that included differing levels of controls. If estimates are largely consistent across the models, support for the phenotypic causal hypothesis would be indicated, whereas if the estimates are considerably reduced as the rigor of the statistical controls increased, support would point toward the genetic confounding hypothesis. Additionally, because co-twin control models are estimated using only MZ twins, separate analyses were reported based on the MZ-only sample to allow for accurate comparisons to the co-twin control model.
Table 5.
Estimated Effects of Role Demands on WFC for Alternative Model Specifications
| Full sample |
Monozygotic twins |
||||||
|---|---|---|---|---|---|---|---|
| Type | Model | β | 95% conf. int. | β | 95% conf. int. | ||
| Work demands → Work interference with family (WIF) | |||||||
| Phenotypic | Bivariate | .33 | .26 | .40 | .40 | .28 | .51 |
| Personality controls | .29 | .22 | .36 | .37 | .26 | .47 | |
| Genetic controls | AE: E regression | .28 | .16 | .41 | — | — | — |
| AE–β regression | .20 | .07 | .33 | — | — | — | |
| Co-twin control | — | — | — | .34 | .20 | .48 | |
| Genetic + panel controls | Co-twin control, panel first difference | — | — | — | .31 | .15 | .46 |
| Family demands → Family interference with work (FIW) | |||||||
| Phenotypic | Bivariate | .34 | .27 | .42 | .31 | .20 | .42 |
| Personality controls | .28 | .21 | .35 | .26 | .15 | .36 | |
| Genetic controls | AE: E regression | .16 | .03 | .28 | — | — | — |
| AE–β regression | .19 | .06 | .32 | — | — | — | |
| Co-twin control | — | — | — | .12 | −.03 | .27 | |
| Genetic + panel controls | Co-twin control, panel first difference | — | — | — | .10 | −.03 | .24 |
Note. β = standardized regression coefficient. 95% conf. int. = 95% confidence interval (t-pivot intervals for phenotypic models, normal-theory for models with genetic or panel controls); co-twin control models are estimated using only MZ twins, so phenotypic models using only MZ twins also shown for reference. Control variable coefficients omitted (Westreich & Greenland, 2013). First difference is the model estimator that was used. Panel data from MIDUS Time 1, 2, and 3.
Figure 2. Effects of role demands on conflict across models with increasing causal controls.
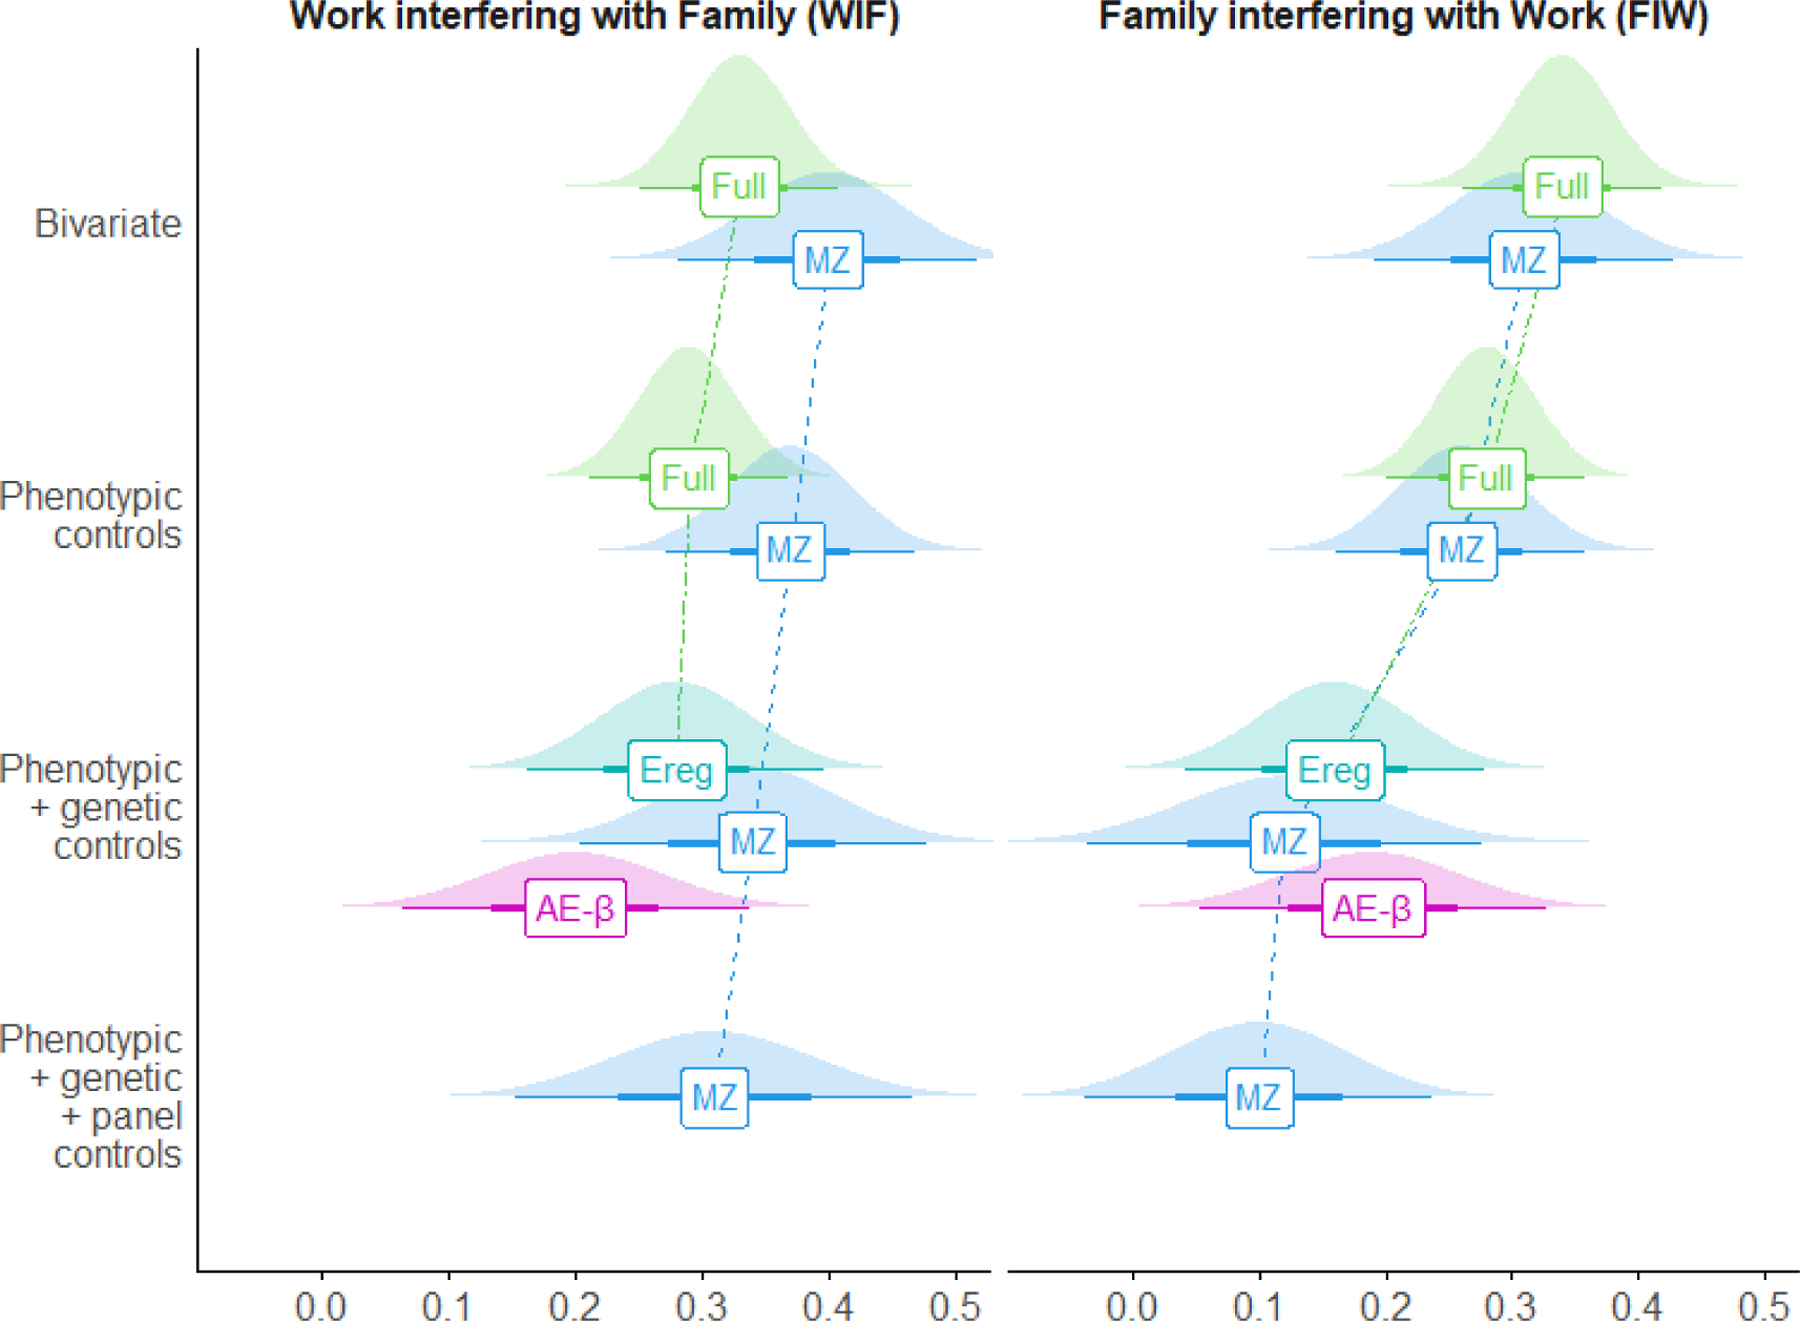
Standardized β coefficients with 95% confidence intervals and densities
Note: Full = full sample phenotypic regression,
MZ = monozygotic twin regression (genetic controls by co-twin control),
Ereg = full sample regression using AE mode ‘E’ correlations, AE-β = full sample AE-β model regression.
Results diverged across WFC direction. For FIW, phenotypic regression showed strong effects of family demands alone (βbivariate = .34) or when controlling for personality traits and work demands (βcontrolled = .28). However, the effect decreased dramatically when controlling for genetic confounding (βEreg = .16, βAE–β = .19, βCTC = .12) and stable person-specific effects (βCTC–FD = .10). Conversely, for WIF, the phenotypic estimates were again strong (βbivariate = .33; βcontrolled = .29), but the effect decreased only modestly when controlling for genetic (βEreg = .28, βAE–β = .20, βCTC = .34) or genetic and stable person-specific confounding (βCTC–FD = .31). Thus, results largely supported the Phenotypic Causal hypothesis for WIF, but the Genetic Confounding Hypothesis for FIW.
Supplemental Analyses
We conducted additional analyses to determine if similar results for H1-H4 were found based on Time 2 data. These results are presented in Appendix D and align with the Time 1 findings. We also examined the estimated effects of gender. Pertaining to the phenotypic estimates for WIF, women reported less WIF than did men (B = −.17, 95% CI [−.27, −.07]), whereas there was no significant difference for FIW (B = .05, 95% CI [−.06, .15]). Within the panel analyses, gender was not significantly related to FIW among MZ (B = .01 95% CI [−.26, .28]) nor DZ (B = .08, 95% CI [−.13, .29]) twins. Similar results were observed for WIF among MZ (B = −.02, 95% CI [−.29, .26]) and DZ twins (B = −.04, 95% CI [−.26, .19]).
Discussion
Organizational psychologists are increasingly interested in the biological foundations of organizational phenomena (e.g., Li, Stanek, et al., 2016). Concurrently, work–family research has become an increasingly focal topic within organizational science. We unite these research streams by examining genetic correlates of WFC. Results show a substantial genetic component for WFC (i.e., 31% of the variance in WIF, 16% of the variance in FIW). These estimates are comparable to other work-related variables such as job satisfaction (31.2%, Li, Stanek, et al., 2016). Moreover, our supplemental analyses using MIDUS Time 2 data indicate results largely replicate across time.
Importantly, our research also illuminates the biasing impact of genetic confounding and other dispositional factors on estimated effects of role demands on WFC. Our estimates controlling for genetic confounding help inform conclusions regarding situation and person influences on WFC. We observed strong phenotypic correlations between role demands and both directions of WFC. After accounting for personality traits, genetic confounds, family confounds, and other stable individual differences, the relationship between work demands and WIF decreased only slightly. This finding supports the dominant situational causal interpretation of the work demands–WIF relationship in the work–family literature, even in the face of concurrent dispositional aspects of WFC. However, after accounting for the same set of confounds, the relationship between family demands and FIW decreased substantially. This suggests genetic and dispositional confounds have considerably biased previous estimates of the effect of family demands on FIW.
The divergence in results between WIF and FIW is notable. WFC is typically conceptualized as a perceptual variable but is intended to represent some objective circumstance by which demands in one role (work/family) interfere with engagement in the other role (Grandey et al., 2005). Although our data indicate WIF alone is more heritable than is FIW, results also suggest the work demands–WIF relationship is more robust to confounding than is the family demands–FIW relationship. The genetic factors predisposing FIW essentially completely overlap with those predisposing perceiving family role demands (88%). In contrast, the genetic factors predisposing WIF share less overlap with those predisposing perceiving work role demands (35%). This may be because interdependency is greater in the family domain, rendering work demands easier to objectively identify as a source of conflict with the family than family demands as a source of conflict with work. This finding may also be due to differences in how individuals construe and make meaning of their work and family role identities (Ladge & Little, 2019). One’s identity as a family member may be more internalized and central to the self than one’s identity as a worker, and thus the relationship between family demands and FIW is more dispositional and genetically driven. Thus, particular care that takes into consideration dispositional confounding is needed when drawing conclusions about the situational effects of family demands on FIW.
Theoretical and Practical Implications
Our findings advance work–family theory and practice in meaningful ways. By showing that genetic traits influence WFC, we demonstrate the value of expanding work–family theory through behavioral genetics approaches. The demands associated with the work and family roles individuals occupy have been thought to serve as the primary drivers of WFC. Self-reported variables such as role demands are useful, and often necessary, for assessing situational influences on WFC. However, these relationships are also imprecise in that personality traits such as neuroticism and other dispositional factors may confound reports of both role demands and WFC. Our research moves beyond the observation that perceived role demands correlate with WFC and advances a better understanding of the theoretical and causal nature of the relationship.
The evidence for both phenotypic and genetic causal factors across both directions of WFC point to the need for multiply-determined, interactional models that can account for the totality of individual work–family experiences. Because individuals actively select, create, evoke, and interpret their own environments based on dispositional factors, including genetic predispositions (Harden & Koellinger, 2020; Li, Zhang, et al., 2016), future work–family research and practice would do well to consider both the situation and the person when developing theory and when designing research and interventions. This is especially important given work–family current theoretical perspectives are heavily reliant on resource theories that are inherently situational (see Allen et al., 2019 for a review). Moving forward, genetics methods, including both twin designs and molecular genetic methods such as polygenic scores, offer valuable tools to quantify and control for potential genetic predispositional effects to better estimate causal effects of situational factors (D. W. Belsky & Harden, 2019).
Regarding practice, our results suggest organizations may need to take different approaches to addressing the two directions of WFC. Work demands–WIF relationships remained strong after accounting for genetic and dispositional confounding. Accordingly, it may be beneficial for organizations to focus interventions on reducing employee work demands to mitigate WIF. Notably, many popular WFC interventions, such as flexible work schedules, stress management, mindfulness, and boundary management (e.g., Kiburz et al., 2017; Kossek & Lautsch, 2012; Tetrick & Winslow, 2015), do not focus on reducing demands, but rather on managing or coping with demands.
In contrast, family demands–FIW relationships were strongly reduced after accounting for genetic and dispositional confounding. These results suggests that while reducing family role demands remain important, alternative approaches involving psychological interventions, such as social support, mindfulness, and cognitive–behavioral counseling may be effective ways to help individuals adapt their responses to family demands (Hofmann et al., 2014; Hülsheger et al., 2013).
Limitations and Future Research
Our findings have limitations and represent a starting point for future research. Although we analyzed panel data to address time–invariant confounding, research is needed to examine if observed relationships change across time. Research suggests genetic influences on environmental measures increase with age as individuals expand their experiences and select into a variety of different environments (Haworth & Davis, 2014; Hopwood et al., 2011). Accordingly, ideal studies would be conducted while also capturing changes in work (e.g., promotion) and family status (e.g., new family member) associated with change in WFC and at appropriate intervals to capture such changes.6 Another limitation is that due to the cross-sectional and self-report design of the data used for the biometric variance component analyses, we cannot rule out that some of the leftover residual relationship between demands and WFC could be due to common perceptual factors. Moreover, while analysis of twin data is recognized as a tool for estimating causal effects in observational data (e.g., McGue et al., 2010), we emphasize our study helps move toward an understanding of the causal effect of role demands on WFC but it does not allow for definitive causal conclusions.
Our findings suggest several other potential avenues for future research. One topic is examination of other factors that can help explain the heritability of WFC, such as social support from family and from coworkers. Social support has been consistently associated with WFC (French et al., 2018; French & Shockley, 2020) and would typically be considered as an aspect of the environment and thus independent of the individual. However, social support has been found to be heritable (e.g., Kendler, 1997; Wang et al., 2017; but see Li, Zhang, et al., 2016, for an exception). This relationship may operate through personality, in that personality traits could elicit more (e.g., agreeableness) or less (e.g., aggressiveness) support from others. To further develop biologically-informed perspectives on WFC, greater incorporation of physiological data is also needed. WFC research has examined diurnal cortisol recovery and cardiovascular responses to episodes of WFC (e.g., Almeida et al., 2016; French & Allen, 2020; Shockley & Allen, 2013). However, we are not aware of research that examines physiological predictors of WFC. Another pathway by which genes may influence WFC is through hormones. In consideration of WFC as a decision-making process (Greenhaus & Powell, 2003; Poelmans, 2005; Powell & Greenhaus, 2006; Shockley & Allen, 2015), testosterone merits specific examination given it has a genetic component (Harris et al., 1998) and has been associated with decision-making (Nave et al., 2017). Identification of specific genetic markers that involve WFC is another possibility for future work (Arvey et al., 2016). Given the established relationship between WFC and neuroticism, one place to start may be to examine the specific genetic variants that have been associated with this trait (Hill et al., 2020). Finally, we suggest research that investigates other work–family constructs (e.g., work–family enrichment, work–family balance) is needed to fully understand the impact of genetics on the interrole interface.
Funding:
This research was supported by the National Institute of Occupational Safety and Health (NIOSH) under the Centers for Disease Control and Prevention (CDC), grant number T42OH008438.
Appendix A
We conducted a validation study to provide psychometric support for the work–family measures included in the MIDUS data set. Specifically, we conducted a construct validation study to examine (a) the correlations between the MIDUS 1 measures of WIF, FIW, work demands, and family demands in our focal study with other existing measures of each of these constructs, and (b) the convergent validity of the MIDUS scales with two common outcomes associated with WFC (job and life satisfaction).
We recruited 105 participants via Prolific and a Southeastern University’s research participant pool to respond to a web-based survey. To be included, participants had to meet the same criteria as they did to be included in our primary study sample. Specifically, participants had to work at least 20 hours per week for pay and live with a significant other and/or dependent child. Additionally, participants were required to pass two attention checks that were in the “Answer somewhat disagree to this question” format; 6 participants were removed who failed the attention checks, leaving a final sample of 99 participants. Demographically, within the final sample 51% identified as a man (47% as a woman, 3% another gender), 68% identified as white only (8% as Asian, 8% as Black, 8% as Hispanic, 7% mixed), and 55% held a Bachelor’s or Graduate degree. Additionally, the average participant was 32.08 years in age (SD = 9.21), worked 38.23 hours per week (SD = 8.41), and worked at their current organization for 58.80 months (SD = 52.67). All data from the validation study was analyzed in R.
Information on the measures used for the validation study is in Table A1. Table A2 shows all intercorrelations.
Table A1.
Validation Study Measure Information
| Construct | Citation | No. items | α | Example item |
|---|---|---|---|---|
| WIF | Netemeyer et al. (1996) | 5 | .91 | The demands of my work interfere with my home and family life. |
| FIW | Netemeyer et al. (1996) | 5 | .90 | The demands of my family or spouse/partner interfere with work-related activities. |
| Work demands | Spector and Jex (1998) | 5 | .86 | How often do you have to do more work than you can do well? |
| Family demands | Aryee et al. (1999); Biggs & Brough (2005) | 2 | .89 | How often do you feel that you have too much family-related work to do? |
| Job satisfaction | Cammann et al. (1979) | 3 | .86 | All in all, I am satisfied with my job. |
| Life satisfaction | Diener et al. (1985) | 5 | .86 | I am satisfied with my life. |
Table A2.
Validation Study Intercorrelations
| 1 | 2 | 3 | 4 | 5 | 6 | 8 | 9 | 10 | 11 | |
|---|---|---|---|---|---|---|---|---|---|---|
| 1. MIDUS: WIF | (0.81) | |||||||||
| 2. MIDUS: Work Demands | 0.53** | (0.74) | ||||||||
| 3. MIDUS: Family Demands | 0.43** | 0.59** | (0.69) | |||||||
| 4. Netemeyer: WIF | 0.70** | 0.51** | 0.39** | (0.91) | ||||||
| 5. Netemeyer: FIW | 0.39** | 0.24* | 0.39** | 0.48** | (0.90) | |||||
| 6. MIDUS: FIW | 0.61** | 0.34** | 0.49** | 0.59** | 0.70** | (0.80) | ||||
| 8. Job Satisfaction | −0.47** | −0.27** | −0.20* | −0.30** | −0.24* | −0.37** | (0.90) | |||
| 9. Life Satisfaction | −0.36** | −0.21* | −0.30** | −0.25* | −0.16 | −0.34** | 0.29** | (0.86) | ||
| 10. QWI | 0.45** | 0.78** | 0.48** | 0.37** | 0.07 | 0.19 | −0.22* | −0.17 | (0.86) | |
| 11. Aryee: Family Demands | 0.20 | 0.27** | 0.70** | 0.26** | 0.52** | 0.45** | −0.04 | −0.11 | 0.17 | (0.89) |
Notes: N = 99. QWI = Quantitative Workload Inventory.
p < .05. Values on diagonal are coefficient alpha reliability estimates.
Table A3 shows correlations between the MIDUS measures of WIF and FIW with the Netemeyer et al. measures of WIF and FIW and with other common measures associated with WFC. All relationships were in expected directions and magnitudes.
Table A3.
Correlations of MIDUS WFC Measures with Validation Measures
| MIDUS WIF | MIDUS FIW | |
|---|---|---|
| WIF | .70 | |
| FIW | .70 | |
| Work demands | .45 | .19 |
| Family demands | .20 | .45 |
| Job satisfaction | −.47 | −.37 |
| Life satisfaction | −.36 | −.34 |
Table A4 shows correlations between the MIDUS measures of work demands and family demands with common measures of work and family demands and with outcomes associated with demands. All relationships were in expected directions and magnitudes.
Table A4.
Correlations of MIDUS Role Demands Measures with Validation Measures
| MIDUS Work Demands | MIDUS Family Demands | |
|---|---|---|
| Work demands | .78 | |
| Family demands | .70 | |
| Job satisfaction | −.27 | −.20 |
| Life satisfaction | −.21 | −.30 |
Together, results of the validation study suggest the MIDUS work–family conflict and role demands measures are highly associated with other measures used to assess work-family conflict, work demands, and family demands and show expected relationships with other constructs.
Appendix B
ADCE Submodel Comparison
With only a single generation of MZ and DZ twins reared together, the full ADCE model is not identified, so, following common practice in behavioral genetic analyses (Neale & Cardon, 1992), we compared the fits of several candidate submodels that can be identified: ACE (dropping the non-additive genetic component [D]), ADE (dropping the shared environment component [C]), and AE (dropping both the non-additive genetic [D] and shared environment [C] components).
Model Specification
In all models, we fixed the additive genetic [A] correlation between twins to 1.0 for MZ twins and .50 for DZ twins to reflect the degree of shared genetic makeup. These values assume no assortative mating of parents on the model phenotype. For the variables in this study, this is likely a reasonable assumption (e.g., spouse correlations on work–family conflict and personality traits tend to be negligible to small; Hammer et al., 2005; McCrae et al., 2008). The expected effect of assortative mating on ACE model results is to overestimate the size of the C variance component (Neale & Cardon, 1992). In all ACE models, the C variance components were all estimated to be negligible or negative, so there appeared to be little to no assortative mating on these variables.
We fixed the shared environmental [C] correlation between twins to 1.0 for all twins. We fixed the non-additive genetic [D] correlation between twins to 1.0 for MZ twins and .25 for DZ twins (Neale & Cardon, 1992) .
Model Comparison
To determine which variance components to retain for each construct, we first fit univariate ACE, ADE, and AE models to each construct in our study (WIF, FIW, role demands, personality traits). For each construct, we compared these alternative models using the Akaike information criterion (AIC; Burnham & Anderson, 2002), as well as by examining variance component parameter estimates—models with all-positive variance estimates with lower AIC values were preferred. An AIC difference of ∆AIC > 6 is generally considered to reflect significantly better model fit (Burnham & Anderson, 2002); smaller ∆AIC values indicate similar performance. In these cases, the more parsimonious model is typically preferred.
Model comparison statistics are shown in Table C1. Across all variables, ∆AIC values were small (max ∆AIC = 1.97). The AE model showed the lowest AIC for both WIF (∆AIC AE vs. ACE/ADE = 1.97) and FIW (∆AIC AE vs. ACE/ADE = 1.57), as well as both family and work demands and extraversion, neuroticism, and openness. AIC slightly favored the ACE or ADE model for agreeableness, but the solutions for these models included negative variance components and were inadmissible.
Table B1.
ADCE Submodel Comparison for Study Constructs – Time 1
| Construct | Model comparison AIC |
||
|---|---|---|---|
| AE | ADE | ACE | |
| Family demands | 1790 | 1791 | 1791 |
| Work demands | 1754 | 1756 | 1756 |
| Agreeablenessa | 1753 | 1752 | 1752 |
| Extraversion | 1817 | 1819 | 1819 |
| Neuroticism | 1831 | 1833 | 1833 |
| Openness | 1764 | 1765 | 1765 |
| Work interference with family (WIF) | 1733 | 1735 | 1735 |
| Family interference with work (FIW) | 1785 | 1787 | 1787 |
Note. AIC = Akaike information criterion values based on univariate biometric variance component models.
Although AIC slightly favored the ACE or ADE model for Agreeableness, the solutions included negative variance components and were inadmissible.
Appendix C
Genetic Causal Model Specifications
We controlled for genetic confounding using three alternative model specifications. These models each make somewhat different assumptions, so they can be regarded as complementary estimators to examine robustness.
AE Model: E Regression
The ACE model (and similar models, such as ADE or AE) estimates the unique environmental relationship between two constructs by specifying a correlation between their latent unique environment (‘E’) factors. These correlations among E components can be used as inputs to a regression model to estimate bivariate or partial regression coefficients of one variable (e.g., role demands) as a predictor of another (e.g., role conflict). In this specification, environmental correlations could reflect a causal effect of one variable on the other, or they could reflect the shared influence of common environmental shocks. Causal interpretation of the E-component regression coefficients depends on justifying that critical confounding variables have been controlled for, as is the case for phenotypic regression (Rohrer, 2018; Rohrer et al., 2021). As with each of the specifications considered, the advantage of E-component regression over phenotypic regression is its ability to control for unmeasured genetic and common environmental confounding.
AE–β Model
Notably, the traditionally specified ADCE model does not permit the genetic component of a predictor to affect environmental components of an outcome (e.g., constructs may share genetic etiologies, but genetic predispositions for a personality trait are not related to the environment that produces role conflict). The ADCE–β model (or submodels such as AE–β; Kohler et al., 2011), by contrast, specifies a direct phenotypic causal effect of one phenotype (e.g., role demands) on another (e.g., role conflict). For example, in an AE–β model, a person’s realized experience of role demands (including both environmental and genetic antecedents) directly causes them to have more WFC. For identification, the AE–β model requires the assumption that the E components between predictor and outcome constructs do not correlate. That is, the AE–β model assumes no residual confounding of environmental antecedents. In the AE–β model, E components cannot reflect shared environmental antecedents across predictors and outcomes and instead reflect unique environmental shocks that only directly affect variables on one side of the regression equation. An ADCE–β is appropriate when this assumption of no residual confounding is met. For example, Kohler et al. used an ACE–β model to estimate the causal effect of early fertility on the number of years of schooling a woman completed. For these variables, the assumption that the unique environmental effects that impact fertility only affect years of schooling because of their impact on the fertility phenotype is reasonable. In other cases, such as when both the predictor and outcome variables are attitudinal, some residual confounding might be expected.
Co-Twin Control Models
An alternative approach to accounting for genetic confounding than biometric variance component modeling is the co-twin control model (CTC; Fatimah et al., 2020). The fixed effects or random effects co-twin control model is popular in genetic modeling in economics (Kohler et al., 2011; see McNeish & Kelley, 2019, for a discussion of fixed- versus random-effects models). In a CTC model, a multilevel model is fit, with twins nested within families. The family-level effect (the family random intercept or fixed-effect control factor) absorbs both genetic [A/D] and common environmental [C] variance, allowing the regression coefficient for predictor to estimate the causal effect of the predictor on the outcome free from these confounds. For example, the model for FIW was specified as:
where FIWij is the FIW score for person i in family j. The first term, , is the within-family deviation of each twin’s home demands from their family mean home demands. The second term, , are the within-family deviations for the 5 control variables (work demands, neuroticism, extraversion, agreeableness, and openness). The third term, , is the family mean home demands. The fourth term, , are the family mean scores for the 5 control variables. The final term, uj, is a random intercept for each family. The focal parameter of interest is β1, the within-family effect of home demands, controlling for work demands, personality traits, and family factors.
A CTC model fit to a sample of MZ twins fully controls for A, D, and C. A CTC fit to a sample of DZ twins or siblings fully controls for C, but only partially controls for A and D (because these siblings do not share all of their genetic material). The co-twin control model makes the same assumptions about residual environmental confounding as the ACE–β model.
In many cases, all 3 alternative models lead to similar conclusions (but see Kohler et al., 2011, for a counterexample). In this paper, we present all 3 models for comparison. We find that the 3 models yield broadly similar results.
Co-Twin Control Models with Panel Data and Person First-Difference Fixed-Effects
To combine controls for genetic and common environmental confounding with controls for stable person-specific confounding factors (e.g., unmeasured dispositional characteristics), we expanded the CTC model to include all three waves of the MIDUS data. We included the same family-level effects to control for genetic and common environmental confounding as the cross-sectional CTC model above. To account for stable person-specific factors, we used the first difference estimator—for each variable, we subtracted a person’s lagged value at time t – 1from their value at t to obtain their change in values between time points, ∆xt (Wooldridge, 2002). For example, the model for FIW was specified as:
This model is essentially the same as the cross-sectional CTC model above. The only difference is that the data used are the first-differenced variables computed as the change in each person’s score from the previous time point, rather than the raw score at the time point.
Additional R Packages Used
In addition to the primary software used for model fitting cited in the main manuscript, we also used the packages: psychmeta (Dahlke & Wiernik, 2019, 2017/2021), psych (Revelle, 2021), effectsize (Ben-Shachar et al., 2020), bbmle (Bolker & R Development Core Team, 2020)¸ parameters (Lüdecke et al., 2020; Lüdecke, Makowski, et al., 2021) for formatting and supplementary analyses; tidyverse (Wickham et al., 2019), readxl (Wickham & Bryan, 2019), and here (Müller, 2020) for data management; and ggplot2 (Wickham, 2016), see (Lüdecke, Patil, et al., 2021), ggdist (Kay, 2021), ggtext (Wilke, 2020), distributional (O’Hara-Wild & Hayes, 2021), and colorspace (Zeileis et al., 2020) for visualization.
Appendix D
Given the data used to test Hypotheses 1–4 was from 1995–1996, we conducted additional analyses to help determine if the findings replicate with more recent MIDUS data. With regard to sample size, at Time 2 there were 113 total dyads (226 total people, 51 MZ dyads, 62 DZ dyads). Because the Time 3 sample dwindled to 19 total dyads (38 total people, 14 MZ, 5 DZ), we did not conduct biometric analyses with the Time 3 data.
First, we examined the means for WFC at each timepoint. Means are shown in Table D1.
Table D1.
Work-family conflict means across Time 1, Time 2, Time 3
| Time 1 | Time 2 | Time 3 | |
|---|---|---|---|
| WIF | 2.64 | 2.55 | 2.41 |
| FIW | 2.10 | 2.04 | 2.06 |
As this data show, means were generally stable across the 20-year study period, particularly from Time 1 to Time 2. Smaller means at Time 3 would be expected as WFC tends to decrease as individuals enter later stages of the life course (Allen & Finkelstein, 2014). The average age of participants at Time 1 in this study was 42.53. We also calculated correlations across the three waves of data. For WIF the stability coefficients were .41 (Time 1 – Time 2), .40 (Time 2 – Time 3), and .25 (Time 1 – Time 3). For FIW the stability coefficients were .49 (Time 1 – Time 2), .51 (Time 2 – Time 3), and .41 (Time 1 – Time 3). Given the 20-year time span from Time 1 to Time 3, these data suggest considerable stability in WFC across time. In comparison, data on job satisfaction across three time points spanning a total of 10 years has shown across time correlations that range from .17 to .31 (Li, Stanek, et al., 2016).
We next investigated the ICCs for MZ and DZ twins at Time 2. We found consistent results to Time 1 when analyzing the Time 2 data. Specifically, WFC was more highly correlated between MZ versus DZ twins for both WIF (ICCMZ = .23, ICCDZ = .01, diff = .22 [95% CI −.15, .57]) and FIW (ICCMZ = .46, ICCDZ = .15, diff = .31 [95% CI −.03, .62]). Additionally, the confidence intervals across the two time periods overlapped. This suggests that the findings were stable across the 10-year period.
Variance Component Estimates – Time 2
Next, we computed the variance component estimates for each variable at Time 2. Results are shown in Table D2. Time 1 estimates are shown in Table 2 of the manuscript. Based on overlapping confidence intervals, these data indicate that the biometric variance components for both directions of work-family conflict do not significantly differ across time.
Table D2.
Biometric Variance Components for Study Constructs – Time 2
| Construct | Additive genetic [A] |
Unique environment [E] |
||||
|---|---|---|---|---|---|---|
| Var. comp. | 95% conf. int. | Var. comp. | 95% conf. int. | |||
| Family demands | 0.38 | 0.21 | 0.56 | 0.62 | 0.44 | 0.79 |
| Work demands | −0.04 | −0.31 | 0.23 | 1.04 | .0.77 | 1.31 |
| Agreeableness | 0.36 | .0.19 | 0.53 | 0.64 | 0.47 | 0.81 |
| Extraversion | 0.37 | 0.19 | 0.55 | 0.63 | 0.45 | 0.81 |
| Neuroticism | 0.26 | 0.10 | 0.43 | 0.74 | 0.57 | 0.90 |
| Openness | 0.35 | 0.19 | 0.51 | 0.65 | 0.49 | 0.81 |
| WIF | 0.01 | −0.26 | 0.27 | 0.99 | 0.73 | 1.26 |
| FIW | 0.25 | −0.02 | 0.51 | 0.75 | 0.49 | 1.02 |
Note. Var. comp. = variance components estimated from the final multivariate AE model including all eight constructs. Confidence intervals are 95% profile likelihood confidence intervals. Results controlling for gender, age, and age-squared. Data are from MIDUS Time 2.
Model Comparison – Time 2
Next, we estimated the relative effects of genetic and environmental factors using ADCE models using the same process as done for Time 1 (Appendix B), but with the Time 2 data. Results are shown in Table D3. Similar to the Time 1 analyses, the Time 2 data indicate that the AE models provided the best fit to the data. More specifically, at Time 2, across all variables ∆AIC values were small (max ∆AIC ≈ 1.82). The AE model showed the lowest AIC for both WIF (∆AIC AE vs.ACE/ADE = .96) and FIW (∆AIC AE vs. ACE/ADE = 1.35), as well as both family and work demands, extraversion, and openness. AIC slightly favored the ACE or ADE model for agreeableness and neuroticism, but the solutions for these models included negative variance components and were inadmissible.
Table D3.
ADCE Submodel Comparison for Study Constructs – Time 2
| Construct | Model comparison AIC |
||
|---|---|---|---|
| AE | ADE | ACE | |
| Family demands | 1256 | 1256 | 1255 |
| Work demands | 1115 | 1115 | 1115 |
| Agreeableness | 1320 | 1320 | 1318 |
| Extraversion | 1286 | 1286 | 1286 |
| Neuroticism | 1258 | 1258 | 1256 |
| Openness | 1305 | 1305 | 1303 |
| Work interference with family (WIF) | 1127 | 1127 | 1126 |
| Family interference with work (FIW) | 1088 | 1088 | 1089 |
Note. AIC = Akaike information criterion values based on univariate biometric variance component models.
Summary
In summary, results suggest that the findings observed at Time 1 are consistent and replicate at Time 2.
Footnotes
Horwitz et al. (2008) used the label negative work-to-family spillover while we use the label work-family conflict based on the same set of items. Historically, these terms have been used interchangeably to reflect interrole conflict as conceptualized by Greenhaus and Beutell (1985). As the work-family literature has evolved, spillover is now more commonly used to represent a relationship between a variable in one role (work/family) and a second variable in another role (family/work) while work-family conflict is used in reference to a single interdependent construct such as that which is included in the MIDUS dataset.
Horwitz et al. (2008) reported the MZ correlation between neuroticism and WIF (negative work-to-family spillover) as .20 and the DZ correlation as .09 using a cross-twin, cross-trait methodology. Using this methodology, the scores of Twin 1 on a given trait are correlated with the scores of Twin 2 on another trait, but this approach ignores that the Twin 1, Twin 2 designations are arbitrary and that results can vary based on whether, for example, Twin 1’s score of conscientiousness is correlated with Twin 2’s score of extraversion, or vice versa. We opt to instead use a cross-twin intraclass correlation. This approach respects the exchangeability of the two twins in the analysis, does not depend on arbitrary label assignment, and uses both scores from both twins (Griffin & Gonzalez, 1995), improving estimates of the ‘cross’ twin and ‘cross’ trait correlations. Based on this approach, we estimated these relationships to be .19 and .07, respectively, finding similar support that relationships were stronger among MZ than DZ twins. We note how our sample’s calculated correlations compare with those of Horwitz et al., with Horwitz values in brackets. Specifically, the MZ correlation between neuroticism and FIW was 0.10 [0.22] and the DZ correlation was 0.08 [0.12]. The MZ correlation between extraversion and WIF was −0.20 [−0.19] and the DZ correlation was 0.02 [0.00]. The MZ correlation between extraversion and FIW was −0.15 [−0.19] and the DZ correlation was −0.03 [−0.14].
Our study used different work and family inclusion criteria from that of Horwitz et al. (2008). Notably, our criteria are more consistent with inclusion criteria typically used for work-family research. On the work side, to be included in our study, participants were required to work 20 or more hours a week for pay. The Horwitz et al. criteria were more lenient. Their criteria included full/part-time work, volunteer-time (15+ hours-a-week), and full/part-time students. On the family side, our participants had to be married/partnered and/or have a child under 18 in the household. Horwitz et al. did not have inclusion criteria associated with the family/nonwork role. Thus, our findings associated with the Time 1 data that concern additive genetic components of WIF and FIW can be considered a robustness check to that of Horwitz. Horwitz reported 26% for WIF (negative work-to-family spillover) and 18% for FIW (negative family-to-work spillover).
Twin pairs can be categorized as monozygotic (MZ, twins share nearly 100% of their genes) or dizygotic (DZ, twins share about 50% of their genes). This difference tends to make MZ twins more alike than DZ twins. By comparing twin pair similarity, researchers can estimate the relative magnitude of genetic versus environmental contributions to variance and, more importantly, covariance among psychological constructs (Arvey et al., 2016; Kohler et al., 2011). Because MZ twins share both their full complement of genes and their family-level developmental environment (e.g., attending the same schools), differences between MZ twins are generally thought to reflect their unique environment (e.g., differences in work history and experiences).
Heritability refers to the proportion of the variance (i.e., differences across people) in a measured characteristic that is estimated to be associated with or attributable to differences in genes across people.
The MIDUS data does not include changes in employment across each wave.
References
- Akingbuwa WA, Hammerschlag AR, Jami ES, Allegrini AG, Karhunen V, Sallis H, Ask H, Askeland RB, Baselmans B, Diemer E, Hagenbeek FA, Havdahl A, Hottenga J-J, Mbarek H, Rivadeneira F, Tesli M, van Beijsterveldt C, Breen G, Lewis CM, … and the Bipolar Disorder and Major Depressive Disorder Working Groups of the Psychiatric Genomics Consortium. (2020). Genetic associations between childhood psychopathology and adult depression and associated traits in 42 998 individuals: A meta-analysis. JAMA Psychiatry, 77(7), 715–728. 10.1001/jamapsychiatry.2020.0527 [DOI] [PMC free article] [PubMed] [Google Scholar]
- Allen TD, & Finkelstein LM (2014). Work-family conflict among members of full-time dual-earner couples: An examination of family life stage, gender, and age. Journal of Occupational Health Psychology, 19(3), 376–384. 10.1037/a0036941 [DOI] [PubMed] [Google Scholar]
- Allen TD, French KA, Braun MT, & Fletcher K (2019). The passage of time in work-family research: Toward a more dynamic perspective. Journal of Vocational Behavior, 110, Part B, 245–257. 10.1016/j.jvb.2018.11.013 [DOI] [Google Scholar]
- Allen TD, French KA, Dumani S, & Shockley KM (2020). A cross-national meta-analytic examination of predictors and outcomes associated with work–family conflict. Journal of Applied Psychology, 105(6), 539–576. 10.1037/apl0000442 [DOI] [PubMed] [Google Scholar]
- Allen TD, Henderson T, Mancini V, & French KA (2017). Mindfulness and meditation practice as moderators of the relationship between age and subjective wellbeing among working adults. Mindfulness, 8, 1055–1063. [Google Scholar]
- Allen TD, Johnson RC, Kiburz KM, & Shockley KM (2013). Work–family conflict and flexible work arrangements: Deconstructing flexibility. Personnel Psychology, 66(2), 345–376. 10.1111/peps.12012 [DOI] [Google Scholar]
- Allen TD, Johnson RC, Saboe KN, Cho E, Dumani S, & Evans S (2012). Dispositional variables and work–family conflict: A meta-analysis. Journal of Vocational Behavior, 80(1), 17–26. 10.1016/j.jvb.2011.04.004 [DOI] [Google Scholar]
- Almeida DM, Davis KD, Lee S, Lawson KM, Walter K, & Moen P (2016). Supervisor support buffers daily psychological and physiological reactivity to work-to-family conflict. Journal of Marriage and the Family, 78(1), 165–179. 10.1111/jomf.12252 [DOI] [PMC free article] [PubMed] [Google Scholar]
- Amin N, Hottenga J-J, Hansell NK, Janssens ACJ, de Moor MH, Madden PA, Zorkoltseva IV, Penninx BW, Terracciano A, Uda M, Tanaka T, Esko T, Realo A, Ferrucci L, Luciano M, Davies G, Metspalu A, Abecasis GR, Deary IJ, … van Duijn CM (2013). Refining genome-wide linkage intervals using a meta-analysis of genome-wide association studies identifies loci influencing personality dimensions. European Journal of Human Genetics, 21(8), 876–882. 10.1038/ejhg.2012.263 [DOI] [PMC free article] [PubMed] [Google Scholar]
- Amrhein V, Greenland S, & McShane B (2019). Scientists rise up against statistical significance. Nature, 567(7748), 305–307. 10.1038/d41586-019-00857-9 [DOI] [PubMed] [Google Scholar]
- Amstad FT, Meier LL, Fasel U, Elfering A, & Semmer NK (2011). A meta-analysis of work–family conflict and various outcomes with a special emphasis on cross-domain versus matching-domain relations. Journal of Occupational Health Psychology, 16(2), 151–169. 10.1037/a0022170 [DOI] [PubMed] [Google Scholar]
- Archontaki D, Lewis GJ, & Bates TC (2013). Genetic influences on psychological well-being: A nationally representative twin study. Journal of Personality, 81(2), 221–230. 10.1111/j.1467-6494.2012.00787.x [DOI] [PubMed] [Google Scholar]
- Arvey RD, Li W-D, & Wang N (2016). Genetics and organizational behavior. Annual Review of Organizational Psychology and Organizational Behavior, 3(1), 167–190. 10.1146/annurev-orgpsych-032414-111251 [DOI] [Google Scholar]
- Arvey RD, Rotundo M, Johnson W, Zhang Z, & McGue M (2006). The determinants of leadership role occupancy: Genetic and personality factors. The Leadership Quarterly, 17(1), 1–20. 10.1016/j.leaqua.2005.10.009 [DOI] [Google Scholar]
- Arvey RD, Zhang Z, Avolio BJ, & Krueger RF (2007). Developmental and genetic determinants of leadership role occupancy among women. Journal of Applied Psychology, 92(3), 693–706. 10.1037/0021-9010.92.3.693 [DOI] [PubMed] [Google Scholar]
- Barban N, Jansen R, de Vlaming R, Vaez A, Mandemakers JJ, Tropf FC, Shen X, Wilson JF, Chasman DI, Nolte IM, Tragante V, van der Laan SW, Perry JRB, Kong A, Ahluwalia TS, Albrecht E, Yerges-Armstrong L, Atzmon G, Auro K, … Mills MC (2016). Genome-wide analysis identifies 12 loci influencing human reproductive behavior. Nature Genetics, 48(12), 1462–1472. 10.1038/ng.3698 [DOI] [PMC free article] [PubMed] [Google Scholar]
- Bates TC, Maes H, & Neale MC (2019). umx: Twin and path-based structural equation modeling in R. Twin Research and Human Genetics, 22(1), 27–41. 10.1017/thg.2019.2 [DOI] [PubMed] [Google Scholar]
- Belsky DW, & Harden KP (2019). Phenotypic annotation: Using polygenic scores to translate discoveries from genome-wide association studies from the top down. Current Directions in Psychological Science, 28(1), 82–90. 10.1177/0963721418807729 [DOI] [PMC free article] [PubMed] [Google Scholar]
- Belsky J, & Pluess M (2009). Beyond diathesis stress: Differential susceptibility to environmental influences. Psychological Bulletin, 135(6), 885–908. 10.1037/a0017376 [DOI] [PubMed] [Google Scholar]
- Ben-Shachar M, Lüdecke D, & Makowski D (2020). effectsize: Estimation of effect size indices and standardized parameters. Journal of Open Source Software, 5(56), 2815. 10.21105/joss.02815 [DOI] [Google Scholar]
- Bolker B & R Development Core Team. (2020). bbmle: Tools for general maximum likelihood estimation (1.0.23.1) [R package] https://CRAN.R-project.org/package=bbmle
- Brim OG, Ryff CD, & Kessler RC (2004). The MIDUS national survey: An overview. In How Healthy Are We? A National Study of Wellbeing at Midlife (pp. 1–36). The University of Chicago Press. 10.7208/9780226074764 [DOI] [Google Scholar]
- Bruck CS, & Allen TD (2003). The relationship between big five personality traits, negative affectivity, type A behavior, and work–family conflict. Journal of Vocational Behavior, 63(3), 457–472. 10.1016/S0001-8791(02)00040-4 [DOI] [Google Scholar]
- Burnham KP, & Anderson DR (2002). Model selection and multimodel inference: A practical information-theoretic approach (2nd ed.). Springer-Verlag. 10.1007/b97636 [DOI] [Google Scholar]
- Butts MM, Casper WJ, & Yang TS (2013). How important are work-family support policies? A meta-analytic investigation of their effects on employee outcomes. The Journal of Applied Psychology, 98(1), 1–25. 10.1037/a0030389 [DOI] [PubMed] [Google Scholar]
- Cammann C, Fichman M, Jenkins D, & Klesh J (1979). Michigan organizational assessment questionnaire [Unpublished manuscript]. University of Michigan. 10.1037/t01581-000 [DOI] [Google Scholar]
- Cho E, Tay L, Allen TD, & Stark S (2013). Identification of a dispositional tendency to experience work–family spillover. Journal of Vocational Behavior, 82(3), 188–198. 10.1016/j.jvb.2013.01.006 [DOI] [Google Scholar]
- Cohen P, Cohen J, Aiken LS, & West SG (1999). The Problem of Units and the Circumstance for POMP. Multivariate Behavioral Research, 34(3), 315–346. 10.1207/S15327906MBR3403_2 [DOI] [Google Scholar]
- Connelly BS, Ones DS, & Hülsheger UR (2018). Personality in industrial, work and organizational psychology: Theory, measurement and application. In Ones DS, Anderson N, Viswesvaran C, & Sinangil HK (Eds.), The SAGE handbook of industrial, work and organizational psychology (2nd ed., Vol. 1, pp. 320–365). Sage. 10.4135/9781473914940.n13 [DOI] [Google Scholar]
- Cumming G (2014). The new statistics: Why and how. Psychological Science, 25(1), 7–29. 10.1177/0956797613504966 [DOI] [PubMed] [Google Scholar]
- Dahlke JA, & Wiernik BM (2019). psychmeta: An R package for psychometric meta-analysis. Applied Psychological Measurement, 43(5), 415–416. 10.1177/0146621618795933 [DOI] [PMC free article] [PubMed] [Google Scholar]
- Dahlke JA, & Wiernik BM (2021). psychmeta: Psychometric meta-analysis toolkit (2.6.0.9000) [R package] https://github.com/psychmeta/psychmeta (Original work published 2017) [DOI] [PMC free article] [PubMed] [Google Scholar]
- de las Fuentes L, Sung YJ, Noordam R, Winkler T, Feitosa MF, Schwander K, Bentley AR, Brown MR, Guo X, Manning A, Chasman DI, Aschard H, Bartz TM, Bielak LF, Campbell A, Cheng C-Y, Dorajoo R, Hartwig FP, Horimoto ARVR, … Fornage M (2020). Gene-educational attainment interactions in a multi-ancestry genome-wide meta-analysis identify novel blood pressure loci. Molecular Psychiatry, 26(6), 2111–2125. 10.1038/s41380-020-0719-3 [DOI] [PMC free article] [PubMed] [Google Scholar]
- Demerouti E, Nachreiner F, & Schaufeli W (2001). The job demands–resources model of burnout. The Journal of Applied Psychology, 86, 499–512. 10.1037/0021-9010.86.3.499 [DOI] [PubMed] [Google Scholar]
- DeYoung CG (2015). Cybernetic big five theory. Journal of Research in Personality, 56, 33–58. 10.1016/j.jrp.2014.07.004 [DOI] [Google Scholar]
- Diener E, Emmons RA, Larsen RJ, & Griffin S (1985). The satisfaction with life scale. Journal of Personality Assessment, 49(1), 71–75. 10.1207/s15327752jpa4901_13 [DOI] [PubMed] [Google Scholar]
- Edwards JR, & Rothbard NP (1999). Work and family stress and well-being: An examination of person-environment fit in the work and family domains. Organizational Behavior and Human Decision Processes, 77(2), 85–129. 10.1006/obhd.1998.2813 [DOI] [PubMed] [Google Scholar]
- Edwards JR, & Rothbard NP (2000). Mechanisms linking work and family: Clarifying the relationship between work and family constructs. The Academy of Management Review, 25(1), 178–199. 10.2307/259269 [DOI] [Google Scholar]
- Ellis L, & Bonin SL (2003). Genetics and occupation-related preferences. Evidence from adoptive and non-adoptive families. Personality and Individual Differences, 35(4), 929–937. 10.1016/S0191-8869(02)00309-4 [DOI] [Google Scholar]
- Fatimah H, Wiernik BM, Gorey C, McGue M, Iacono WG, & Bornovalova MA (2020). Familial factors and the risk of borderline personality pathology: Genetic and environmental transmission. Psychological Medicine, 50(8), 1327–1337. 10.1017/S0033291719001260 [DOI] [PubMed] [Google Scholar]
- Felson J (2014). What can we learn from twin studies? A comprehensive evaluation of the equal environments assumption. Social Science Research, 43, 184–199. 10.1016/j.ssresearch.2013.10.004 [DOI] [PubMed] [Google Scholar]
- Ford MT, Heinen BA, & Langkamer KL (2007). Work and family satisfaction and conflict: A meta-analysis of cross-domain relations. The Journal of Applied Psychology, 92(1), 57–80. 10.1037/0021-9010.92.1.57 [DOI] [PubMed] [Google Scholar]
- French KA, & Allen TD (2020). Episodic work-family conflict and strain: A dynamic perspective. Journal of Applied Psychology, 105(8), 863–888. 10.1037/apl0000470 [DOI] [PubMed] [Google Scholar]
- French KA, Allen TD, & Henderson T (2019). Challenge and hindrance stressors in relation to sleep. Social Science & Medicine, 222, 145–153. [DOI] [PubMed] [Google Scholar]
- French KA, Allen TD, & Henderson T (2019). Challenge and hindrance stressors and metabolic risk factors. Journal of Occupational Health Psychology, 24, 307–321. [DOI] [PubMed] [Google Scholar]
- French KA, Dumani S, Allen TD, & Shockley KM (2018). A meta-analysis of work–family conflict and social support. Psychological Bulletin, 144(3), 284–314. 10.1037/bul0000120 [DOI] [PMC free article] [PubMed] [Google Scholar]
- French KA, & Shockley KM (2020). Formal and informal supports for managing work and family. Current Directions in Psychological Science, 29(2), 207–216. 10.1177/0963721420906218 [DOI] [Google Scholar]
- Frone MR, Russell M, & Cooper ML (1992). Antecedents and outcomes of work-family conflict: Testing a model of the work-family interface. Journal of Applied Psychology, 77(1), 65–78. 10.1037/0021-9010.77.1.65 [DOI] [PubMed] [Google Scholar]
- Goode WJ (1960). A theory of role strain. American Sociological Review, 25(4), 483–496. JSTOR. 10.2307/2092933 [DOI] [Google Scholar]
- Grandey A, Cordeiro B, & Crouter A (2005). A longitudinal and multi-source test of the work-family conflict and job satisfaction relationship. Journal of Occupational and Organizational Psychology, 78(3), 305–323. 10.1348/096317905X26769 [DOI] [Google Scholar]
- Greenhaus JH, & Beutell NJ (1985). Sources of conflict between work and family roles. The Academy of Management Review, 10(1), 76–88. 10.2307/258214 [DOI] [Google Scholar]
- Greenhaus JH, & Powell GN (2003). When work and family collide: Deciding between competing role demands. Organizational Behavior and Human Decision Processes, 90(2), 291–303. 10.1016/S0749-5978(02)00519-8 [DOI] [Google Scholar]
- Greenhaus JH, & Powell GN (2016). Making work and family work: From hard choices to smart choices Routledge. 10.4324/9781315780511 [DOI] [Google Scholar]
- Griffin D, & Gonzalez R (1995). Correlational analysis of dyad-level data in the exchangeable case. Psychological Bulletin, 118(3), 430–439. 10.1037/0033-2909.118.3.430 [DOI] [Google Scholar]
- Hammer LB, Cullen JC, Neal MB, Sinclair RR, & Shafiro MV (2005). The longitudinal effects of work-family conflict and positive spillover on depressive symptoms among dual-earner couples. Journal of Occupational Health Psychology, 10(2), 138–154. 10.1037/1076-8998.10.2.138 [DOI] [PubMed] [Google Scholar]
- Hammer LB, Kossek E. e., Anger W. k., Bodner T, & Zimmerman K. l. (2011). Clarifying work-family intervention processes: The roles of work-family conflict and family-supportive supervisor behaviors. Journal of Applied Psychology, 96(1), 134. 10.1037/a0020927 [DOI] [PMC free article] [PubMed] [Google Scholar]
- Harden KP, & Koellinger PD (2020). Using genetics for social science. Nature Human Behaviour, 4(6), 567–576. 10.1038/s41562-020-0862-5 [DOI] [PMC free article] [PubMed] [Google Scholar]
- Harris JA, Vernon PA, & Boomsma DI (1998). The heritability of testosterone: A study of Dutch adolescent twins and their parents. Behavior Genetics, 28(3), 165–171. 10.1023/A:1021466929053 [DOI] [PubMed] [Google Scholar]
- Haworth CMA, & Davis OSP (2014). From observational to dynamic genetics. Frontiers in Genetics, 5(6), 1–7. 10.3389/fgene.2014.00006 [DOI] [PMC free article] [PubMed] [Google Scholar]
- Hecht TD, & McCarthy JM (2010). Coping with employee, family, and student roles: Evidence of dispositional conflict and facilitation tendencies. Journal of Applied Psychology, 95(4), 631–647. 10.1037/a0019065 [DOI] [PubMed] [Google Scholar]
- Hill WD, Weiss A, Liewald DC, Davies G, Porteous DJ, Hayward C, McIntosh AM, Gale CR, & Deary IJ (2020). Genetic contributions to two special factors of neuroticism are associated with affluence, higher intelligence, better health, and longer life. Molecular Psychiatry, 25(11), 3034–3052. 10.1038/s41380-019-0387-3 [DOI] [PMC free article] [PubMed] [Google Scholar]
- Hofmann SG, Wu JQ, & Boettcher H (2014). Effect of cognitive-behavioral therapy for anxiety disorders on quality of life: A meta-analysis. Journal of Consulting and Clinical Psychology, 82(3), 375–391. 10.1037/a0035491 [DOI] [PMC free article] [PubMed] [Google Scholar]
- Hopwood CJ, Donnellan MB, Blonigen DM, Krueger RF, McGue M, Iacono WG, & Burt SA (2011). Genetic and environmental influences on personality trait stability and growth during the transition to adulthood: A three-wave longitudinal study. Journal of Personality and Social Psychology, 100(3), 545–556. 10.1037/a0022409 [DOI] [PMC free article] [PubMed] [Google Scholar]
- Horwitz BN, Luong G, & Charles ST (2008). Neuroticism and extraversion share genetic and environmental effects with negative and positive mood spillover in a nationally representative sample. Personality and Individual Differences, 45(7), 636–642. 10.1016/j.paid.2008.07.003 [DOI] [PMC free article] [PubMed] [Google Scholar]
- Hülsheger UR, Alberts HJEM, Feinholdt A, & Lang JWB (2013). Benefits of mindfulness at work: The role of mindfulness in emotion regulation, emotional exhaustion, and job satisfaction. Journal of Applied Psychology, 98(2), 310–325. 10.1037/a0031313 [DOI] [PubMed] [Google Scholar]
- Ilies R, & Judge TA (2003). On the heritability of job satisfaction: The mediating role of personality. Journal of Applied Psychology, 88(4), 750–759. 10.1037/0021-9010.88.4.750 [DOI] [PubMed] [Google Scholar]
- Judge TA, Ilies R, & Zhang Z (2012). Genetic influences on core self-evaluations, job satisfaction, and work stress: A behavioral genetics mediated model. Organizational Behavior and Human Decision Processes, 117(1), 208–220. 10.1016/j.obhdp.2011.08.005 [DOI] [Google Scholar]
- Kay M (2021). ggdist: Visualizations of distributions and uncertainty (2.4.1) [R package] 10.5281/zenodo.3879620 [DOI] [PubMed] [Google Scholar]
- Kendler KS (1997). Social support: A genetic-epidemiologic analysis. The American Journal of Psychiatry, 154(10), 1398–1404. 10.1176/ajp.154.10.1398 [DOI] [PubMed] [Google Scholar]
- Kendler KS, & Baker JH (2007). Genetic influences on measures of the environment: A systematic review. Psychological Medicine, 37(5), 615–626. 10.1017/S0033291706009524 [DOI] [PubMed] [Google Scholar]
- Kiburz KM, Allen TD, & French KA (2017). Work–family conflict and mindfulness: Investigating the effectiveness of a brief training intervention. Journal of Organizational Behavior, 38(7), 1016–1037. 10.1002/job.2181 [DOI] [Google Scholar]
- Kohler H-P, Behrman JR, & Schnittker J (2011). Social science methods for twins data: Integrating causality, endowments and heritability. Biodemography and Social Biology, 57(1), 88–141. 10.1080/19485565.2011.580619 [DOI] [PMC free article] [PubMed] [Google Scholar]
- Kossek EE, & Lautsch BA (2012). Work–family boundary management styles in organizations: A cross-level model. Organizational Psychology Review, 2(2), 152–171. 10.1177/2041386611436264 [DOI] [Google Scholar]
- Ladge JJ, & Little LM (2019). When expectations become reality: Work-family image management and identity adaptation. Academy of Management Review, 44(1), 126–149. 10.5465/amr.2016.0438 [DOI] [Google Scholar]
- Li W-D, Stanek KC, Zhang Z, Ones DS, & McGue M (2016). Are genetic and environmental influences on job satisfaction stable over time? A three-wave longitudinal twin study. Journal of Applied Psychology, 101(11), 1598–1619. 10.1037/apl0000057 [DOI] [PubMed] [Google Scholar]
- Li W-D, Zhang Z, Song Z, & Arvey RD (2016). It is also in our nature: Genetic influences on work characteristics and in explaining their relationships with well-being. Journal of Organizational Behavior, 37(6), 868–888. 10.1002/job.2079 [DOI] [Google Scholar]
- Lüdecke D, Ben-Shachar M, Patil I, & Makowski D (2020). Extracting, computing and exploring the parameters of statistical models using R. Journal of Open Source Software, 5(53), 2445. 10.21105/joss.02445 [DOI] [Google Scholar]
- Lüdecke D, Makowski D, Ben-Shachar MS, Patil I, Højsgaard S, & Wiernik BM (2021). parameters: Processing of model parameters (0.14.0) [R package] https://CRAN.R-project.org/package=parameters
- Lüdecke D, Patil I, Ben-Shachar MS, Wiernik BM, Waggoner P, & Makowski D (2021). see: An R package for visualizing statistical models. Journal of Open Source Software, 6(64), 3393. 10.21105/joss.03393 [DOI] [Google Scholar]
- Magnusson A, Skaug H, Nielsen A, Berg C, Kristensen K, Maechler M, Bentham K. van, Bolker B, & Brooks M (2021). glmmTMB: Generalized linear mixed models using Template Model Builder (1.1.1) [R package] https://CRAN.R-project.org/package=glmmTMB
- Matthews RA, Wayne JH, & Ford MT (2014). A work-family conflict/subjective well-being process model: A test of competing theories of longitudinal effects. The Journal of Applied Psychology, 99(6), 1173–1187. 10.1037/a0036674 [DOI] [PubMed] [Google Scholar]
- McArdle JJ (2009). Latent variable modeling of differences and changes with longitudinal data. Annual Review of Psychology, 60(1), 577–605. 10.1146/annurev.psych.60.110707.163612 [DOI] [PubMed] [Google Scholar]
- McCrae RR, Martin TA, Hrebícková M, Urbánek T, Boomsma DI, Willemsen G, & Costa PT (2008). Personality trait similarity between spouses in four cultures. Journal of Personality, 76(5), 1137–1164. 10.1111/j.1467-6494.2008.00517.x [DOI] [PMC free article] [PubMed] [Google Scholar]
- McGue M, Osler M, & Christensen K (2010). Causal inference and observational research: The utility of twins. Perspectives on Psychological Science, 5(5), 546–556. 10.1177/1745691610383511 [DOI] [PMC free article] [PubMed] [Google Scholar]
- McNeish D, & Kelley K (2019). Fixed effects models versus mixed effects models for clustered data: Reviewing the approaches, disentangling the differences, and making recommendations. Psychological Methods, 24(1), 20–35. 10.1037/met0000182 [DOI] [PubMed] [Google Scholar]
- Michel JS, Clark MA, & Jaramillo D (2011). The role of the Five Factor Model of personality in the perceptions of negative and positive forms of work–nonwork spillover: A meta-analytic review. Journal of Vocational Behavior, 79(1), 191–203. 10.1016/j.jvb.2010.12.010 [DOI] [Google Scholar]
- Michel JS, Kotrba LM, Mitchelson JK, Clark MA, & Baltes BB (2011). Antecedents of work-family conflict: A meta-analytic review. Journal of Organizational Behavior, 32(5), 689–725. 10.1002/job.695 [DOI] [Google Scholar]
- Michel JS, Mitchelson JK, Pichler S, & Cullen KL (2010). Clarifying relationships among work and family social support, stressors, and work–family conflict. Journal of Vocational Behavior, 76(1), 91–104. 10.1016/j.jvb.2009.05.007 [DOI] [Google Scholar]
- Müller K (2020). here: A simpler way to find your files (1.0.1) [R package] https://CRAN.R-project.org/package=here
- Nagel M, Jansen PR, Stringer S, Watanabe K, de Leeuw CA, Bryois J, Savage JE, Hammerschlag AR, Skene NG, Muñoz-Manchado AB, White T, Tiemeier H, Linnarsson S, Hjerling-Leffler J, Polderman TJC, Sullivan PF, van der Sluis S, & Posthuma D (2018). Meta-analysis of genome-wide association studies for neuroticism in 449,484 individuals identifies novel genetic loci and pathways. Nature Genetics, 50(7), 920–927. 10.1038/s41588-018-0151-7 [DOI] [PubMed] [Google Scholar]
- Nave G, Nadler A, Zava D, & Camerer C (2017). Single dose testosterone administration impairs cognitive reflection in men. Psychological Science, 28(10), 1398–1407. 10.1177/0956797617709592 [DOI] [PubMed] [Google Scholar]
- Neale MC, & Cardon L (1992). Methodology for genetic studies of twins and families Springer Netherlands. 10.1007/978-94-015-8018-2 [DOI] [Google Scholar]
- Neale MC, Hunter MD, Pritkin J, Zahery M, Brick TR, Kirkpatrick RM, Estabrook R, Bates TC, Maes HH, & Boker SM (2016). OpenMx 2.0: Extended structural equation and statistical modeling. Psychometrika, 81(2), 535–549. 10.1007/s11336-014-9435-8 [DOI] [PMC free article] [PubMed] [Google Scholar]
- Netemeyer RG, Boles JS, & McMurrian R (1996). Development and validation of work–family conflict and family–work conflict scales. Journal of Applied Psychology, 81(4), 400–410. 10.1037/0021-9010.81.4.400 [DOI] [Google Scholar]
- Nicolaou N, & Shane S (2010). Entrepreneurship and occupational choice: Genetic and environmental influences. Journal of Economic Behavior & Organization, 76(1), 3–14. 10.1016/j.jebo.2010.02.009 [DOI] [Google Scholar]
- O’Hara-Wild M, & Hayes A (2021). distributional: Vectorised probability distributions (0.2.2) [R package] https://CRAN.R-project.org/package=distributional
- Paterson TA, Harms PD, Steel P, & Credé M (2016). An assessment of the magnitude of effect sizes: Evidence from 30 years of meta-analysis in management. Journal of Leadership & Organizational Studies, 23(1), 66–81. 10.1177/1548051815614321 [DOI] [Google Scholar]
- Perrewé PL, & Zellars KL (1999). An examination of attributions and emotions in the transactional approach to the organizational stress process. Journal of Organizational Behavior, 20(5), 739–752. [DOI] [Google Scholar]
- Poelmans SAY (2005). The decision process theory of work and family. In Work and life integration: Organizational, cultural, and individual perspectives (pp. 263–285). Lawrence Erlbaum Associates Publishers. [Google Scholar]
- Powell GN, & Greenhaus JH (2006). Managing incidents of work-family conflict: A decision-making perspective. Human Relations, 59(9), 1179–1212. 10.1177/0018726706069765 [DOI] [Google Scholar]
- R Core Team. (2021). R: a language and environment for statistical computing (4.1.0) [Computer software] R Foundation for Statistical Computing. https://www.R-project.org [Google Scholar]
- Rantanen J, Kinnunen U, Pulkkinen L, & Kokko K (2012). Developmental trajectories of work–family conflict for Finnish workers in midlife. Journal of Occupational Health Psychology, 17(3), 290–303. 10.1037/a0028153 [DOI] [PubMed] [Google Scholar]
- Revelle W (2021). psych: Procedures for psychological, psychometric, and personality research (2.1.6) [R package] Northwestern University. https://CRAN.R-project.org/package=psych [Google Scholar]
- Rohrer JM (2018). Thinking clearly about correlations and causation: Graphical causal models for observational data. Advances in Methods and Practices in Psychological Science, 1(1), 16. 10.1177/2515245917745629 [DOI] [Google Scholar]
- Rohrer JM, Hünermund P, Arslan RC, & Elson M (2021). That’s a lot to PROCESS! Pitfalls of popular path models 10.31234/osf.io/paeb7 [DOI] [Google Scholar]
- Shane S (2009). Introduction to the focused issue on the biological basis of business. Organizational Behavior and Human Decision Processes, 110(2), 67–69. 10.1016/j.obhdp.2009.10.001 [DOI] [Google Scholar]
- Shane S, Nicolaou N, Cherkas L, & Spector TD (2010). Genetics, the Big Five, and the tendency to be self-employed. Journal of Applied Psychology, 95(6), 1154–1162. 10.1037/a0020294 [DOI] [PubMed] [Google Scholar]
- Shockley KM, & Allen TD (2013). Episodic work–family conflict, cardiovascular indicators, and social support: An experience sampling approach. Journal of Occupational Health Psychology, 18(3), 262–275. 10.1037/a0033137 [DOI] [PubMed] [Google Scholar]
- Shockley KM, & Allen TD (2015). Deciding between work and family: An episodic approach. Personnel Psychology, 68(2), 283–318. 10.1111/peps.12077 [DOI] [Google Scholar]
- Smith CE, Wayne JH, Matthews RA, Lance CE, Griggs TL, & Pattie MW (2022). Stability and change in levels of work–family conflict: A multi‐study, longitudinal investigation. Journal of Occupational and Organizational Psychology, 95(1), 1–35. 10.1111/joop.12372 [DOI] [Google Scholar]
- Spector PE, & Jex SM (1998). Development of four self-report measures of job stressors and strain: Interpersonal Conflict at Work Scale, Organizational Constraints Scale, Quantitative Workload Inventory, and Physical Symptoms Inventory. Journal of Occupational Health Psychology, 3(4), 356–367. 10.1037/1076-8998.3.4.356 [DOI] [PubMed] [Google Scholar]
- Stoeva AZ, Chiu RK, & Greenhaus JH (2002). Negative affectivity, role stress, and work–family conflict. Journal of Vocational Behavior, 60(1), 1–16. 10.1006/jvbe.2001.1812 [DOI] [Google Scholar]
- Tetrick LE, & Winslow CJ (2015). Workplace stress management interventions and health promotion. Annual Review of Organizational Psychology and Organizational Behavior, 2(1), 583–603. 10.1146/annurev-orgpsych-032414-111341 [DOI] [Google Scholar]
- Theorell T, De Manzano Ö, Lennartsson A-K, Pedersen NL, & Ullén F (2016). Self-reported psychological demands, skill discretion and decision authority at work: A twin study. Scandinavian Journal of Public Health, 44(4), 354–360. 10.1177/1403494815626610 [DOI] [PubMed] [Google Scholar]
- Turkheimer E (2000). Three laws of behavior genetics and what they mean. Current Directions in Psychological Science, 9(5), 160–164. 10.1111/1467-8721.00084 [DOI] [Google Scholar]
- Vukasović T, & Bratko D (2015). Heritability of personality: A meta-analysis of behavior genetic studies. Psychological Bulletin, 141(4), 769–785. 10.1037/bul0000017 [DOI] [PubMed] [Google Scholar]
- Wang RAH, Davis OSP, Wootton RE, Mottershaw A, & Haworth CMA (2017). Social support and mental health in late adolescence are correlated for genetic, as well as environmental, reasons. Scientific Reports, 7(1). 10.1038/s41598-017-13449-2 [DOI] [PMC free article] [PubMed] [Google Scholar]
- Wayne JH, Musisca N, & Fleeson W (2004). Considering the role of personality in the work–family experience: Relationships of the big five to work–family conflict and facilitation. Journal of Vocational Behavior, 64(1), 108–130. 10.1016/S0001-8791(03)00035-6 [DOI] [Google Scholar]
- Westreich D, & Greenland S (2013). The table 2 fallacy: Presenting and interpreting confounder and modifier coefficients. American Journal of Epidemiology, 177(4), 292–298. 10.1093/aje/kws412 [DOI] [PMC free article] [PubMed] [Google Scholar]
- Wickham H (2016). ggplot2: Elegant graphics for data analysis (2nd ed.). Springer International Publishing. 10.1007/978-3-319-24277-4 [DOI] [Google Scholar]
- Wickham H, Averick M, Bryan J, Chang W, McGowan L, François R, Grolemund G, Hayes A, Henry L, Hester J, Kuhn M, Pedersen T, Miller E, Bache S, Müller K, Ooms J, Robinson D, Seidel D, Spinu V, … Yutani H (2019). Welcome to the Tidyverse. Journal of Open Source Software, 4(43), 1686. 10.21105/joss.01686 [DOI] [Google Scholar]
- Wickham H, & Bryan J (2019). readxl: Read Excel files (1.3.1) [R package] https://readxl.tidyverse.org
- Wiernik BM, & Kostal JW (2019). Protean and boundaryless career orientations: A critical review and meta-analysis. Journal of Counseling Psychology, 66(3), 280–307. 10.1037/cou0000324 [DOI] [PubMed] [Google Scholar]
- Wilke CO (2020). ggtext: Improved text rendering support for “ggplot2” (0.1.1) [R package] https://CRAN.R-project.org/package=ggtext
- Wooldridge JM (2002). Econometric analysis of cross section and panel data MIT Press. [Google Scholar]
- Zeileis A, Fisher JC, Hornik K, Ihaka R, McWhite CD, Murrell P, Stauffer R, & Wilke CO (2020). colorspace: A toolbox for manipulating and assessing colors and palettes. Journal of Statistical Software, 96(1), 1–49. 10.18637/jss.v096.i01 [DOI] [Google Scholar]
- Zhang Z, Ilies R, & Arvey RD (2009). Beyond genetic explanations for leadership: The moderating role of the social environment. Organizational Behavior and Human Decision Processes, 110(2), 118–128. 10.1016/j.obhdp.2009.06.004 [DOI] [Google Scholar]
- Zou GY (2007). Toward using confidence intervals to compare correlations. Psychological Methods, 12(4), 399–413. 10.1037/1082-989X.12.4.399 [DOI] [PubMed] [Google Scholar]
- Zyphur MJ, Allison PD, Tay L, Voelkle MC, Preacher KJ, Zhang Z, Hamaker EL, Shamsollahi A, Pierides DC, Koval P, & Diener E (2020). From data to causes I: Building a general cross-lagged panel model (GCLM). Organizational Research Methods, 23(4), 651–687. 10.1177/1094428119847278 [DOI] [Google Scholar]