

Abstract
Individuals with sickle cell disease (SCD) have historically been considered underweight. Despite increasing body mass index (BMI) in the general population, the prevalence of overweight and obese status remains unclear in the adult SCD population. Our primary aim was to determine the prevalence of overweight and obese status and to identify associations between BMI, demographic, and clinical characteristics. We conducted an analysis of abstracted electronic health record data and patient reported outcomes from the Sickle Cell Disease Implementation Consortium registry; individuals ages 20–45 were included. Median BMI for the 1,664 adults in this analysis was 23.9 kg/m2 (21.1–28). In this cohort, 42.9% had a BMI>25 kg/m2 (CDC definition of overweight/obese). In multivariable analysis, higher odds of being overweight or obese were associated with female gender, older age, college education, private insurance, and hypertension diagnosis. Higher odds of BMI>25 kg/m2 were observed in individuals with HbSC or HbSß+-thalassemia regardless of hydroxyurea exposure (OR 3.4, p<0.0001) and HbSS or HbSß0-thalassemia exposed to hydroxyurea (OR 1.6, p=0.0003) compared to those with HbSS or HbSß0-thalassemia with no hydroxyurea exposure. These data highlight the importance of early identification, prevention, and intervention for increasing BMI to reduce obesity-related complications which may impact SCD related complications.
Keywords: sickle cell disease, body mass index, overweight, obesity, high BMI
Introduction
Sickle cell disease (SCD) has been historically believed to be associated with underweight status. However, with the well-established increasing rates of obesity in the general population, it is unclear if this remains true for individuals with SCD. According to 2013–2016 National Health and Nutrition Examination Survey (NHANES) data in adults over 20 years old in the United States (US), the overall prevalence of overweight and obesity, defined as a body mass index (BMI) ≥25kg/m2, is now 70.9%.1,2 The prevalence of high BMI is also disparate across racial/ethnic groups - Non-Hispanic Black (76.1%) versus White (69.8%) and Asian (53.8%) adults.1,2 Despite understanding the proportion of overweight and obese adults nationally, the current prevalence of overweight and obesity among adults with SCD is unclear.3–12
Many individuals with SCD experience multiple musculoskeletal and cardiopulmonary complications due to chronic vaso-occlusion; these conditions can be exacerbated by an overweight or obese BMI status. Individuals with SCD with higher BMIs may be faced with the compounded burden of the morbidity and mortality associated with SCD and the well-known social, financial, and comorbid complications associated with overweight and obesity.1,13,14 The literature describing obesity in the general population suggests there is a relationship between obesity and depression, dyslipidemia, hypertension (HTN), type 2 diabetes, lower socioeconomic status, and other risk factors; however, these associations are not well understood in the adult SCD population.1,12
The current literature describing BMI among adults with SCD is limited with most studies focusing on the relationship between SCD and metabolic syndrome, modifiable cardiovascular risk factors, pain, SCD-related complications, and healthcare utilization. These studies have often yielded inconsistent results about the relationship between BMI and SCD, SCD complications, comorbidities, and socioeconomic factors.3,4,6,7,10,15 Existing studies are limited by inclusion of mostly pediatric samples, which are often not adjusted for growth charts, the recommended means to determine BMI through age 20.16 Additional limitations include small sample sizes from single centers.3,5–7,11,15,17
Therefore, we conducted this project as part of the Sickle Cell Disease Implementation Consortium (SCDIC) which included eight centers.18 As part of the SCDIC, a registry was developed to prospectively collect patient reported outcomes and clinical data from those living with SCD.19,20 Using the data collected by the SCDIC, the first objective of the current study was to determine the prevalence of overweight and obesity among adult SCDIC registry participants. The secondary objective was to investigate the associations between BMI category, demographic and clinical characteristics, and selected patient-reported outcomes.
Methods
Study design.
The parent study was a prospective, observational, longitudinal study of the SCDIC registry participants across eight US medical centers. For the purposes of the current study, we conducted an analysis of baseline electronic health record (EHR) and patient-reported outcomes data.
Setting, sample, and recruitment.
The SCDIC sites have previously been described.21 All eight sites were tertiary academic medical centers with a large clinical program serving individuals with SCD. Sites were geographically distributed primarily in the Midwest and South, and one site on the West Coast on the US. SCDIC registry enrollment began in December 2016 and ended in February 2021. Participants were eligible for the SCDIC registry if they were 15–45 years old, could read and write in English, had a confirmed diagnosis of SCD (subtypes SS, SC, Sβ+, Sβ0, SD, SO, SC, SE), and provided informed consent. For this study, adults between 20–45 years old were included. Adults ages 18–19 years were excluded as it is recommended to use BMI-for-growth charts to determine their BMIs. Those who received a bone marrow transplant, were unable to complete the baseline patient enrollment survey, were pregnant, or had a SCD trait were excluded. Institutional Review Board (IRB) approval was obtained from each site’s respective IRB and participants provided written or verbal consent. Participants were recruited via phone calls or in the following in-person settings: SCD clinics, emergency departments, pain/infusion centers, and community events.22 Each site enrolled at least 300 participants and seven sites compensated participants upon enrollment.
Data Collection
SCDIC registry data were obtained from the EHR by research staff, who also administered patient surveys at the date of enrollment or subsequent follow-up visits. Patient surveys captured data at the time of enrollment using two validated measures, the Patient-Reported Outcomes Measurement Information System (PROMIS) and Adult Sickle Cell Quality of Life Measurement (ASCQ-Me®) survey. Detailed descriptions of the patient enrollment survey and medical record abstraction process have been published.19
Measures
EHR and patient survey data were analyzed. EHR data included SCD genotype, anthropometric measurements, hydroxyurea (HU) use, non-SCD-related complications (HTN defined as systolic blood pressure >140 and depression) and health insurance provider. SCD genotype was categorized into three groups: 1. HbSS, HbSβ0-thalassemia, 2. HbSC, HbSβ+-thalassemia and 3. Other, which included genotypes HbS/HPFH, HbSE, HbSD, and HbSO. Height and weight collected from the EHR at the time of enrollment were used to calculate BMI (kg/m2) post-hoc. We used the Centers for Disease Control and Prevention (CDC) BMI status categories of underweight (<18.5 kg/m2), normal weight (18.5–24.9 kg/m2), overweight (25–29.9 kg/m2), and obese (>30 kg/m2).1 Insurance coverage (e.g., none, private health insurance, Medicare, Medicaid, and TRICARE) abstracted from the EHR were recoded to none, private health insurance, and public health insurance (Medicare, Medicaid, and TRICARE).
Patient-reported outcomes used in this analysis included the PROMIS Emotional Distress-Depression short form, which was transformed into a t-score and categorized into three and four categories with higher t-scores indicating worse symptoms. The 9-item ASCQ-Me® SCD Medical History Checklist was interpreted as a cumulative score from 0 to 9 and each item was analyzed independently. The nine items include self-reported history (yes/no) of the following complications: daily pain medications, regular blood transfusions for SCD, leg ulcers at any time, lung problems, kidney damage, retinopathy, damage to hip or shoulder, stroke, or spleen removed or damaged. The ASCQ-Me® Pain Episode Severity and Frequency scores were each transformed into t-scores, with higher scores indicating worse pain.23
Statistical Analysis
Our primary outcome of BMI was descriptively interpreted as a continuous and categorical variable to determine group frequencies. Summary statistics are presented as frequencies and percentages for categorical variables, mean and standard deviation for normally distributed variables, and median and interquartile range for non-normally distributed variables. Categorical variables were analyzed using Chi-Squared tests. Continuous variables were compared by independent sample t-tests or Wilcoxon-Mann-Whitney test as appropriate. Two-sided p-values <0.05 were considered statistically significant.
Univariate analysis was used to evaluate potentially significant variables for inclusion in a multivariable model. Variables achieving a p<0.1 in univariate analysis were included in a multivariable logistic regression with backward elimination (exit criteria >=0.05) to identify factors independently associated with overweight/obesity. Based on the univariate prescreening results, the following items were included in the initial multivariable model: age, gender, highest level of education, medical insurance coverage, hypertension, SCD genotype, ASCQ-Me pain episode frequency and severity scores, daily use of pain medicine for SCD, regular blood transfusions, diagnosis of kidney damage, retinopathy, damage to hip/ shoulder due to SCD. HU use was also added to the multivariable model due to its perceived clinical significance in this population. Odds ratios (OR) and corresponding 95% confidence intervals were obtained for variables remaining in the final model. Given the exploratory nature of this study, analyses were conducted without adjustment for multiple comparisons. All analyses were conducted using SAS Version 9.4 (SAS Institute Inc., Cary, NC, USA).
Results
Prevalence of BMI elevation
For this cross-sectional analysis of 2,433 SCDIC registry participants, 1,664 were included in the final analysis (Figure 1). We excluded 769 participants from the final analysis due to pregnancy at enrollment, incomplete enrollment surveys, age <20 years old, or missing height and/or weight in EHR data. The median BMI of the entire cohort was 23.9 kg/m2 (21.1–28) and 42.9% of this group had a BMI ≥25 kg/m2. Table 1 reports the sociodemographic characteristics, genotype, median and categorical BMI for the sample. BMI > 30 kg/m2 was more prevalent in participants from SCDIC sites in the southern US. This is most apparent when examining sites 3 and 4 where at least one in five participants were obese (see Supplemental table 1).
Figure 1.
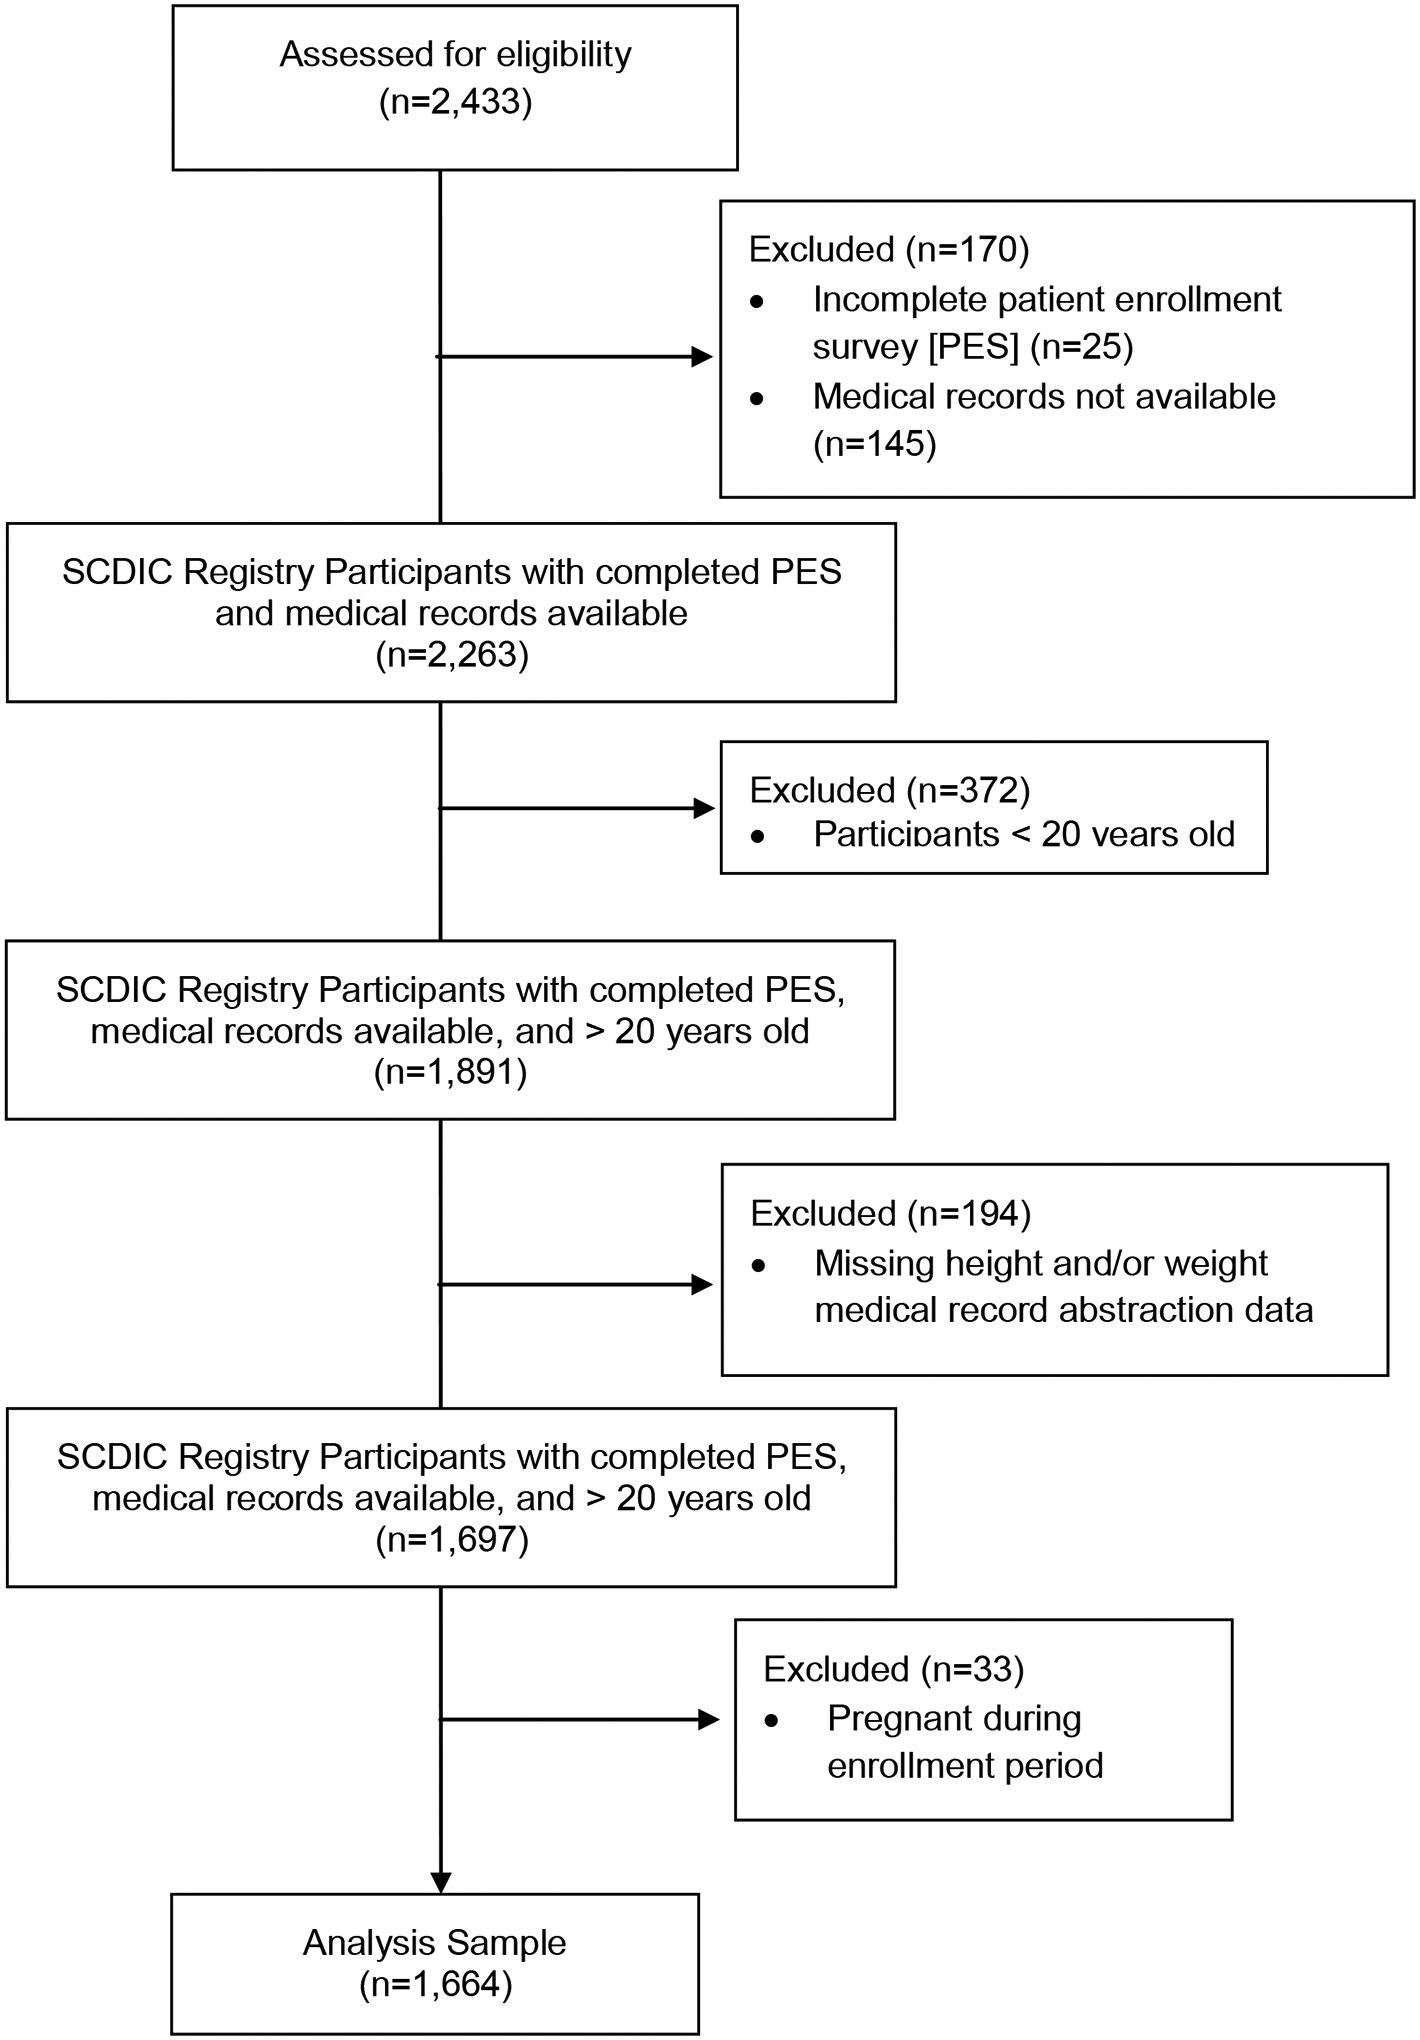
Participant Eligibility Diagram
Table 1.
Participant socio-demographics and clinical characteristics
| Characteristic | N = 1664 |
|---|---|
| BMI (median) | 23.9 (21.1–28) |
| BMI (categories) | |
| Underweight (<18.5 kg/m2) | 107 (6.4%) |
| Normal Weight (18.5 – 24.9 kg/m2) | 844 (50.7%) |
| Overweight (25 – 29.9 kg/m2) | 422 (25.4%) |
| Obese (>30 kg/m2) | 291 (17.5%) |
| Age | |
| Mean (SD) years | 30.2 (6.8) |
| Age Category (years) | |
| 20–25 | 506 (30.4%) |
| 26–35 | 751 (45.1%) |
| 36–45 | 407 (24.5%) |
| Gender | |
| Male | 723 (43.4%) |
| Female | 941 (56.6%) |
| Race | |
| Black/African American | 1604 (99.1%) |
| Other Race (American Indian/Alaska Native, Asian, White) | 15 (0.9%) |
| Ethnicity | |
| Hispanic ethnicity | 81 (5.0) |
| Highest Education | |
| Less than high school | 159 (9.7%) |
| High school / GED | 452 (27.6%) |
| Some college or vocational training | 593 (36.2%) |
| College graduate or professional | 432 (26.4%) |
| Employment | |
| Working now | 641(39.3) |
| Disabled | 449 (27.5) |
| Student | 163 (10.0) |
| Other (unemployed, retired) | 378 (23.2) |
| Marital Status | |
| Married or living together | 276 (17.4) |
| Never married | 1211 (76.3) |
| Not married (divorced/separated, widowed) | 101 (6.4) |
| Insurance | |
| Medicare, Medicaid or military health plan | 1195 (72.0%) |
| Private health Insurance | 400 (24.1%) |
| None | 65 (3.9%) |
| Annual Household Income | |
| $25,000 and under | 828 (55.3%) |
| $25,001 – $50,000 | 328 (21.9%) |
| $50,001+ | 341 (22.8%) |
| Sickle cell disease diagnosis | |
| SS or Sß0 | 1221 (73.4%) |
| SC | 336 (20.2%) |
| Sß+ | 84 (5.0%) |
| Other | 23 (1.4%) |
| Non-SCD Complications | |
| Hypertension | 590 (35.5%) |
Patients with missing data are not included in calculations of percentages unless otherwise specified.
45 (2.7%) values were missing for race, 42 (2.5%) for ethnicity, 28 (1.7%) for education, 33 (2%) employment, 76 (4.6%), marital status, 4 (0.2%) for medical insurance, 3 (0.3%) for hypertension, 33 (2%) for hydroxyurea use, and 36 (2.2%) for PROMIS Emotional Distress. No values were missing for age, gender, or SCD genotype.
Table 2 reports BMI status by BMI categories (underweight or normal vs. overweight or obese) and overall median BMI by sociodemographic characteristics. Women (51.4%), individuals with some college education (47.4%), and those with private insurance (45%) had the highest proportion of overweight or obesity. No differences in race, ethnicity, or income level were found between BMI categories.
Table 2.
Baseline characteristics by BMI
| BMI categorical | BMI continuous | |||||||
|---|---|---|---|---|---|---|---|---|
| Total Cohort (n, %) N=1664 |
Underweight/ Normal Weight (n=951, 57.2 %) |
Overweight/ Obese (n=713, 42.8%) |
p value | BMI (kg/m2) median (Q25, Q75) |
p value | |||
| Demographics | N | Row % | N | Row % | ||||
| Sex | ||||||||
| Male | 723 (43.4%) | 494 | 68.3% | 229 | 31.7% | <0.0001 | 22.8 (20.5–25.8) | <0.0001 |
| Female | 941 (56.6%) | 457 | 48.6% | 484 | 51.4% | 25.2 (21.7–29.7) | ||
| Age (years) (mean ± SD) | 29.4 | 6.6 (SD) | 31.2 | 6.8 (SD) | <0.0001 | 30.2 (SD 6.8) * | <0.0001 | |
| Age Category (years) | ||||||||
| 20–25 | 506 (30.4%) | 323 | 63.8% | 183 | 36.20% | <0.0001 | 23.2 (20.6 – 27.1) | <0.0001 |
| 26–35 | 751 (45.1%) | 438 | 58.3% | 313 | 41.70% | 23.8 (21.2–27.2) | ||
| 36–45 | 407 (24.5%) | 190 | 46.7% | 212 | 53.30% | 25.4 (21.9–29.5) | ||
| Level of Income | ||||||||
| $25,000 and under | 828 (55.3%) | 471 | 56.9% | 357 | 43.1% | 0.5 | 23.8 (21.1–28.2) | 0.4 |
| $25,001 – $50,000 | 328 (21.9%) | 177 | 54.0% | 151 | 46.0% | 24.3 (21.4–28.6) | ||
| $50,001+ | 341 (22.8%) | 198 | 58.1% | 143 | 41.9% | 24 (21.4–27.7) | ||
| Highest Level of Education | ||||||||
| Less than high school | 159 (9.7%) | 96 | 60.4% | 63 | 39.6% | 0.02 | 23.3 (20.4–28.54) | 0.002 |
| High school / GED | 452 (27.6%) | 281 | 62.2% | 171 | 37.8% | 23.3 (20.6–27.2) | ||
| Some college or vocational training | 593 (36.2%) | 312 | 52.6% | 281 | 47.4% | 24.4 (21.3–28.9) | ||
| College graduate or professional | 432 (26.4%) | 243 | 56.3% | 189 | 43.8% | 24.2 (21.5–27.9) | ||
| Insurance Coverage | ||||||||
| Medicare, Medicaid or military health plan | 1195 (72.0%) | 682 | 57.1% | 513 | 42.9% | 0.01 | 23.9 (20.9–28.2) | 0.01 |
| Private health Insurance | 400 (24.1%) | 217 | 54.3% | 183 | 45.8% | 24.4 (21.8–28.2) | ||
| None | 65 (3.8%) | 48 | 73.8% | 17 | 26.2% | 21.9 (20.8–25.8) | ||
| Clinical and patient reported outcomes | ||||||||
| Hypertension | 590 (35.5%) | 269 | 45.6% | 321 | 54.4% | <0.0001 | 25.6 (22.0–30.2) | <0.0001 |
| PROMIS Emotional Distress 4 groups | ||||||||
| None (<54.9) | 997 (61.2%) | 577 | 57.9% | 420 | 42.1% | 0.6 | 23.8 (21.2–28) | 0.9 |
| Mild (55–59.9) | 285 (17.5%) | 154 | 54.0% | 131 | 46.0% | 24.3 (21.2–28) | ||
| Moderate (60–69.9) | 312 (19.2%) | 177 | 56.7% | 135 | 43.3% | 23.6 (20.8–28.5) | ||
| Severe (70+) | 34 (2.1%) | 21 | 61.8% | 13 | 38.2% | 23.4 (19.8–27.2) | ||
| PROMIS Emotional Distress 3 groups | ||||||||
| None (<54.9) | 997 (61.2%) | 577 | 57.9% | 420 | 42.1% | 0.5 | 23.8 (21.2–28) | 0.9 |
| Mild (55–59.9) | 285 (17.5%) | 154 | 54.0% | 131 | 46.0% | 24.3 (21.2–28) | ||
| Moderate/Severe (60+) | 346 (21.3%) | 198 | 57.2% | 148 | 42.8% | 23.6 (20.7–28.2) | ||
| Medications | ||||||||
| Hydroxyurea | 804 (49.3%) | 467 | 58.1% | 337 | 41.9% | 0.5 | 23.9 (21.1–27.6) | 0.1 |
| SCD Genotype | ||||||||
| HbSC, HbSß+ | 420 (25.5%) | 169 | 40.2% | 251 | 59.8% | <0.0001 | 26.6 (22.9–32.2) | <0.0001 |
| HbSS, HbSß0 | 1221 (73.4%) | 773 | 63.3% | 448 | 36.7% | 23.3 (20.6–26.9) | ||
| Other | 23 (1.4%) | 9 | 39.1% | 14 | 60.9% | 25.5 (23.2–30.0) | ||
Spearman correlation of 0.13 corresponding to age in years and BMI as continuous variable
Individuals with either HbSC or HbSβ+-thalassemia had a higher median BMI (26.6 kg/m2; 22.9–32.2) when compared to those with either HbSS or HbSβ0-thalassemia, (23.3 kg/m2; 20.6–26.9) or other genotypes (25.5 kg/m2; 23.2–30.0, p<0.001). More specifically, 59.8% of individuals with HbSC or HbSβ+-thalassemia (n=420) were overweight or obese, compared with only 36.7% of those with HbSS or HbSβ0-thalassemia (n=1221), and 60.9% of the other genotypes (n=23), p<0.001.
PROs, HU, and co-morbidities
No statistically significant differences were found in the median BMI, or BMI category, related to the PROMIS emotional distress scores (p=0.6) or HU use (p=0.5). No statistically significant differences were found in BMI category associated with ASCQ-Me pain frequency score (p=0.06) or the ASCQ-Me Medical History Checklist total score (p=0.6). Individuals meeting overweight or obese criteria reported a significantly higher mean pain severity score (51.8, SD 9.1) when compared with those who were under or normal weight. (50.8, SD 9.4, p=0.03). Though not statistically significant, mean self-reported pain frequency was higher for those who met overweight or obese criteria (50.6, SD 10.5) when compared to the under or normal weight group (49.6, SD 10.9, p=0.06).
We also analyzed each item of the ASCQ-Me Medical History Checklist (Figure 2). Among individuals who were overweight or obese, 76.2% self-reported they did not require regular blood transfusions versus 66.3% who were under or normal weight (p<0.001) and 59.7% denied damage to hips or shoulders versus 65.7% who were under or normal weight (p = 0.01). Overall, 54.4% of individuals with HTN met criteria for overweight or obese, versus 36.5% of those without HTN (Table 2).
Figure 2.
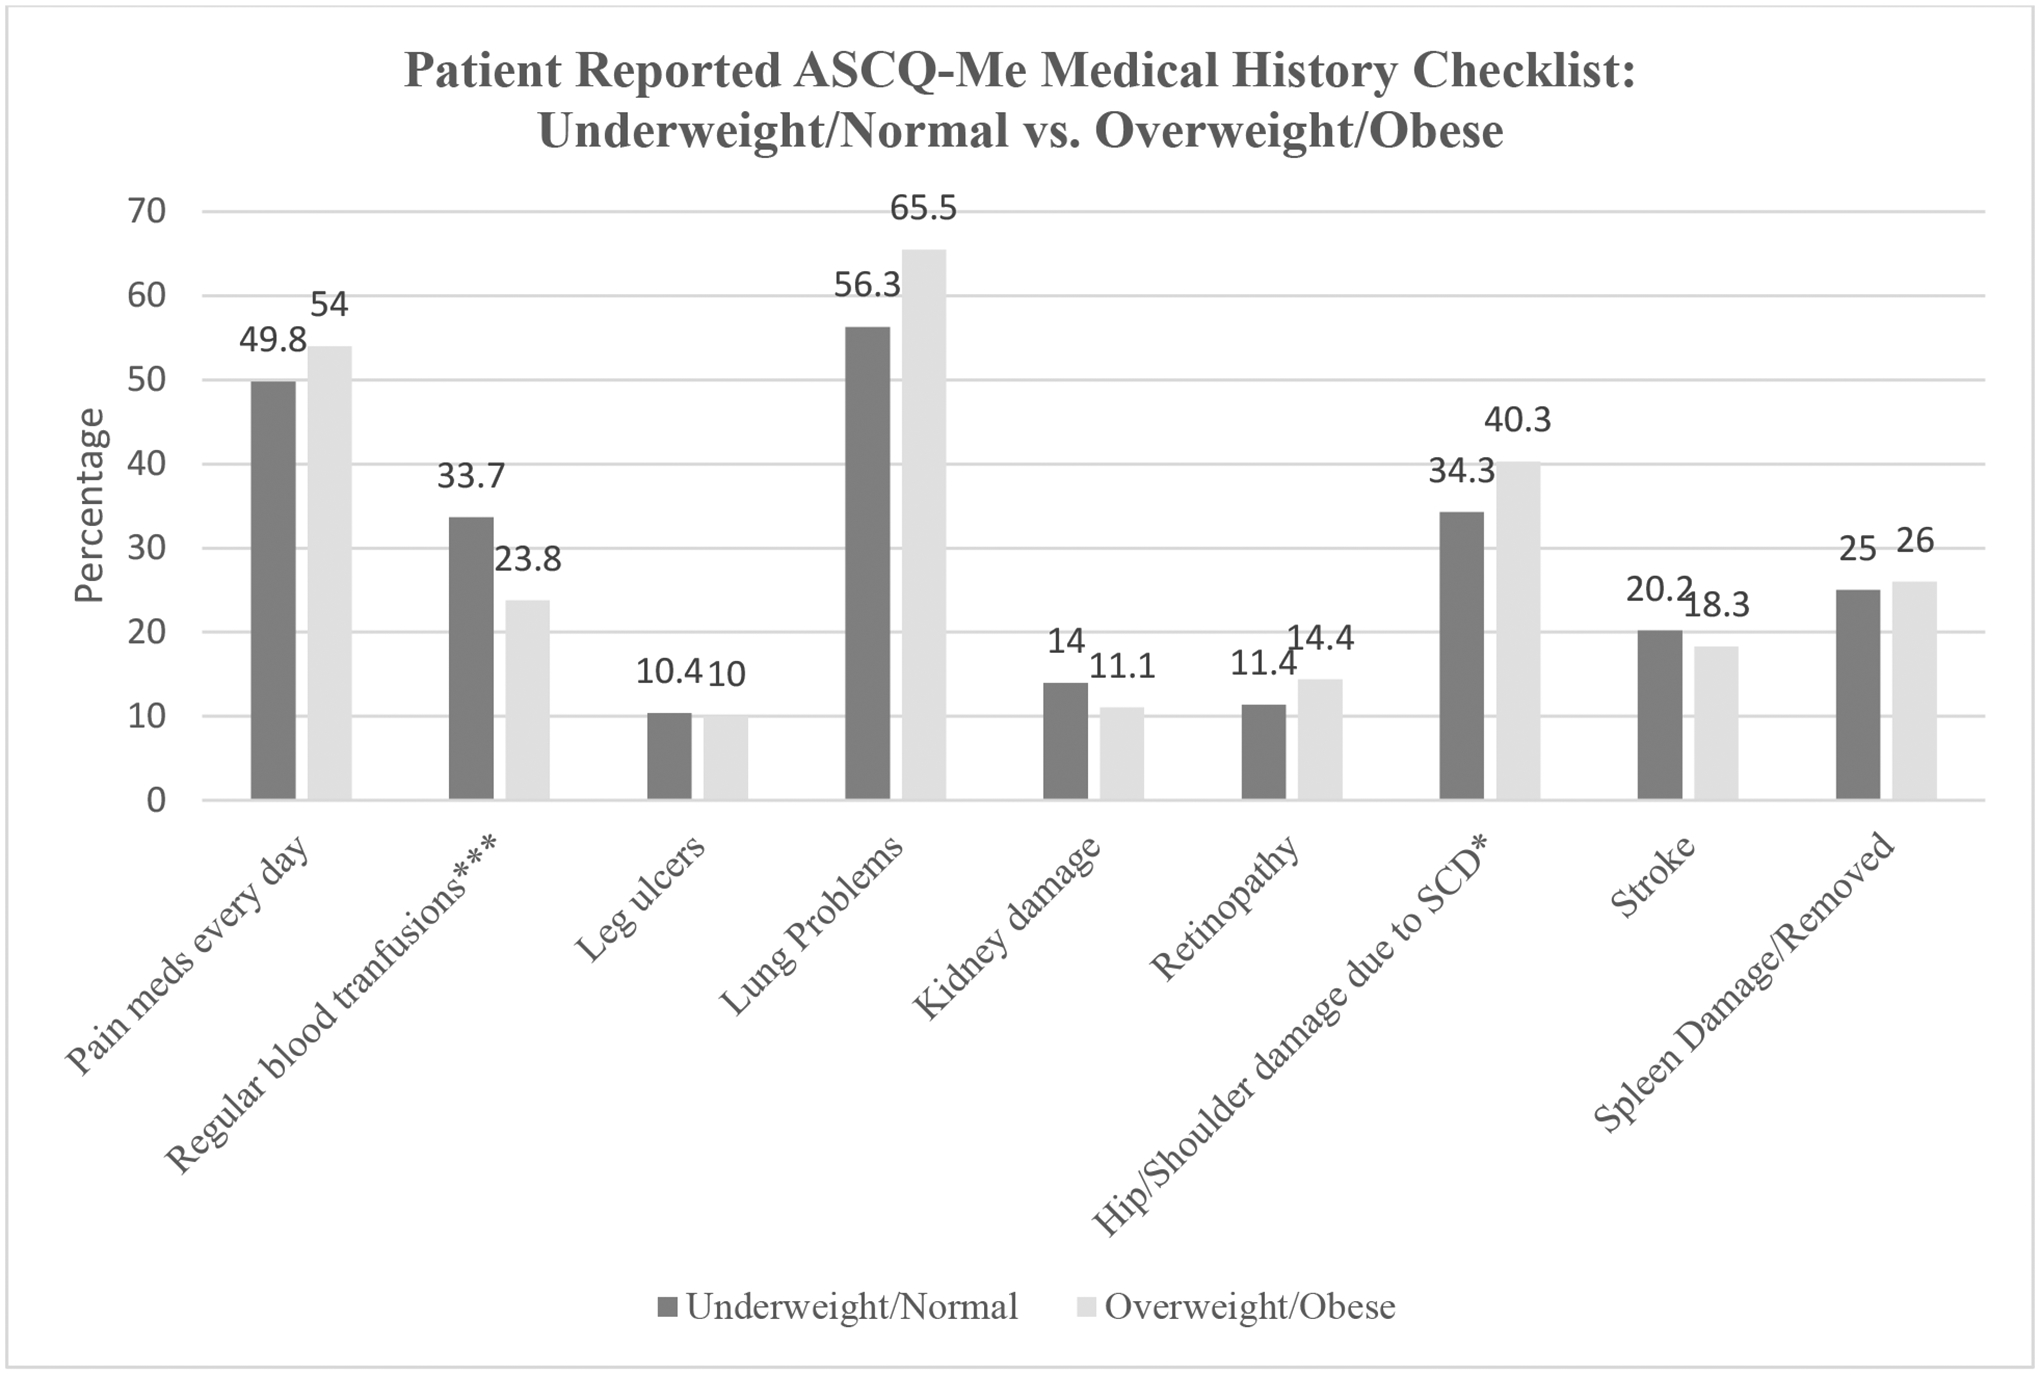
Patient report of ASCQ-Me Medical History individual items
*p value<0.01. ***p value<0.0001; Responses are not mutually exclusive
Risk factors for elevated BMI
Table 3 reports results from the final logistic regression model which highlights the likelihood of being overweight/obese versus under/normal weight. Since the preliminary analysis indicated the effect of HU varied among genotypes, in this model, we combined SCD genotype and HU use to create a compound variable and examined the joint effect of both on BMI. The variable was used for clarity of results interpretation but alternative models with genotype and HU use as separate variables, as an interaction term between both, and models stratified by SCD genotype were consistent with these results.
Table 3.
Results of final multivariable logistic regression analysis for overweight/obese status
| Variables | Adjusted OR (95% CI) | p-value | Overall type III p-value * |
|---|---|---|---|
| Sex Male | 0.4 (0.3–0.5) | <0.0001 | <.0001 |
| Age Category (years) | <.0001 | ||
| 20–25 | Ref. | ||
| 26–35 | 1.4 (1.05–1.8) | 0.02 | |
| 36–45 | 2.3 (1.7–3.2) | <0.0001 | |
| Highest Level of Degree | 0.02 | ||
| Less than high school | 1.2 (0.8–1.8) | 0.5 | |
| High school / GED | 1.1 (0.8–1.5) | 0.4 | |
| Some college or vocational training | 1.5 (1.1–2.0) | 0.003 | |
| College graduate or professional | Ref | ||
| Insurance Coverage | 0.01 | ||
| Medicare, Medicaid or military health plan | Ref | ||
| Private health Insurance | 1.1 (0.9–1.5) | 0.4 | |
| None | 0.4 (0.2–07) | 0.003 | |
| Hypertension | 2.0 (1.6–2.5) | <0.0001 | <.0001 |
| SCD genotype, HU use combined | |||
| SS/Sß0, no HU use | Ref. | <.0001 | |
| SS/Sß0, HU use | 1.6 (1.2–2.1) | 0.0003 | |
| SC/Sß+, HU use | 3.4 (2.1–5.4) | <0.0001 | |
| SC/Sß+, No HU use | 3.4 (2.5–4.7) | <0.0001 |
Type 3 P-values assessing overall significance of the predictor for covariates with more than 2 levels
Individuals who were older, female, reported some college, and reported HTN had higher odds of being overweight or obese. Participants with genotypes HbSS/Sß0 reporting HU use were 1.6 times more likely to be overweight/obese when compared to those with genotypes HbSS/Sß0 who did not report HU use. Patients with HbSC/Sß+, regardless of HU use, were 3.4 times more likely to be overweight/obese when compared to individuals with genotypes HbSS/Sß0 who did not report HU use. No measurable effect of HU use on obesity was detected in the HbSC or HbSß+-thalassemia group.
Discussion
In this paper we report the median BMI and prevalence of overweight and obesity in the largest cohort of adults with SCD to our knowledge. Our results demonstrate that contrary to the currently accepted belief that individuals with SCD are underweight, a large proportion of this adult cohort, 43%, were overweight or obese. Our results are consistent with a growing body of evidence that suggests overweight and obese BMI status is becoming more prevalent as survival for SCD improves.5,24 This is particularly important as the SCD population ages and reaches adulthood, the morbidities experienced in older age by the general population can impact the health of the SCD population. This study contributes to existing literature by elucidating the current prevalence of overweight and obese adults with SCD in a multi-regional sample in the U.S and clinical factors associated with high BMI.
Our data show that individuals who were older and female were more likely to be overweight or obese, which is consistent with previous smaller studies on children and adults with SCD.12,24 This finding is also consistent with NHANES 2017–2018 data, which showed that the prevalence of obesity is highest among women and non-Hispanic Black adults aged 40–59.25 A study comparing BMI to body fat (BF) percentage in women of reproductive age indicated that the current BMI cutoff value for obesity (≥30 kg/m2) may be too high.26 Another study using BF% to identify obesity in 22 women with SCD, demonstrated even with a normal mean BMI (22.6 kg/m2), this cohort had a mean BF% of 32.6% (consistent with obesity by dual-energy X-ray absorptiometry (DXA)).17,27–29 Our study also showed that individuals who were college educated or had private health insurance also had a higher BMI. This contrasts with findings in the general population where individuals with less education and with Medicare and Medicaid insurance have a higher BMI.30,31 The relationship between BMI, education, and income is complex and does vary by race/ethnicity and gender. For instance, according to 2011–2014 NHANES data, compared to individuals with less education college graduated Hispanic women, non-Hispanic Black women, and non-Hispanic White women had a lower prevalence of obesity. However, this difference was not noted for non-Hispanic Black men, Hispanic men, nor Asian men and women. One study suggests that the lower BMI noted in some educated individuals is primarily related to selection rather than causation; meaning that individuals with lower BMIs are more likely to achieve higher education rather than education causing one to have a lower BMI.31 In the current study, it is unclear why people with SCD with more education have higher BMIs. It is possible that those with a higher education or private insurance may have easier access to SCD subspecialty clinics and potentially access to improved disease management.
Our study demonstrated that individuals with HbSC or HbSβ+-thalassemia genotypes regardless of HU use, and individuals with HbSS or HbSβ0-thalassemia genotypes were more likely to be overweight or obese. This finding is similar to other SCD studies, yet is limited as some studies included pediatric populations.8,12,32 For instance, a greater prevalence of obesity was found in individuals with HbSC, HbSβ+-thalassemia, and HbSβ0-thalassemia compared to the HbSS genotypes in a combined adult and pediatric population aged 0–24.3 It is also possible that those individuals with HbSS or HbSβ0 thalassemia genotypes who report HU use have a better metabolism and are able to gain weight.33,34 Despite finding no difference in patient-reported disease severity using ASCQ-Me Medical History Checklist and no difference in pain frequency between BMI categories, we did find that having damage to hips or shoulders and having higher self-reported pain intensity was associated with being under or normal weight. Considering the pathophysiology of SCD, this finding is not surprising and under or normal weight status could be an indicator of severe disease activity and/or poorly controlled disease resulting in chronic anemia, organ damage, and high metabolic demand. This relationship will require further exploration in future studies.
Individuals with HTN had a higher median BMI and over half (54.4%) of those with HTN were overweight or obese. Similarly, Farooqui et al. reported a higher prevalence of HTN in an overweight/obese population of SCD in a single center retrospective study in the U.S.5 Akingbola et al. compared two cohorts of patients with sickle cell anemia from University of Illinois at Chicago and University of Ibadan, Nigeria and observed that the Chicago cohort was more likely to be overweight and obese, and rising BMI was independently associated with higher systolic and diastolic blood pressure and history of stroke.10 These associations are not only limited to the SCD population as associations between obesity, HTN, and ischemic heart disease have also been found among the general population.30 Despite these findings, challenges remain in using BMI alone to determine the risk of adverse outcomes in racially and ethnically diverse populations.35,36 Compared to Whites, BMI in Blacks demonstrates weaker associations with dyslipidemia, body fat, metabolic syndrome, and all-cause mortality.37 In 49 adults with SCD, Ogunsile et al. demonstrated that 14.3% of participants met criteria for metabolic syndrome. Participants in that study also had a saturated fat and sugar intake that exceeded the national recommended daily allowance.8 This risk of metabolic syndrome and ischemic heart disease has serious clinical implications, which requires more attention since adults with SCD already have an increased risk of cardiopulmonary disease, renal disease, and functional decline that increases with age.13,38,39 Increasing BMI with age in adults without SCD is associated with a higher pulmonary artery systolic pressure by middle age.40 Although, tricuspid regurgitant jet velocity (TRV) was not measured in our study, it is important to note that obesity can influence TRV by potentially falsely elevating it; therefore, clinicians should be cautious when interpreting TRV when screening for pulmonary hypertension by echocardiogram in obese patients with SCD.40 High BMI in SCD has been associated with increased risk for premature mortality.41 Obesity-related complications may go under-diagnosed and undertreated since many adults with SCD lack access to high quality primary care, where obesity-related complications such as HTN and diabetes are usually diagnosed.42 Hence, these findings emphasize the importance of co-management between hematology and primary care for adults with SCD and increased focus on nutrition and exercise.
Strengths and Limitations
The strengths of this study include the determination of BMI classification per CDC guidelines for adults ≥20 years of age. This provides a more accurate report of the prevalence of overweight, and obesity compared to prior studies that included pediatric patients with BMI assessed by growth charts. Additional strengths include the large sample size and geographic variation included in the SCDIC cohort.
Although BMI is a widely accepted method of classifying individuals’ BMI status, it is limited by its inability to differentiate between muscle and fat mass and should be explored in future studies. BMI identified 46.5% of Black women as obese compared to 28.0% of White women. In the same population, BF% identified 60.4% of Black women as obese (BF% >35% by World Health Organization cut point) compared to 58.7% of White women.26 Caution should be employed when using BMI to determine overall health status especially in Black women with SCD. Clinical discernment and personalization should be used when making decisions for weight-loss interventions.
Given that the diagnosis of diabetes in SCD can be complex, we did not include diabetes as a non-SCD complication since we could not confirm if the diagnosis was made accurately.25 The dataset used in this study did not include blood sugar nor lipid values with which we could make comparisons to BMI or characterize the role of high BMI in metabolic abnormalities. Another limitation included the use of patient-reported disease severity and SCD complications obtained from the ASCQ-Me Medical History Checklist rather than the collection of this information from the EHR. In addition, we could not determine associations between obesity, VOC, and death as these data were not available for this analysis, thus future studies are necessary to understand these relationships. Lack of data on physical function and activity represents another limitation. Despite the multi-institutional nature of this study, there is still an overrepresentation of Southern states in the SCDIC registry.
Conclusions
Our study demonstrated that the prevalence of overweight and obese BMI status is greater than previously reported among adults with SCD in the US. We report that high BMI is associated with HbSS or HbSβ0-thalassemia and HU use, HbSC or HbSβ+-thalassemia regardless of HU use, increasing age, female gender, some college, increased pain intensity, and HTN, which requires further exploration.
Supplementary Material
Acknowledgements -
The SCD Implementation Consortium has been supported by US Federal Government cooperative agreements HL133948, HL133964, HL133990, HL133996, HL133994, HL133997, HL134004, HL134007, and HL134042 from the National Heart Lung and Blood Institute and the National Institute on Minority Health and Health Disparities (Bethesda, MD).
Jane S. Hankins, Jeffrey Glassberg, Ward Hagar, Allison King, Cathy Melvin, Angela Snyder, Nirmish Shah, and Paula Tanabe were investigators in the parent study and provided access to patients and EHR data housed in the SCDIC. Ebony N. Burns and Laura Van Althius participated in data collection for the parent study. The SCDIC provided allowed access to the data for the current study. Stephanie O. Ibemere, Charity I. Oyedeji, Laura Van Althius, Ebony N. Burns, Liliana Preiss, and Paula Tanabe developed the concept, designed the current study, and drafted the manuscript. Liliana Preiss and John Myers provided statistical analysis support. Liliana Preiss performed the statistical analysis with input from all authors. All authors contributed to data interpretation. All authors provided critical revisions to and approval of the submitted and final versions this manuscript.
Conflict of Interest Disclosure –
SOI is part of an advisory board for bluebird bio. LEVA is part of advisory boards and has received speaker honoraria from Baxter Health. JSH is a consultant for GBT, CVS Health, Forma Therapeutics, and bluebird bio. JG is part of advisory boards with Novartis and CSL Behring. AK has previously consulted for and currently receives research funding from GBT. NS is a consultant for GBT, Novartis, Forma, Agios, Emmaus Pharmaceuticals, has received speaker honoraria from GBT, Novartis, Emmaus Pharmaceuticals, and Alexion, and research funding from GBT.
Footnotes
Ethics Approval and Patient Consent Statement – Institutional Review Board (IRB) approval was obtained from each site’s respective IRB and participants provided written or verbal consent.
Contributor Information
Stephanie O. Ibemere, Duke University School of Nursing, 307 Trent Drive, DUMC 3322 Durham, NC, 27710.
Charity I. Oyedeji, Department of Medicine, Division of Hematology, Duke University School of Medicine.
Liliana Preiss, RTI International.
Laura E. Van Althuis, Registered Dietitian, Duke Office of Clinical Research.
Jane S. Hankins, St. Jude Children’s Research Hospital.
Melissa Azul, St. Jude Children’s Research Hospital.
Ebony N. Burns, Clinical Research Coordinator, Duke University School of Nursing.
Jeffrey Glassberg, Mount Sinai.
Ward Hagar, University of California San Francisco.
Faiz Hussain, University of Illinois at Chicago.
Allison King, Washington University in St. Louis.
Cathy Melvin, Medical University of South Carolina.
John Myers, Duke University School of Nursing.
Angela Snyder, Georgia State University.
Nirmish Shah, Duke University Hospital.
Paula Tanabe, Duke University School of Nursing and Medicine.
Data Availability Statement –
Data will be publicly available from the NHLBI Data Repository at https://biolincc.nhlbi.nih.gov/home/ by December 2022.
References
- 1.Centers for Disease Control and Prevention. All About Adult BMI. Centers for Disease Control and Prevention. Published September 17, 2020. Accessed February 1, 2021. https://www.cdc.gov/healthyweight/assessing/bmi/adult_bmi/index.html [Google Scholar]
- 2.Centers for Disease Control and Prevention. Table 26. Normal weight, overweight, and obesity among adults aged 20 and over, by selected characteristics: United States, selected years 1988–1994 through 2013–2016. Published online 2018. https://www.cdc.gov/nchs/data/hus/2018/026.pdf
- 3.Zivot A, Apollonsky N, Gracely E, Raybagkar D. Body Mass Index and the Association With Vaso-occlusive Crises in Pediatric Sickle Cell Disease. J Pediatr Hematol Oncol. 2017;39(4):314–317. doi: 10.1097/MPH.0000000000000787 [DOI] [PubMed] [Google Scholar]
- 4.Chawla A, Sprinz PG, Welch J, et al. Weight Status of Children With Sickle Cell Disease. Pediatrics. 2013;131(4):e1168–e1173. doi: 10.1542/peds.2012-2225 [DOI] [PubMed] [Google Scholar]
- 5.Farooqui MW, Hussain N, Malik J, Rashid Y, Ghouse M, Hamdan J. Prevalence of Obesity in Sickle Cell Patients. Blood. 2014;124(21):4932–4932. doi: 10.1182/blood.V124.21.4932.4932 [DOI] [Google Scholar]
- 6.Halpern AB, Welch JJ, Hirway P, Chawla A. Prevalence and Complications of Obesity in Sickle Cell Disease. Blood. 2008;112(11):1434–1434. doi: 10.1182/blood.V112.11.1434.143418552208 [DOI] [Google Scholar]
- 7.Santanelli J, Zempsky W, Andemariam B, et al. Obesity worsens pain impact in individuals with sickle cell disease. J Pain. 2014;15(4):S33. doi: 10.1016/j.jpain.2014.01.135 [DOI] [Google Scholar]
- 8.Ogunsile FJ, Bediako SM, Nelson J, et al. Metabolic syndrome among adults living with sickle cell disease. Blood Cells Mol Dis. 2019;74:25–29. doi: 10.1016/j.bcmd.2018.10.005 [DOI] [PubMed] [Google Scholar]
- 9.Mitchell MJ, Carpenter GJO, Crosby LE, Bishop CT, Hines J, Noll J. Growth status in children and adolescents with sickle cell disease. Pediatr Hematol Oncol. 2009;26(4):202–215. doi: 10.1080/08880010902896882 [DOI] [PMC free article] [PubMed] [Google Scholar]
- 10.Akingbola TS, Tayo BO, Salako B, et al. Comparison of Patients from Nigeria and the USA Highlights Modifiable Risk Factors for Sickle Cell Anemia Complications. Hemoglobin. 2014;38(4):236–243. doi: 10.3109/03630269.2014.927363 [DOI] [PMC free article] [PubMed] [Google Scholar]
- 11.Pells JJ, Presnell KE, Edwards CL, et al. Moderate chronic pain, weight and dietary intake in African-American adult patients with sickle cell disease. J Natl Med Assoc. 2005;97(12):1622–1629. [PMC free article] [PubMed] [Google Scholar]
- 12.Hall R, Gardner K, Rees DC, Chakravorty S. High body mass index in children with sickle cell disease: a retrospective single-centre audit. BMJ Paediatr Open. 2018;2(1). doi: 10.1136/bmjpo-2018-000302 [DOI] [PMC free article] [PubMed] [Google Scholar]
- 13.Oyedeji C, Strouse JJ, Crawford RD, Garrett ME, Ashley-Koch AE, Telen M. A Multi-institutional Comparison of Younger and Older Adults with Sickle Cell Disease. Am J Hematol. 2019;94(4):E115–E117. doi: 10.1002/ajh.25405 [DOI] [PMC free article] [PubMed] [Google Scholar]
- 14.Grosse SD, Schechter MS, Kulkarni R, Lloyd-Puryear MA, Strickland B, Trevathan E. Models of Comprehensive Multidisciplinary Care for Individuals in the United States With Genetic Disorders. Pediatrics. 2009;123(1):407–412. doi: 10.1542/peds.2007-2875 [DOI] [PubMed] [Google Scholar]
- 15.Lamarre Y, Lalanne-Mistrih ML, Romana M, et al. Male Gender, Increased Blood Viscosity, Body Mass Index and Triglyceride Levels Are Independently Associated with Systemic Relative Hypertension in Sickle Cell Anemia. PLOS ONE. 2013;8(6):e66004. doi: 10.1371/journal.pone.0066004 [DOI] [PMC free article] [PubMed] [Google Scholar]
- 16.Centers for Disease Control and Prevention. BMI for Children and Teens. Centers for Disease Control and Prevention. Published December 3, 2021. Accessed May 8, 2022. https://www.cdc.gov/obesity/basics/childhood-defining.html [Google Scholar]
- 17.Woods KF, Ramsey LT, Callahan LA, et al. Body composition in women with sickle cell disease. Ethn Dis. 2001;11(1):30–35. [PubMed] [Google Scholar]
- 18.DiMartino LD, Baumann AA, Hsu LL, et al. The sickle cell disease implementation consortium: Translating evidence-based guidelines into practice for sickle cell disease. Am J Hematol. 2018;93(12):E391–E395. doi: 10.1002/ajh.25282 [DOI] [PMC free article] [PubMed] [Google Scholar]
- 19.Glassberg JA, Linton EA, Burson K, et al. Publication of data collection forms from NHLBI funded sickle cell disease implementation consortium (SCDIC) registry. Orphanet J Rare Dis. 2020;15(1):178. doi: 10.1186/s13023-020-01457-x [DOI] [PMC free article] [PubMed] [Google Scholar]
- 20.Knisely MR, Pugh N, Kroner B, et al. Patient-reported outcomes in sickle cell disease and association with clinical and psychosocial factors: Report from the sickle cell disease implementation consortium. Am J Hematol. 2020;95(9):1066–1074. doi: 10.1002/ajh.25880 [DOI] [PMC free article] [PubMed] [Google Scholar]
- 21.DiMartino LD, Baumann AA, Hsu LL, et al. The sickle cell disease implementation consortium: Translating evidence-based guidelines into practice for sickle cell disease. Am J Hematol. 2018;93(12):E391–E395. doi: 10.1002/ajh.25282 [DOI] [PMC free article] [PubMed] [Google Scholar]
- 22.Masese RV. Effective Recruitment Strategies for a Sickle Cell Patient Registry Across Sites from the Sickle Cell Disease Implementation Consortium (SCDIC). J Immigr Minor Health.:8. [DOI] [PMC free article] [PubMed] [Google Scholar]
- 23.Keller S, Yang M, Treadwell MJ, Hassell KL. Sensitivity of alternative measures of functioning and wellbeing for adults with sickle cell disease: comparison of PROMIS® to ASCQ-MeSM. Health Qual Life Outcomes. 2017;15:117. doi: 10.1186/s12955-017-0661-5 [DOI] [PMC free article] [PubMed] [Google Scholar]
- 24.Ballas SK. The Sixth Vital Sign: Body Mass Index in Patients With Sickle Cell Disease. J Clin Med Res. 2017;9(10):889–890. doi: 10.14740/jocmr3137w [DOI] [PMC free article] [PubMed] [Google Scholar]
- 25.Centers for Disease Control and Prevention NDBNo 360 February 2020. Prevalence of Obesity and Severe Obesity Among Adults: United States, 2017–2018. Published June 26, 2020. Accessed May 8, 2022. https://www.cdc.gov/nchs/products/databriefs/db360.htm
- 26.Rahman M, Berenson AB. Accuracy of current body mass index obesity classification for white, black, and Hispanic reproductive-age women. Obstet Gynecol. 2010;115(5):982–988. doi: 10.1097/AOG.0b013e3181da9423 [DOI] [PMC free article] [PubMed] [Google Scholar]
- 27.Romero-Corral A, Somers VK, Sierra-Johnson J, et al. Accuracy of body mass index in diagnosing obesity in the adult general population. Int J Obes 2005. 2008;32(6):959–966. doi: 10.1038/ijo.2008.11 [DOI] [PMC free article] [PubMed] [Google Scholar]
- 28.Evans EM, Rowe DA, Racette SB, Ross KM, McAuley E. Is the current BMI obesity classification appropriate for black and white postmenopausal women? Int J Obes 2005. 2006;30(5):837–843. doi: 10.1038/sj.ijo.0803208 [DOI] [PubMed] [Google Scholar]
- 29.Razak F, Anand SS, Shannon H, et al. Defining obesity cut points in a multiethnic population. Circulation. 2007;115(16):2111–2118. doi: 10.1161/CIRCULATIONAHA.106.635011 [DOI] [PubMed] [Google Scholar]
- 30.Mylona EK, Benitez G, Shehadeh F, et al. The association of obesity with health insurance coverage and demographic characteristics: a statewide cross-sectional study. Medicine (Baltimore). 2020;99(27):e21016. doi: 10.1097/MD.0000000000021016 [DOI] [PMC free article] [PubMed] [Google Scholar]
- 31.Benson R, von Hippel PT, Lynch JL. Does more education cause lower BMI, or do lower-BMI individuals become more educated? Evidence from the National Longitudinal Survey of Youth 1979. Soc Sci Med 1982. 2018;211:370–377. doi: 10.1016/j.socscimed.2017.03.042 [DOI] [PMC free article] [PubMed] [Google Scholar]
- 32.Kaufman K, Chin SH, Kahathuduwa C, et al. BMI, Psychosocial Correlates, Pain and Activities of Daily Living in Sickle Cell Disease Patients. Prog Prev Med. 2018;3(4):e0019. doi: 10.1097/pp9.0000000000000019 [DOI] [Google Scholar]
- 33.Orringer EP, Parker JC. Hydroxyurea and sickle cell disease. Hematol Pathol. 1992;6(4):171–178. [PubMed] [Google Scholar]
- 34.Fung EB, Barden EM, Kawchak DA, Zemel BS, Ohene-Frempong K, Stallings VA. Effect of Hydroxyurea Therapy on Resting Energy Expenditure in Children With Sickle Cell Disease. J Pediatr Hematol Oncol. 2001;23(9):604–608. [DOI] [PubMed] [Google Scholar]
- 35.Jackson AS, Stanforth PR, Gagnon J, et al. The effect of sex, age and race on estimating percentage body fat from body mass index: The Heritage Family Study. Int J Obes Relat Metab Disord J Int Assoc Study Obes. 2002;26(6):789–796. doi: 10.1038/sj.ijo.0802006 [DOI] [PubMed] [Google Scholar]
- 36.Akindele MO, Phillips JS, Igumbor EU. The Relationship Between Body Fat Percentage and Body Mass Index in Overweight and Obese Individuals in an Urban African Setting. J Public Health Afr. 2016;7(1):515. doi: 10.4081/jphia.2016.515 [DOI] [PMC free article] [PubMed] [Google Scholar]
- 37.Jackson CL, Wang NY, Yeh HC, Szklo M, Dray-Spira R, Brancati FL. Body-mass index and mortality risk in U.S. blacks compared to whites. Obes Silver Spring Md. 2014;22(3):842–851. doi: 10.1002/oby.20471 [DOI] [PMC free article] [PubMed] [Google Scholar]
- 38.Oyedeji CI, Hall K, Luciano A, Morey MC, Strouse JJ. The Sickle Cell Disease Functional Assessment (SCD-FA) tool: a feasibility pilot study. Pilot Feasibility Stud. 2022;8(1):53. doi: 10.1186/s40814-022-01005-3 [DOI] [PMC free article] [PubMed] [Google Scholar]
- 39.Caughey MC, Poole C, Ataga KI, Hinderliter AL. Estimated pulmonary artery systolic pressure and sickle cell disease: a meta-analysis and systematic review. Br J Haematol. 2015;170(3):416–424. doi: 10.1111/bjh.13447 [DOI] [PubMed] [Google Scholar]
- 40.Patel KV, Metzinger M, Park B, et al. Longitudinal Associations of Fitness and Obesity in Young Adulthood With Right Ventricular Function and Pulmonary Artery Systolic Pressure in Middle Age: The CARDIA Study. J Am Heart Assoc. 2021;10(7):e016968. doi: 10.1161/JAHA.120.016968 [DOI] [PMC free article] [PubMed] [Google Scholar]
- 41.Sachdev V, Tian X, Gu Y, et al. A phenotypic risk score for predicting mortality in sickle cell disease. Br J Haematol. 2021;192(5):932–941. doi: 10.1111/bjh.17342 [DOI] [PMC free article] [PubMed] [Google Scholar]
- 42.Oyedeji C, Strouse JJ. Improving the Quality of Care for Adolescents and Adults With Sickle Cell Disease—It’s a Long Road. JAMA Netw Open. 2020;3(5):e206377–e206377. doi: 10.1001/jamanetworkopen.2020.6377 [DOI] [PubMed] [Google Scholar]
Associated Data
This section collects any data citations, data availability statements, or supplementary materials included in this article.
Supplementary Materials
Data Availability Statement
Data will be publicly available from the NHLBI Data Repository at https://biolincc.nhlbi.nih.gov/home/ by December 2022.