

Abstract
Objective:
This study assessed the relationships between the salience of amplitude modulation (AM) cues encoded at the auditory nerve (AN), perceptual sensitivity to changes in AM rate (i.e., AM rate discrimination threshold, AMRDT), and speech perception scores in postlingually deafened adult cochlear implant (CI) users.
Design:
Study participants were 18 postlingually deafened adults with Cochlear™ Nucleus® devices, including five bilaterally implanted patients. For each of 23 implanted ears, neural encoding of AM cues at 20 Hz at the AN was evaluated at seven electrode locations across the electrode array using electrophysiological measures of the electrically evoked compound action potential (eCAP). The salience of AM neural encoding was quantified by the modulated response amplitude ratio (MRAR). Psychophysical measures of AMRDT for 20 Hz modulation were evaluated in 16 ears using a three-alternative, forced-choice procedure, targeting 79.4% correct on the psychometric function. AMRDT was measured at up to five electrode locations for each test ear, including the electrode pair that showed the largest difference in the MRAR. Consonant-Nucleus-Consonant (CNC) word scores presented in quiet and in speech-shaped noise at a signal-to-noise ratio (SNR) of +10 dB were measured in all 23 implanted ears. Simulation tests were used to assess the variations in correlation results when using the MRAR and AMRDT measured at only one electrode location in each participant to correlate with CNC word scores. Linear Mixed Models (LMMs) were used to evaluate the relationship between MRARs/AMRDTs measured at individual electrode locations and CNC word scores. Spearman Rank correlation tests were used to evaluate the strength of association between CNC word scores measured in quiet and in noise with 1) the variances in MRARs and AMRDTs, and 2) the averaged MRAR or AMRDT across multiple electrodes tested for each participant.
Results:
There was no association between the MRAR and AMRDT. Using the MRAR and AMRDT measured at only one, randomly selected electrode location to assess their associations with CNC word scores could lead to opposite conclusions. Both the results of LMMs and Spearman Rank correlation tests showed that CNC word scores measured in quiet or at 10 dB SNR were not significantly correlated with the MRAR or AMRDT. In addition, the results of Spearman Rank correlation tests showed that the variances in MRARs and AMRDTs were not significantly correlated with CNC word scores measured in quiet or in noise.
Conclusions:
The difference in AN sensitivity to AM cues is not the primary factor accounting for the variation in AMRDTs measured at different stimulation sites within individual CI users. The AN sensitivity to AM per se may not be a crucial factor for CNC word perception in quiet or at 10 dB SNR in postlingually deafened adult CI users. Using electrophysiological or psychophysical results measured at only one electrode location to correlate with speech perception scores in CI users can lead to inaccurate, if not wrong, conclusions.
Keywords: electrically evoked auditory compound action potentials, auditory nerve, amplitude modulation, speech perception
INTRODUCTION
Temporal envelope cues, defined as fluctuations in amplitude over time at rates between 2 Hz and 50 Hz (Rosen, 1992), are crucial for speech perception in cochlear implant (CI) users (e.g., Van Tasell et al., 1987; Rosen et al., 1992; Nie et al., 2006; Luo et al., 2008; Erb et al., 2019). CI users can understand speech based on temporal envelope cues presented in only four channels (Fishman et al., 1997). In current CIs, temporal information, including temporal envelope cues, from the incoming auditory signal is encoded in the amplitude modulation (AM) of pulse trains delivered by the CI (Wilson et al., 1991). Better sensitivity to AM cues up to 100 Hz has been found to significantly correlate with better speech perception outcomes in CI users (e.g., Fu, 2002; Chatterjee & Peng, 2008; De Ruiter et al., 2015; Erb et al., 2019). Perceptual sensitivity to AM cues can be quantified using psychophysical measures of AM detection threshold (AMDT) and AM rate discrimination threshold (AMRDT). AMDT refers to the smallest AM depth at a fixed AM rate that can be detected. AMRDT represents how well two different AM rates can be discriminated at a fixed modulation depth. AMDT and AMRDT measured from the same group of CI listeners are highly correlated (Luo et al., 2008; Chatterjee & Oberzut, 2011). Considerable variations in both AMDT and AMRDT measured at different stimulation sites within individual CI users have been reported in previously published studies (e.g., Landsberger, 2008; Pfingst et al., 2008; Chatterjee & Peng, 2008; Chatterjee & Oberzut, 2011). To date, neurophysiological mechanisms underlying these variations have not been established, which represents a knowledge gap in the field of cochlear implantation.
In the auditory system, temporal cues, especially rapid amplitude changes, are represented in the discharge patterns of the auditory nerve (AN) (Delgutte, 1980; Delgutte et al., 1984; Litvak et al., 2001). The AN encodes AM information based on neural synchronization to the modulated waveform, which is a bottleneck to the central auditory system’s encoding of AM (Joris et al., 2004). In CI users, the physiological status of the AN is an important factor for auditory temporal processing and speech perception outcomes (e.g., Pfingst et al., 2011, 2015; Garadat & Pfingst, 2011; Long et al., 2014; Zhou et al., 2015; He et al., 2018; Skidmore et al., 2021). Therefore, it is possible that the difference in how well the excited AN fibers near different stimulation sites can encode AM cues is a primary factor accounting for within-subject variations in perceptual sensitivity to AM. However, this theoretical possibility has not been tested in previous studies. As a result, the direct connection between AM neural encoding at the AN and perceptual sensitivity to AM cues has not been established in human CI users.
In normal-hearing listeners, results of a simulation study using computational modeling techniques showed that neural encoding of temporal envelope cues at the AN was a primary contributor to speech perception performance measured in both quiet and noise (Swaminathan & Heinz, 2012). Whether such a relationship exists in CI users remains unknown. In contrast to responses elicited by acoustic stimulation, neural responses evoked by electrical stimuli show high synchronization across the excited neurons with relatively narrow dynamic ranges (e.g., van den Honert & Stypulkowski, 1984; Javel et al., 1987; Hartmann & Klinke, 1990). More importantly, degenerated spiral ganglion cells with only central axons can be activated in electric but not in acoustic hearing (van den Honert & Stypulkowski, 1984). Consequently, the results from studies of acoustic hearing cannot be easily generalized to electrical hearing. A better understanding of the relationship between peripheral AM neural encoding and speech perception in CI users is needed.
In human CI users, neural encoding of electrical stimulation at the AN can be assessed using electrophysiological measures of the electrically evoked compound action potential (eCAP). The eCAP represents synchronous responses generated by a group of electrically activated AN fibers. Several studies have evaluated AN neural encoding of AM cues in human CI users by measuring eCAPs elicited by individual pulses of amplitude-modulated pulse trains (e.g., Wilson et al., 1997; Tejani et al., 2017; Riggs et al., 2021). Results of these studies showed that the eCAP to each individual pulse of the AM pulse train varied in amplitude, with smaller amplitudes measured at the valleys and larger amplitudes recorded at the peaks of the AM train. This pattern of the eCAP response generally reflected the periodicity of the modulation waveform. Regardless of the difference in methods used to quantify the strength of AM neural encoding at the AN (a.k.a. the AN sensitivity to AM), results of these studies showed improved AN sensitivity to AM cues at higher AM rates at least up to 1000 Hz (Tejani et al., 2017; Riggs et al., 2021).
In summary, the field currently lacks a good understanding of the underlying neurophysiological mechanisms of variations in perceptual sensitivity to AM cues measured at different stimulation sites within individual CI users, which is one knowledge gap in our field. In addition, the relationship between peripheral AM neural encoding and speech perception in CI users remains unknown, which is another knowledge gap in the field. To address these knowledge gaps, this study investigated the relationship between the AN sensitivity to AM cues, AMRDT measured using psychophysical procedures and speech perception scores in postlingually deafened adult CI users. Specifically, to address the first knowledge gap, psychophysical measures of AMRDTs were obtained and compared for the electrode pair selected for each test ear that showed the largest difference in the AN sensitivity to AM. AMRDT was chosen because the strength (salience) of AM cues has been shown to be an important factor determining AMRDT (Chatterjee & Oberzut, 2011). We hypothesized that the difference in the AN sensitivity to AM cues accounted for the variations in perceptual AM sensitivity measured at different stimulation sites within individual CI users. To address the second knowledge gap, the correlations between the AN sensitivity to AM and speech perception scores measured in quiet and in noise were evaluated. We hypothesized that the AN sensitivity to AM was an important factor for speech perception outcomes in CI users. Overall, reduced AN sensitivity to AM cues was expected to lead to higher AMRDTs and poorer speech perception performance in postlingually deafened adult CI users.
MATERIALS AND METHODS
Study Participants
Study participants included five bilaterally implanted and 13 unilaterally implanted postlingually deafened adult CI users, including nine males and nine females. All 23 implanted ears were tested in this study. For bilaterally implanted study participants, each ear was tested separately. All participants were diagnosed with severe-to-profound sensorineural hearing loss prior to cochlear implantation and used a Cochlear™ Nucleus® device (Cochlear Ltd., Macquarie, NSW, Australia) with full electrode insertion in the test ear(s). All participants were native speakers of American English and scored 26 or higher on the Mini-Mental State Examination (Folstein et al., 1975). Age at implantation of the test ear ranged from 25.6 to 77.71 years (mean: 58.80 yrs, SD: 13.81 yrs). Each participant was tested for multiple sessions. Age at initial testing ranged from 36.79 to 80.80 years (mean: 63.88 yrs, SD: 11.88 yrs).
Table 1 includes detailed demographic information of these participants. The study was approved by the local Biomedical Institutional Review Board (2017H0131). Written, informed consents were obtained from study participants prior to participation. All participants received monetary compensation for participating in this study.
Table 1.
Demographic information and speech perception scores of study participants.
| Subject number | Sex | Ear tested | Etiology | AAI (yrs) | AAIT (yrs) | Internal electrode array | CNC word score in quiet | CNC word score at 10 dB SNR |
|---|---|---|---|---|---|---|---|---|
|
| ||||||||
| A003 | M | L | SHL | 58.85 | 61.79 | CI512 | 82% | 54% |
| A006 | M | L | Meniere’s | 60.67 | 69.02 | CI512 | 82% | 74% |
| A007 | M | R | Unknown | 43.26 | 52.69 | 24RE (CA) | 60% | 46% |
| A008 | F | L | Hereditary | 56.01 | 67.62 | 24RE (CA) | 72% | 76% |
| A008 | F | R | Hereditary | 54.42 | 67.57 | 24RE (CA) | 88% | 70% |
| A009 | F | L | Trauma | 31.48 | 38.01 | 24RE (CA) | 66% | 56% |
| A011 | M | L | Noise | 72.76 | 80.80 | CI512 | 56% | 58% |
| A011 | M | R | Noise | 77.54 | 80.70 | 24RE (CA) | 12% | 24% |
| A019 | F | L | Rubella | 54.63 | 55.36 | 24RE (CA) | 66% | 60% |
| A019 | F | R | Rubella | 44.71 | 54.73 | 24RE (CA) | 88% | 72% |
| A020 | M | R | Trauma | 60.31 | 62.75 | CI522 | 62% | 52% |
| A022 | F | R | Hereditary | 55.41 | 57.64 | CI522 | 52% | 70% |
| A024 | M | R | Hereditary | 25.60 | 36.79 | 24RE (CA) | 96% | 78% |
| A029 | F | R | Hereditary | 48.47 | 59.60 | 24RE (CA) | 82% | 62% |
| A030 | F | R | Unknown | 64.92 | 65.57 | CI532 | 64% | 38% |
| A034 | M | L | Trauma | 70.21 | 70.69 | CI532 | 78% | 66% |
| A034 | M | R | Trauma | 68.67 | 70.43 | CI532 | 60% | 52% |
| A035 | F | L | Noise | 72.38 | 76.62 | CI422 | 72% | 60% |
| A050 | M | R | Noise | 75.18 | 76.74 | CI522 | 74% | 50% |
| A050 | M | L | Noise | 77.71 | 78.36 | CI622 | 70% | 60% |
| A065 | F | L | Unknown | 54.09 | 58.65 | CI532 | 40% | 22% |
| A067 | F | R | SHL | 56.94 | 57.30 | CI622 | 86% | 64% |
| A070 | M | R | Trauma | 68.26 | 69.77 | CI632 | 80% | 64% |
M: male, F: female, L: left, R: right, SHL: sudden hearing loss, AAI: age at implantation, AAIT: age at initial testing, 24RE (CA): Freedom Contour Advance electrode array, CNC: Consonant-Nucleus-Consonant, SNR: signal-to-noise ratio.
Experimental Procedures
Overview
For all 23 ears tested, seven electrodes (typically defaulted to electrodes 3 or 4, 6, 9, 12, 15, 18 and 21) across the electrode array were tested when assessing the AN sensitivity to AM cues using the eCAP. For a subgroup of 16 test ears, AMRDTs were measured at up to five electrode locations where artifact-free eCAPs were recorded, including the electrode pair demonstrating the largest difference in AN sensitivity to AM cues. Electrodes with artifact-free eCAPs and electrodes tested for AMRDT in this study are listed in Table 2. For both eCAP and AMRDT measures, the carrier was a pulse train consisting of cathodic-leading, charge-balanced biphasic pulses with a pulse rate of 2000 pulses per second (pps) per channel. It was sinusoidally amplitude modulated at 20 Hz and was delivered directly to individual CI electrodes in a monopolar-coupled stimulation mode (MP1). This AM rate is within the AM rate range (i.e., 5–100 Hz) that has been found to significantly correlate with Consonant-Nucleus-Consonant (CNC) words scores in CI users (De Ruiter et al., 2015). For each pulse of the pulse train, the pulse phase duration was 25 μs/phase and the inter-phase interval was 7 μs. Speech perception performance was individually evaluated for each test ear.
Table 2.
Electrode locations with artifact-free electrically evoked compound action potentials (eCAPs) and those tested for psychophysical measures of amplitude modulation rate discrimination threshold (AMRDT).
| Subject number | Ear tested | Electrodes with artifact-free eCAPs | Electrodes with AMRDTs |
|---|---|---|---|
|
| |||
| A003 | L | 4, 6, 9, 12, 15, 18 and 21 | 4, 9, 12, 15 and 21 |
| A006 | L | 3, 6, 9, 15 and 18 | 3, 6, 9, 15 and 18 |
| A007 | R | 6, 9, 15, 18 and 21 | 9, 15 and 21 |
| A008 | L | 3, 6, 9, 12, 15, 18 and 21 | 3, 9, 12, 15 and 21 |
| A008 | R | 3, 6, 9, 12, 15, 18 and 21 | 3, 9, 12, 15 and 21 |
| A009 | L | 3, 6, 12, 15, 18 and 21 | 3, 15 and 21 |
| A011 | L | 7, 9, 12, and 21 | |
| A011 | R | 3, 6, 9, 12 and 18 | |
| A019 | L | 6, 9, 12, 15, 18 and 21 | 9 and 15 |
| A019 | R | 3, 6, 9, 12, 15, 18 and 21 | 3, 9, 15 and 21 |
| A020 | R | 4, 6, 15, 18 and 21 | 4, 6, 15, 18 and 21 |
| A022 | R | 3, 6, 9 and 15 | |
| A024 | R | 3, 6, 12, 15, 18 and 21 | 3, 12, 15 and 21 |
| A029 | R | 3, 12, 15 and 21 | 3, 12, 15 and 21 |
| A030 | R | 6, 9, 12, 15, 18 and 21 | 9 and 21 |
| A034 | L | 12, 15, 18 and 21 | 12 and 21 |
| A034 | R | 12, 15, 18 and 21 | 15 and 21 |
| A035 | L | 9, 12, 15 and 21 | 9, 12, 15 and 21 |
| A050 | L | 9, 12, 15, 18 and 21 | |
| A050 | R | 6, 9, 12, 15, 18 and 21 | 9, 12, 15 and 21 |
| A065 | L | 6, 9, 12 and 21 | |
| A067 | R | 12, 15 and 18 | |
| A070 | R | 15, 28 and 21 | |
Dynamic range measures
Behavioral detection threshold (T level) was estimated for each electrode tested for AMRDT using the carrier pulse train presented in a one-up, one-down psychophysical testing paradigm. In this paradigm, two to five pulses were presented to participants and participants were asked to count the number of “beeps” they heard. The stimulation level decreased after each correct response and increased after each incorrect response. The step size used for the first two reversals, the 3rd and 4th reversals and the remaining two reversals was 5, 2 and 1 CL, respectively. The stimulation level reached after 6 reversals was used as the T level.
The maximum comfortable level (i.e., C level) was estimated for each electrode tested in this study using the carrier pulse train presented in an ascending procedure. In this procedure, study participants were asked to use a visual loudness rating scale [scale of 1–10, where 1 is “Barely audible” and 10 is “Very uncomfortable”] to indicate when the sound reached the maximum comfort level (rating of 8). Stimulation was initially presented at a relatively low level and gradually increased in steps of 5 CLs until a loudness rating of 7 was reached. Then, stimulation was increased in steps of 1–2 CLs until a rating of 8 was reached. The dynamic range (DR) was calculated as the difference in CL between T and C levels.
eCAP Measures
eCAP measures were obtained using the Advanced Neural Response Telemetry (NRT) function implemented in the Custom Sound EP (v.5.1, v.5.2 or v.6.0) commercial software (Cochlear Ltd, Macquarie, NSW, Australia). The stimulus was delivered to individual CI electrodes via an N6 sound processor interfaced with a programming pod.
Approaches for measuring eCAPs elicited by individual pulses of an amplitude-modulated pulse train have been reported in detail in our previous study (Riggs et al., 2021). Briefly, the carrier pulse train was sinusoidally amplitude modulated with 100% AM depth between 5 CLs above the eCAP threshold for single pulse stimulation and the behavioral C level measured for the carrier. This sinusoidal amplitude modulation was created using a research patch to NRT provided by Cochlear™ Ltd. The levels of the masker pulses were automatically calculated and set by the NRT software. eCAPs in response to each of the 20 pulses selected over the last two full AM cycles of the amplitude-modulated pulse train were measured using a modified forward-masking technique (He et al., 2017). In this technique, the last pulse of the pulse train was designated as the probe pulse and all pulses prior to it served as the masker pulse train. In addition, eCAPs to single pulses presented at the same levels as those used for the 20 selected pulses in the AM pulse train were recorded.
Amplitudes of eCAPs to pulse-train stimuli rapidly decrease in the first 5–10 ms after stimulus onset, followed by a more gradual decline up to 50 ms before a steady state in amplitude is reached (e.g., Wilson et al., 1997; Adel et al., 2017; Mussoi & Brown, 2019; He et al., 2022a). In addition, eCAP amplitudes to pulse-train stimuli show an alternating pattern as a function of pulse number for the first 30 ms of pulse train stimulation at pulse rates of 400–2400 pps (Wilson et al., 1997; Hughes et al., 2012; He et al., 2016). All of the 20 selected pulses over the last two full AM cycles of the pulse train occurred at or after the first 100 ms of pulse train stimulation. They were selected 1) to assess AM sensitivity of the AN within a practical testing time for human CI users, and 2) to minimize the effect of the alternating eCAP amplitude pattern and neural adaptation on results of this study.
Psychophysical Measures of Amplitude Modulation Rate Discrimination Threshold
The carrier was sinusoidally amplitude modulated with 80% AM depth (re: 50% of the DR measured for the carrier) using the equation in the form of:
| (1) |
Where level is the stimulation level of the pulse in CL, R represents the amount of level roving (details are reported below), f represents the AM rate (in Hz), and t is the time (in seconds) when the pulse occurred within the 500 ms pulse train. The stimuli were created using custom-designed software incorporating Nucleus Interface Communication programming routines (NIC v.4) and were presented in a three-interval, two-alternative, forced-choice paradigm. The duration of each listening interval and the interstimulus interval was 500 ms. Two listening intervals contained pulse trains modulated at 20 Hz, and one listening interval, chosen at random, contained a pulse train modulated at one of eight contrast rates that were higher than 20 Hz. To minimize the potential effect of loudness cue on AMRDT, the stimulation level was randomly roved up and down by up to the amount equal to 10% AM depth in CL. The participant was asked to indicate which interval sounded different exclusively based on pitch. The participant was instructed not to make their selection based on loudness, which was randomly and independently roved for each listening interval. No feedback was provided to the participant.
A training session of 10 trials with the contrast rate set to 28 Hz was performed to familiarize the participant with the testing paradigm, and to verify that the participant could distinguish between 20 and 28 Hz AM rates. If the participant correctly identified the interval with the contrast rate (i.e., 28 Hz) for all 10 trials, the eight contrast rates tested were 21, 22, 23, 24, 25, 26, 27, and 28 Hz. If the participant could not distinguish between the intervals with different AM rates during the initial training session, additional training sessions were performed with increasingly higher contrast rates until the participant correctly identified the interval with the contrast rate for all 10 trials. The eight contrast rates to be tested were then determined based on the final contrast rate tested in the training session. For example, if the participant achieved 100% correct in a training session after the contrast rate was increased to 32 Hz, the eight contrast rates tested were 25, 26, 27, 28, 29, 30, 31 and 32 Hz. The highest contrast rate ranged from 28 to 100 Hz across participants in this study.
After the eight contrast rates were identified, ten trials were presented for each contrast rate, for a total of 80 randomized trials. This process was repeated, resulting in two sets of 80 trials. The percent correct at each contrast rate was averaged across trial sets and then fit with a cumulative normal psychometric function using the equation in the form of:
| (2) |
where P(x1) is the probability of a correct response at a contrast rate of x1 and μ is the contrast rate at which P = .5. This was the same function used in Levitt (1971). Behavioral AMRDT was defined as the rate corresponding to 79.4% correct on the psychometric function, which was the same as what would be measured with a three-down, one-up adaptive procedure (Levitt, 1971).
Speech Perception Measures
Compared with sentence recognition, CNC word recognition relies less on top-down processing and is recommended for assessing speech performance of CI patients (Sladen et al., 2017). As reported before, neural encoding of temporal envelope cues at the AN has been proposed to be a primary contributor to speech perception performance measured in both quiet and noise in acoustic hearing (Swaminathan & Heinz, 2012). Therefore, CNC word lists (Peterson & Lehiste, 1962) were presented not only in quiet but also in speech-shaped noise at a signal-to-noise ratio (SNR) of +10 dB in this study. These two testing conditions are routinely used in clinical practice and have been used in many research studies (e.g., Dorman et al., 2008; Lundberg, et al., 2021). The noise condition with a SNR of 5 dB was not tested to avoid the potential floor effect on study results.
All speech perception testing took place in a double-walled, sound-attenuating booth, using the procedure described in the new Minimum Speech Test Battery (MSTB, 2011). Speech stimuli were presented using recorded materials at 60 dB SPL through a loudspeaker placed at 0° azimuth. For the five participants who are bilateral CI users (A008, A011, A019, A034 and A050), speech perception scores were measured for each test ear separately.
Data Analysis
Custom-designed MATLAB (v.2021a, The Mathworks Inc., United States) software was used to derive eCAPs to individual pulses of the pulse train stimuli, to check for potential electrical-artifact-contamination on the derived eCAP traces (He et al., 2016), and to calculate the AN sensitivity to AM cues for electrode locations with artifact-free eCAPs. In this study, the AN sensitivity to AM cues was quantified by the Modulated Response Amplitude Ratio (MRAR). To obtain the MRAR, the difference in the maximum and the minimum eCAP amplitudes measured for the AM pulse train stimulus (AMamp) and for the single pulse with levels used in AM stimulus (NonAMamp) were calculated. The MRAR was defined as the ratio of AMamp to NonAMamp with greater ratios indicating better sensitivity to AM. This index has been used in our previous study (Riggs et al., 2021). AMRDTs measured for the electrode pair with the largest difference in the MRAR followed normal distributions, as evidenced by the results of Shapiro-Wilk tests (AMRDTs for the electrode locations with the best AN sensitivity to AM: W(16) = 0.921, p = .177; AMRDTs for the electrode locations with the worst AN sensitivity to AM: W(16) = 0.931, p = .248). Therefore, they were compared using a Paired Sample t-test.
Results of previous studies showed substantial inter-patient variations in the amount of neural loss at individual cochlear regions (e.g., Nadol, 1997; Nadol et al., 2012; Long et al., 2014; DeVries et al., 2016; Schvartz-Leyzac & Pfingst, 2016). Based on these findings, it has been proposed that averaging results measured at multiple electrode locations within the cochlea should provide a better representation of overall neural function of the AN than results measured at individual electrode locations (e.g., Tejani et al., 2017; Riggs et al., 2021; He et al., 2022a, 2022b). However, none of these previously published studies directly compared study results obtained by averaging data measured at multiple electrode locations with those generated based on electrode-specific data. Therefore, it remains unknown whether this proposed idea is valid.
In this study, data were analyzed in both ways (i.e., the single-electrode-data approach and the averaged-data approach). In the single-electrode-data approach, three analyses were conducted. First, as part of data exploratory analysis, a series of simulation tests were performed in which MRARs or AMRDTs measured at one electrode location that was randomly selected from all electrode locations tested for each participant were correlated with CNC word scores measured in quiet and in noise. Amplitude modulation sensitivity measured at only one CI electrode location has been used to correlate with speech perception performance in CI users (e.g., Fu, 2002; Chatterjee & Peng, 2008; Luo et al., 2008). However, there is no scientific evidence showing which electrode location should be tested in this approach. This exploratory analysis aimed to test whether using data obtained at different electrode locations would lead to the same result/conclusion. The simulation was done using the built-in MATLAB function randsample (v. 2019b). The simulation was performed 10,000 times to reach the state of convergence (i.e., provided the same result each time when performing multiple tests of 10,000 simulations). Due to the non-normal distribution of CNC word scores measured in noise, as evidenced by the result of a Shapiro-Wilk test (W(16) = 0.886, p = .048), all correlations were assessed using Spearman Rank correlation tests with a confidence level of 95%. The descriptive statistics of the distribution of the 10,000 simulated correlations were then calculated. The fraction of significant correlations was calculated by dividing the number of significant correlations (i.e., p<0.05) by the total number of correlation results (i.e., 10,000). This simulation test was done separately for MRAR and AMRDT results. Second, Linear Mixed Models (LMMs) with a random intercept to account for repeated measurements at different electrode locations within each participant were built using R (v. 4.1.1., R Core Team) to assess the relationship between MRARs/AMRDTs measured at individual electrode locations and CNC word scores measured in quiet and in noise. There were four LMMs built for this study, with each model built to assess the relationship between each AM sensitivity indicator (i.e., MRAR or AMRDT) and CNC scores measured in quiet or in noise. Third, Spearman Rank correlation tests with a confidence level of 95% were used to evaluate the correlation between the variances in MRARs and AMRDTs measured at multiple electrode locations and CNC word scores measured in quiet and in noise.
In the averaged-data approach, MRARs and AMRDTs measured at multiple electrode locations in each participant were averaged together. Spearman Rank correlation tests with a confidence level of 95% were used to assess the correlation between the averaged MRAR/AMRDT and CNC word scores measured in quiet and in noise. These correlation tests were conducted using SPSS Statistic 28 (IBM Corp.).
RESULTS
Figure 1 shows eCAPs evoked by the 10 selected probes occurring in the last AM cycle measured at electrode 12 in one subject (A008). Overall, these eCAPs are relatively artifact-free and demonstrate variations in amplitude that generally follow a sinusoidal function.
Figure 1.

eCAP traces evoked by the ten probe pulses occurring within the last AM cycle of the AM pulse train at electrode 12 in one subject (A008).
AMRDTs Measured for the Electrode Pair with Different MRARs
The upper and lower panel of Figure 2 show MRARs and AMRDTs measured at all electrode locations tested in this study. Overall, these data clearly demonstrate the substantial variations in both variables among CI users. In addition, these data do not show any trend suggesting any potential effect of electrode location on these two variables.
Figure 2.

MRARs (upper panel) and AMRDTs (lower panel) measured at all electrode locations from all study participants tested for each task.
Figure 3 shows AMRDTs measured for the electrode pair with the largest MRAR (i.e., the best AN sensitivity to AM) and the smallest MRAR (i.e., the worst AN sensitivity to AM) in 16 test ears. These data clearly demonstrate substantial variations in AMRDTs measured at two electrode locations within each participant, as well as in the overall trend showing the potential relationship between the MRAR and AMRDT among participants. In six test ears (i.e., A003L, A008L, A008R, A019L, A029R and A050R), AMRDTs measured at the electrode locations with the largest MRARs were smaller than those measured at the electrode locations with the smallest MRARs, which is consistent with our expectation based on study hypothesis. In contrast, data measured in the other nine ears (e.g., A006L, A007R, A009L, A019R, A020R, A030R, A034L, A034R, A035L) showed the opposite trend. Finally, the difference in AMRDTs measured at these two electrode locations in the right ear of A024 is 0.006 Hz, which is substantially smaller than three standard deviations (SD = 0.693 Hz) below the mean of absolute differences between these two electrode pairs (3.639 Hz). Therefore, this difference was determined to be negligible in this study. The results of a Paired Sample t-test showed that there was no statistically significant difference in AMRDTs measured at the electrode pair with different MRARs in these 16 test ears (t = 1.72, p = .107).
Figure 3.

AMRDTs measured at the electrode locations with the largest MRAR and the smallest MRAR in 16 test ears. Each symbol indicates the results measured for one test ear. Results measured in the same test ear are linked by lines.
Results of the Single-Electrode Data Approach
Results of simulation studies
Figures 4 shows the results of 10,000 simulation tests used to assess the correlation between the MRAR measured at one electrode location and CNC word scores. Figure 5 depicts the results of similar simulation tests showing the correlation between AMRDTs and CNC word scores. For CNC word scores measured in quiet, the correlation coefficient ranged from −0.55 to 0.50 for the MRAR and ranged from −0.68 to 0.06 for AMRDT. The percentage of simulation tests that showed a statistically significant result for the MRAR and AMRDT was 0.73% and 15.96%, respectively. For CNC word scores measured at 10 dB SNR, the correlation coefficient ranged from −0.76 to 0.45 for the MRAR and ranged from −0.61 to 0.02 for AMRDT. The percentage of simulation tests that showed a statistically significant result for the MRAR and AMRDT was 14.61% and 4.66%, respectively. Details of these results are listed in Table 3.
Figure 4.
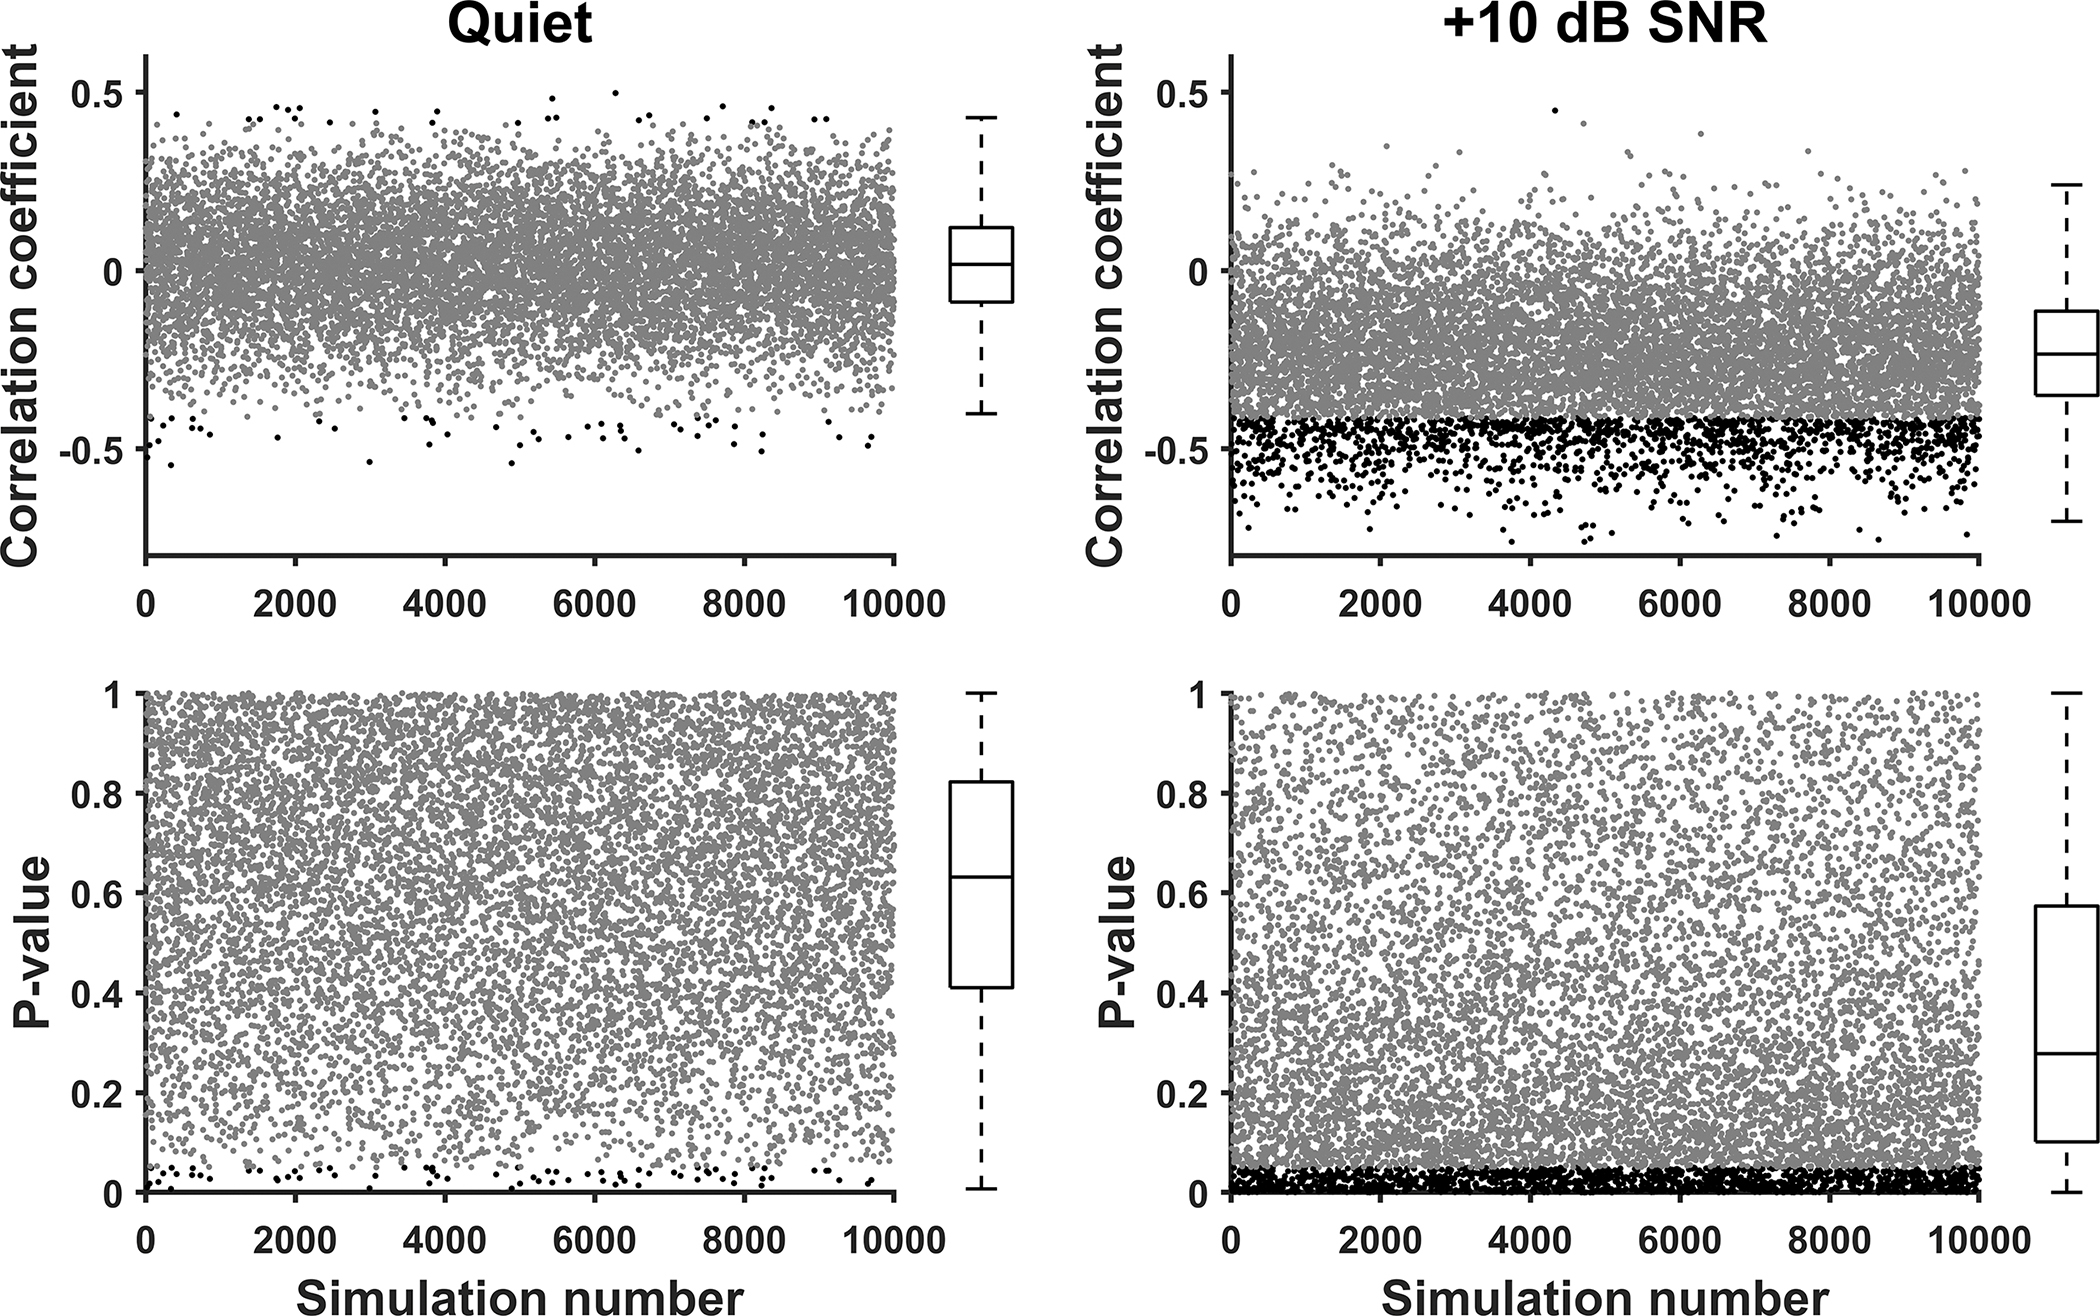
Results of 10,000 simulation tests evaluating the correlation between the MRAR measured at one electrode location and CNC word scores measured in quiet (left panels) and in noise (right panels). Values of Spearman Rank correlation coefficients obtained for these simulations are shown in the top row. Corresponding p values are listed in the bottom row. Each dot indicates the result of one simulation in all panels. Statistically significant results are indicated in black and nonsignificant results are indicated in grey. The box listed at the right side of each panel represents the 25th and 75th percentile. Whiskers represent the 10th and 90th percentiles. Medians are represented by the horizontal lines within the boxes.
Figure 5.

Results of 10,000 simulation tests evaluating the correlation between AMRDT measured at one electrode location and CNC word scores measured in quiet (left panels) and in noise (right panels). Values of Spearman Rank correlation coefficients obtained for these simulations are shown in the top row. Corresponding p values are listed in the bottom row. Each dot indicates the result of one simulation in all panels. Statistically significant results are indicated in black and nonsignificant results are indicated in grey. The box listed at the right side of each panel represents the 25th and 75th percentile. Whiskers represent the 10th and 90th percentiles. Medians are represented by the horizontal lines within the boxes.
Table 3.
The ranges (means, standard deviations) of Spearman Rank correlation coefficients (rs) and p values, as well as the percentage of p values that were statistically significant (%p<.05) for simulation results assessing the correlation between Consonant-Nucleus-Consonant (CNC) word scores and the Modulated Response Amplitude Ratio (MRAR) or Amplitude Modulation Rate Discrimination Threshold (AMRDT).
| CNC word scores in quiet |
CNC word scores in noise |
|||||
|---|---|---|---|---|---|---|
| ρ | p | %p<.05 | ρ | p | %p<.05 | |
|
| ||||||
| MRAR | −0.55 – 0.50 (0.01, 0.15) | <.01 – 1.00 (.61, .25) | 0.73 | −0.76 – 0.45 (−0.23, 0.17) | <.01 – 1.00 (.35, .29) | 14.61 |
|
| ||||||
| AMRDT | −0.68 – 0.06 (−0.40, 0.10) | <.01 – .84(.16, .11) | 15.96 | −0.61 – 0.02 (−0.34, 0.09) | .01 – 0.95(.22, .14) | 4.66 |
Results of LMMs
Details of LMMs results are listed in Table 4. Overall, these results showed that there was no statistically significant correlation between MRARs measured at individual electrode locations and CNC word scores measured in quiet (t = −0.19, p= .85) or in noise (t = −1.98, p=.06). Similar, AMRDTs measured at individual electrode locations were not significantly correlated with CNC word scores measured in quiet (t = −1.50, p=.16) or in noise (t = −1.53, p=.15).
Table 4.
The results of Linear Mixed Models.
| CNC word scores | Sensitivity to AM | Coefficient (95% confidence interval) | Standard Error | t | p |
|---|---|---|---|---|---|
| Scores measured in quiet | MRAR | 0.000 (−0.003, 0.003) | 0.002 | −0.190 | .853 |
| AMRDT | −0.211 (−0.514, 0.092) | 0.141 | −1.50 | .157 | |
| Scores measured at 10 dB SNR | MRAR | −0.003 (−0.007, 0.000) | 0.002 | −1.98 | .061 |
| AMRDT | −0.216 (−0.519, 0.087) | 0.141 | −1.53 | .149 |
CNC: consonant-nucleus-consonant, SNR: signal to noise ratio, AM: amplitude modulation, MRAR: modulated response amplitude ratio, AMRDT: amplitude modulation rate discrimination threshold.
Variance in the MRAR/AMRDT vs CNC word scores measured in quiet and in noise
The left and the right panel of Figure 6 show the relationship between the variance in the MRAR and CNC word scores measured in quiet and at 10 dB SNR, respectively. The left and the right panel of Figure 7 show the relationship between the variance in AMRDT and CNC word scores measured in quiet and at 10 dB SNR, respectively. Data shown in all panels in both figures do not suggest any potential correlation between these variables. This observation is confirmed by the nonsignificant results of Spearman Rank correlation tests.
Figure 6.

CNC word scores measured in quiet (left panel) and in noise (right panel) plotted as a function of variance in MRARs measured at different electrode locations for each participant. Each dot represents the result measured in one test ear. Results of Spearman Rank correlation tests are listed in the lower, right corners of these panels.
Figure 7.
CNC word scores measured in quiet (left panel) and in noise (right panel) plotted as a function of variance in AMRDTs measured at different electrode locations for each participant. Each dot represents the result measured in one test ear. Results of Spearman Rank correlation tests are listed in the lower, right corners of these panels.
Results of the Averaged-Data Approach
CNC word scores measured in quiet and in noise for each participant are listed in Table 1. Figure 8 shows the relationship between averaged MRARs and CNC word scores measured in quiet (left panel) and at 10 dB SNR (right panel). Overall, these data do not demonstrate any trend suggesting a potential relationship between these parameters. This observation is supported by the non-significant results of Spearman Rank correlation tests which are shown in each panel.
Figure 8.

CNC word scores measured in quiet (left panel) and in noise (right panel) plotted as a function of the averaged MRAR. Each dot represents the result measured in one test ear. Results of Spearman Rank correlation tests are listed in the lower, right corners of these panels.
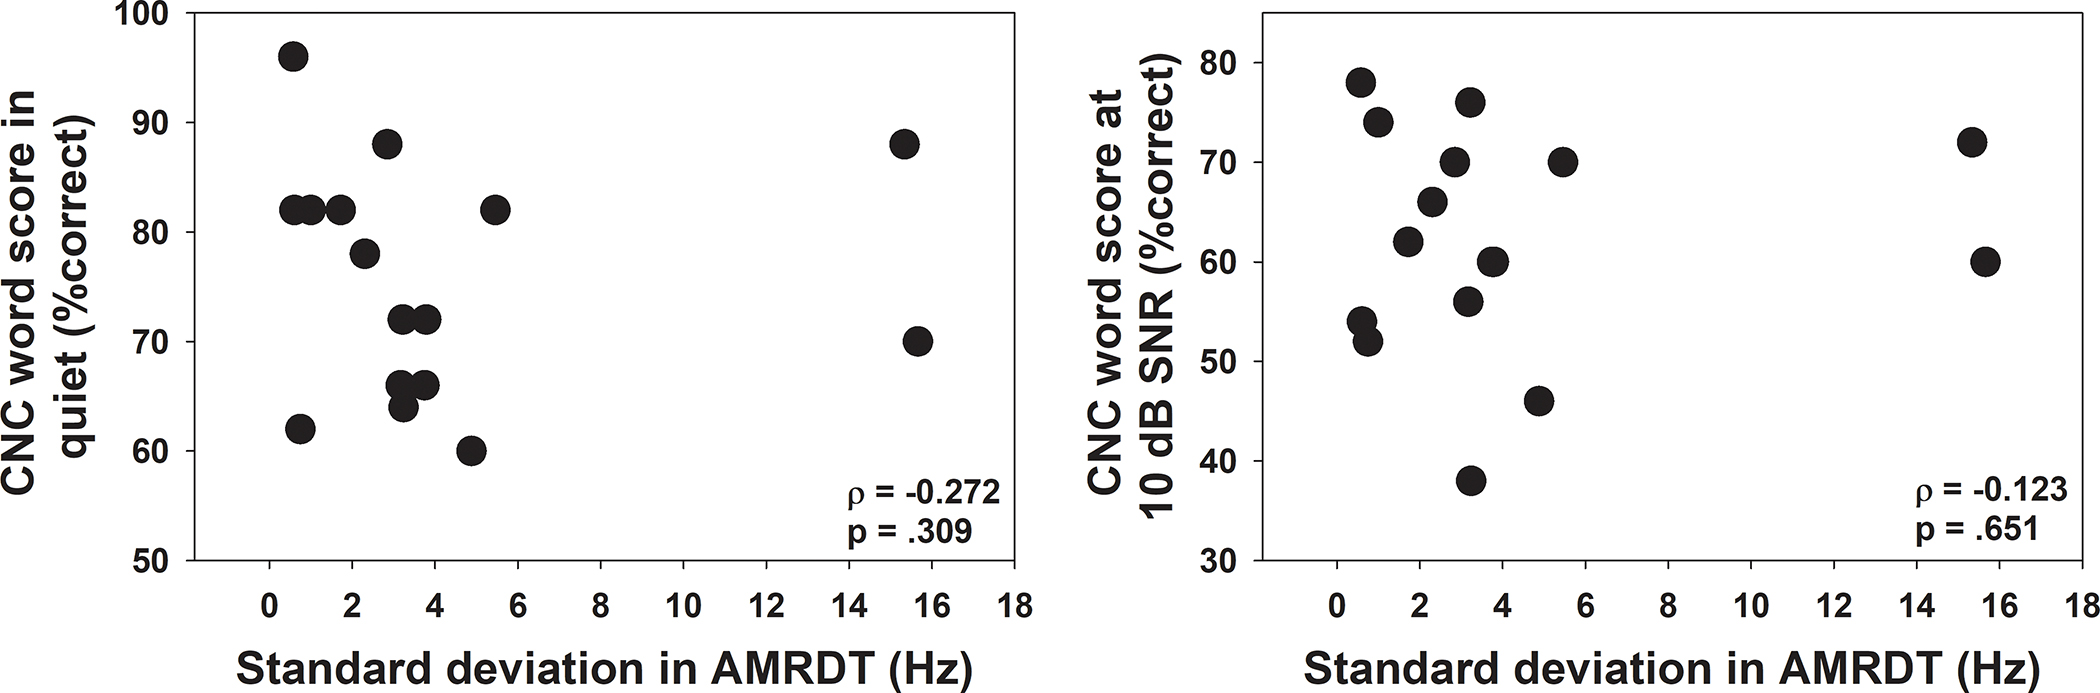
The correlations between the averaged AMRDTs and CNC word scores measured in quiet and in noise were also evaluated. CNC word scores plotted as a function of the averaged AMRDTs are shown in Figure 9. These data suggest a negative relationship between AMRDTs and CNC word scores measured in quiet (left panel) and in noise (right panel). However, these trends are not statistically significant, as evidenced by the results of Spearman Rank correlation tests.
Figure 9.

CNC word scores measured in quiet (left panel) and in noise (right panel) plotted as a function of the averaged AMRDT. Each dot represents the result measured in one test ear. Results of Spearman Rank correlation tests are listed in the lower, right corners of these panels.
DISCUSSION
This study aimed to test two hypotheses: 1) the difference in the AN sensitivity to AM cues accounts for the variations in perceptual AM sensitivity measured at different stimulation sites within individual CI users, and 2) the AN sensitivity to AM is an important factor for speech perception outcomes in CI users. Results of this study did not show any relationship between AM neural encoding at the AN and perceptual sensitivity to AM cues, as evidenced by the lack of association between the MRAR and AMRDT (Figure 3). Consistent with the results reported in previously published studies (e.g., Landsberger, 2008; Pfingst et al., 2008; Chatterjee & Peng, 2008; Chatterjee & Oberzut, 2011), our results also showed substantial variations in AMRDTs among CI users (Figure 2), as well as within-subject variation in AMRDTs measured at two electrode locations (Figure 3). This within-subject variation is unlikely to be due to factors related to cognitive function because it was based on a within-subject comparison. These results suggested that the variation in AMRDTs measured at different electrode locations within individual CI users is not due to the difference in the AN sensitivity to AM cues. Results of both data analyzing approaches consistently showed a nonsignificant correlation between the AN sensitivity to AM cues and speech perception scores (Table 4, Figures 6 and 8), which suggested that AM neural encoding at the AN might not be a crucial factor for CNC word scores measured in quiet or at 10 dB SNR in postlingually deafened CI users. Overall, these results failed to support the two hypotheses proposed for this study.
Peripheral and Psychophysical Measures of Sensitivity to Amplitude Modulation
Tejani et al. (2017) investigated the association between electrophysiological measures of neural encoding of AM at the AN and psychophysical measures of AMDT in eight postlingually deafened adult CI users. In their study, the neural encoding of AM at the AN was evaluated using the same method as that used in the present study except that the AN sensitivity to AM was quantified using the modulated response amplitude (MRA). The MRA was defined as the difference between the maximal and the minimal eCAP response amplitude for each modulation cycle. The relationship between the MRA and AMDT were evaluated at AM rates of 125, 250, 500 and 1000 Hz. They found statistically significant correlations between these parameters at AM rates of 250 and 500 Hz. In contrast, our results (Figure 3) clearly showed the lack of association between neural encoding of AM at the AN and perceptual sensitivity to the difference in AM rate (i.e., AMRDT). It should be pointed out that Tejani et al. (2017) treated results measured at different electrode locations within individual participants as independent measures in correlation analyses. Using the same practice, MRARs or AMDTs measured at all electrode locations in our study were grouped together. Their association was assessed using Spearman Correlation test. The result showed a nonsignificant correlation between these two measures (ρ = 0.093, p = .474). Therefore, the discrepancy between results of these two studies was not due to the difference in data analysis.
Despite the reported high correlation between AMDT and AMRDT in CI users (Luo et al., 2008; Chatterjee & Oberzut, 2011), results of the present study and those reported in Tejani et al. (2017) do not necessarily contradict each other due to the following two reasons. First, AM rates tested in Tejani et al. (2017) were much higher than the 20 Hz assessed in the present study. Even though significant results were found for data measured at AM rates of 250 and 500 Hz in Tejani et al. (2017), results measured at 125 Hz were not statistically significant, presumably due to a potential ceiling effect on AMDT at this relatively low AM rate. We speculated that similar or larger ceiling effects on AMDT should be expected at lower AM rates, which should lead to similar, non-significant results between these two measures. Second, the MRA used in Tejani et al. (2017) is the actual amplitude difference between the smallest and the largest eCAP response evoked by the pulses occurring within an AM cycle. As a result, it is affected by factors that influence the eCAP amplitude but do not impact the capability of the AN to encode the AM (e.g., electrode impedance). The significant correlation between the slope of the eCAP input/output function and AMDT reported in Tejani et al. (2017) aligns with this explanation. In comparison, the MRAR was used in this study to quantify the AN sensitivity to AM cues. It was defined as the ratio between the amplitude differences of eCAPs measured for the single pulse and that for pulse train stimulation. Therefore, it minimized the effects of factors that affect the eCAP amplitude and provided information primarily reflecting the AN sensitivity to AM cues per se.
Association with Speech Perception Performance
Results of this study showed a lack of association between the AN sensitivity to AM and CNC word scores measured in quiet or at 10 dB SNR. This null finding is not consistent with that reported in Swaminathan & Heinz (2012), which supports the notion that results from studies of acoustic hearing should not be simply generalized to electrical hearing. On one hand, this null finding is not completely surprising given the fact that speech perception requires the involvement of central auditory processes and cognitive function in addition to neural processes at the AN. On the other hand, this null finding does not eliminate the potential importance of faithful neural encoding of auditory information at the AN to speech perception, especially in complex listening conditions (e.g., Fitzpatrick et al., 2014; Canfarotta et al., 2021; Walia et al., 2022). It is possible that speech perception requires a minimal amount of auditory information to be encoded and transmitted by the AN, with higher minimal amount of auditory information required for more complex listening conditions. Poor speech perception performance is expected if the AN fails to transmit this minimal amount of information to higher auditory neural structures. Once this minimal threshold is crossed, central auditory processes and cognitive function may play more dominant roles than neural encoding at the AN. Thus, variation in AM coding may be necessary but not sufficient to explain the variance in speech perception outcomes. Chatterjee & Peng (2008) had arrived at a similar conclusion based on their finding of a nonlinear relationship between AM sensitivity and listeners’ performance in a speech intonation detection task. Further studies including more participants who received limited benefit from their CIs are warranted to test this possibility.
Although not a focus of the present study, the relationship between AMRDTs and CNC word scores was also assessed based on data measured at individual electrode locations and the AMRDT averaged across multiple electrode locations for each participant. Results of both data analyzing approaches showed a nonsignificant correlation between AMRDTs and CNC word scores measured both in quiet and at 10 dB SNR (Table 4, Figure 7 and 9). These results are not consistent with the significantly negative correlation between AMRDTs and speech recognition scores reported in Luo et al. (2008) and Erb et al. (2019). Factors accounting for this discrepancy are not entirely clear. However, two major differences in approaches used in these studies should be noted, which might have partially contributed to the difference in results among studies. First, the AM rates tested in these three studies are different [i.e., 4 Hz in Erb et al. (2019), 20 Hz in the present study, and 50 and 100 Hz in Luo et al. (2008)]. It has been shown that the low-frequency temporal information around 3–5 Hz is most important for speech perception (Drullman et al., 1994; Elliott & Theunissen, 2009; Giraud & Poeppel, 20102; Ding et al., 2017). Measuring AMRDT at a higher rate (i.e., 20 Hz) might account for the null finding between AMRDTs and CNC word scores of the present study. However, this could not explain the significant results reported in Luo et al. (2008) in which AMRDTs were measured at 50 and 100 Hz or the significant correlation between CNC word scores and AMDTs for up to 100 Hz reported in De Ruiter et al. (2015). The difference in AMRDTs measured at different AM rates might have contributed to differences in study results. Specifically, AMRDT has been shown to improve as AM increases up to a cutoff frequency and deteriorate afterwards (Chatterjee & Peng, 2008; Chatterjee & Oberzut, 2011). Chatterjee & Oberzut (2011) observed this cutoff AM frequency at 100 Hz. Another difference was that Luo et al. (2008) applied a smaller AM depth of 50% and averaged results across lower and higher carrier levels. Fu (2002) had noted that averaging AM detection thresholds across the dynamic range provided a measure that was significantly correlated to speech perception outcomes in CI patients. In this study, we maintained a fixed carrier level but applied a larger modulation depth of 80%, which would effectively sample neural responses at lower and higher amplitudes within a single AM cycle. These methodological differences could have accounted for the contrasting findings across studies. Second, stimulation presentation methods which affected the activation site within the cochlea are dramatically different across studies. While AMRDT was measured using stimuli presented through the clinical sound processor in Erb et al. (2019) which activated the entire cochlea, it was measured at specific electrode locations using direct-in stimulation in the present study and Luo et al. (2008). In addition, AMRDTs were only measured at one electrode location in Luo et al. (2008), which could lead to inaccurate conclusions based on the results of our simulation tests (discussed in detail below).
Site-specific Results vs Results Averaged Across Multiple Electrode Locations
An interesting finding of this study was that the correlation between psychophysical/electrophysiological result measured at only one CI electrode location and speech perception scores can be dependent on electrode locations tested within the cochlea and is not always consistent. This finding suggests that caution needs to be paid when using data measured at only one electrode location to correlate with speech perception scores in CI users, especially for psychophysical results. In addition, this finding suggests the importance of obtaining results of different measures by using the same presentation method when conducting correlation studies. If it is not feasible due to the precise manipulation of stimuli required for some experiments, using results measured at multiple electrodes across the electrode array for each CI participant could cause less error than using data measured at only one electrode and, therefore, is preferred. However, it remains unknown how many electrode locations per participant are needed to minimize this potential error when conducting correlation studies involving speech perception outcomes in CI users. To answer this question, future studies comparing results measured using sound-field presentation with the results measured using direct-in stimulation at different numbers of electrode locations in the same group of CI users are needed.
Potential Study Limitations
This study has several limitations. First, only 18 participants were tested in this study and both ears were tested in five participants with bilateral CIs. This small sample size, along with the potential lack of independence between results measured from the two ears of the same participant and the potential ceiling effect on MRARs and AMRDTs due to the relatively good speech performance from many study participants, might have affected results of this study. Second, the number of electrode locations tested per participant might not sufficiently represent overall auditory function for individual participants. Its effect on the study results remains unknown at this point due to the lack of knowledge with regards to the minimal number of electrode locations per participant that need to be tested when correlating to speech perception scores. Finally, the inconsistency in electrode tested for psychophysical measures of AMRDT among participants might be one potential study limitation. However, results of previous studies indicated that the electrode location did not influence listener’s temporal coding in a consistent manner (Middlebrooks & Snyder, 2010; Chatterjee & Oberzut, 2011). Therefore, the inconsistency in electrode tested in this study on AMRDT results should be negligible.
CONCLUSIONS
The difference in AN sensitivity to AM cues is not the primary factor accounting for the variation in AMRDTs measured at different stimulation sites within individual CI users. The AN sensitivity to AM may not be a crucial factor for CNC word perception in quiet and at 10 dB SNR for postlingually deafened adult CI users. Further studies are warranted to fully understand the role of AN sensitivity to AM cues in understanding speech in complex listening conditions. Using electrophysiological and psychophysical results measured at only one electrode location to correlate with speech perception performance in CI users can potentially lead to inaccurate, if not wrong, conclusions.
ACKNOWLEDGMENTS
This work was supported by an R01 grant from NIDCD and NIGMS (1R01DC016038). We gratefully thank all study participants for participating in this study.
Footnotes
Conflict of Interest: None.
REFERENCES
- Adel Y, Hilkhuysen G, Noreňa A, et al. (2017). Forward masking in cochlear implant users: electrophysiological and psychophysical data using pulse train masker. J Assoc Res Otolaryngol, 18, 495–512. [DOI] [PMC free article] [PubMed] [Google Scholar]
- Canfarotta MW, O’Connell BP, Giardina CK, et al. (2021). Relationship between electrocochleography, angular insertion depth, and cochlear implant speech perception outcomes. Ear Hear, 42, 941–948. [DOI] [PMC free article] [PubMed] [Google Scholar]
- Chatterjee M, & Oberzut C (2011). Detection and rate discrimination of amplitude modulation in electrical hearing. J Acoust Soc Am, 130, 1567–1580. [DOI] [PMC free article] [PubMed] [Google Scholar]
- Chatterjee M, & Peng SC (2008). Processing F0 with cochlear implants: modulation frequency discrimination and speech intonation recognition. Hear Res, 235, 143–156. [DOI] [PMC free article] [PubMed] [Google Scholar]
- Delgutte B (1980). Representation of speech-like sounds in the discharge patterns of auditory-nerve fibers. J Acoust Soc Am, 68, 843–857. [DOI] [PubMed] [Google Scholar]
- Delgutte B, & Kiang NY (1984). Speech coding in the auditory nerve: IV. Sounds with consonant-like dynamic characteristics. J Acoust Soc Am, 75, 897–907. [DOI] [PubMed] [Google Scholar]
- DeVries L, Scheperle R, & Bierer JA (2016). Assessing the electro-neuron interface with the electrically evoked compound action potential, electrode position, and behavioral thresholds. J Assoc Res Otolaryngol, 17, 237–252. [DOI] [PMC free article] [PubMed] [Google Scholar]
- De Ruiter AM, Debruyne JA, Chenault MN, et al. (2015). Amplitude modulation detection and speech recognition in late-implanted prelingually and postlingually deafened adult cochlear implant users. Ear Hear, 36, 557–566. [DOI] [PubMed] [Google Scholar]
- Ding N, Patel AD, Chen L, et al. (2017). Temporal modulations in speech and music. Neurosci Biobehav Rev, 81, 181–187. [DOI] [PubMed] [Google Scholar]
- Dorman MF, Gifford RH, Spahr AJ, et al. (2008). The benefits of combining acoustic and electric stimulation for the recognition of speech, voice and melodies. Audiol Neurotol, 13, 105–112. [DOI] [PMC free article] [PubMed] [Google Scholar]
- Drullman R, Festen JM, & Plomp R (1994). Effect of reducing slow temporal modulations on speech perception. J Acoust Soc Am, 95, 2670–2680. [DOI] [PubMed] [Google Scholar]
- Elliott TM, & Theunissen FE (2009). The modulation transfer function for speech intelligibility. PloS Comput Biol, 5, e1000302. [DOI] [PMC free article] [PubMed] [Google Scholar]
- Erb J, Ludwig AA, Kunke D, et al. (2019). Temporal sensitivity measured shortly after cochlear implantation predicts 6-month speech recognition outcome. Ear Hear, 40, 27–33. [DOI] [PubMed] [Google Scholar]
- Fishman KE, Shannon RV, & Slattery WH (1997). Speech recognition as a function of the number of electrodes used in the SPEAK cochlear implant speech processor. J Speech Lang Hear Res, 40, 1201–1215. [DOI] [PubMed] [Google Scholar]
- Fitzpatrick DC, Campbell AT, Choudhury B, et al. (2014). Round window electrocochleography just before cochlear implantation: relationship to word recognition outcomes in adults. Otol Neurotol, 35, 64–71. [DOI] [PMC free article] [PubMed] [Google Scholar]
- Folstein MF, Folstein SE, & McHugh PR (1975). Mini-mental state: a practical method for grading the cognitive state of patients for the clinician. J Psychiat Res, 12, 189–198. [DOI] [PubMed] [Google Scholar]
- Fu Q-J (2002). Temporal processing and speech recognition by cochlear implant users. Neuroreport, 13, 1635–1639. [DOI] [PubMed] [Google Scholar]
- Garadat SN, & Pfingst BE (2011). Relationship between gap detection thresholds and loudness in cochlear implant users. Hear Res, 275, 130–138. [DOI] [PMC free article] [PubMed] [Google Scholar]
- Giraud AL, & Poeppel D (2012). Cortical oscillations and speech processing: emerging computational principles and operations. Nat Neurosci, 15, 511–517. [DOI] [PMC free article] [PubMed] [Google Scholar]
- Hartmann R, & Klinke R (1990). Impulse patterns of auditory nerve fibers to extra- and intracochlear electrical stimulation. Acta Otolaryngol, 469 (Suppl), 128–134. [PubMed] [Google Scholar]
- He S, Abbas PJ, Doyle DV, et al. (2016). Temporal response properties of the auditory nerve in implanted children with auditory neuropathy spectrum disorder and implanted children with sensorineural hearing loss. Ear Hear, 37, 397–411. [DOI] [PMC free article] [PubMed] [Google Scholar]
- He S, Shahsavarani BS, McFayden TC, et al. (2018). Responsiveness of the electrically stimulated cochlear nerve in children with cochlear nerve deficiency. Ear Hear, 39, 238–250. [DOI] [PMC free article] [PubMed] [Google Scholar]
- He S, Skidmore J, Conroy S, et al. (2022a). Neural adaptation of the electrically-stimulated auditory nerve is not affected by advanced age in postlingually deafened, middle-aged and elderly adult cochlear implant users. Ear Hear, January 3 (Epub ahead of print). [DOI] [PMC free article] [PubMed] [Google Scholar]
- He S, Skidmore J, & Carter B (2022b). Characteristics of the adaptation recovery function of the auditory nerve and its association with advanced age in postlingually deafened adult cochlear implant users. Ear Hear, January 17 (Epub ahead of print). [DOI] [PMC free article] [PubMed] [Google Scholar]
- He S, Teagle HFB, & Buchman CA (2017). The electrically evoked compound action potential: from laboratory to clinic. Front Neurosci, 11:339. [DOI] [PMC free article] [PubMed] [Google Scholar]
- Hughes ML, Castioni EE, Goehring JL, et al. (2012). Temporal response properties of the auditory nerve: data from human cochlear-implant recipients. Hear Res, 285, 46–57. [DOI] [PMC free article] [PubMed] [Google Scholar]
- Javel E, Tong YC, Shepherd RK, et al. (1987). Responses of cat auditory nerve fibers to biphasic electrical current pulses. Ann Otol Rhinol Laryngol, 96, 26–30.3813382 [Google Scholar]
- Joris PX, Schreiner CE, & Rees A (2004). Neural processing of amplitude-modulated sounds. Physiol Rev, 84, 541–577. [DOI] [PubMed] [Google Scholar]
- Landsberger DM (2008). Effects of modulation wave shape on modulation frequency discrimination with electrical hearing. J Acoust Soc Am, 124, EL21–27. [DOI] [PMC free article] [PubMed] [Google Scholar]
- Levitt H (1971). Transformed up-down methods in psychoacoustics. J Acoust Soc Am, 49, 467–477. [PubMed] [Google Scholar]
- Litvak L, Delgutte B, & Eddington D (2001). Auditory nerve fiber responses to electric stimulation: modulated and unmodulated pulse trains. J Acoust Soc Am, 110, 368–379. [DOI] [PMC free article] [PubMed] [Google Scholar]
- Long CJ, Holden TA, McClelland GH, et al. (2014). Examining the electro-neural interface of cochlear implant users using psychophysics, CT scans, and speech understanding. J Assoc Res Otolaryngol, 15, 293–304. [DOI] [PMC free article] [PubMed] [Google Scholar]
- Luo X, Fu Q-J, Wei C-G, et al. (2008). Speech recognition and temporal amplitude modulation processing by Mandarin-speaking cochlear implant users. Ear Hear, 29, 957–970. [DOI] [PMC free article] [PubMed] [Google Scholar]
- Lundberg EMH, Strong D, Anderson M, et al. (2021). Do patients benefit from a cochlear implant when they quality only in the presence of background noise? Otol Neurotol, 42, 251–259. [DOI] [PMC free article] [PubMed] [Google Scholar]
- Middlebrooks JC, & Snyder RL (2010). Selective electrical stimulation of the auditory nerve activates a pathway specialized for high temporal acuity. J Neurosci, 30, 1937–1946. [DOI] [PMC free article] [PubMed] [Google Scholar]
- Mussoi BSS, & Brown CJ (2019). Age-related changes in temporal resolution revisited: electrophysiological and behavioral findings from cochlear implant users. Ear Hear, 40, 1328–1344. [DOI] [PMC free article] [PubMed] [Google Scholar]
- Nadol JB (1997). Patterns of neural degeneration in the human cochlea and auditory nerve: implications for cochlear implantation. Otolaryngol Head Neck Surg, 117, 220–228. [DOI] [PubMed] [Google Scholar]
- Nadol JB, Adams JC, and O’Malley JT (2012). Temporal bone histopathology in a case of sensorineural hearing loss caused by superficial siderosis of the central nervous system and treated by cochlear implantation. Otol Neurotol, 32, 748–755. [DOI] [PMC free article] [PubMed] [Google Scholar]
- Nie K, Barco A, & Zeng F-G (2006). Spectral and temporal cues in cochlear implant speech perception. Ear Hear, 27, 208–217. [DOI] [PubMed] [Google Scholar]
- Peterson GE, & Lehiste I (1962). Revised CNC lists for auditory tests. J Speech Hear Disord, 27, 62–70. [DOI] [PubMed] [Google Scholar]
- Pfingst BE, Burkholder-Juhasz RA, Xu L, et al. (2008). Across-site patterns of modulation detection in listeners with cochlear implants. J Acoust Soc Am, 123, 1054–1062. [DOI] [PMC free article] [PubMed] [Google Scholar]
- Pfingst BE, Colesa DJ, Hembrador S, et al. (2011). Detection of pulse trains in the electrically stimulated cochlea: effects of cochlear health. J Acoust Soc Am, 130, 3954–3968. [DOI] [PMC free article] [PubMed] [Google Scholar]
- Pfingst BE, Zhou N, Colesa DJ, et al. (2015). Importance of cochlear health for implant function. Hear Res, 322, 77–88. [DOI] [PMC free article] [PubMed] [Google Scholar]
- Riggs WJ, Vaughan C, Skidmore J, et al. (2021). The sensitivity of the electrically stimulated auditory nerve to amplitude modulation cues declines with advanced age. Ear Hear, 42, 1358–1372. [DOI] [PMC free article] [PubMed] [Google Scholar]
- Rosen S (1992). Temporal information in speech: acoustic auditory and linguistic aspects. Philos Trans Roy Soc Lond B Biol Sci, 336, 367–373. [DOI] [PubMed] [Google Scholar]
- Schvartz-Leyzac KC, & Pfingst BE (2016). Across-site patterns of electrically evoked compound action potential amplitude-growth functions in multichannel cochlear implant recipients and the effects of the interphase gap. Hear Res, 341, 50–65. [DOI] [PMC free article] [PubMed] [Google Scholar]
- Shannon RV, Zeng F-G, Kamath V, et al. (1995). Speech recognition with primarily temporal cues. Science, 270, 303–304. [DOI] [PubMed] [Google Scholar]
- Skidmore J, Xu L, Chao X, et al. (2021). Prediction of the functional status of the cochlear nerve in individual cochlear implant users using machine learning and electrophysiological measures. Ear Hear, 42, 180–192. [DOI] [PMC free article] [PubMed] [Google Scholar]
- Swaminathan J, & Heinz MG (2012). Psychophysiological analyses demonstrate the importance of neural envelope coding for speech perception in noise. J Neurosci, 32, 1747–1756. [DOI] [PMC free article] [PubMed] [Google Scholar]
- Tejani VD, Abbas PJ, & Brown CJ (2017). Relationship Between Peripheral and Psychophysical Measures of Amplitude Modulation Detection in Cochlear Implant Users. Ear Hear, 38, e268–e284. [DOI] [PMC free article] [PubMed] [Google Scholar]
- van den Honert C, & Stypulkowski PH (1984). Physiological properties of the electrically stimulated auditory nerve. II. Single fiber recordings. Hear Res, 14, 225–243. [DOI] [PubMed] [Google Scholar]
- van Tasell DJ, Soli SD, Kirby VM, et al. (1987). Speech waveform envelope cues for consonant recognition. J Acoust Soc Am, 82, 1152–1161. [DOI] [PubMed] [Google Scholar]
- Walia A, Shew MA, Kallogjeri D, et al. (2022). Electrocochleography and cognition are important predictors of speech perception outcomes in noise for cochlear implant recipients. Sci Rep, 12, 3083. [DOI] [PMC free article] [PubMed] [Google Scholar]
- Wilson BS, Finley CC, Lawson DT, et al. (1991). Better speech recognition with cochlear implants. Nature, 352, 236–238. [DOI] [PubMed] [Google Scholar]
- Wilson BS, Finley CC, Lawson DT, et al. (1997). Temporal representations with cochlear implants. Am J Otol, 18, S30–34. [PubMed] [Google Scholar]
- Zhou N, Kraft CT, Colesa DJ, et al. (2015). Integration of pulse trains in human and guinea pigs with cochlear implants. J Assoc Res Otolaryngol, 16, 523–534. [DOI] [PMC free article] [PubMed] [Google Scholar]