

Abstract
High-grade serous ovarian cancer (HGSOC) is the most lethal gynecologic malignancy in women. Its low survival rate is attributed to late detection, relapse, and drug resistance. The lack of effective second-line therapeutics remains a significant challenge. There is an opportunity to incorporate the use of histone deacetylase inhibitors (HDACi) into HGSOC treatment. However, the mechanism and efficacy of HDACi in the context of BRCA-1/2 mutation status is understudied. Therefore, we set out to elucidate how HDACi perturb the proteomic landscape within HGSOC cells. In this work, we used TMT labeling followed by data-dependent acquisition LC-MS/MS to quantitatively determine differences in the global proteomic landscape across HDACi-treated CAOV3, OVCAR3, and COV318 (BRCA-1/2 wildtype) HGSOC cells. We identified significant differences in the HDACi-induced perturbations of global protein regulation across CAOV3, OVCAR3, and COV318 cells. The HDACi Vorinostat and Romidepsin were identified as being the least and most effective in inhibiting HDAC activity across the three cell lines, respectively. Our results provide a justification for the further investigation of the functional mechanisms associated with the differential efficacy of FDA-approved HDACi within the context of HGSOC. This will enhance the efficacy of targeted HGSOC therapeutic treatment modalities that include HDACi.
Keywords: histone deacetylase inhibitor (HDACi); mass spectrometry, tandem mass tags (TMT); high-grade serous ovarian cancer (HGSOC)
1 |. INTRODUCTION
Ovarian cancer is the most lethal gynecologic malignancy among women and the fifth leading cause of death from cancer among women [1]. This devastating malignancy impacts almost 300,000 women each year [2]. Ovarian cancer is a broad term encompassing a myriad of diseases with distinct prognoses and molecular features [3]. There are four types of ovarian cancer based on their tissue of origin: epithelial, sex-cord, stromal, and endometrioid [4]. Epithelial ovarian cancer comprises approximately 90% of all cases and is further subdivided based on histology. The high-grade serous subtype is the most aggressive and, consequently, is responsible for most ovarian cancer deaths [5].
Although the prognosis for many solid tumor cancers has improved significantly over the last 50 years, the 5-year survival rate for patients with high-grade serous ovarian cancer (HGSOC) continues to remain <50% [4, 6]. This low survival rate can be attributed to several factors including late-stage diagnosis, high relapse rates, and chemotherapeutic drug resistance [7]. Current standard of care treatment strategies for HGSOC include cytoreduction surgery coupled with platinum-taxane chemotherapy [8]. Patient treatment stratification is also largely based on genomic mutation status, such as BRCA-1/2 deficiency. Chemotherapy has long been considered the gold standard in cancer treatment; however, high rates of resistance and relapse have resulted in an urgent need to develop effective second-line therapeutics for HGSOC patients. One targeted second-line treatment involves the use of poly (ADP–ribose) polymerase (PARP) inhibitor treatment. However, this treatment has been mostly limited to use in patients deficient in BRCA-1/2 [9]. The lack of effective second-line therapeutics for BRCA-1/2 wildtype patients remains a significant challenge.
Histone deacetylases (HDACs) are a class of enzymes involved in several biological processes via the modulation of gene expression through the removal of acetyl groups from lysine amino acid residues on histones and non-histone proteins. There are 18 HDACs belonging to four different classes that are separated based on sequence similarities [10]. Class I (1, 2, 3, and 8) and II (4, 5, 6, 7, 9, and 10) HDACs have been recognized for their involvement in DNA replication and repair, making them targets for HDAC inhibition in the context of cancer therapy [11–13]. HDACs also have roles in cell cycle regulation, apoptosis, and metastasis [14–17]. Alterations in HDAC regulation resulting in changes in the protein acetylation landscape contribute to tumorigenesis through decreasing tumor suppressor gene expression, and facilitating DNA damage repair [14, 15, 17].
Many studies have demonstrated a correlation between HDAC upregulation and tumor formation, suggesting that acetylation has a protective anti-tumor role [18]. For example, the loss of acetylation on Histone H4 at Lysine-16 (H4K16) is a hallmark of cancer and is considered a crucial event in cancer development [19]. Therefore, HDACs are an attractive therapeutic target in various cancer types [15, 20]. However, the precise function of HDACs as a key component of proliferation and tumorigenesis in HGSOC remains elusive [17].
HDAC inhibitors (HDACis) have promising roles as therapeutics. They have been reported to sensitize cells to either ionizing radiation or chemotherapy in several types of cancers including prostate, breast, head and neck, and melanoma [10]. Targeting HDACs for inhibition exhibits potential utility in HGSOC; however, other studies have shown that HDACi as a monotherapy in solid tumors is not sufficient to elicit cancer cell death [21–22]. Currently, there are four FDA-approved HDACis: Vorinostat (SAHA), Belinostat, Panobinostat, and Romidepsin. These HDACi have been approved for use in T-cell lymphomas and multiple myeloma as either combination or monotherapies with at least one prior systemic therapy [17]. Vorinostat, Belinostat, and Panobinostat are broad-spectrum inhibitors targeting Class I and II HDACs. Romidepsin is a targeted inhibitor with activity against HDACs 1 and 2 (Class I). HDACi work to inhibit HDAC activity by binding the zinc atom in the catalytic site of HDACs, preventing the ability of HDACs to bind their targets [23]. Vorinostat, Belinostat, and Panobinostat are hydroxyamic acids; however, Romidepsin is a cyclic peptide [23].
Although HDACis have been shown to be successful as combination therapeutics, the mechanism of their antineoplastic activity has not been fully characterized. Therefore, we set out to elucidate how HDACi perturb the global proteomic landscape within HGSOC cells.
2 |. MATERIALS AND METHODS
2.1 |. Chemicals and reagents
Romidepsin (S3020), Panobinostat (S1030), and Vorinostat (SAHA) (S1047) were purchased from Selleck Chemicals. Nuclear Extraction kit (40010) was purchased from Active Motif. HDAC Activity Assay kit (P-4034–96) was purchased from Epigentek. MTT assay kit was purchased from Abcam (ab211091). TMTpro 16plex Label Reagent set (A44522), trypsin, BCA assay kit and DTT were purchased from Thermo Fisher Scientific. LC/MS-grade water and formic acid were purchased from Fisher Scientific. Iodoacetamide (IAA) was purchased from Millipore Sigma.1 g C18 SepPak cartridges were purchased from Waters.
2.2 |. Cell culture
All cell lines were maintained in a humidified incubator at 37°C and 5% CO2. CAOV3 (ATCC), COV318 (Millipore Sigma), and COV362 (Sigma Aldrich) cells were cultured in Dulbecco’s Modified Eagle Medium (DMEM) supplemented with 10% fetal bovine serum (FBS), 1% penicillin-streptomycin, and 0.2% normocin. OVCAR3 cells (ATCC) were cultured in RPMI-1640 media supplemented with 20% FBS, 0.01mg/ml bovine insulin, 1% penicillin-streptomycin, and 0.2% normocin. PEO1 (Sigma Aldrich) cells were cultured in RPMI-1640 media supplemented with 10% FBS, 2 mM sodium pyruvate, 1% penicillin-streptomycin, and 0.2% normocin. ES-2 cells (ATCC) were cultured in McCoy’s 5A media supplemented with 10% FBS, 1% penicillin-streptomycin, and 0.2% normocin. All the cell lines tested negative for mycoplasma contamination.
For HDACi treatment, cells were seeded at 80% confluency in three biological replicates in 15-cm dishes prior to treatment for 48 h. Cells were treated with their respective HDACi IC50 values, unless their IC50 was determined to be greater than the resistance concentration threshold according to data included in the Genomics of Drug Sensitivity in Cancer database (cancerrxgene.org). In this case, cells were treated with a concentration slightly higher than the resistance concentration (11 μM Vorinostat or 2 μM Panobinostat/Romidepsin).
2.3 |. Sulforhodamine B assay
Sulforhodamine B assay was adapted from Voigt [24]. Briefly, cell seeding densities were optimized prior to drug treatment for each individual cell line. Cells were allowed to attach for 24 h and then subjected to a range of treatment concentrations in four technical replicates for Vorinostat, Panobinostat, and Romidepsin. After treatment for 48 h, growth medium was gently removed from each well, and cells were fixed by adding 100 μl of 10% TCA per well. Plates were stored at 4°C for 1 h and then TCA was rinsed using deionized water (200 μl/well) five times. One hundred microliters of SRB solution (0.4% w/v) was added to each well and allowed to stain for 30 min at room temperature. SRB was removed, and the wells were washed five times with 1% acetic acid. The 96-well plates were left to dry overnight at room temperature. Once the plates were dry, the SRB dye was solubilized in 100 μl of 10 mM Tris base per well. Plates were shaken for 10 min to homogenize the dye solution and the OD was measured at 564 nm.
2.4 |. Nuclear extraction and HDAC activity assay
Cells were harvested and lysed using a Nuclear Extraction Kit (Active Motif) following the manufacturer’s instructions. Isolated nuclear fractions of treated cells were used for HDAC Activity Assay (Epigentek) following the manufacturer’s instructions. Briefly, 10 μg of nuclear extract was added to each well of a 96-well plate in combination with HDAC assay buffer, and HDAC substrate (50 μg/ml). Positive control wells also included HDAC inhibitor Trichostatin A. The plate was incubated for 90 min at 37°C. This was followed by incubation with a capture antibody (1000 μg/ml) and a detection antibody (400 μg/ml) for 60 and 30 min, respectively, at room temperature. Developer solution and stop solution were added to the wells and incubated for 10 min at room temperature to stop the enzymatic reaction, and the plate was read at 450 nm.
2.5 |. MTT assay
Cells were seeded at 6400 cells/well in a 96-well plate 24 h prior to treatment. The cells were treated with either a low-dose (1 μM Vorinostat, 0.1 μM Panobinostat/Romidepsin) or high/resistance dose (10 μM Vorinostat, 1 μM Panobinostat/Romidepsin) for 48 h. Upon conclusion of the treatment, drug-containing media was removed from each well and replaced with 50 μl of serum-free and antibiotic-free media, and 50 μl of MTT reagent (Abcam) and placed in a 37°C/5% CO2 incubator for 3 h. Next, the reagent-containing media was gently removed and 150 μl of MTT solvent (Abcam) was added to each well. The plate was wrapped in aluminum foil to protect it from light and shaken on an orbital rocker for 15 min at room temperature. The plate was read at 590 nm immediately.
2.6 |. Cell lysate protein extraction and enzymatic digestion
Cells were washed with 5 ml of ice-cold PBS and then 1 ml of urea lysis buffer (9 M urea, 20 mM HEPES pH 8.0, 1 mM sodium orthovanadate, 2.5 mM sodium pyrophosphate, 1 mM β-glycerophosphate) was added to each dish (HDACi were not added to the lysis buffer). Cells were scraped and collected into a 15 ml conical tube and sonicated using a probe sonicator at 15 W output for 3 × 15 s and cooled on ice for 1 min in between each burst. Cell lysate was cleared by centrifugation at 20,000 × g for 15 min at room temperature. Supernatant was transferred to a new 15 ml conical tube and cell pellets were stored at −80°C. Protein concentration was measured using a BCA protein assay. Samples were normalized so that equal amounts of protein were prepared for each condition/replicate. 1/278 volume of 1.25 M DTT was added to the cell lysate, then incubated at room temperature for 60 min. 1/10 volume of iodoacetamide (102 mM) was added and incubated for 15 min at room temperature in the dark. The cell lysate was diluted four-fold with 20 mM HEPES, followed by 1/100 volume of 1 mg/ml trypsin. Protein was digested overnight at room temperature with rocking. Peptides were acidified with 1/20 volume of 20% TFA (Fisher Scientific) prior to C18 de-salting.
2.7 |. C18 solid-phase extraction of peptides
Solid-phase extraction was carried out using a 1 g C18 cartridge with vacuum filtration. The column was conditioned with 3 ml of 100% acetonitrile (Fisher Scientific) followed by 3 ml of 50% acetonitrile/0.1 % Formic acid (FA) (vol/vol). The column was equilibrated four times with 0.1% TFA (vol/vol). The digested peptide samples were loaded onto their respective columns. Samples were desalted three times with 3 ml of 0.1% TFA and then washed with 0.1% FA. Samples were eluted using 3 ml of 50% Acetonitrile/0.1% FA. The eluate was lyophilized for 2 days until dry.
2.8 |. Tandem mass tag (TMT) labeling
Three sets of TMTpro 16-plex reagents were used: 1 set for each biological replicate of samples. Thirteen of the 16 tags per set were used and randomized for each sample. TMT labeling was adapted from Zecha et al. [25]. First, the dried peptides were reconstituted in 50 mM HEPES. A BCA assay was used to quantify the amount of peptide in each sample. Two-hundred micrograms of peptide was transferred to a new 1.5 ml microcentrifuge tube and diluted to achieve a total volume of 100 μl. A reference channel sample was also created which consisted of equal amounts of peptide from all the samples. After equilibrating the TMT reagents to room temperature, 20 μl of anhydrous acetonitrile was added to each TMT reagent vial (0.5 mg). Two-hundred micrograms of peptide was added to each TMT reagent at a 2.5:1 ratio (previously optimized in our lab) and incubated at room temperature for 1 h. One microgram of each sample was transferred to a new tube to check labeling efficiency. The labeling reaction was quenched by the addition of 5% hydroxylamine to achieve a final concentration of 0.2%. The samples were dried using a speed vac and then desalted using C18 Stop and Go extraction (STAGE) tips. Dried and desalted samples were reconstituted in 2% acetonitrile/0.1% formic acid and analyzed on an Orbitrap Fusion mass spectrometer (ThermoFisher). After the labeling efficiency was confirmed to be >99% using a 1 μg aliquot of every sample, the remainder of samples were quenched, combined, and dried.
2.9 |. C18 Stop and Go extraction (STAGE) tip desalting
C18 STAGE tip desalting was carried out similarly to the method described by Mertins and Rappsilber [26–28] with minor modifications. Briefly, 200 μl C18 STAGE tips were prepared with two Empore C18 extraction disks. The STAGE tips were conditioned with 100 μl of acetonitrile and then centrifuged at 3000 × g for 3 min at room temperature. The STAGE tips were washed with 100 μl of 50% acetonitrile/0.1% FA. This was followed by equilibration twice with 100 μl of 0.1% FA. Samples were loaded onto the STAGE tips and washed twice with 100 μl of 0.1% FA. Then, the samples were eluted with 60 μl of 50% acetonitrile/0.1% formic acid and fully dried using a speed vac.
2.10 |. Mass spectrometry data acquisition
Mass spectrometry data acquisition was carried out at the University of Minnesota Masonic Cancer Center Analytical Biochemistry Shared Resource Mass Spectrometry Facility using a nanoflow liquid chromatography system (Dionex Ultimate 3000) coupled to an Orbitrap Fusion MS system (Thermo Fisher). The samples were reconstituted in 2% acetonitrile/0.1% formic acid and 5 μl were injected into an in-house packed C18 reversed phase column with a 10 μm emission tip (75 μm × 200 mm with Luna C18 5 μm particles). The spray voltage was set to 2100 V. Peptides were separated using a 90-min gradient with buffer A (0.1% FA in water) and buffer B (0.1% FA in acetonitrile). The gradient was as follows: 0–6 min, 2% B at 1 μl/min; 6–84 min, 2%–35% B at 0.3 μl/min; 84–87 min, 35%–90% B at 1.0 μl/min; 87–90 min 2% B at 1 μl/min. Mass spectrometry data acquisition was carried out using a ddMS2 IT CID top 10 method. The MS1 scan range was 350–1800 m/z with a resolution of 60,000. Charge states 2+ to 7+ were included with a dynamic exclusion time of 15 s. CID fragmentation was carried out using a fixed energy collision of 35% with an isolation window of 1.5 m/z and a resolution of 15,000. The raw mass spectrometry data have been deposited to PRIDE (PXD036467).
2.11 |. Mass spectrometry data analysis
The data analysis workflow was similar to our previously published study [29] with modifications noted here that pertain to the specifications of our current study. Briefly, data processing was performed using Proteome Discoverer (PD) 2.5.0.400 (Thermo Fisher Scientific) and searched with SEQUEST HT against a Homo sapiens database (SwissProt downloaded May 2021). Dynamic modifications included methionine oxidation. Protein terminus dynamic modifications included acetyl, met-loss, met-loss + acetyl. Static modifications included TMTpro (static and peptide N-terminus), and cysteine carbamidomethylation. The cleavage enzyme was trypsin with two missed cleavages allowed. The fragment mass tolerance was set to 0.6 Da, and the precursor mass tolerance was set to 10 ppm. The results from PD searches were filtered for high protein and peptide FDR confidence (<0.01). Peptides were also filtered for abundances >0 across all samples and filtered for ≥2 peptides per protein with no data imputation. Peptide abundances were log2 transformed and normalized based on the median value of each treatment condition for each sample. The relative abundance was calculated by dividing the grouped abundances/reference of the treatment condition by the grouped abundance/reference of the DMSO/reference no treatment condition. Peptides with CVs ≥ 30% across replicates within each condition were removed from the overall dataset. Protein quantitation was obtained by median-based averaging of the peptide abundances.
2.12 |. Gene ontology
Gene ontology was used to generate protein pathways and p-values associated with significantly up- or downregulated genes. Gene ontology visualization was carried out using SRplot (https://www.bioinformatics.com.cn/en), a free online platform for data analysis and visualization.
2.13 |. Statistical analysis
Statistical analysis was carried out using a one-way ANOVA with a Šidák post hoc analysis. A p-value of <0.05 was considered significant.
3 |. RESULTS
3.1 |. Experimental setup
In this study, we aimed to analyze the global proteomic alterations following HDACi treatment to determine the function and efficacy of HDACi in BRCA-1/2 wildtype HGSOC cells. We carried out a TMT-based global proteomic analysis of three HGSOC BRCA-1/2 wildtype cell lines: OVCAR3, CAOV3, and COV318. In this analysis, each of the three cell lines were treated with Vorinostat, Panobinostat, Romidepsin, and DMSO (control) for 48 h across three biological replicates. Vorinostat targets HDACs 1, 2, 3 (Class I), and 6 (Class II). Panobinostat is a broad-spectrum inhibitor, and Romidepsin is presumed to target HDACs 1 and 2 (Class I); however, their determined targets are contradictory as the FDA approval documents for Panobinostat and Romidepsin do not explicitly state their specific HDAC targets [30–32]. Randomized TMT labeling was carried out. Each TMT set (three total) was subjected to offline reversed-phase HPLC fractionation and concatenated into 12 fractions. Each fraction was analyzed for three technical replicates resulting in a total of 108 samples (Figure S1). The resulting data was stringently filtered leaving a high quality and highly reproducible dataset. Stringent filtering included a two-peptide per protein requirement, quantification across all samples, and a CV cutoff of 30%. Following this stringent filtering criteria, 1989 quantified proteins were utilized for subsequent analyses (Table S1).
3.2 |. BRCA-1/2 wildtype HGSOC cells have differential proteomic landscapes
We began with a baseline analysis of significant proteomic differences across the three BRCA-1/2 wildtype HGSOC cell lines. All three HGSOC cell lines contain a P53 mutation; however, OVCAR3 and COV318 cells also contain a high amplification of CCNE1. CAOV3 cells uniquely contain an EGFR mutation that is not found in the other two cell lines in this analysis [33]. Due to these baseline genomic differences, we hypothesized that OVCAR3 and COV318 cells would have the closest aligning proteomic landscape. However, we found that COV318 and CAOV3 cells were most closely related with only four proteins being significantly differentially regulated between the two cell lines (Figure S2). When comparing OVCAR3 against CAOV3 cells, there were a larger number of baseline proteomic differences with 13 significantly downregulated proteins and 22 significantly upregulated proteins (Figure 1A). Although COV318 and OVCAR3 cells both are BRCA-1/2 wildtype with a CCNE1 amplification, the largest number of differences in proteomic regulation occurred when comparing these two cell lines. This comparison resulted in 40 significantly downregulated proteins and 21 significantly upregulated proteins (Figure 1B).
FIGURE 1.
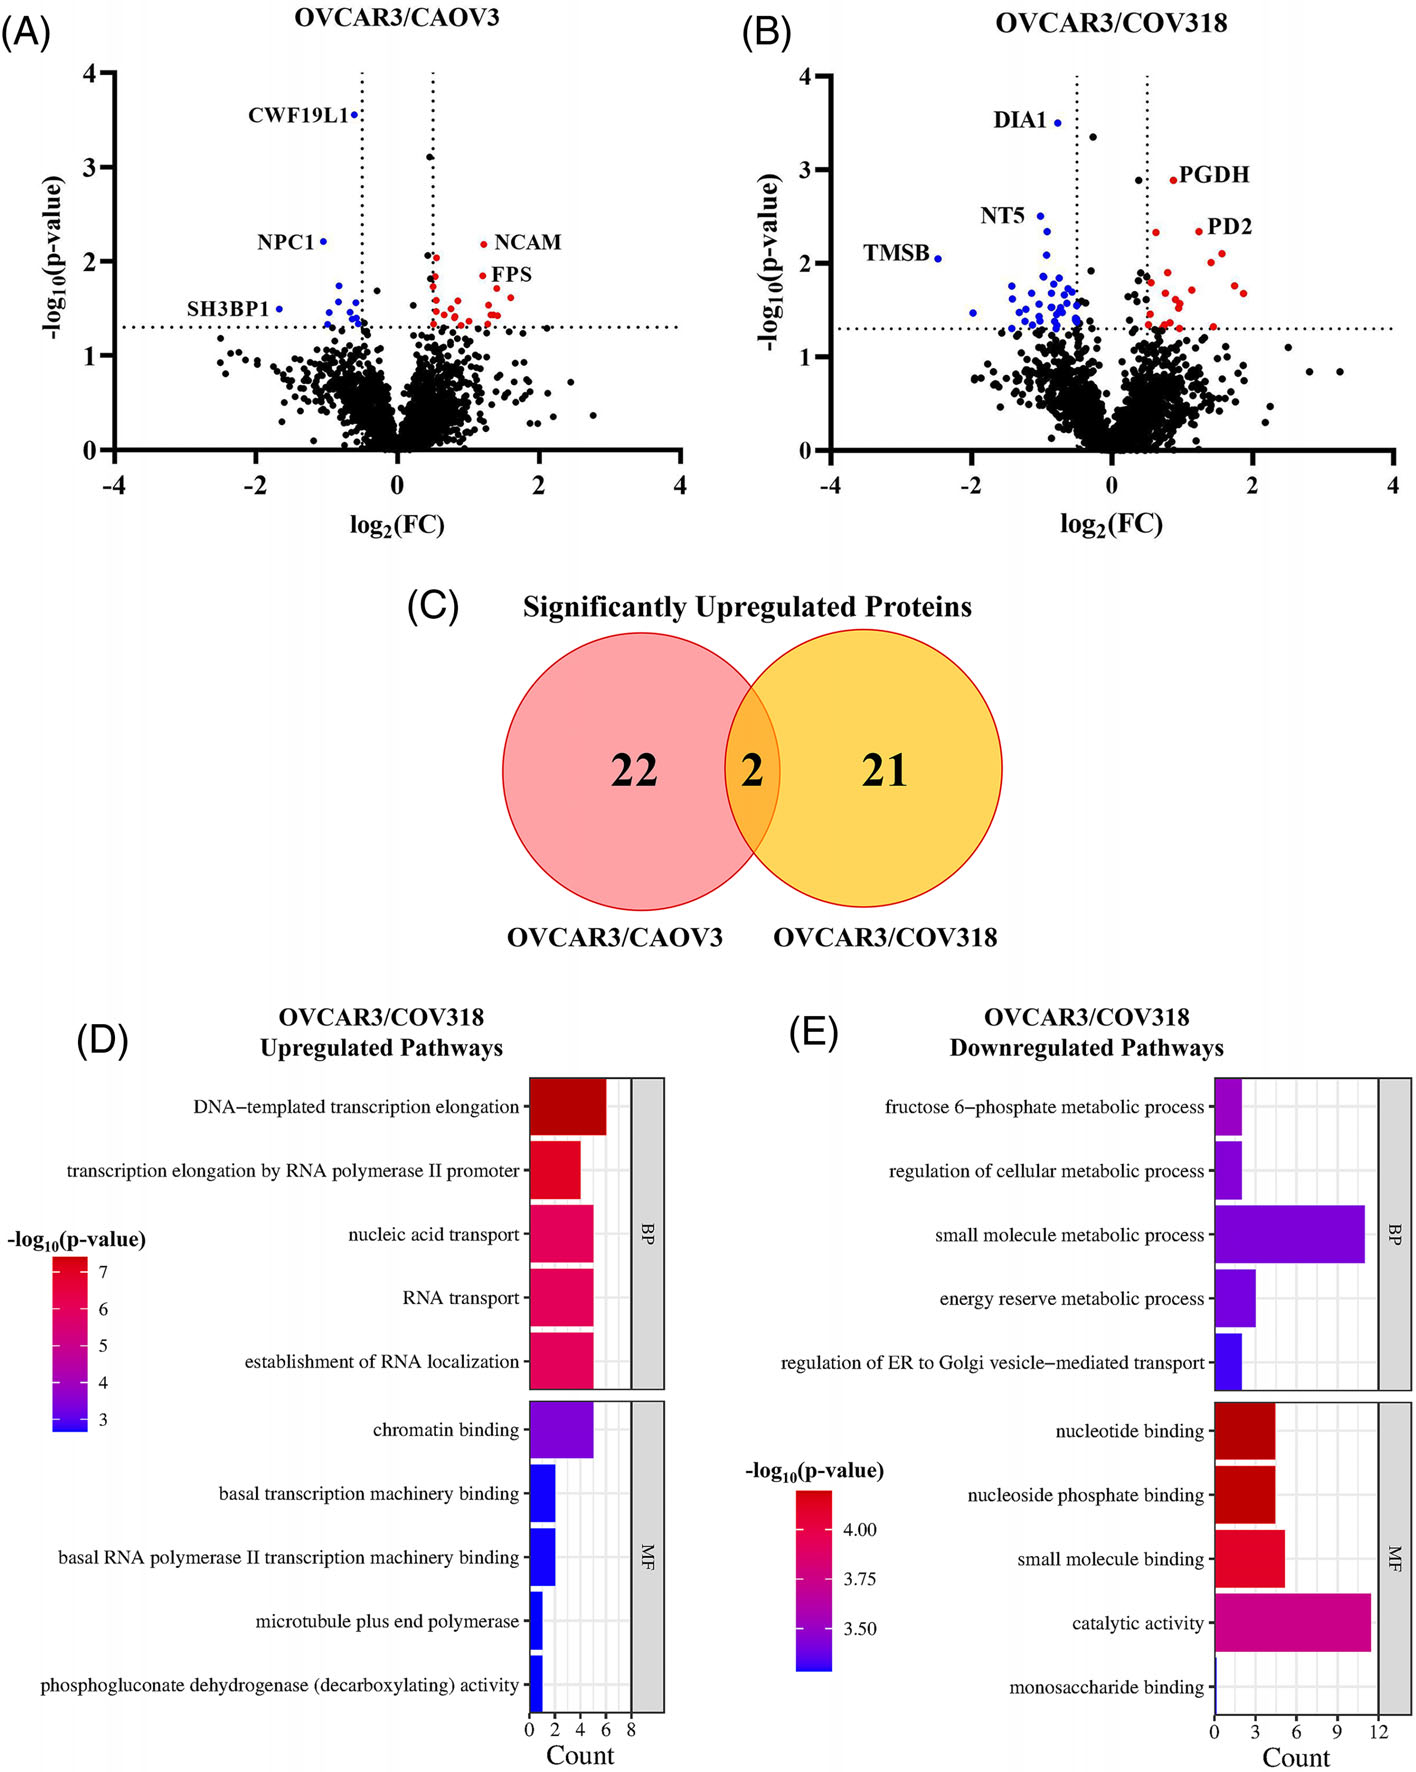
OVCAR3 cells have the largest proteomic differences when compared against COV318 and CAOV3 cells. Volcano plots of protein regulation differences comparing OVCAR3 against (A) CAOV3 and (B) COV318 cells. (A) In the OVCAR3 versus CAOV3 cells, 22 significantly upregulated and 12 significantly downregulated proteins (red and blue dots, respectively) were identified. (B) In the OVCAR3 versus COV318 cells, 21 significantly upregulated proteins and 40 significantly downregulated proteins were identified. (C) Venn diagram of the overlap in significantly upregulated proteins identified when comparing OVCAR3 cells against CAOV3 and COV318 cells. (D–E) Enrichment charts of significantly (D) up- or (E) downregulated protein pathways in OVCAR3 cells versus COV318 cells. BP, biological process; MF, molecular function.
Although COV318 and CAOV3 appeared to be most closely related, only two upregulated proteins were identified in common when these cells were compared against OVCAR3 cells. These proteins include hydroxymethylglutaryl-CoA synthase, cytoplasmic (HMGSC1) which catalyzes the condensation of Acetyl-CoA, and 6-phosphogluconate dehydrogenase, decarboxylating (PGD) which catalyzes the oxidative decarboxylation of 6-phosphogluconate (Figure 1C) [34]. Since the OVCAR3/COV318 proteomic analysis resulted in the largest number of significant changes in relative protein abundance, we then carried out a gene ontology analysis to observe the pathways most impacted by these protein regulation differences. The most significantly upregulated pathways included transcription regulation and RNA localization. However, the most significantly downregulated pathways included metabolism and molecular binding. We then hypothesized that a significant difference in the metabolism-related pathways could impact HDACi response across the cell lines.
3.3 |. Vorinostat is consistently the least effective HDACi in HGSOC BRCA-1/2 wildtype cells
After establishing baseline proteomic differences across the three BRCA-1/2 wildtype HGSOC cells, we compared the baseline HDAC activity levels across these three cell lines and how they differed following HDACi treatment. COV318 cells had the highest baseline HDAC activity level at 2.31 OD/min/mg, which was significantly higher than both CAOV3 (1.187 OD/min/mg) and OVCAR3 (1.33 OD/min/mg) cells (Figure S3). Following a baseline analysis of HDAC activity across each cell line, we next analyzed alterations in HDAC activity after treatment with Vorinostat, Panobinostat and Romidepsin. Alterations in HDAC activity following HDACi treatment were analyzed against DMSO-treated cells. Although COV318 had the highest baseline HDAC activity levels, these cells exhibited a more significant decrease in HDAC activity following treatment with Vorinostat, Panobinostat, and Romidepsin when compared to CAOV3 and OVCAR3 cells (Figure S4A–C).
When comparing the effectiveness of the individual HDACi against one another, Vorinostat treatment resulted in significantly higher HDAC activity in COV318 and CAOV3 cells when compared to Panobinostat- and Romidepsin-treated cells (Figure S4D,E). OVCAR3 cells had no significant difference between Panobinostat and Vorinostat treatments; however, both HDACi resulted in significantly higher HDAC activity when compared against Romidepsin treatment (Figure S4F).
After analyzing HDAC activity levels, we investigated the inhibition efficacy of each HDACi compared to DMSO-treated cells. CAOV3 and OVCAR3 cells had an increase in HDAC activity following treatment with Vorinostat, and OVCAR3 also had an increase in HDAC activity following treatment with Panobinostat, resulting in a negative inhibition (Figure 2A,B). This suggests CAOV3 and OVCAR3 are potentially resistant to Vorinostat and/or Panobinostat treatment.
FIGURE 2.
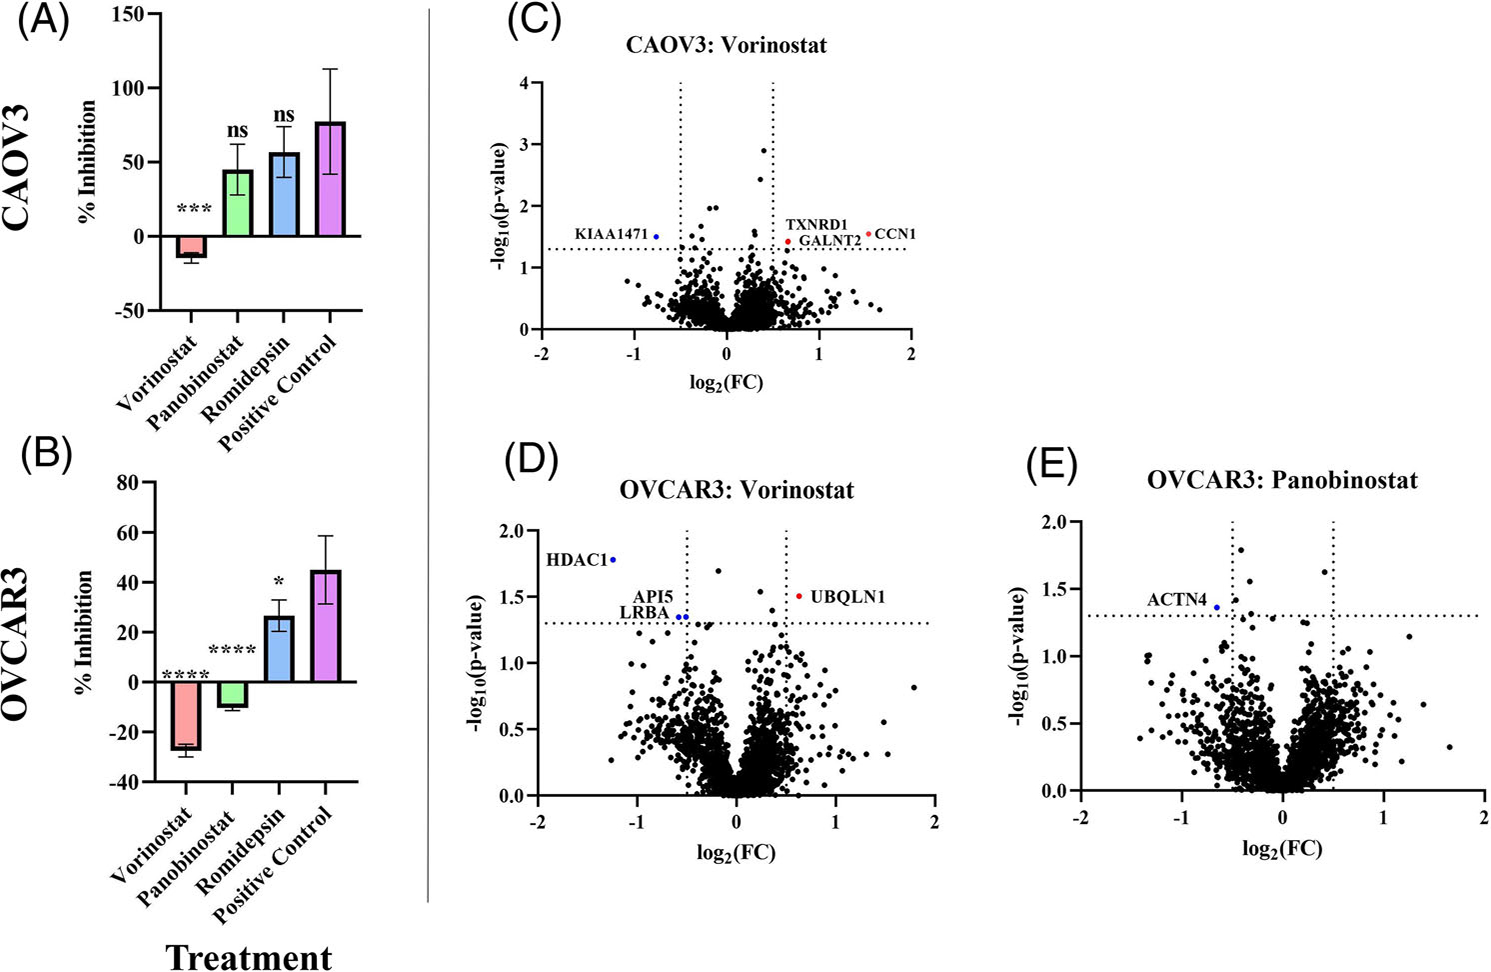
Vorinostat treatment results in a negative inhibition in CAOV3 and OVCAR3 cells. (A-B) HDAC inhibition analysis following HDACi treatment in (A) CAOV3, and (B) OVCAR3 HGSOC cell lines. % Inhibition represents HDAC activity of treated cells divided by the negative control DMSO-treated cells. The statistical analysis compares HDACi treatments Vorinostat, Panobinostat, and Romidepsin against the positive control. The positive control is DMSO treated cells + Trichostatin A (TSA). Statistical analysis was conducted using a one-way ANOVA followed by a Šidák post-hoc analysis to determine significance. *p < 0.05, **p < 0.01, ***p < 0.001, ****p < 0.0001. (C-E) Volcano plots of protein regulation differences between (C) Vorinostat-treated CAOV3 cells and (D) Vorinostat-treated and (E) Panobinostat-treated OVCAR3 cells. The red and blue dots indicate significantly up- or downregulated proteins, respectively.
Since CAOV3 and OVCAR3 cells responded poorly to Vorinostat and/or Panobinostat treatment based on the results from the HDAC activity assay, we analyzed the global proteomic alterations following the respective HDACi treatments in these cells. There were very few significant alterations in proteomic regulation in response to Vorinostat/Panobinostat treatment in CAOV3 and OVCAR3 cells (Figure 2C–E). Of the three conditions that resulted in a negative inhibition of HDAC activity, Panobinostat-treated OVCAR3 cells only had one significantly downregulated protein (ACTN4). The Vorinostattreated cells had equal changes in protein regulation with a total of four proteins either significantly up or downregulated. In Vorinostattreated OVCAR3 cells, there was a significant downregulation of Histone Deacetylase 1 (HDAC1) (Figure 2E). This significant change in regulation of HDAC1 was unique to the Vorinostat-treated OVCAR3 cells (Figure 3). HDAC1 catalyzes the deacetylation of lysine residues on core histones (H2A/B, H3, and H4). Non-histone protein targets of HDAC1 include NR1D2, RELA, SP1, SP3, and TSHZ3 [34].
FIGURE 3.

Significant downregulation of HDAC1 is unique to the Vorinostat-treated OVCAR3 cells. Heatmap of histone and histone-related protein regulation changes following HDACi treatment across HGSOC cells. CA-CAOV3, CO-COV318, OV-OVCAR3. R, Romidepsin; V, Vorinostat; P, Panobinostat.
3.4 |. Romidepsin differentially impacts protein regulation in HGSOC cells
Following the HDAC activity analysis in the HGSOC cells, Romidepsin was consistently the most effective in inhibiting HDAC activity levels when compared against Vorinostat and Panobinostat. Although Romidepsin was more effective at inhibiting HDAC activity levels across the three cell lines, each cell line had differential changes in proteomic regulations (Figure 4). There were only two significantly downregulated proteins in COV318 cells (Figure 4A). CAOV3 had the second highest number of regulation changes with one significantly downregulated protein and six significantly upregulated proteins (Figure 4B). OVCAR3 cells had the largest number of HDACi-induced proteomic changes with eight significantly downregulated proteins and 21 significantly upregulated proteins (Figure 4C). However, there was no overlap in the significantly altered proteins following Romidepsin treatment across the three HGSOC cell lines (data not shown). Since OVCAR3 had the largest number of significant changes following Romidepsin treatment, we carried out a gene ontology analysis to identify the most significantly altered pathways. The most significantly upregulated pathways following Romidepsin treatment in OVCAR3 cells include regulation of catabolic processes, and DNA binding (Figure S5).
FIGURE 4.
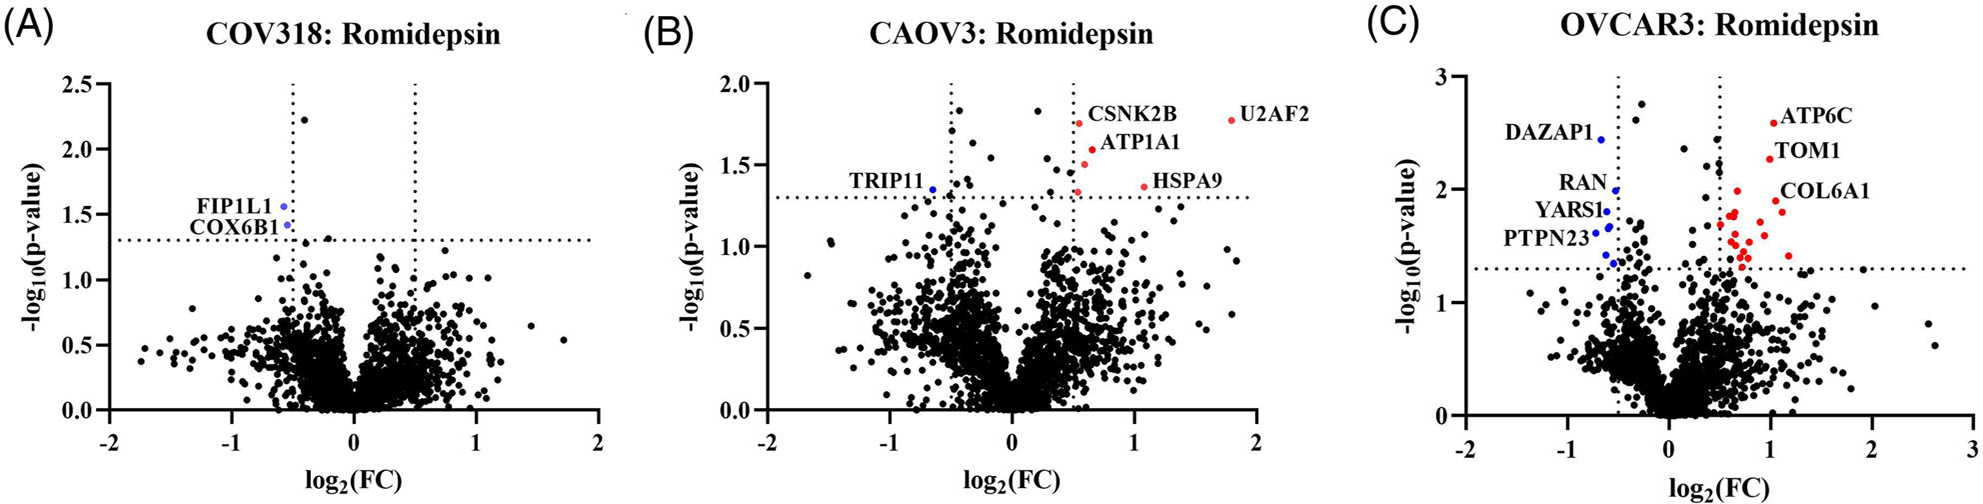
Romidepsin differentially impacts HGSOC cells. Volcano plots of quantified proteins extracted from Romidepsin-treated (A) COV318, (B) CAOV3, and (C) OVCAR3 cells. The red and blue dots indicate significantly up- or downregulated proteins, respectively. (A) COV318 cells had only two significantly downregulated proteins. (B) CAOV3 cells had on1 significantly downregulated and six significantly upregulated proteins. (C) OVCAR3 cells had the largest number of changes with eight significantly downregulated proteins and 21 significantly upregulated proteins. There was no overlap in significant proteins across the three cell lines.
3.5 |. HDAC inhibitors cytotoxicity varies across ovarian cancer subtypes
After identifying significant proteomic differences in HDACi function across treatments and the HGSOC cell lines, we carried out a cytotoxicity analysis of HDACi following a low-dose or resistance/high-dose treatment in a panel of ovarian cancer cell lines. After HDACi treatment, we found that individual ovarian cancer cell lines respond differently to the same HDACi treatment. COV318 cells appeared to be least responsive to HDACi as all treatment conditions resulted in <50% cytotoxicity (Figure 5A). Low-dose Vorinostat treatment resulted in low cytotoxicity across all conditions, suggesting Vorinostat requires higher doses to be effective in HGSOC cells (Figure 5A–C). CAOV3 and COV318 cells did not reach a 50% cytotoxicity following Vorinostat treatment even at the high dose of 10 μM. COV318 cells were also found to have a substantially higher IC50 concentration across all three HDACi when compared to OVCAR3 and CAOV3 (Figures 5D and S6), corresponding to low cytotoxicity. This suggests the potential for HDACi resistance; however, further studies are warranted.
FIGURE 5.
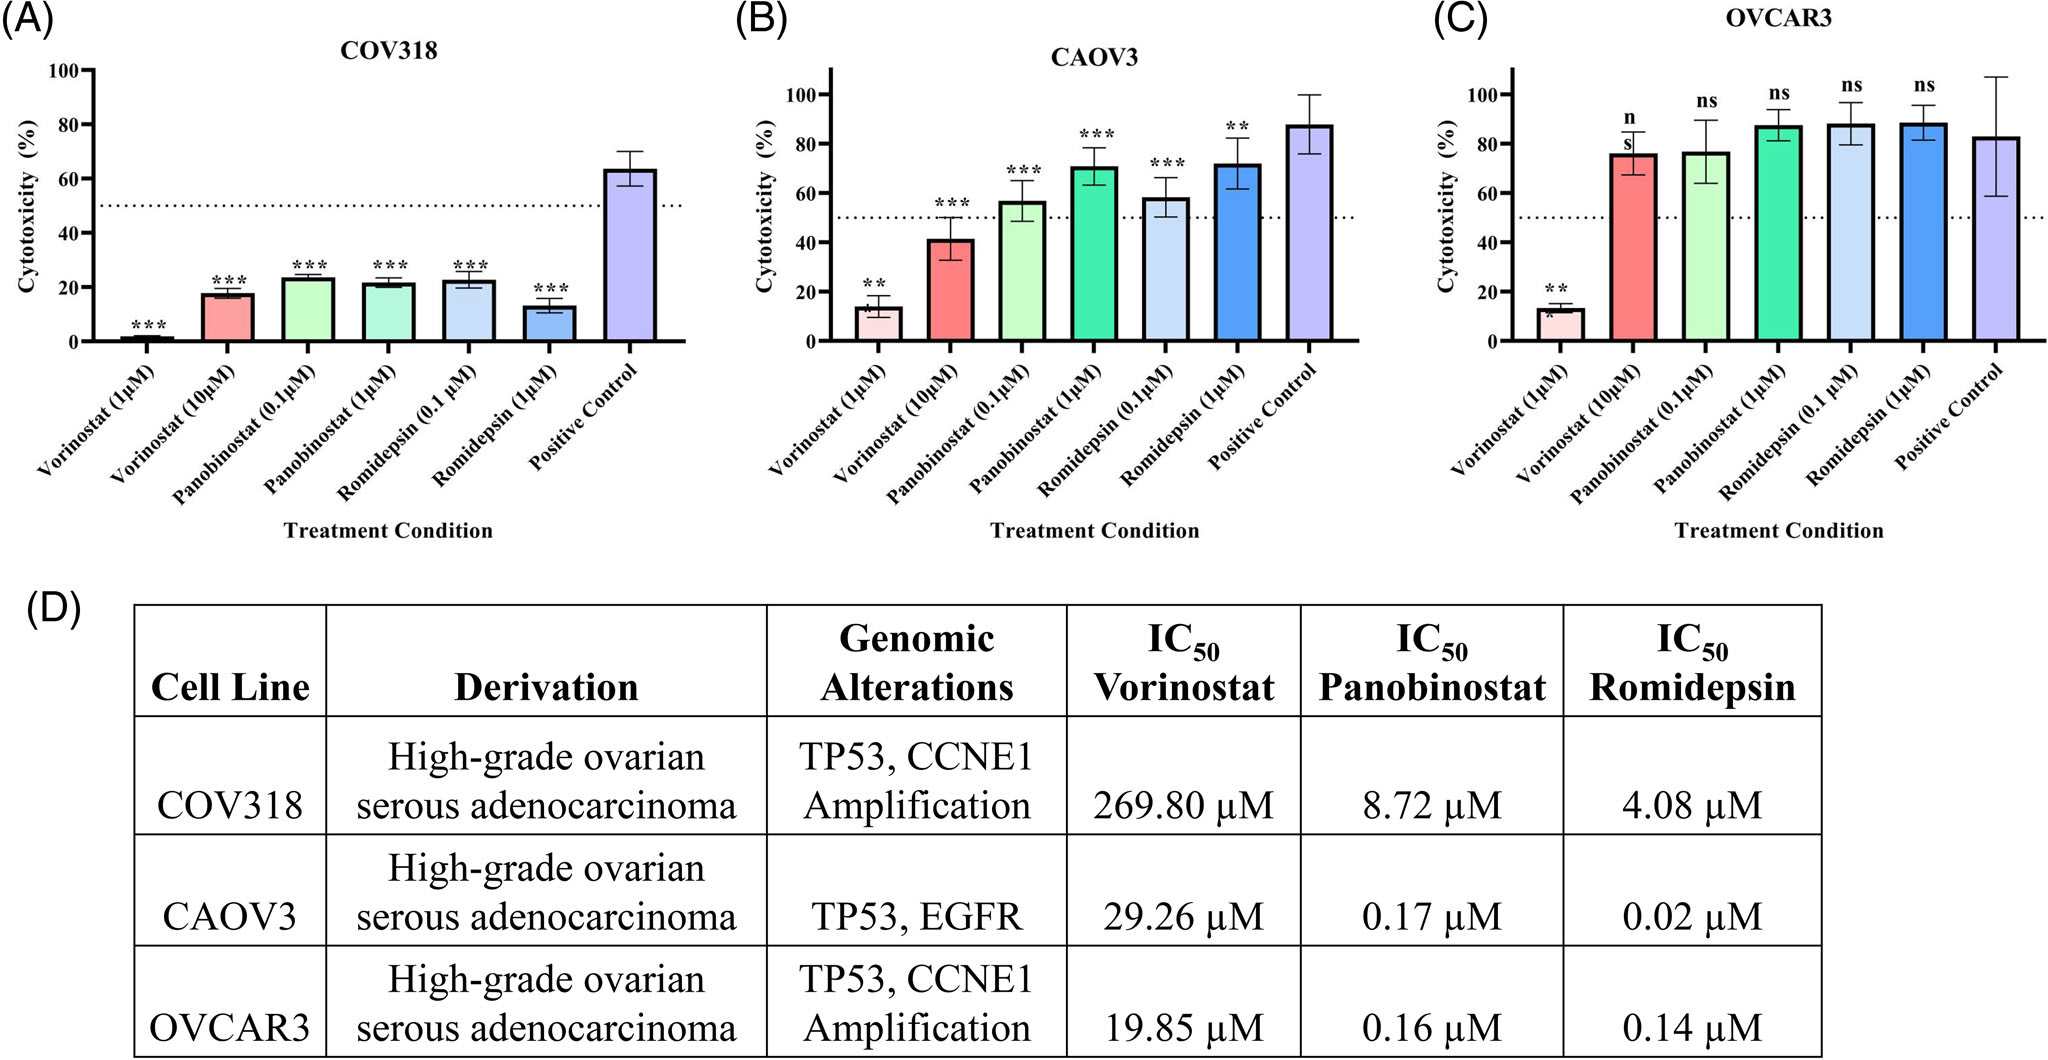
HDACi cytotoxicity varies across HGSOC cells. (A–C) MTT assay analyzing cytotoxicity of HDACi treatment at either a low-dose or resistance/high-dose concentration for 48 h in (A) COV318, (B) CAOV3, and (C) OVCAR3 HGSOC cells. Low-dose treatment included 1 μM Vorinostat and 0.1 μM Panobinostat/Romidepsin. Resistance/high-dose treatment included 10 μM Vorinostat and 1 μM Panobinostat/Romidepsin. Statistical analysis was carried out using a one-way ANOVA with a Šidák post-hoc analysis. **p < 0.01, ***p < 0.001, ****p < 0.0001, ns = not significant. (D) Table of IC50 values and characteristics of ovarian cancer cell lines across each cell line analyzed.
We then hypothesized that HDACi responsiveness could be dependent on BRCA-1/2 mutation status and ovarian cancer subtype. An additional cytotoxicity analysis was carried out in BRCA-1 (COV362) or BRCA-2 deficient (PEO1) HGSOC cells and an ovarian clear cell carcinoma (ES-2) cell line (Figure S7). The COV362 cells responded poorly to HDACi treatment as well, with a negative cytotoxicity from Vorinostat treatment (Figure S7A). PEO1 cells were more responsive; however, Vorinostat treatment resulted in <50% cytotoxicity. All three HDACi consistently had the highest cytotoxicity in the ES-2 cells across all conditions, except the Vorinostat low-dose treatment. This suggests ovarian cancer cell lines in general, irrespective of BRCA-1/2 mutation status and subtype are least responsive to Vorinostat treatment in terms of cytotoxicity and HDAC inhibition when compared against treatment with Panobinostat and Romidepsin. However, individual cytotoxicity levels differed across the panel of cell lines we analyzed. Further experimentation is warranted to evaluate the effectiveness of implementing HDACi into certain ovarian cancer treatments, such as in combination with chemotherapies or other targeted inhibitors such as PARPi.
4 |. DISCUSSION
In this work, we sought to determine the efficacy of Vorinostat, Panobinostat, and Romidepsin in inhibiting HDAC activity and to elucidate global proteomic perturbations following HDACi treatment in HGSOC cell lines. This work encompassed a global proteomic analysis across three BRCA-1/2 wildtype ovarian adenocarcinoma (HGSOC) cell lines to evaluate the reproducibility of HDACi effects across similar cell types. Although the baseline proteomic analysis revealed COV318 and CAOV3 had the most similar proteomic landscapes, their responses to HDACi treatment differed in both the HDAC activity analysis and the global proteomic analysis. COV318 cells also had the highest baseline HDAC activity, which suggested they may respond more poorly to HDAC inhibition.
The largest difference in the baseline proteomic landscape was between OVCAR3 and COV318 cells. A gene ontology pathway analysis of the significant baseline differences revealed metabolic pathways were significantly downregulated when comparing OVCAR3 cells against COV318 cells. Previously, Liu et al. analyzed proteomic differences in Vorinostat sensitive and resistant cancer cells [35]. Their study revealed that following Vorinostat treatment, glycolysis was significantly upregulated in the resistant cells. Based on the results from our current study, the significant upregulation of baseline metabolic activity in COV318 cells compared against OVCAR3 cells suggests that a higher baseline metabolic activity may impact responsiveness to HDACi.
Although we hypothesized that COV318 cells would have the poorest response to HDACi due to high baseline HDAC activity, CAOV3 and OVCAR3 cells exhibited negative inhibition of Vorinostat (CAOV3 and OVCAR3) and Panobinostat (OVCAR3), meaning an increase in HDAC activity when compared against a no treatment control. However, COV318 cells did not exhibit a similar increase in HDAC activity. The negative inhibition of HDAC activity following treatment with these HDACi suggests there is a potential resistance occurring for those specific inhibitors. However, following a pathway analysis in OVCAR3 and CAOV3 cells following Vorinostat and/or Panobinostat treatment, we did not identify a consistent pattern in the upregulation or downregulation of proteins to enable the identification of a common protein or pathway that is potentially implicated in treatment resistance.
Interestingly, HDAC1 was identified as being significantly downregulated in OVCAR3 cells following Vorinostat treatment even though this HDACi treatment resulted in an upregulation of overall HDAC activity (HDACs 1–11). The limitation of the HDAC activity analysis was that it analyzed all HDACs, and we could not discern what specific HDACs were contributing most significantly to this overall activity level. This leads to the question of HDAC1’s role in tumorigenesis and drug response, and which HDACs significantly contribute to these responses. Since HDAC1 was downregulated despite an overall increase in HDAC activity, another possible explanation is that there was a compensatory mechanism occurring with other HDACs. This could mean that when HDAC1 was downregulated, other HDACs such as HDACs 2, 3, or 6 were upregulated. However, further studies will warrant a more targeted mass spectrometry approach in analyzing the various HDAC regulation changes following HDAC inhibition across the different FDA-approved HDACis.
HDACi efficacy as a monotherapy in solid tumor cancers has been shown to be limited [36, 37], so several studies have focused on pursuing the function of HDACi in combination with other treatments. Previously, Bandolik et al. found that generally, HDACi were able to increase cisplatin sensitivity in HGSOC cells; however, Entinostat, a non-FDA-approved targeted class I HDACi, was superior to sensitizing HGSOC cells to cisplatin than the pan-HDAC inhibitor Panobinostat [38]. The observed improved efficacy of a targeted inhibitor aligns with our current data. Romidepsin, the most targeted inhibitor in this dataset, is presumed to target HDACs 1 and 2 (Class I), whereas Vorinostat and Panobinostat target multiple classes of HDACs. In our study, we determined that Romidepsin had greater efficacy in inhibiting HDAC activity when compared against Vorinostat and Panobinostat. Further analysis is warranted to examine the utility of Romidepsin in HGSOC treatment.
In conclusion, we identified that individual HDACi function differently from one another with respect to their off-target effects assessed based on differences in protein relative abundances. HDACi also function differently when comparing the same cancer type with differing genetic backgrounds. Vorinostat was consistently the least effective in inhibiting HDAC activity and Romidepsin, a more targeted inhibitor, was found to be generally more effective. The cytotoxicity of these HDACi varies considerably across the cell types studied and this could be helpful in determining treatment modality. Future work will entail a more targeted mass spectrometry analysis of HDACs in ovarian cancer, the role of HDACs in individual HDACi responsiveness, and analyses of cellular genomic backgrounds impacting HDACi proteomic alterations.
Supplementary Material
STATEMENT OF SIGNIFICANCE.
Drug resistance and relapse are substantial challenges in HGSOC treatment, leading to a desperate need for new therapy options. The discovery of Poly (ADP-ribose) polymerase inhibitors (PARPi) has changed the course of treatment in patients with BRCA-1/2 deficient genotypes. However, the limited efficacy of PARPi in BRCA-1/2 wildtype HGSOC results in a large gap in their treatment utility, creating a continued urgent need for new approaches to therapy. The development of HDACi has shown promising results in sensitizing cells to chemotherapy; however, much is still unknown involving the role of HDACs and their inhibitors.
HDACs are involved in several biological processes via the modulation of gene expression through the removal of acetyl groups from lysine amino acid residues on histones and non-histone proteins. HDACs also have roles in cell cycle regulation, apoptosis, DNA damage repair, and other cellular processes. Alterations in HDAC expression resulting in changes in the protein acetylation landscape are thought to contribute to tumorigenesis through decreasing the expression of tumor suppressor genes and facilitating DNA damage repair. This suggests a correlation between HDAC regulation and tumor progression. In order to consider the use of HDACi as a clinically relevant HGSOC treatment modality, an improved understanding of their mechanisms of action and impacts on cellular signaling pathways is warranted.
ACKNOWLEDGMENTS
We thank previous Thomas lab member Shannon Culbert, a summer undergraduate intern, for her contribution to acquiring the ES-2 cell line data. Mass spectrometry data were acquired in the Analytical Biochemistry Shared Resource of the University of Minnesota Masonic Cancer Center, supported in part by the National Cancer Institute (Cancer Center Support Grant P30 CA077598). S.N.T. acknowledges funding from the National Institutes of Health’s National Center for Advancing Translational Sciences, Grant No. UL1TR002494, via the University of Minnesota’s Clinical and Translational Science Institute. S.N.T. also acknowledges funding from the V Foundation from Cancer Research and startup funds provided by the University of Minnesota Department of Laboratory Medicine and Pathology. J.M.D. and S.N.T. acknowledge funding from a Mayo Clinic Ovarian SPORE Developmental Research Project (P50 CA136393).
Funding information
National Center for Advancing Translational Sciences, Grant/Award Number: UL1TR002494; V Foundation for Cancer Research; Mayo Clinic Ovarian SPORE Developmental Research Project, Grant/Award Number: P50 CA136393; University of Minnesota Department of Laboratory Medicine and Pathology
Abbreviations:
- BRCA
BReast CAncer gene
- HDAC
histone deacetylase
- HDACi
histone deacetylase inhibitor
- HGSOC
high-grade serous ovarian cancer
- PARPi
poly (ADP-ribose) polymerase inhibitor
- PTM
post-translational modification
- TMT
tandem mass tags
- WT
wildtype
Footnotes
CONFLICT OF INTEREST
The authors declare no conflict of interest.
SUPPORTING INFORMATION
Additional supporting information may be found online https://doi.org/10.1002/pmic.202100372 in the Supporting Information section at the end of the article.
DATA AVAILABILITY STATEMENT
The raw mass spectrometry data have been deposited to PRIDE with the dataset identifier PXD036467.
REFERENCES
- 1.Chobanian N, & Dietrich CS (2008). Ovarian cancer. Surgical Clinics of North America, 88, 285–299. [DOI] [PubMed] [Google Scholar]
- 2.Lisio MA, Fu L, Goyeneche A, Gao ZH, & Telleria C (2019). High-grade serous ovarian cancer: Basic sciences, clinical and therapeutic standpoints. International Journal of Molecular Sciences, 20, 952. [DOI] [PMC free article] [PubMed] [Google Scholar]
- 3.Kossaï M, Leary A, Scoazec JY, & Genestie C (2018). Ovarian cancer: A heterogeneous disease. Pathobiology, 85, 41–49. [DOI] [PubMed] [Google Scholar]
- 4.Kurman RJ, & Shih IM (2016). The dualistic model of ovarian carcinogenesis: Revisited, revised, and expanded. American Journal of Pathology, 186, 733–747. [DOI] [PMC free article] [PubMed] [Google Scholar]
- 5.Testa U, Petrucci E, Pasquini L, Castelli G, & Pelosi E (2018). Ovarian cancers: Genetic abnormalities, tumor heterogeneity and progression, clonal evolution and cancer stem cells. Medicines, 5, 16. [DOI] [PMC free article] [PubMed] [Google Scholar]
- 6.Vaughan S, Coward JI, Bast RC, Berchuck A, Berek JS, Brenton JD, Coukos G, Crum CC, Drapkin R, Etemadmoghadam D, Friedlander M, Gabra H, Kaye SB, Lord CJ, Lengyel E, Levine DA, McNeish IA, Menon U, Mills GB, … Balkwill FR (2011). Rethinking ovarian cancer: Recommendations for improving outcomes. Nature Reviews Cancer, 11, 719–725. [DOI] [PMC free article] [PubMed] [Google Scholar]
- 7.Matulonis UA, Sood AK, Fallowfield L, Howitt BE, Sehouli J, & Karlan BY (2016). Ovarian cancer. Nature Reviews Disease Primers, 2, 16061. [DOI] [PMC free article] [PubMed] [Google Scholar]
- 8.Della Pepa C, Tonini G, Pisano C, Di Napoli M, Cecere SC, Tambaro R, Facchini G, & Pignata S (2015). Ovarian cancer standard of care: Are there real alternatives? Chinese Journal of Cancer, 34, 17–27. [DOI] [PMC free article] [PubMed] [Google Scholar]
- 9.Banerjee S, Gonzalez-Martin A, Harter P, Lorusso D, Moore KN, Oaknin A, & Ray-Coquard I (2020). First-line PARP inhibitors in ovarian cancer: Summary of an ESMO Open - Cancer Horizons round-table discussion. ESMO Open, 5, e001110. [DOI] [PMC free article] [PubMed] [Google Scholar]
- 10.Seto E, & Yoshida M (2014). Erasers of histone acetylation: The histone deacetylase enzymes. Cold Spring Harbor Perspectives in Biology, 6, a018713. [DOI] [PMC free article] [PubMed] [Google Scholar]
- 11.Yano M, Miyazawa M, Ogane N, Ogasawara A, Hasegawa K, Narahara H, & Yasuda M (2021). Up-regulation of HDAC6 results in poor prognosis and chemoresistance in patients with advanced ovarian high-grade serous carcinoma. Anticancer Research, 41, 1647–1654. [DOI] [PubMed] [Google Scholar]
- 12.Zhou L, Xu X, Liu H, Hu X, Zhang W, Ye M, & Zhu X (2018). Prognosis analysis of histone deacetylases mRNA expression in ovarian cancer patients. Journal of Cancer, 9, 4547–4555. [DOI] [PMC free article] [PubMed] [Google Scholar]
- 13.Shen YF, Wei AM, Kou Q, Zhu QY, & Zhang L (2016). Histone deacetylase 4 increases progressive epithelial ovarian cancer cells via repression of p21 on fibrillar collagen matrices. Oncology Reports, 35, 948–954. [DOI] [PubMed] [Google Scholar]
- 14.Ropero S, & Esteller M (2007). The role of histone deacetylases (HDACs) in human cancer. Molecular Oncology, 1, 19–25. [DOI] [PMC free article] [PubMed] [Google Scholar]
- 15.Sun Y, Yue S, Wang Y, & Lu F (2018). Histone deacetylase inhibitors in cancer therapy. Current Topics in Medicinal Chemistry, 18, 2420–2428. [DOI] [PubMed] [Google Scholar]
- 16.Stengel KR, & Hiebert SW (2015). Class I HDACs affect DNA replication, repair, and chromatin structure: Implications for cancer therapy. Antioxid Redox Signaling, 23, 51–65. [DOI] [PMC free article] [PubMed] [Google Scholar]
- 17.Li Y, & Seto E (2016). HDACs and HDAC inhibitors in cancer development and therapy. Cold Spring Harbor Perspectives in Medicine, 6, a026831. [DOI] [PMC free article] [PubMed] [Google Scholar]
- 18.Fraga MF, Ballestar E, Villar-Garea A, Boix-Chornet M, Espada J, Schotta G, Bonaldi T, Haydon C, Ropero S, Petrie K, Gopalakrishna Iyer N, Pérez-Rosado A, Calvo E, Lopez JA, Cano A, Calasanz MJ, Colomer D, Piris MA, Ahn N, … Esteller M (2005). Loss of acetylation at Lys16 and trimethylation at Lys20 of histone H4 is a common hallmark of human cancer. Nature Genetics, 37, 391–400. [DOI] [PubMed] [Google Scholar]
- 19.Gupta VG, Hirst J, Petersen S, Roby KF, Kusch M, Zhou H, Clive ML, Jewell A, Pathak HB, Godwin AK, Wilson AJ, Crispens MA, Cybulla E, Vindigni A, Fuh KC, & Khabele D (2021). Entinostat, a selective HDAC1/2 inhibitor, potentiates the effects of olaparib in homologous recombination proficient ovarian cancer. Gynecologic Oncology, 162, 163–172. [DOI] [PMC free article] [PubMed] [Google Scholar]
- 20.Roos WP, & Krumm A (2016). The multifaceted influence of histone deacetylases on DNA damage signalling and DNA repair. Nucleic Acids Research, 44, 10017–10030. [DOI] [PMC free article] [PubMed] [Google Scholar]
- 21.Ali A, Zhang F, Maguire A, Byrne T, Weiner-Gorzel K, Bridgett S, O’Toole S, O’Leary J, Beggan C, Fitzpatrick P, McCann A, & Furlong F (2020). HDAC6 degradation inhibits the growth of high-grade serous ovarian cancer cells. Cancers (Basel), 12, 3734. [DOI] [PMC free article] [PubMed] [Google Scholar]
- 22.Yoo J, Jeon YH, Lee DH, Kim GW, Lee SW, Kim SY, Park J, & Kwon SH (2021). HDAC6-selective inhibitors enhance anticancer effects of paclitaxel in ovarian cancer cells. Oncology Letters, 21, 201. [DOI] [PMC free article] [PubMed] [Google Scholar]
- 23.Zhang L, Zhang J, Jiang Q, & Song W (2018). Zinc binding groups for histone deacetylase inhibitors. Journal of Enzyme Inhibition and Medicinal Chemistry, 33, 714–721. [DOI] [PMC free article] [PubMed] [Google Scholar]
- 24.Voigt W (2005). Sulforhodamine B assay and chemosensitivity. Methods in Molecular Medicine, 110, 39–48. [DOI] [PubMed] [Google Scholar]
- 25.Zecha J, Satpathy S, Kanashova T, Avanessian SC, Kane MH, Clauser KR, Mertins P, Carr SA, & Kuster B (2019). TMT labeling for the masses: A robust and cost-efficient, in-solution labeling approach. Molecular & Cellular Proteomics, 18, 1468–1478. [DOI] [PMC free article] [PubMed] [Google Scholar]
- 26.Mertins P, Tang LC, Krug K, Clark DJ, Gritsenko MA, Chen L, Clauser KR, Clauss TR, Shah P, Gillette MA, Petyuk VA, Thomas SN, Mani DR, Mundt F, Moore RJ, Hu Y, Zhao R, Schnaubelt M, Keshishian H, … Carr SA (2018). Reproducible workflow for multiplexed deep-scale proteome and phosphoproteome analysis of tumor tissues by liquid chromatography-mass spectrometry. Nature Protocols, 13, 1632–1661. [DOI] [PMC free article] [PubMed] [Google Scholar]
- 27.Rappsilber J, Ishihama Y, & Mann M (2003). Stop and go extraction tips for matrix-assisted laser desorption/ionization, nanoelectrospray, and LC/MS sample pretreatment in proteomics. Analytical Chemistry, 75, 663–670. [DOI] [PubMed] [Google Scholar]
- 28.Rappsilber J, Mann M, & Ishihama Y (2007). Protocol for micropurification, enrichment, pre-fractionation and storage of peptides for proteomics using StageTips. Nature Protocols, 2, 1896–1906. [DOI] [PubMed] [Google Scholar]
- 29.Perez JM, Twigg CAI, Guan W, & Thomas S N. (2022). Proteomic analysis reveals low-dose PARP inhibitor-induced differential protein expression in BRCA1-mutated high-grade serous ovarian cancer cells. Journal of the American Society for Mass Spectrometry, 33, 242–250. [DOI] [PMC free article] [PubMed] [Google Scholar]
- 30.ISTODAX (Romidepsin) label – Food and Drug Administration (2009). Retrieved March 30, 2022, from. https://www.accessdata.fda.gov/drugsatfda_docs/label/2009/022393lbl.pdf
- 31.Reference ID: 3043460 – Food and Drug Administration (2011). Retrieved March 30, 2022, from. https://www.accessdata.fda.gov/drugsatfda_docs/label/2011/021991s002lbl.pdf
- 32.Reference ID: 3699607 - Food and Drug Administration (2015). Retrieved March 30, 2022, from. https://www.accessdata.fda.gov/drugsatfda_docs/label/2015/205353s000lbl.pdf
- 33.Beaufort CM, Helmijr JC, Piskorz AM, Hoogstraat M, Ruigrok-Ritstier K, Besselink N, Murtaza M, IJcken WFJ, Heine AAJ, Smid M, Koudijs MJ, Brenton JD, Berns EMJJ, & Helleman J (2014). Ovarian cancer cell line panel (OCCP): Clinical importance of in vitro morphological subtypes. Plos One, 9, e103988. [DOI] [PMC free article] [PubMed] [Google Scholar]
- 34.(2002–2022) Uniprot Consortium. https://www.uniprot.org/
- 35.Liu Q, Hao B, Zhang M, Liu Z, Huang Y, Zhao X, Zhao X, Hu H, Tan M, & Xu JY (2022). An integrative proteome-based pharmacologic characterization and therapeutic strategy exploration of SAHA in solid malignancies. Journal of Proteome Research, 21, 953–964. [DOI] [PubMed] [Google Scholar]
- 36.Bolden JE, Peart MJ, & Johnstone R W. (2006). Anticancer activities of histone deacetylase inhibitors. Nature Review Drug Discovery, 5, 769–784. [DOI] [PubMed] [Google Scholar]
- 37.Nolan L, Johnson PW, Ganesan A, Packham G, & Crabb SJ (2008). Will histone deacetylase inhibitors require combination with other agents to fulfil their therapeutic potential? British Journal of Cancer, 99, 689–694. [DOI] [PMC free article] [PubMed] [Google Scholar]
- 38.Bandolik JJ, Hamacher A, Schrenk C, Weishaupt R, & Kassack MU (2019). Class I-Histone Deacetylase (HDAC) inhibition is superior to pan-HDAC inhibition in modulating cisplatin potency in high grade serous ovarian cancer cell lines. International Journal of Molecular Sciences, 20, 3052. [DOI] [PMC free article] [PubMed] [Google Scholar]
Associated Data
This section collects any data citations, data availability statements, or supplementary materials included in this article.
Supplementary Materials
Data Availability Statement
The raw mass spectrometry data have been deposited to PRIDE with the dataset identifier PXD036467.