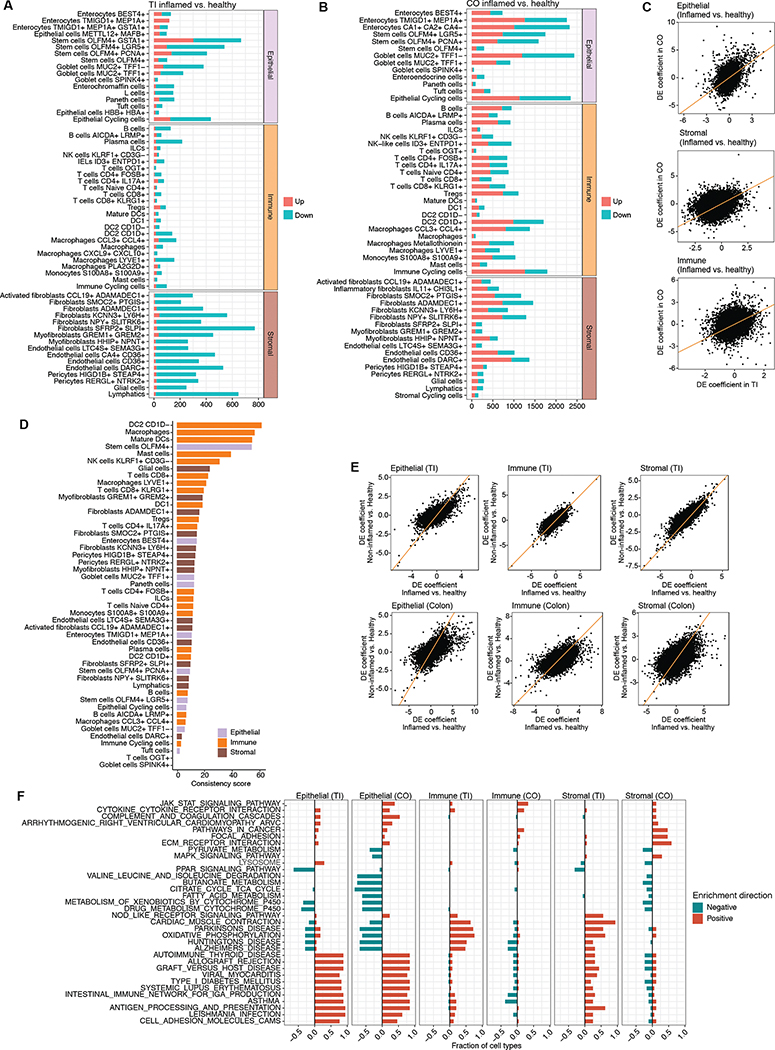
Figure 3. Location- and cell type-specific differential expression in active CD.
(A) Number of differentially-expressed genes between inflamed CD and healthy samples in TI, broken down by cell type (discrete component of a MAST model; FDR < 0.05). (B) Same as (A) but for colon. (C) Relationship between differential expression in TI and colon for each cell compartment. (D) Consistency score (Methods) of differential expression in inflammation for each common cell type between TI and CO. (E) Relationship between inflamed vs healthy and non-inflamed vs healthy samples in TI and colon within each cell compartment. (F) Fraction of cell types in which KEGG pathways are significantly enriched (FDR < 0.05; see Methods) within each compartment and location, split by enrichment direction (all pathway enrichment results in Table S5).

