Abstract
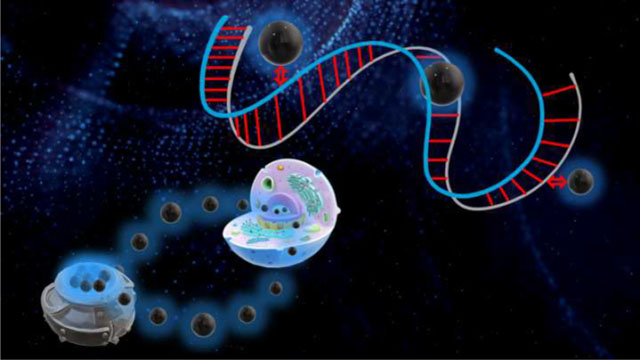
Nucleus targeting is tremendously important in cancer therapy. Cationic carbon dots (CCDs) are potential nanoparticles which might enter cells and penetrate nuclear membranes. Although some CCDs have been investigated in nucleus targeting and applied in nuclear imaging, the CCDs derived from drugs, that are able to target the nucleus, bind with DNA and inhibit the growth of cancer cells have not been reported. In this project, 1, 2, 4, 5-benzenetetramine (Y15, a focal adhesion kinase inhibitor) derived cationic carbon dots (Y15-CDs) were prepared via a hydrothermal approach utilizing Y15, folic acid and 1,2-ethylenediamine as precursors. Based on the structural, optical, and morphologic characterizations, Y15-CDs possess rich amine groups and nitrogen in structure, an excitation-dependent photoluminescence emission, and a small particle size of 2 to 4 nm. The DNA binding experiments conducted through agarose gel electrophoresis, UV-vis absorption, fluorescence emission, and circular dichroism spectroscopies, prove that Y15-CDs might bind with DNA via electrostatic interactions and partially intercalative binding modes. In addition, the cell imaging and cytotoxicity studies in human foreskin fibroblasts (HFF), prostate cancer (PC3) and osteosarcoma cells (U2OS) indicate the nucleus targeting and anticancer abilities of Y15-CDs. Most interestingly, Y15-CDs exhibit a higher cytotoxicity to cancer cells (PC3 and U2OS) than to normal cells (HFF), inferring that Y15-CDs might be potentially applied in cancer therapy.
Keywords: Cationic carbon dots; 1, 2, 4, 5-benzenetetramine; nucleus targeting; cancer therapy; DNA binding
Graphical Abstract
1. Introduction
Nanomedicine is a subsidiary nanotechnology that involves diagnosis, treatment and prevention of diseases [1]. Compared to conventional medicine, nanoparticles based treatment and diagnosis can improve the target specificity and decrease the cell/organ toxicity caused by side effects, which is of great importance in cancer therapy[2]. Raj et al. reviewed the effect of particle size and particle surface on bioimaging and cancer treatment, which suggested that the tumor-penetration ability of nanoparticles was inversely proportional to the size of the nanoparticles, and the hydrophilic surface of nanoparticles could minimize clearance by the macrophages in the reticuloendothelial system [3]. Thus, as the top priority in cancer therapy and cell imaging, cell membrane penetration and stability of nanoparticles in cells require the preparation of nanomaterials in perfect size and appropriate functional groups.
Carbon dots (CDs) are one type of emerging nanomaterials with particle size less than 10 nm. Since its discovery in 2000, they have been widely investigated in the bioimaging, drug delivery, biosensing and disease diagnosis because of their favorable properties including low toxicity, excellent optical properties, good water solubility, tunable surface, and high cell permeability [4–6]. The most common functional groups on the surface of CDs are amine, carboxyl, and hydroxyl groups, which can be introduced via covalent and noncovalent surface modifications to extend the applications and to achieve subcellular organelles recognition[7, 8]. Among the subcellular organelles, the nucleus contains most of the genetic materials and plays a vital role in DNA replication, ribosome and mRNA synthesis, and gene expression. Nucleus labeling and targeting are beneficial for cell growth study and cancer therapy [9]. Song et al. conjugated trans-activator of transcription (TAT) peptide to the carboxyl groups of CDs synthesized by using amino acid and formic acid as precursors. The obtained TAT-CDs could be a nuclear targeting tool for live cells imaging via entering into cellular and binding with nuclei [10]. Yang et al. functionalized CDs with a nuclear localization signal (NLS) peptide and employed them to transport doxorubicin (DOX). The in vitro cytotoxicity and in vivo therapeutic efficacy showed that the conjugate, NLS-CDs-DOX, exhibited an enhanced ability to inhibit cell/tumor growth compared with free DOX [11]. However, except for modifications as mentioned above, most reported naked CDs carry negative charges and just remain in the cytoplasm after internalization through diffusion and endocytosis [8]. This can be explained by the characteristics of the nucleus and the properties of CDs. Although the diameter of the nuclear pore, which is the only known gateway between the nucleus and the cytoplasm, is about 30–40 nm, the selectivity of the nuclear pore complex and electric repulsions between CDs and the nuclear membrane would significantly decrease the nuclear pore permeability regarding CDs [12, 13]. Herein, the synthesis of cationic CDs (positively charged CDs) becomes a trend for nucleus targeting.
Cationic CDs (CCDs) have a large number of positively charged surface functional groups that might attract the negatively charged cell and nuclear membranes, promoting the CCDs to enter the cells and permeate the nucleus membranes [14]. Currently, many precursors containing amine groups such as polyethylenimine (PEI), polylysine, glycine and phenylenediamine have been successfully applied for CCDs syntheses [15–18]. For example, using m-phenylenediamine and p-aminobenzoic acid as precursors, Zhang et al. prepared the nitrogen-doped CDs with a zeta potential of +25.2 mV which could be used for nucleolus-orientation imaging [19]. Gao et al. synthesized fluorine-doped CDs that derived from 3,3,4,4,5,5,6,6,7,7,8,8,8-tridecafluoro-1-octanol and PEI. It was proved that such fluorine-doped CDs with a zeta potential of +1.89 mV provided an intrinsic nucleus targeting ability for drug and dye delivery [15]. To investigate whether CCDs could be a cell cycle probe, F and N co-doped CDs (FNCDs) utilizing glycine and 2,4-difluorebenzoic acid as precursors were designed by Qu’s group. The cell imaging in 4T1 cells suggested that the whole process of cell division could be observed when FNCDs (zeta potential of +6 mV) were used as a probe to monitor living cells [20]. Thus, CCDs might have strong capabilities of nucleus targeting, and DNA and RNA interactions. However, there are very few publications that focus on the mechanism of interaction between CCDs and DNA. Moreover, regarding the cancer therapy, the CCDs prepared from anticancer drugs and their effects on cell growth in both cancer and normal cells have not been reported.
1, 2, 4, 5-benzenetetramine (Y15), a focal adhesion kinase (FAK) inhibitor which is able to inhibit cancer growth in vitro and in vivo [21–23], is promising in CCDs preparation owing to four amino groups. In our study, Y15 derived cationic carbon dots (Y15-CDs) were firstly synthesized via a hydrothermal method using Y15, folic acid (FA) and 1,2-ethylenediamine (EDA) as precursors. The physiochemical parameters of Y15-CDs were characterized by UV-vis absorption, fluorescence, Fourier-transform infrared (FTIR) and X-ray photoelectron (XPS) spectroscopies, atomic force microscopy (AFM), transmission electron microscopy (TEM), zeta potential measurements and thermogravimetric analysis (TGA). To evaluate the efficacy of Y15-CDs binding with DNA and investigate the interaction mechanisms, an agarose gel electrophoresis assay, UV-vis absorption, fluorescence emission and circular dichroism spectra detection as well as cyclic voltammetry measurements were performed. The result of Y15-CDs-DNA complexes were compared with that of Y15-CDs alone or naked DNA. Thereafter, in vitro imaging and cytotoxicity of Y15-CDs in human foreskin fibroblasts (HFF), prostate cancer (PC3) and osteosarcoma cells (U2OS) were conducted to study the distribution of Y15-CDs in different cells and the effects of Y15-CDs on growth of both cancer and normal cells.
2. Experimental sections
2.1. Materials and reagents
1,2-ethylenediamine (EDA, ≥ 99%) was purchased from Thermo Scientific (Waltham, MA, USA). 1,2,4,5-benzenetetramine tetrahydrochloride (Y15, ≥ 95%), folic acid (FA, ≥ 97%), calf thymus sonicated DNA, thiazolyl blue tetrazolium bromide (MTT) and DAPI were ordered from Sigma-Aldrich (St Louis, MO, USA). The deionized (DI) water was purified using a Modulab 2020 water purification system from Continental Water System Corporation. (San Antonio, TX, USA). The resistivity and surface tension of DI water were 18.2 MΩ.cm and 72.6 mN·m−1, respectively at 22 °C. All reagents were used without further modification.
2.2. Instrumentations
The UV-vis absorption spectra were obtained from a Cary 100 UV/vis spectrophotometer (Agilent Technologies, USA). The fluorescence emission spectra were conducted by a Fluorolog-3 fluorometer (Horiba Jobin Yvon, USA). The quartz cells with a pathlength of 1 cm were used in UV-vis and fluorescence emission spectra detection. FTIR spectra were recorded using a PerkinElmer Fourier-transform infrared spectrometer (Frontier, PerkinElmer, USA) equipped with Smart Orbit attenuated total reflectance accessories (Thermo Scientific, USA). The zeta potential measurement was performed on a nano series Malvern Zetasizer (Malvern Panalytical, USA). The morphologies of CDs were investigated via a 5420 atomic force microscope (AFM) (Agilent Technologies, USA) by using the taping mode and a 1200X transmission electron microscope (TEM) (JEOL, USA). TGA was performed on a TG 209 F3 Tarsus thermo-microbalance (Netzsch, USA) under the protection of nitrogen at a flow rate of 10 mL/min. The heating temperature ranged from 40 to 1000 °C at a rate of 10 °C/min. XPS spectra were measured by a PHI 5000 Versa Probe (Physical Electronics, Chanhassen, MN) scanning X-ray photoelectron spectrometer equipped with a monochromatic Al K-alpha X-ray source (1486.6 eV, 15 kV, and 1 mA). Circular dichroism spectra were obtained from the J-810 spectropolarimeter (JASCO, Japan) within 200 to 340 nm with a scanning speed of 200 nm/min using 1 cm quartz cells. Cell imaging was performed on a fluorescence BX61 microscope (Olympus, USA) equipped with Nomarski differential interference contrast [DIC] optics, a 100× objective and a Roper Cool-SNAP HQ camera. Electrochemical measurements were conducted using a PARSTAT 3000A potentiostat (Ametek Scientific Instruments, USA).
2.3. Synthesis of Y15-CDs
The Y15-CDs were synthesized via hydrothermal approach. 10 mg of FA, 50 mg of Y15 and 30 μL of EDA were dissolved in 10 mL of DI water by stirring for one hour. Then the solution was transferred into a 20 mL Teflon-lined autoclave and heated at 180 °C for 8 h. After cooling down to the room temperature, the solution was centrifuged twice with 9000 rpm at 4 °C for 20 min to remove large particles. The supernatant was filtered through 0.2 μm filter membrane and dialyzed in a 100–500 Da MW cutoff dialysis tube for 3 days against DI water to eliminate the unreacted precursors. The water was changed every 24 h. Finally, the obtained Y15-CDs solution was lyophilized. A similar protocol was followed to synthesize the FA-EDA composite with only FA and EDA as the precursors.
2.4. Agarose gel electrophoresis experiment
The binding ability of Y15-CDs with DNA was evaluated through agarose gel electrophoresis analysis. Y15-CDs and DNA were mixed at various mass ratios (0.5:1, 1:1, 2:1, 5:1, 10:1) and incubated at the room temperature for 30 min. The obtained solutions were loaded on a 1.5 % (W/V) agarose gel containing ethidium bromide (EB) and run for 45 min at 120 V in TAE buffer. The results of bands were observed using the BioRad-image lab software with UV light.
2.5. Investigation of DNA binding mechanisms
The binding mechanisms between Y15-CDs and DNA were explored by UV-vis, fluorescence, and circular dichroism spectroscopies. Briefly, the UV-vis spectra of DNA, Y15-CDs and Y15-CDs-DNA complexes were measured in the range of 200–800 nm. For Y15-CDs-DNA complexes formation, the concentration of Y15-CDs was fixed at 20 μg/mL while the concentration of DNA was increased from 5 to 25 μg/mL with an interval of 5 μg/mL. The fluorescence emission spectra of Y15-CDs and Y15-CDs-DNA complexes were monitored. Similar with UV-vis measurement, different concentration of DNA (0.5, 1.0, 1.5, 2.0 and 2.5 μg/mL) was added to 2 μg/mL of Y15-CDs to form Y15-CDs-DNA complexes. Then, an ethidium bromide (EB) competitive experiment was performed. 0.5 μg/mL of EB was added in 1 μg/mL DNA solution to form EB-DNA complexes through intercalative binding mode. Subsequently, different concentrations of Y15-CDs (0.5, 1.0, 1.5 and 2.0 μg/mL) were separately added to the solution and the photoluminescence (PL) was recorded via fluorescence spectrometer at 510 nm excitation wavelength. The circular dichroism spectra of naked DNA (50 μg/mL), Y15-CDs (200 μg/mL), and the Y15-CDs-DNA solution composed of 50 μg/mL DNA with addition of 0, 20, 50, 100 and 200 μg/mL of Y15-CDs were acquired in the range of 200 to 340 nm. The DNA-binding cyclic voltammograms experiments of Y15-CDs (10 μg/mL) were performed by addition of DNA (0, 5, 10, 20, and 40 μg/mL) and were recorded with a scan rate of 50 mV s−1. The experiments were conducted in H2O using 0.1 M NaCl as supporting electrolyte, in a 3-electrode setup using glassy carbon (GC) electrode as working electrode, Ag/AgCl as reference electrode, and a Pt wire as a counter electrode. All experiments were reproduced three times. All inflection (Epi) potential values were calculated using the first derivative of the reduction curve for more accurate approximation of true potential values.
2.6. In vitro cell imaging
U2OS cells were seeded in 300 μL Dulbecco’s modified Eagle medium (DMEM) containing 10% FBS and 1% penicillin-streptomycin in each well (8-well chamber slide) with a density of 1.5 × 10⁴ cells/well and incubated at 37°C for 24 h. Then, the medium was replaced by fresh DMEM medium with 1 mg/mL of Y15-CDs. After incubation for 30 min, the cells were washed with phosphate-buffered saline (PBS) solution 3 times, fixed with 4% paraformaldehyde (PFA) for 15 min at room temperature. Subsequently, the PFA was discarded. The cells were rinsed with PBS 3 times, and stained by 1 μg/ml DAPI for 10 min. Finally, the cells were washed with PBS 3 times again after the removal of DAPI solution, pre-dropped with mounting medium, and covered by Gold SealTM Cover Glass lids for cell imaging.
HFF cells were seeded in a 12-well plate with a coverslip in each well and the density of cells was 2 × 10⁴ cells/well. After incubation in 1 mL of medium which was a mixture of Ham’s F10 and DMEM (1:1) for 24 h, the medium was replaced by 1 mg/mL of Y15-CDs in fresh Ham’s F10 and DMEM medium and incubated for another 30 min. The cells were rinsed with PBS solution 3 times, fixed with 4% PFA and washed with PBS solution again. Then, the cells were stained with 1 μg/ml of DAPI for 10 min. After 3 times of PBS rinsing, the cells were mounted for further imaging. The PC3 cells that seeded in a 35 mm glass-bottom dishes in 1 mL Roswell Park Memorial Institute (RPMI) medium with a density of 5 × 10⁴ cells/well, were treated with the same method as HFF cells.
2.7. In vitro cytotoxicity experiments
The cytotoxicity of Y15, Y15-CDs and FA-EDA were evaluated by an MTT assay at the concentration of 0, 2.34, 4.69, 9.38, 18.75, 37.5, 75, 150 and 300 μM. In detail, the U2OS cell line was cultured in a DMEM medium (10% of FBS and 1% of penicillin-streptomycin) and seeded in a 96-well plate with the density of 4 × 10³ cells per well. The medium in each well was set at 200 μL. After incubation for 24 h at 37 °C, the cells were treated with fresh DMEM medium containing 0, 2.34, 4.69, 9.38, 18.75, 37.5, 75, 150 and 300 μM of Y15, Y15-CDs and FA-EDA for 72 h, individually. 20 μL of 3-(4,5-dimethyl-2-thiazolyl)-2,5-diphenyl-2H-tetrazolium bromide (MTT, 5 mg/mL) was added and further incubated for 4 h. Subsequently, the supernatant was discarded, and 150 μL of DMSO was added. When the purple formazan crystals were completely dissolved, the absorbance of each well was measured using a Tecan Microplate Reader at 595 nm.
HFF cells were treated by similar procedure to U2OS cells, except that the DMEM medium was changed to a mixture of Ham’s F10 and DMEM medium at the ratio of 1:1. The absorption was also acquired at 595 nm. For PC3 cells, the medium was RPMI containing 10% FBS and 1% penicillin-streptomycin. After incubation for 24 h and treatment by Y15, Y15-CDs and FA-EDA solutions, the absorption of each well at 570 nm was obtained using a Molecular Devices SpectraMax i3x plate reader. The wells only contain DMEM, a mixture of Ham’s F10 and DMEM, or RPMI medium without cells were considered as blank, while the cells only incubated in Ham’s F10 and DMEM, or RPMI medium without Y15, Y15-CDs and FA-EDA were regarded as control groups. Relative cell viability (%) was calculated by eq 1:
| eq 1 |
3. Results and discussion
3.1. Characterizations of Y15-CDs
The optical properties of Y15-CDs were studied by UV-vis absorption and fluorescence emission spectroscopies. UV-vis absorption spectra in Figure 1A shows two characteristic absorption bands at 280 and 357 nm in FA, which can be assigned to π-π* and n-π* transitions, respectively [24, 25]. The π-π* transitions of benzene ring and π conjugate systems in the Y15 structure were observed at 265 and 388 nm, respectively. After the formation of CDs, the π-π* band at 280 nm shifted to 274 nm and a band related to a high π conjugate system appeared in the range of 400 to 500 nm. The fluorescence emission spectra in Figure 1B display the photoluminescence (PL) characterization of Y15-CDs. As revealed, Y15-CDs possess an excitation-dependent PL emission. When the excitation wavelength increased from 350 to 500 nm, the intensity of emission peak increased to the maximum and then decreased. The maximum emission peak was found to be 455 nm which is a blue fluorescence under an excitation wavelength of 375 nm. Interestingly, when the excitation wavelength was set as above 425 nm, the PL emission peak was observed at around 570 nm that represents the green fluorescence. To investigate whether the green fluorescence is produced by energy transfer within Y15-CDs nanoparticles, the measurement of excitation spectra of Y15-CDs for the emission at 455 and 570 nm were conducted and compared with emission spectra. The results in Figure S1 show that the highest peak in excitation spectra of Y15-CDs under an emission wavelength of 570 nm appears at 400 nm, which is lower than 455 nm, demonstrating that there is no energy transfer occurring in Y15-CDs. The dual fluorescence emission might be owing to the surface state, core structure or size effect of Y15-CDs. Consequently, Y15-CDs were demonstrated to exhibit two fluorescence emissions, blue or green fluorescence under different excitation wavelengths, which benefits the cell imaging by reducing the interference of autofluorescence from cells and distinguishing Y15-CDs from DAPI by using the green fluorescence channel on a fluorescence microscope.
Figure 1.
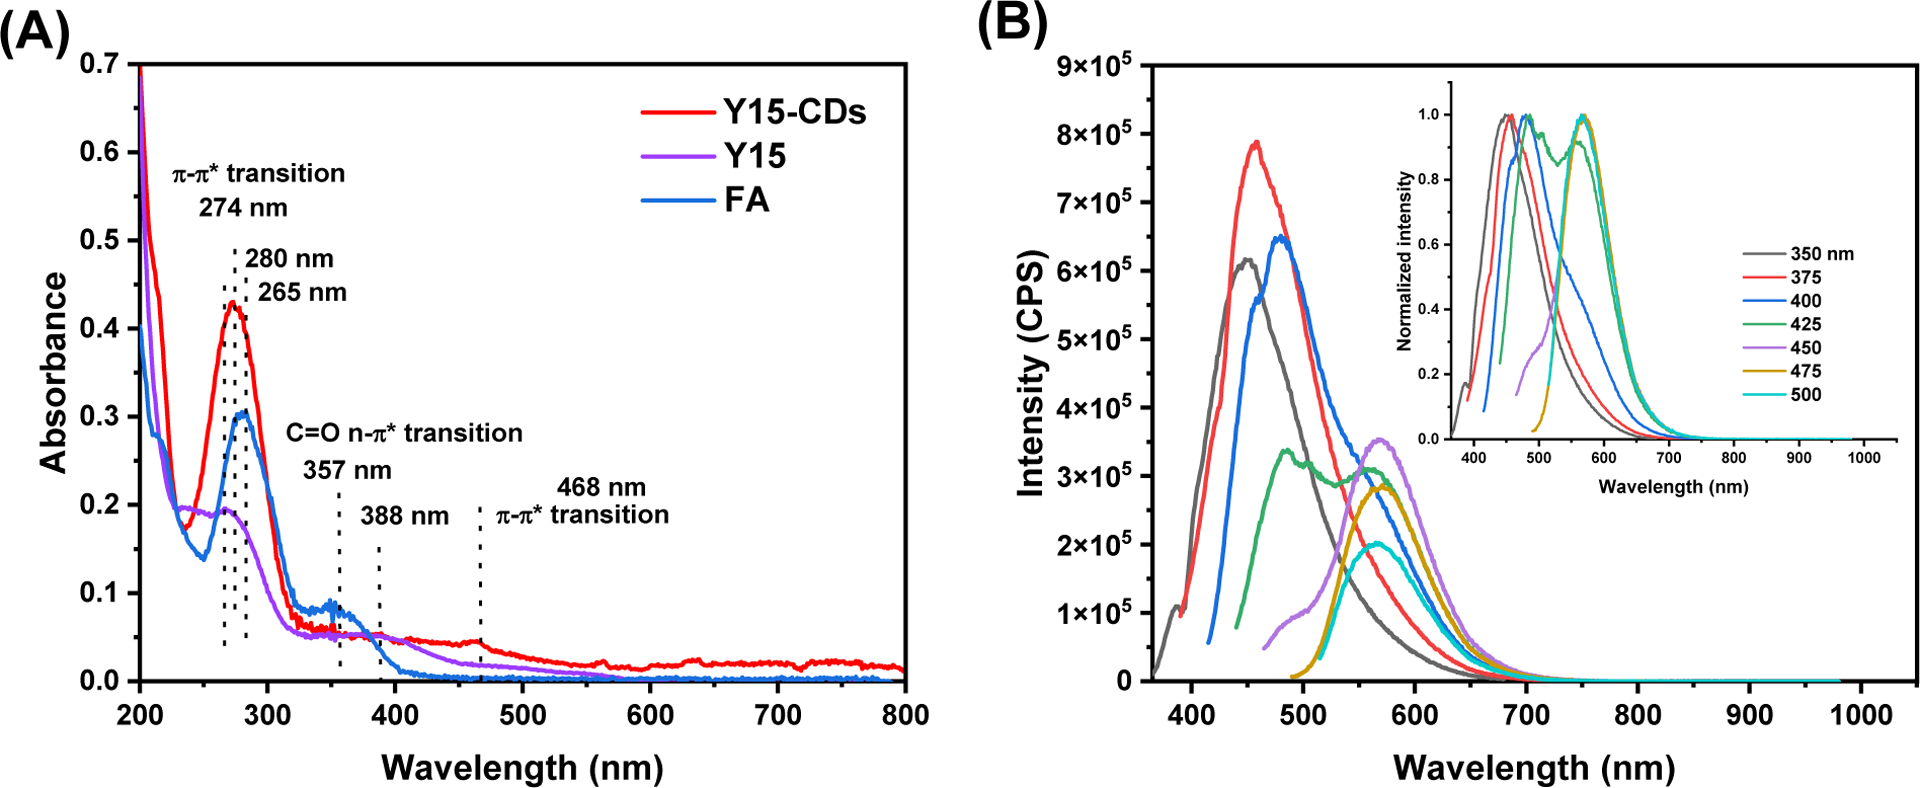
(A) UV-vis spectrum of FA (10 μg/mL), Y15 (10 μg/mL) and Y15-CDs (50 μg/mL) and (B) fluorescence spectrum of Y15-CDs (2.5 μg/mL). Inset are the normalized fluorescence spectra.
FTIR spectra measurement was performed to identify the functional groups of Y15-CDs. As shown in Figure 2 and Table S1, Y15 exhibits a typical aromatic amine N-H stretching band at 3099 – 2797 cm−1 and a C-N stretching band at 1220 cm−1 [26]. The peaks at 1596 and 1498 cm−1 can be ascribed to C-H and N-H bending vibrations, respectively. All these bands were observed in the FTIR spectrum of Y15-CDs, indicating that Y15 actively participated in the synthesis of Y15-CDs and residual structures of Y15 might be found in formed Y15-CDs. For EDA, which is one of the precursors to provide more amine groups on the carbon dots, shows two characteristic peaks at 3361 and 3282 cm−1 that are attributed to the asymmetric and symmetric N-H stretching vibrations from primary amines, respectively. Regarding the FA, the N-H stretching bands related to amine groups were also found in the range of 3542 to 3348 cm−1. With these bands as references, the broad peak from 3630 to 3099 cm−1 in Y15-CDs spectrum can be assigned to N-H stretching vibrations. It is evidence that Y15-CDs contain plenty of amine groups derived from precursors. The peaks ranging from 3099 to 2426 cm−1 can be ascribed to the C-H stretching vibrations. Compared with FA, the C=O stretching peak in the spectrum of Y15-CDs shifted from 1684 cm−1 to 1670 cm−1. This 1670 cm−1 peak corresponds to C=O stretching of amides, referring to the amide bonds from the interaction between the carboxyl groups of FA and the amine groups of other two precursors. The peak at 1286 cm−1 in Y15-CDs is due to C-N stretching vibrations. Furthermore, Y15-CDs expose a unique peak around 2055 cm−1 which is normally related to C=C=C or C=C=N stretching.
Figure 2.
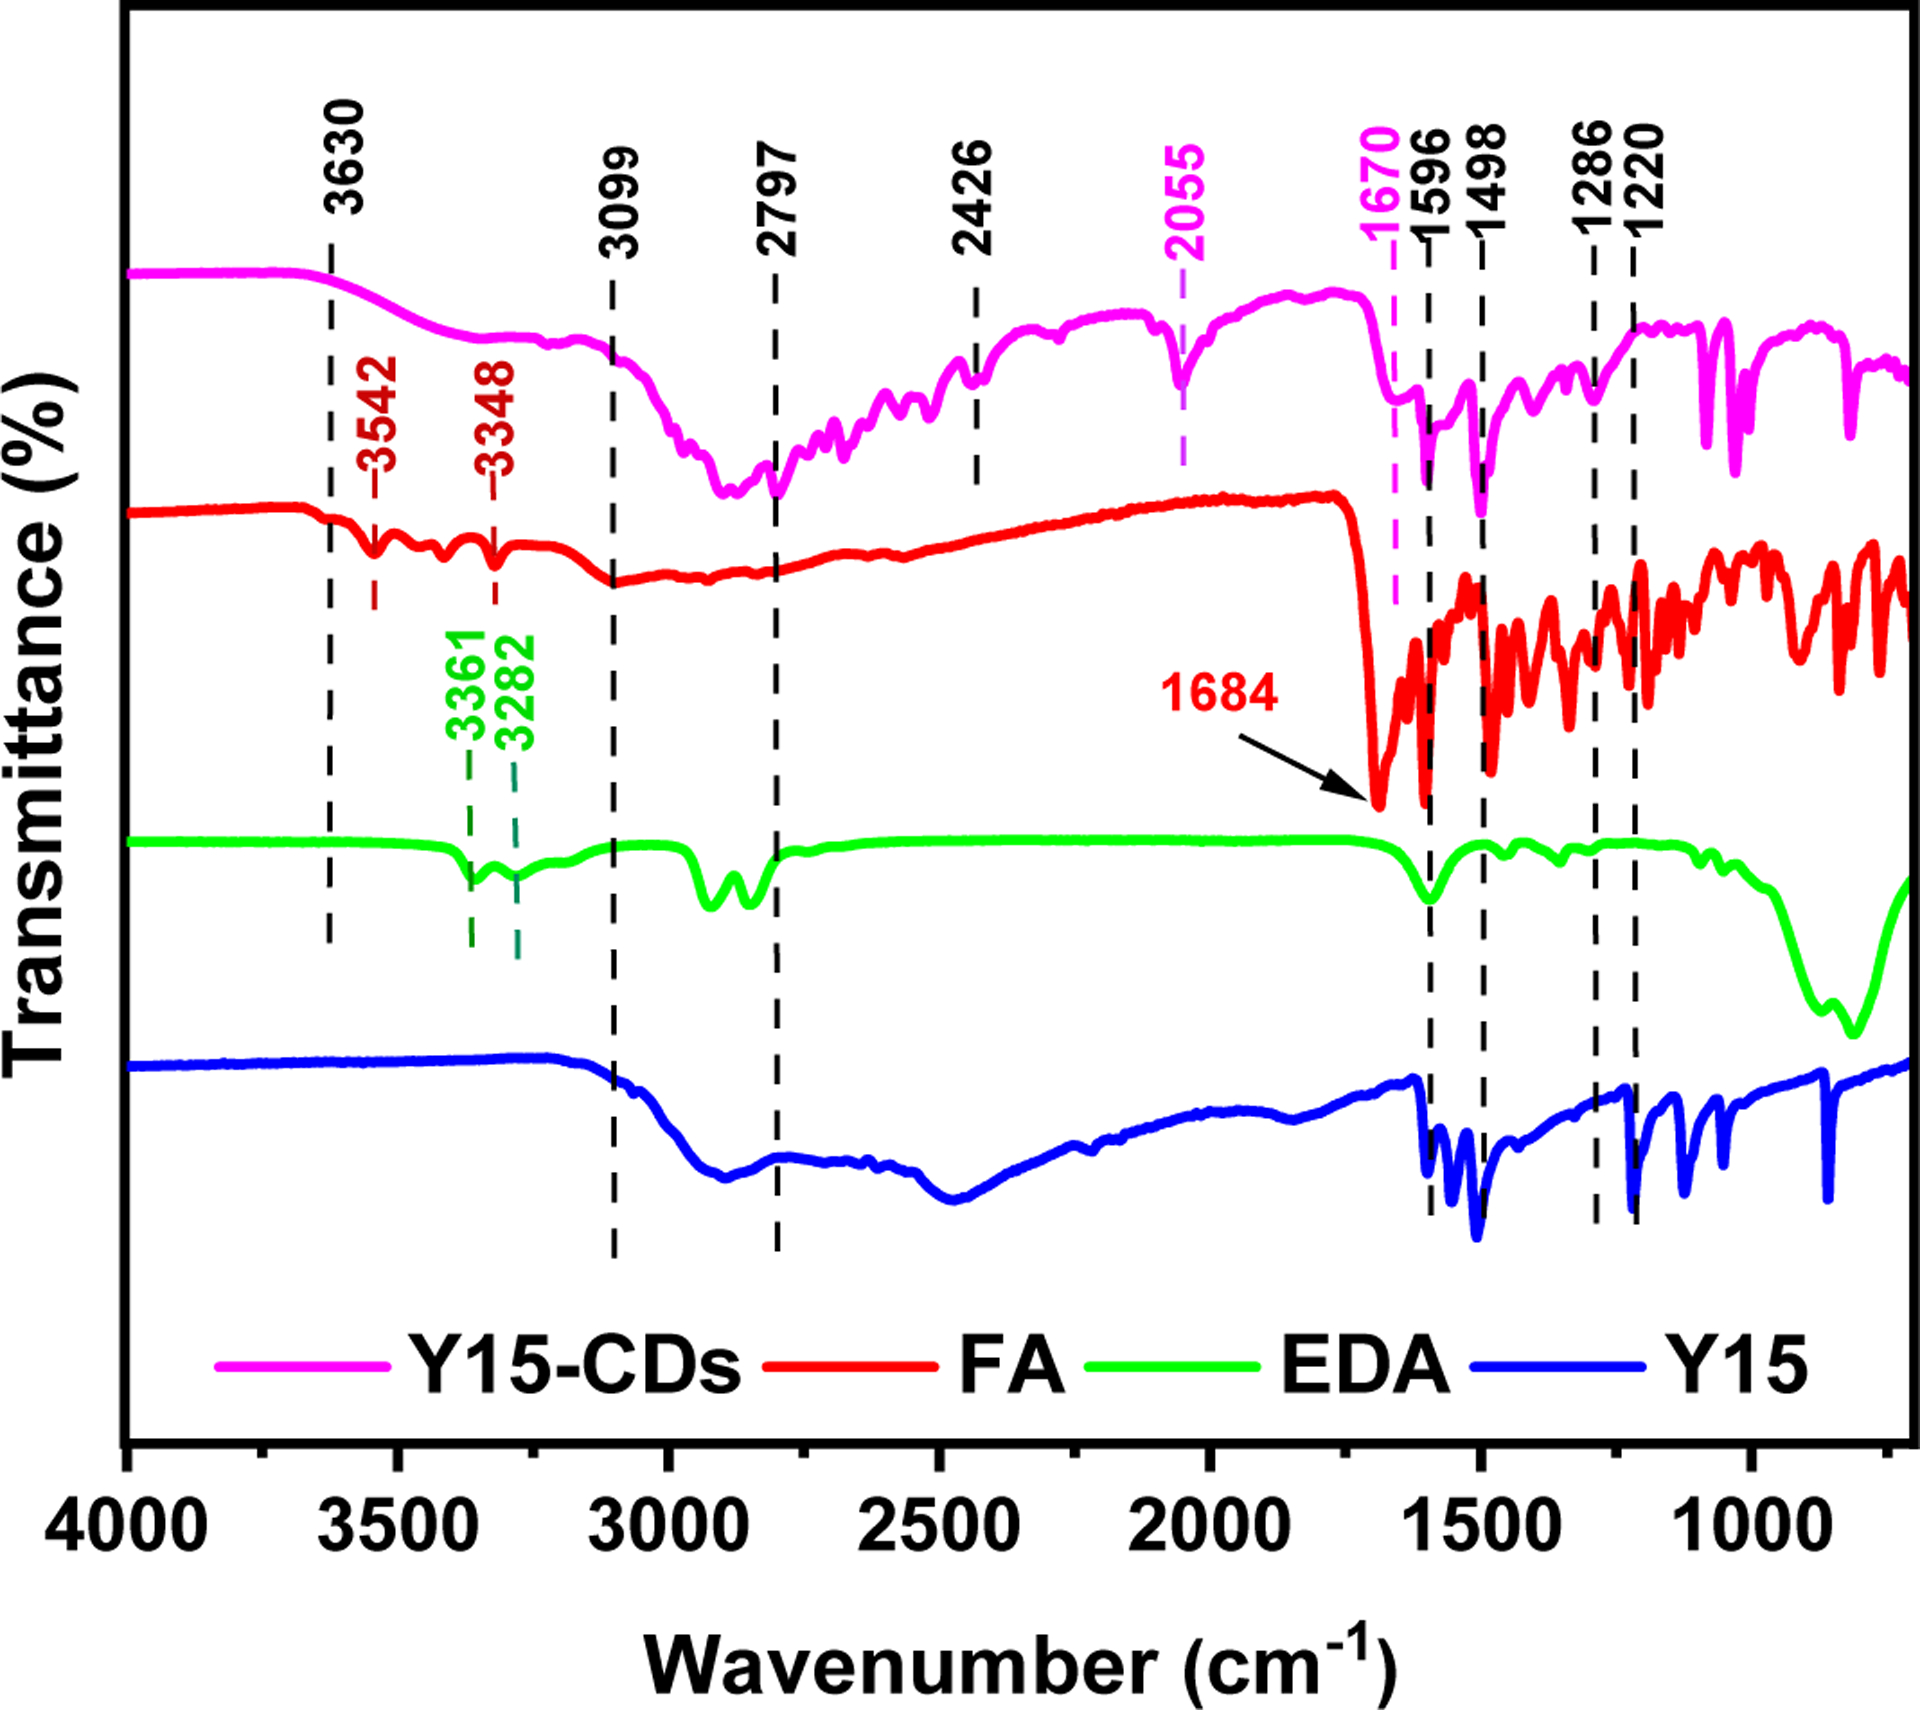
FTIR spectra of FA, EDA, Y15 and Y15-CDs.
The thermal stability and the structure of Y15-CDs were further investigated by TGA and derivative thermogravimetric analysis (DTG), which are shown in Figure 3A and Figure 3B, respectively. All the precursors exhibit the evaporation of water molecules and weak hydrogen bonds breaking at 40–110 °C [27]. When the temperature increased to 142 °C was decreased to 0. Considering that the boiling point of EDA is around 116 °C, it is regarded as evaporation of EDA compounds. The decomposition of -NH2 groups and benzene structure in Y15 were found at 110–323 °C with a mass loss of 34.4 % and at 323–566 °C with a mass loss of 40.7%, respectively. For FA, the obvious mass loss of 38.7 % at 110–444 % can be ascribed to the decomposition of -NH2, C=O and -COOH functional groups. The completed decomposition of remained -CH-CH-, -C=N- and -C=C- bonds was achieved at 657 °C.
Figure 3.
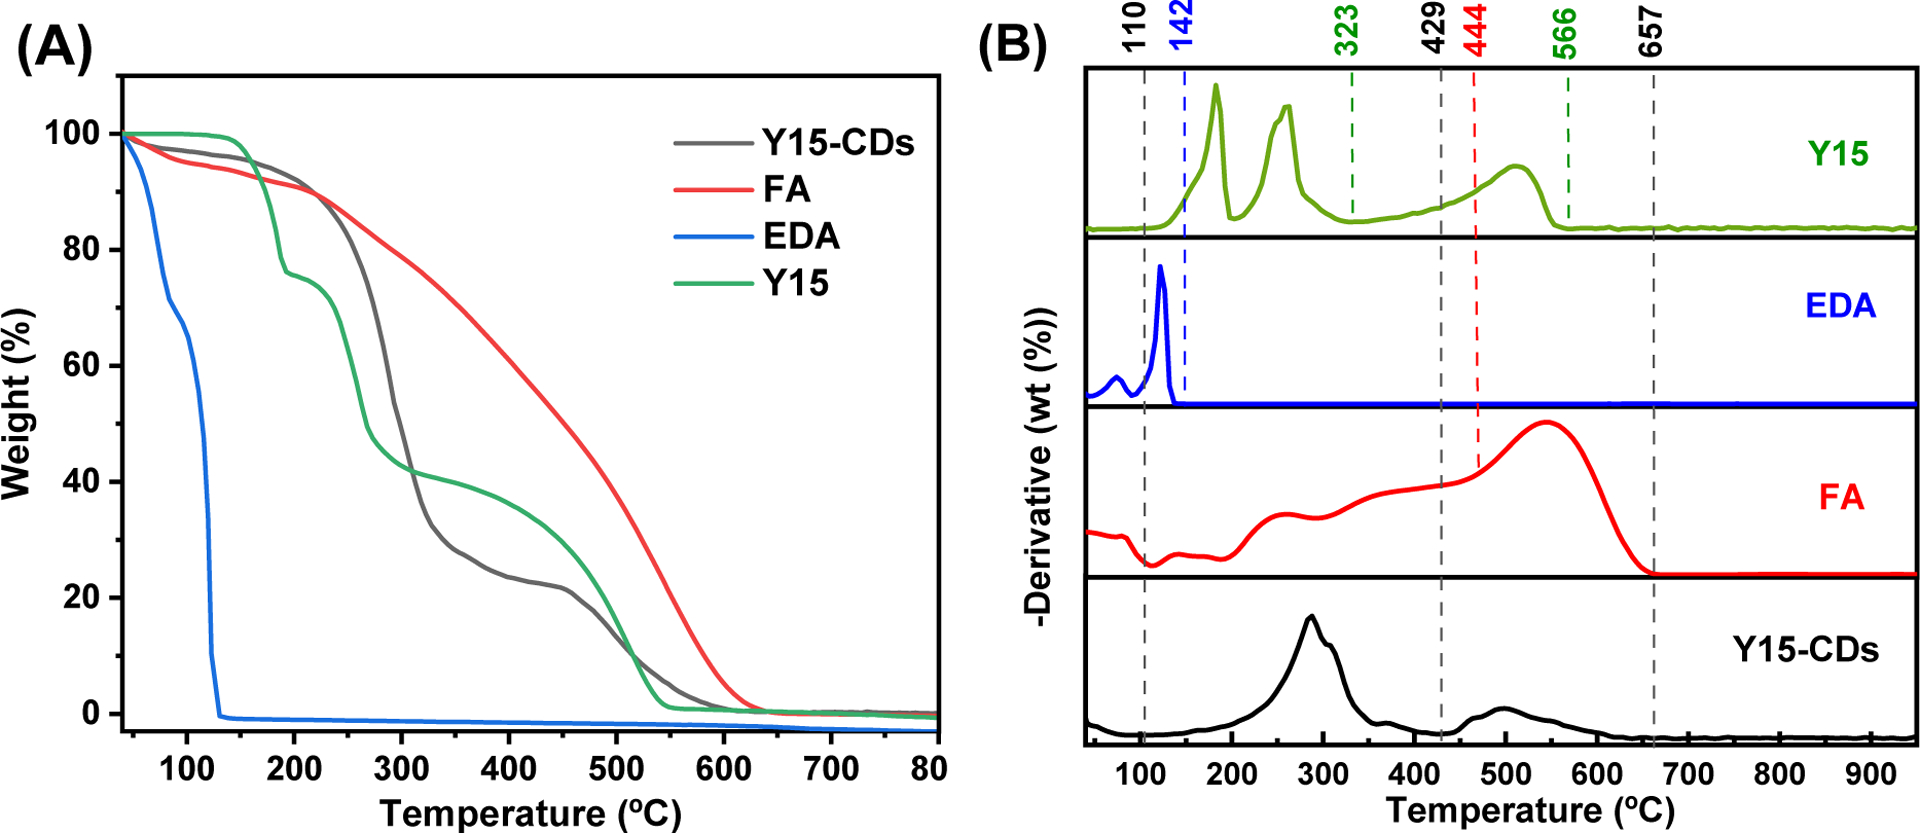
(A) TGA and (B) DTG of FA, EDA, Y15 and Y15-CDs.
Using the above TGA and DTG data as references, the decomposition of Y15-CDs can be divided into three stages (Table S2). Similar with precursors, the first stage at 40 to 110 °C involves the evaporation of water molecules absorbed on the surface of Y15-CDs and weak hydrogen bonds breaking within Y15-CDs, which led to a mass loss of around 3.68 %. The main decompositions occurred in the second stage at 110–429 °C with a 74.05 % weight loss due to the decomposition of oxygen-containing functional groups, including carboxyl, ketone, and amine groups [27–29]. With the temperature increased to above 429 °C, the reminant of Y15-CDs was completely decomposed at 640 °C. This third stage demonstrates that Y15-CDs possess a relatively thermally stable carbon core of 22.27% by mass. Based on the precursors, the core of Y15-CDs might be composed of -CH=CH-, -C=N- and -C-C- bonds.
The XPS spectra and main XPS features that reveal the functionalities and elemental compositions of the as-prepared Y15-CDs are presented in Figure 4 and Table S3, respectively. The elemental compositions of Y15-CDs include oxygen (19 %), nitrogen (14%) and carbon (67 %). As shown in high-resolution XPS spectra in Figure 4A, the C1s can be deconvoluted into three peaks at 284.7, 285.5 and 287.2 eV which are ascribed to C=C/C−C, C-O/C-N, and C=O/C=N bonds, respectively. The contents of C=C/C−C, C-O/C-N, and C=O/C=N bonds are 49%, 29 % and 20 %, respectively. The percentage of carboxyl groups measured at 290.6 eV is around 2 %. The high-resolution spectra of O1s in Figure 4B show three peaks at 531.1, 532.7 and 535.3 eV attributed to -OH, C=O and -COOH, respectively [9, 30]. Among them, there are more -OH (80 %) than C=O (17 %) and -COOH (3 %). In the N1s spectra (Figure 4C), the N6 (pyridinic nitrogen) at 396.6 eV, NQ (graphitic nitrogen) at 400.8 eV and N5 (pyrrolic nitrogen)/NH2 residues at 399.4 eV were observed, suggesting the presence of graphitic domains and aromatic clusters in Y15-CDs [31–34]. The calculation data in Table S3 displays that the percentage of N6 (42 %) and NQ (39 %) are higher than that of N5/NH2 residues (19 %).
Figure 4.

High-resolution XPS spectra of (A) C1s, (B) O1s and (C) N1s of Y15-CDs.
A mechanism hypothesis of Y15-CDs formation based on XPS and FTIR analyses is provided in Figure 5. Two routes are proposed regarding FA and Y15 as key reactants. Y15 is able to complete self-condensation through the imine derivatives that would react with each other via pericyclic reactions to form nitrogen doped condensed aromatic domains. These aromatic domains can stack together and produce the core of the Y15-CDs. The reactions involving FA are accounted for the core pattern. To be specific, the pattern is acquired due to the amide bonds formed through the reactions between the amine groups in Y15, EDA, and carboxylic functionalities of FA. Species such as 2-3-4 and 8-9 which could undergo intramolecular cyclization are candidates to form pyridinic, graphitic, and pyrrolic structures (6-7-11). The species formed reasonably would decorate the shell of Y15-CDs via a Lerf model [35] through covalent bonds under the hydrothermal synthesis approach.
Figure 5.
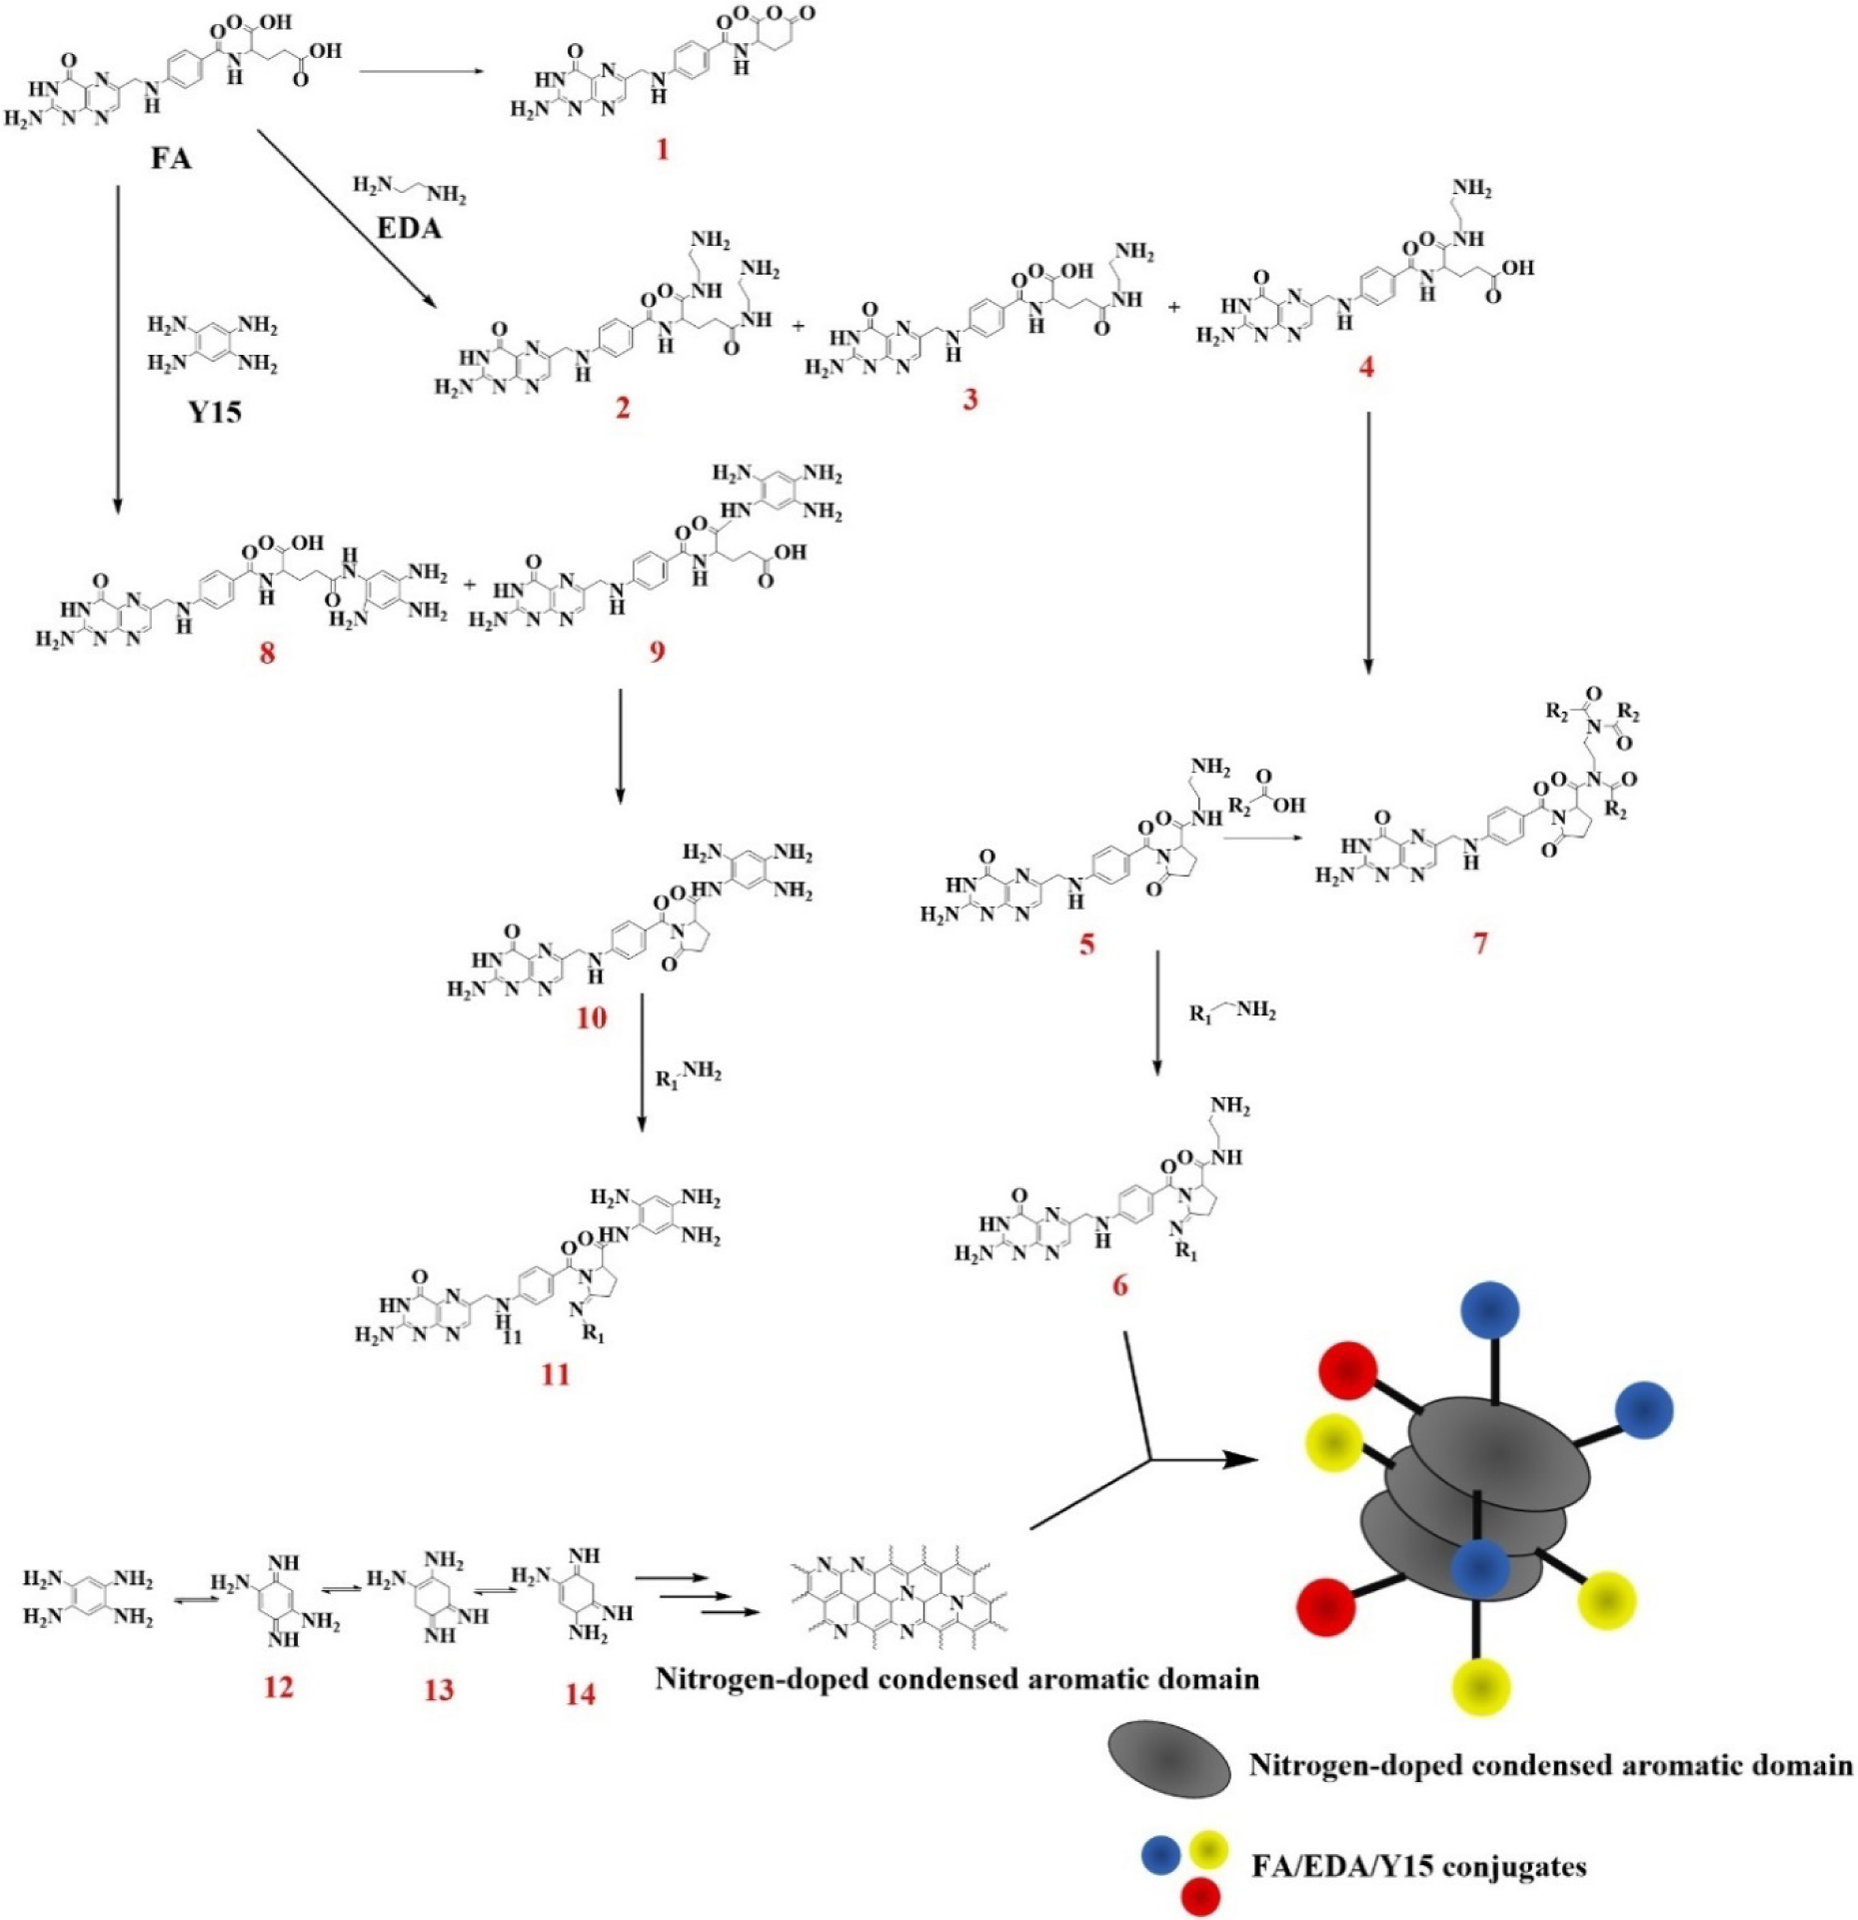
A hypothetical mechanism of Y15-CDs formation.
From above characterizations and analyses, Y15-CDs have a high content of nitrogen and amine groups, which is typical in positively charged CDs. To investigate such properties, the zeta potential of Y15-CDs was detected. The data in Figure S2 demonstrates that the as-prepared Y15-CDs exhibit a positive zeta potential of +19.20 ± 1.74 mV, which suggests the potential ability of Y15-CDs to bind with negatively charged DNA and cell/nuclear membrane via electrostatic interactions.
The morphology of Y15-CDs was characterized via AFM and TEM. As shown in Figure 6, the mean particle sizes of Y15-CDs along the z-axis are 2 nm (Figure 6A) and along the x-y plane are around 3.5 nm (Figure 6B and Figure 6C) by counting 300 dots. Taken together, Y15-CDs are considered as ellipse-shape nanoparticles. The mass spectrum of Y15-CDs in Figure S3 suggests the molecular weight of Y15-CDs is around 656 g/mol.
Figure 6.
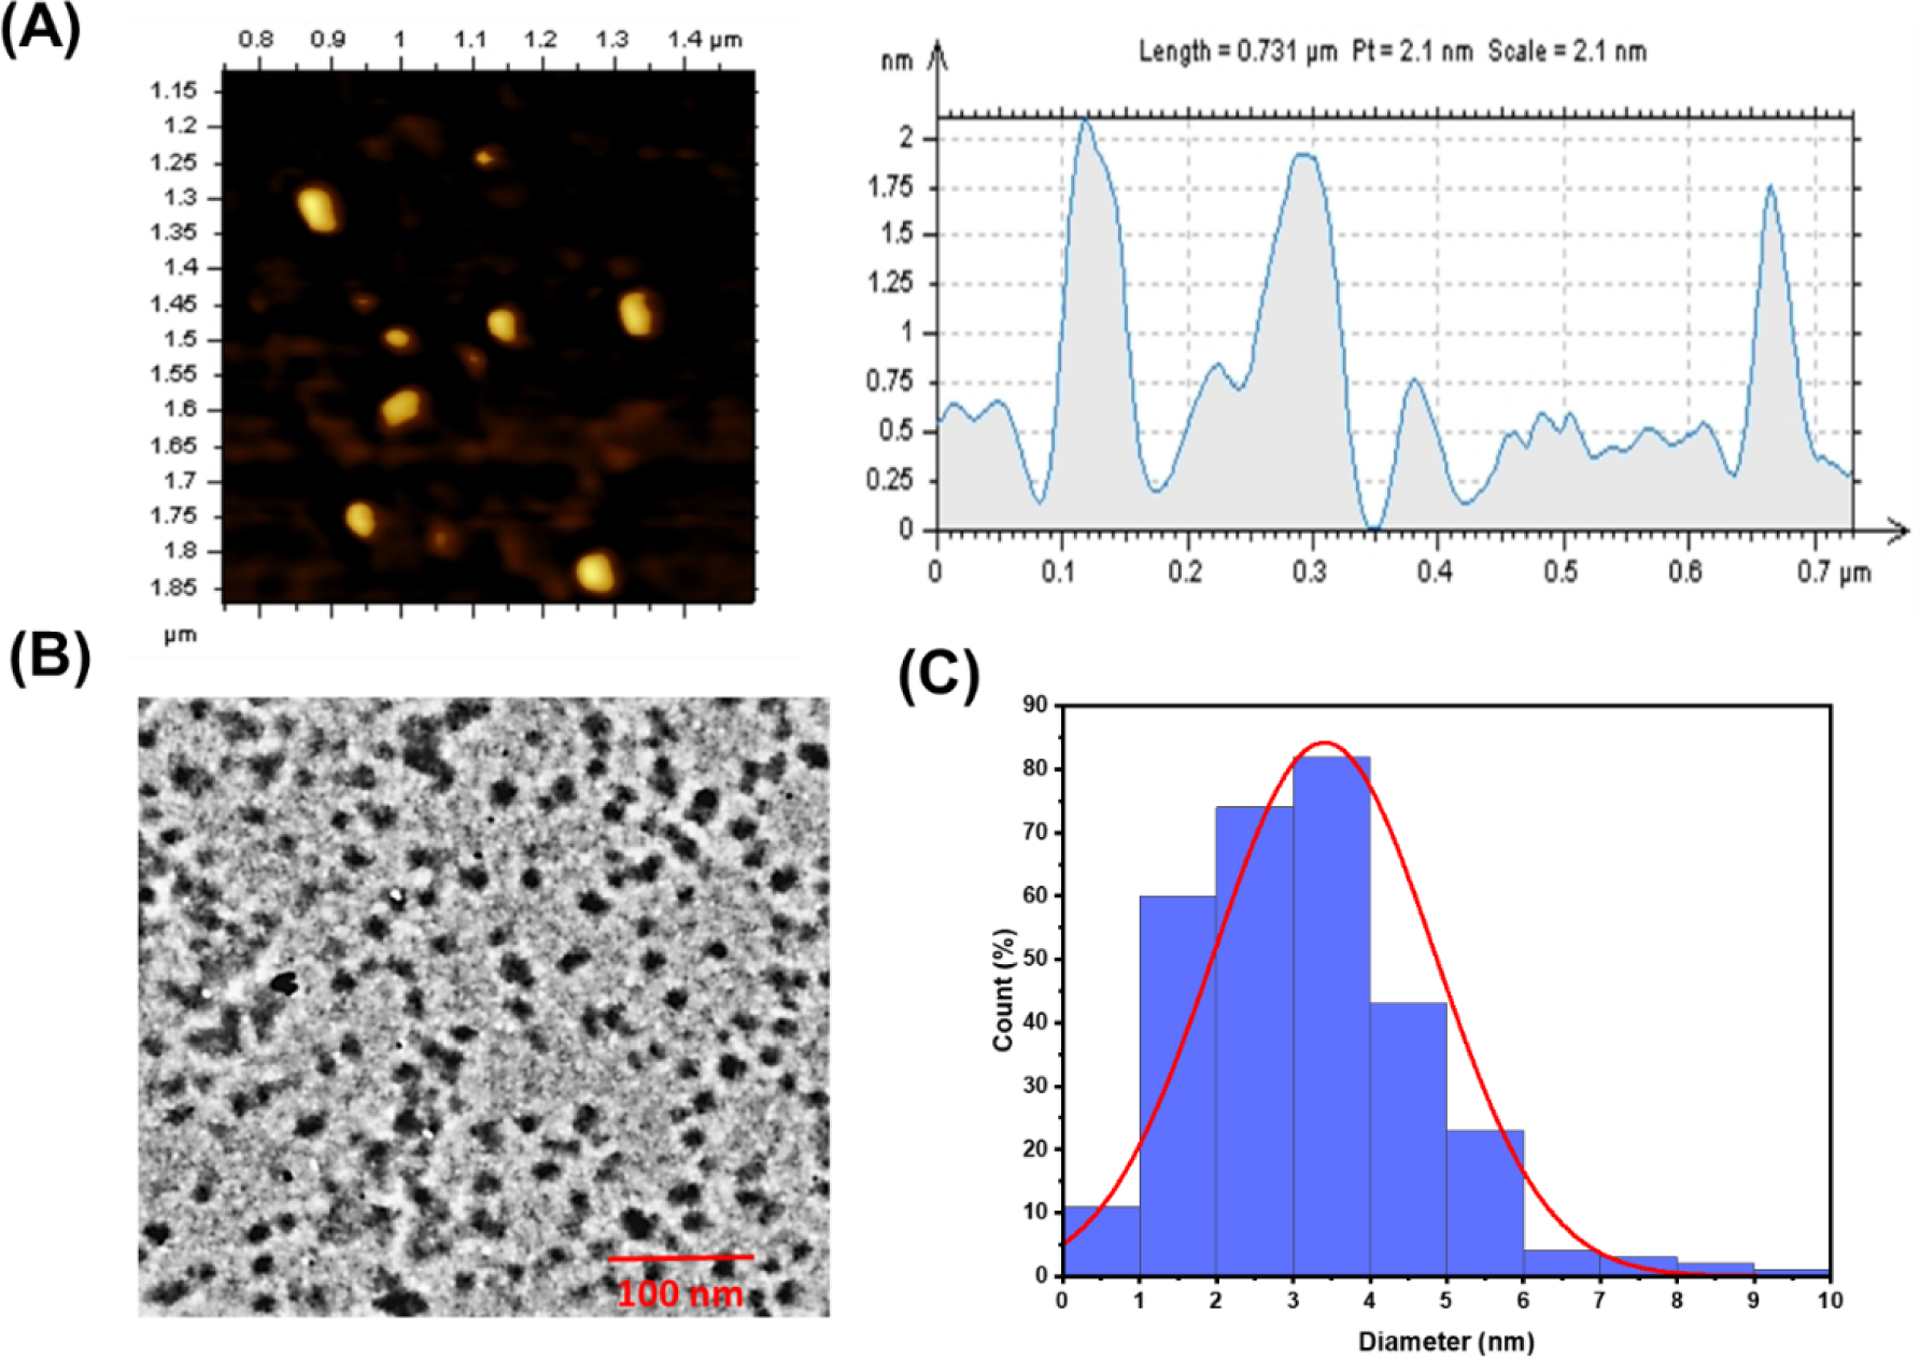
(A) AFM, (B) TEM, and (C) TEM size distribution histogram of Y15-CDs.
3.2. The agarose gel electrophoresis experiment
The agarose gel electrophoresis was performed to explore whether Y15-CDs could bind with DNA at various weight ratios of Y15-CDs to DNA (0.5:1, 1:1, 2:1, 5:1 and 10:1). As observed from Figure 7, naked DNA without adding Y15-CDs shows a bright migration band on the agarose gel, while Y15-CDs does not show any band. When the Y15-CDs are added to DNA solution at the mass ratio of 0.5:1, the migration band of Y15-CDs-DNA complexes is still similar with that of naked DNA, which suggests that no binding interactions between Y15-CDs and DNA occur. However, the complexes formed at the mass ratio of 10:1 show an obvious slower migration compared with naked DNA. As the speed of migration is inversely to the molecular weight of DNA, the slower migration indicates adsorption of Y15-CDs on DNA. Meanwhile, the sizes of Y15-CDs-DNA complexes gradually increased with the weight ratio increasing from 1:1 to 10:1, demonstrating that the amount of Y15-CDs binding on DNA are highly related to the weight ratio. Therefore, agarose gel electrophoresis analysis proves the DNA binding capability of Y15-CDs. Considering amine groups, graphitic, pyridinic and pyrrolic structures of Y15-CDs, the DNA binding mechanisms may involve electrostatic and π-π stacking interactions.
Figure 7.
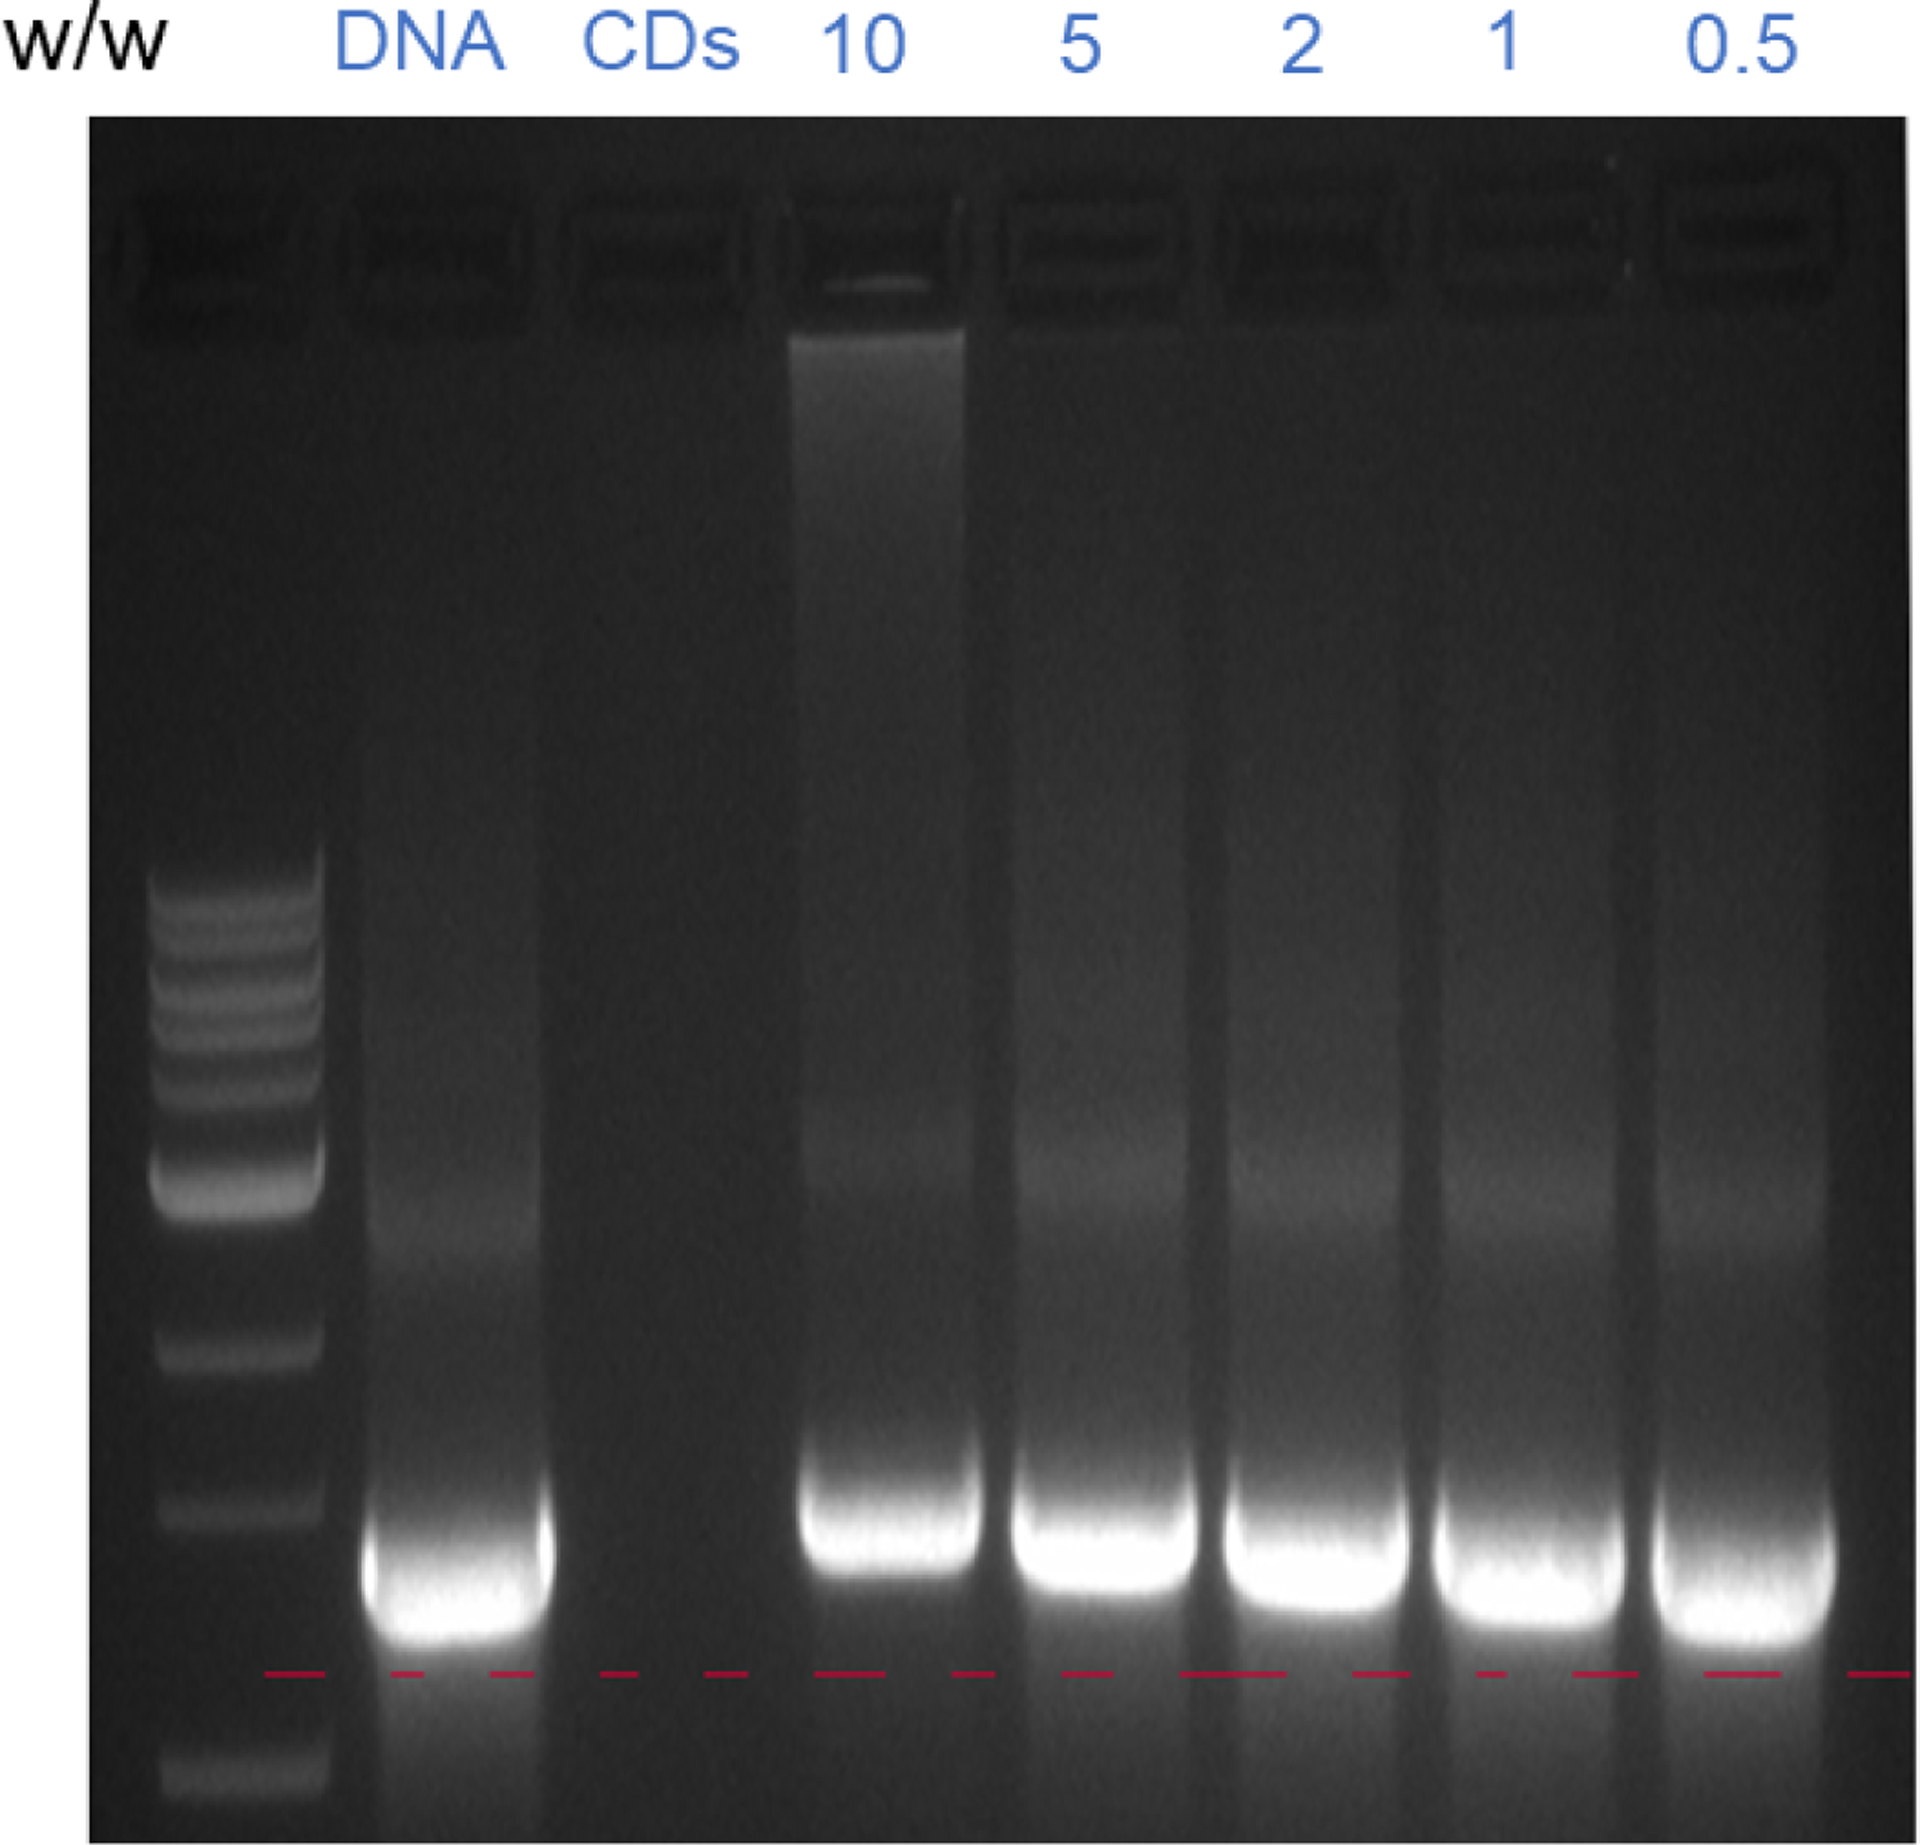
The agarose gel electrophoresis analyses of Y15-CDs-DNA complexes at different weight ratio of Y15-CDs to DNA.
3.3. Investigation of the DNA binding mechanisms
3.3.1. Absorption spectra and zeta potential measurement
UV-vis absorption spectroscopy is an effective method to examine the binding mechanisms between molecules and DNA. Based on the binding position on the double-stranded DNA, the binding modes can be classified into intercalative, groove and electrostatic external binding. Among them, intercalation involves the process that the molecules with planar aromatic or heteroaromatic ring systems are inserted in between adjacent base pairs without breaking up the hydrogen bonds. The formed complex can be stabilized though π-π stacking interactions between the molecules and DNA. In this situation, the π* orbital of the intercalated compound could couple with the π orbital of DNA base pairs. As a result, compared with the pure intercalator solution, the UV-vis absorption spectra of complex will display a bathochromic (red-shift) and hypochromic (decrease in absorbance) effects due to the decreasing of the π- π* transition energy and the reducing of transition probabilities. Meanwhile, the extent of hypochromic effect is highly related to the intercalative binding strength. In comparison, the groove binding which represents an interaction between the arc shaped or positively charged compounds and DNA normally exhibits a hyperchromic effect along with blue shift or a less pronounced bathochromic effect than intercalative binding mode. In terms of electrostatic interactions, the hyperchromic effect will arise if the negatively charged phosphate groups of DNA bind with positively charged compounds via electrostatic attractions [36–40].
The absorption spectra of Y15-CDs in the absence and presence of calf thymus DNA are shown in Figure 8A. The maximum peak of Y15-CDs is at 274 nm and the absorbance increases upon the increase of DNA content. No obvious bathochromic effect observed with addition of DNA into Y15-CDs solution. Since the spectrum of DNA ranging from 240 to 290 nm is covered with Y15-CDs spectrum from 240 to 300 nm, the comparison of intensities at 274 nm between Y15-CDs-DNA complexes and sum values of free DNA and Y15-CDs (Y15-CDs+DNA) was conducted in Figure 8B to investigate the effect of DNA binding on absorption of Y15-CDs. Theoretically speaking, if Y15-CDs cannot bind with DNA, the absorbance of Y15-CDs-DNA should have equaled to the adsorption of Y15-CDs+DNA. However, as revealed in Figure 8B, with the addition of DNA, the band at 274 nm in Y15-CDs-DNA shows the most and least prominent hyperchromic effect at 25 and 5 μg/mL of DNA, respectively, demonstrating that Y15-CDs-DNA complexes were successfully formed via electrostatic interactions or groove binding, which also takes into consideration the positive charge on the surface of Y15-CDs.
Figure 8.
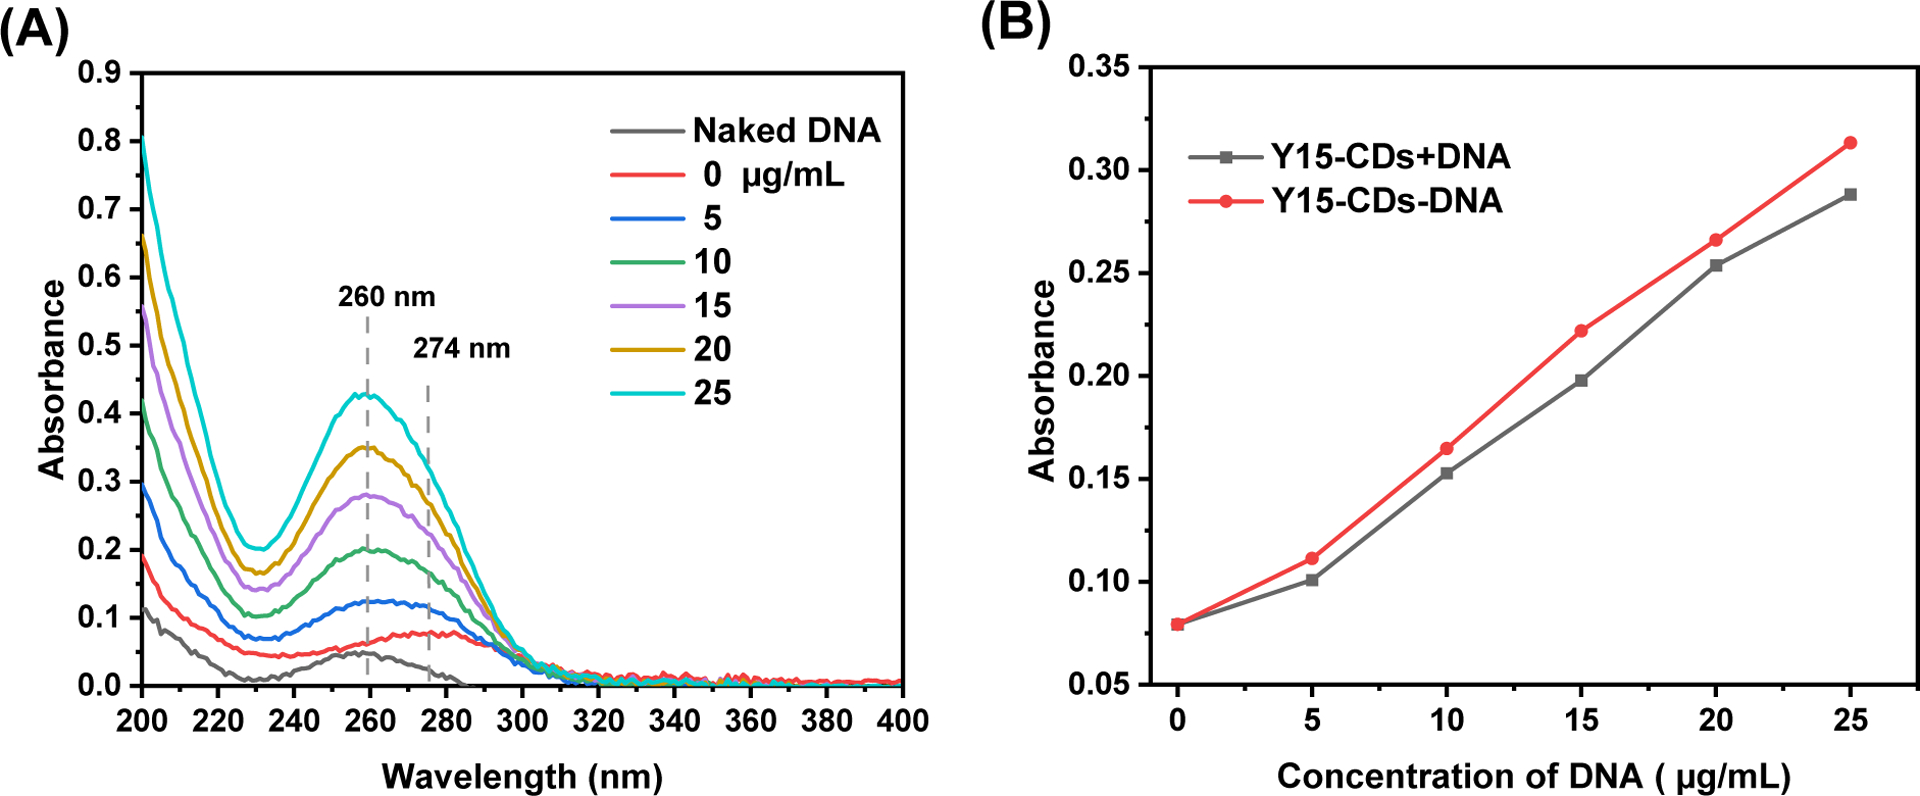
(A) UV-vis absorption spectra of 20 μg/mL Y15-CDs in the presence of different concentration of DNA (0, 5, 10, 15, 20 or 25 μg/mL) in DI water; (B) The absorbances of Y15-CDs-DNA complex solutions (the solution contains both of Y15-CDs at concentration of 0, 5, 10, 15, 20 or 25 μg/mL and DNA at 20 μg/mL), and the sum values of absorbance (Y15-CDs + DNA) of free DNA (the solution only contains DNA at 5, 10, 15, 20 or 25 μg/mL) and free Y15-CDs (the solution only contains Y15-CDs at 20 μg/mL).
To evaluate the effect of DNA binding on the surface charge of Y15-CDs, zeta potential of 20 μg/mL Y15-CDs with addition of 0, 5, 10, 15, 20 and 25 μg/mL of DNA were measured and listed in Table S4. As it can be seen, the zeta potentials of formed Y15-CDs-DNA complexes are negatively charged. Furthermore, the zeta potential increases upon increasing the concentration of DNA from 5 to 20 μg/mL and then deceases with addition of 25 μg/mL DNA. Normally, the electrostatic interactions between positively charged molecules/nanoparticles and DNA would cause a continuous decreased zeta potential when higher concentration of DNA involved. The special observation in this research infers that there might be multiple binding mechanisms between Y15-CDs and DNA.
3.3.2. Fluorescence spectra
The fluorescence spectra of Y15-CDs (Figure 9) were recorded in the presence of increasing concentrations of DNA. The result shows that the fluorescence intensity of the maximum emission peak at 455 nm is enhanced after adding DNA with the concentration higher than 1.0 μg/mL due to the strong interaction between Y15-CDs and DNA. However, the enhancement is not proportional to the concentration of DNA. When the concentrations of DNA are 0.5 and 1.0 μg/mL, the intensities of the Y15-CDs-DNA complexes match that of pure Y15-CDs. With increasing the DNA concentration from 2.0 to 2.5 μg/mL, the trend of fluorescence quenching commences. These inconsistent changes suggest that there might be multiple interaction modes involved in the DNA adsorption of Y15-CDs. According to extensive literature studies, regarding the deactivation from excited state to ground state, the molecules inserted into the DNA base stack of helix favor the radiative deactivation process, resulting in fluorescence emission intensity increasing. In the cases of groove and electrostatic binding, due to a non-radiative deactivation from the molecule rotation, the fluorescence intensity will be reduced [37, 41–43]. Therefore, in comparison to Y15-CDs, the higher fluorescence intensities of formed Y15-CDs-DNA complexes correspond to the intercalative interactions. And the fluorescence quenching at the DNA concentration of 2.5 μg/mL might be due to an electrostatic or groove interaction. As the electrostatic or groove binding was demonstrated by a UV-vis absorption assay, EB competitive experiment was performed to confirm the presence of intercalation.
Figure 9.
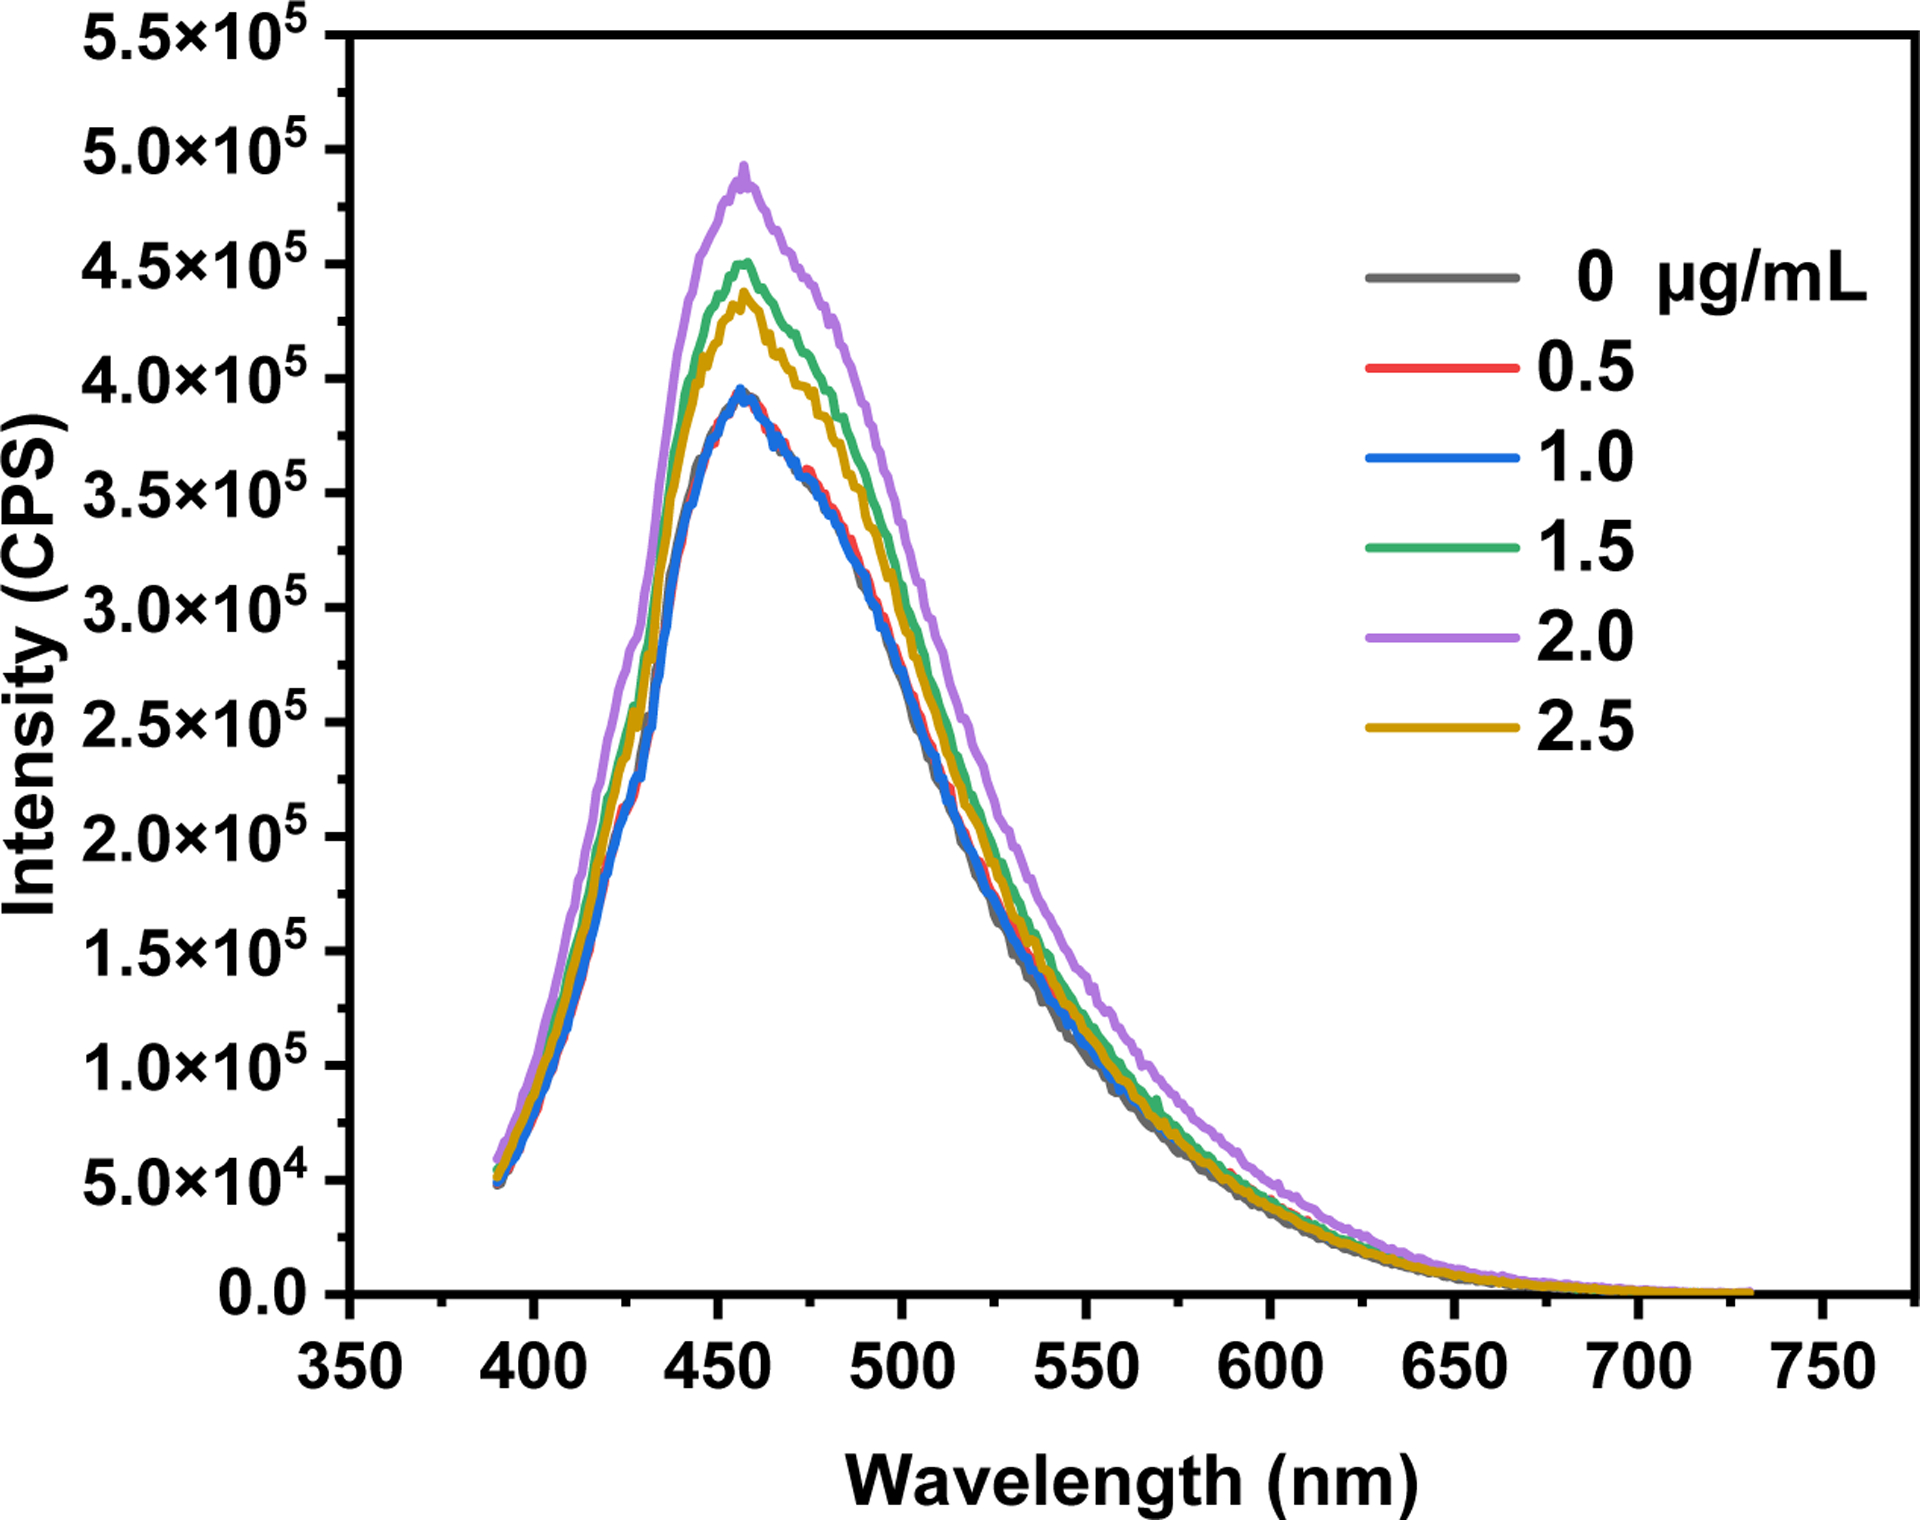
Fluorescence emission spectra of 2 μg/mL Y15-CDs solution upon the excitation at 375 nm with addition of different concentration of DNA (0, 0.5, 1.0, 1.5, 2.0 and 2.5 μg/mL).
EB is a classic intercalator that can bind DNA via strong intercalative interactions. After binding with DNA, the fluorescence of EB-DNA complexes can be significantly enhanced compared with naked EB. It has been reported that the enhanced fluorescence can be quenched by other competitive compounds with similar binding mechanisms [39, 42]. Thus, to exam whether Y15-CDs can displace the EB already bound with DNA, the fluorescence of EB-DNA complexes in the presence of Y15-CDs were monitored and shown in Figure 10A. Under the excitation of 510 nm, fluorescence of EB at 600 nm increases by 7 times with the addition of DNA due to the intercalative binding between EB and DNA. A slight decrease in the emission intensity was observed upon adding Y15-CDs to the EB-DNA complexes. Meanwhile, the extent of decrease is positively correlated to the concentration of Y15-CDs, indicating that Y15-CDs can displace EB from EB-DNA complexes. The quenching efficiency of Y15-CDs can be evaluated by the Stern-Volmer constant KSV using eq 2:
| eq 2 |
Where F0 and F present the emission intensities of EB-DNA complexes in the absence and presence of Y15-CDs, respectively. KSV is the Stern-Volmer quenching constant. [Q] is the concentration of Y15-CDs. The Stern-Volmer plot of EB-DNA in Figure 10B illustrates that the quenching of EB bound with DNA by Y15-CDs is in good agreement (R2 = 0.99024). The slightly upward-curve might be because of a slightly collisional quenching that combined with complex formation. The KSV constant was calculated as 1.40 × 10² L g−1 (9.21 × 10⁴ M−1), that is close to the Ksv constant of other published intercalators [44–46]. Thence, the fluorescence and EB competitive measurements demonstrate partial intercalative interactions between Y15-CDs and DNA.
Figure 10.
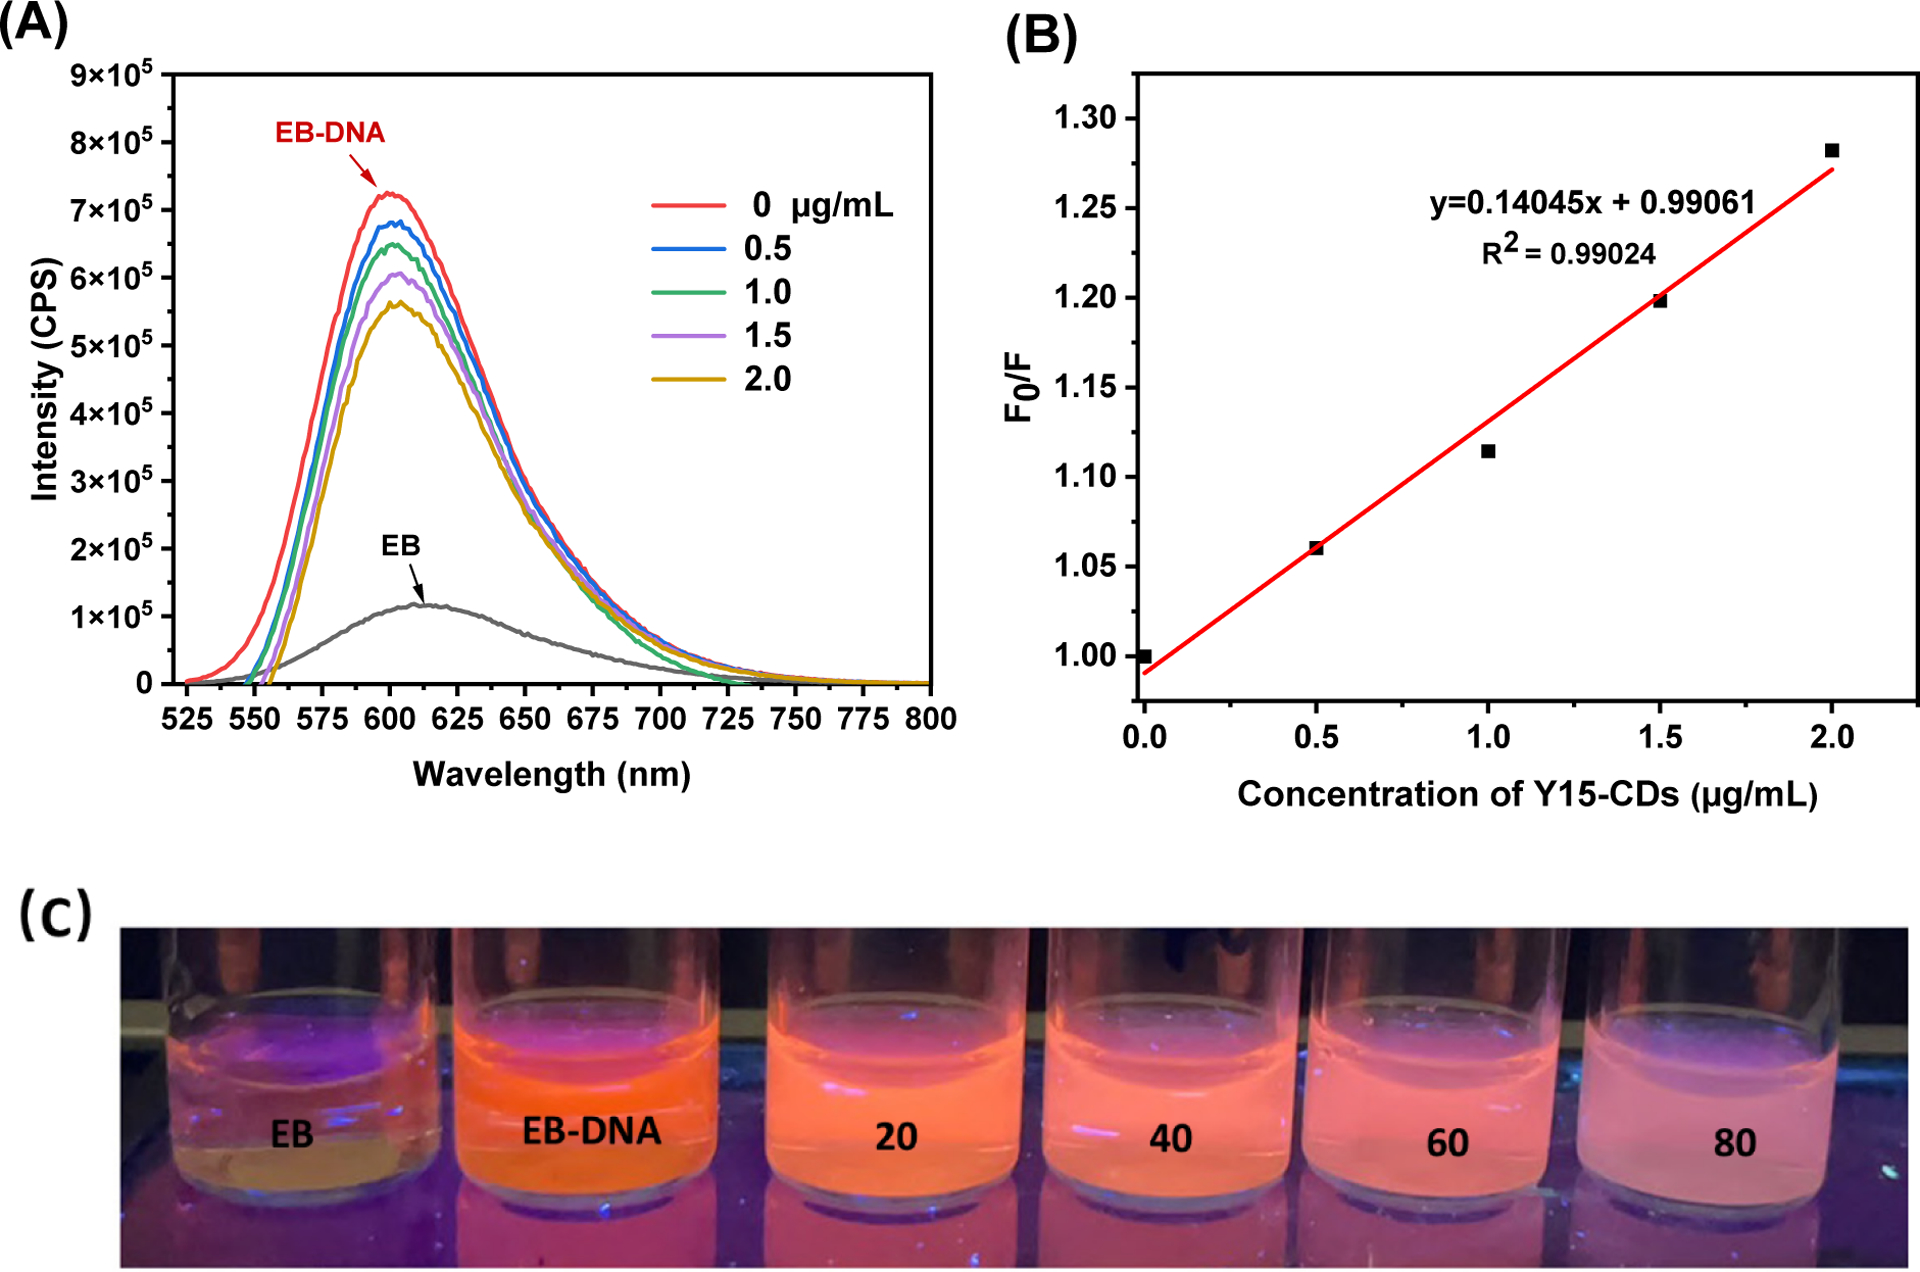
(A) Fluorescence emission spectra of 0.5 μg/mL EB bound with 1 μg/mL DNA in the presence of Y15-CDs (0, 0.5, 1.0, 1.5 and 2.0 μg/mL); (B) Stem-Volmer quenching plot of EB bound with DNA in the presence of different concentration of Y15-CDs. The excitation wavelength was 510 nm; (C) fluorescence of 20 μg/mL EB bound with 40 μg/mL DNA in the presence of Y15-CDs (20, 40, 60 and 80 μg/mL) under the UV lamp at 365 nm.
In addition to the quantification by fluorescence spectroscopy, the EB competitive replacement ability of Y15-CDs is also visible to the naked eyes under the UV lamp at 365 nm. Figure 10C shows the fluorescence of 20 μg/mL EB bound with 40 μg/mL DNA in the presence of Y15-CDs (20, 40, 60 and 80 μg/mL) that were witnessed without the fluorescence spectroscopy measurement. The results show that the orange fluorescence from EB-DNA complexes was quenched by the addition of Y15-CDs. Meanwhile, the quenching extent was highly related to the concentration of Y15-CDs, which is consistent with results in Figure 10A.
3.3.3. Circular dichroism spectra
The conformational changes of DNA which can reflect interaction mechanisms between Y15-CDs and DNA were investigated by circular dichroism spectroscopy. The result in Figure 11 displays the circular dichroism spectra of DNA with addition of different concentrations of Y15-CDs. For pure DNA solution, there are two peaks at 247 and 278 nm that are characteristic bands of B form of DNA. The negative band at 247 nm and the positive band at 278 nm are due to right-handed helicity and base-pair stacking, respectively. These two bands are very sensitive and informative for the DNA binding [47–49]. The groove binding and electrostatic interactions of molecules with DNA normally insignificantly impact the base stacking and helicity of B form of DNA. On the contrary, the intensity of both bands would be perturbated greatly in the intercalative mode. In Figure 11, when the concentration of Y15-CDs increases from 20 to 200 μg/mL, the intensities of both positive band at 278 nm and negative band at 247 nm are decreased, which suggests that the formation of Y15-CDs-DNA complexes weakened DNA base stacking with a helix unwinding [42, 47]. In addition, both peaks exhibit a blue shift. These changes provide the evidence for an intercalative binding in the Y15-CDs-DNA complexes formation.
Figure 11.
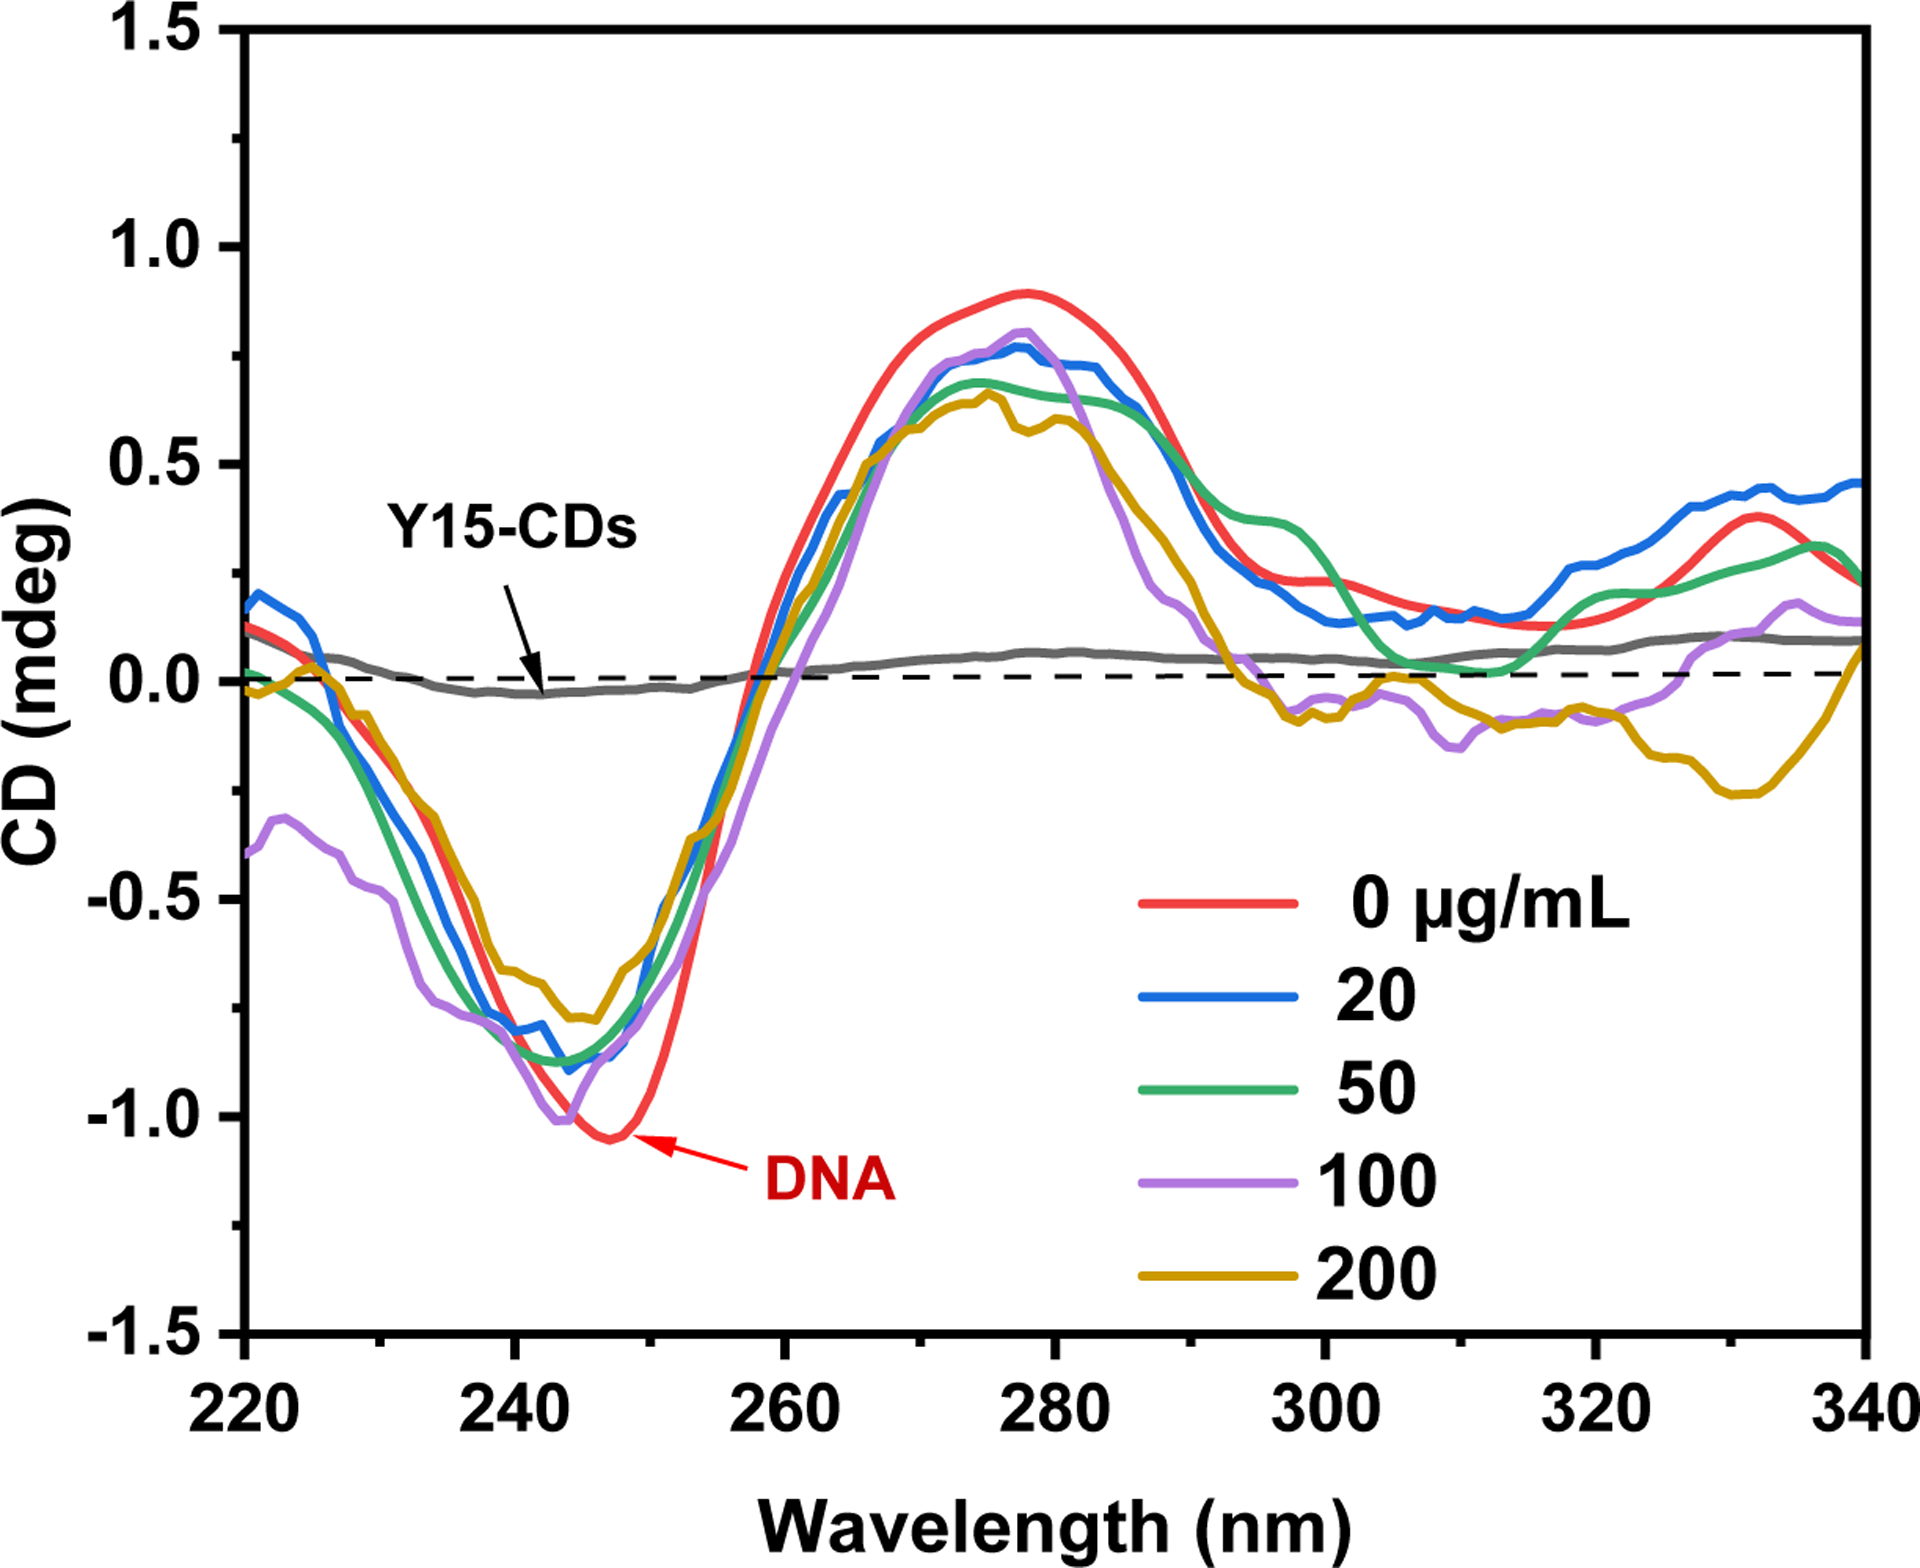
Circular dichroism spectra of 50 μg/mL DNA with addition of 20, 50, 100 and 200 μg/mL of Y15-CDs.
3.3.4. Cyclic voltammetry
The electrochemical behavior of Y15-CDs under varying concentrations of DNA was recorded to further confirm the binding mechanisms between Y15-CDs and DNA. Seminal studies have unambiguously demonstrated that voltammetry experiments are well-poised to provide insights into DNA binding mechanisms. While intercalation of redox probes into DNA is diagnosed by an anodic shift of the half-wave potentials (E1/2), electrostatic interactions between a redox probe and the phosphate functional groups engender a cathodic shift of the E1/2. [38, 40, 50, 51] Complex systems where simultaneous intercalation and electrostatic interactions exist are characterized by concomitant cathodic and anodic shifts of the redox probe’s E1/2. As shown in Figure 12A, the cyclic voltammogram of the pristine Y15-CDs, without the addition of DNA, displays two cathodic peaks at −0.92 V (Epi1) and −0.42 V (Epi2). These electrochemical signals indicate that the Y15-CDs feature two distinct electronic states under n-doped conditions. No corresponding peaks were observed in the reverse scan. This electrochemical system can be considered irreversible. From Figure 12A, the current densities of reduction peaks of Y15-CDs decrease significantly as the concentration of DNA is increased to 10 μg/mL, suggesting the presence of interactions between Y15-CDs and DNA. Furthermore, Epi1 experiences an anodic shift from −0.92 to −0.88 V while Epi2 displays a larger cathodic shift from −0.42 to −0.53 V. Congruent with previous studies, this data indicates that Y15-CDs bind DNA by both intercalative and electrostatic interactions.
Figure 12.
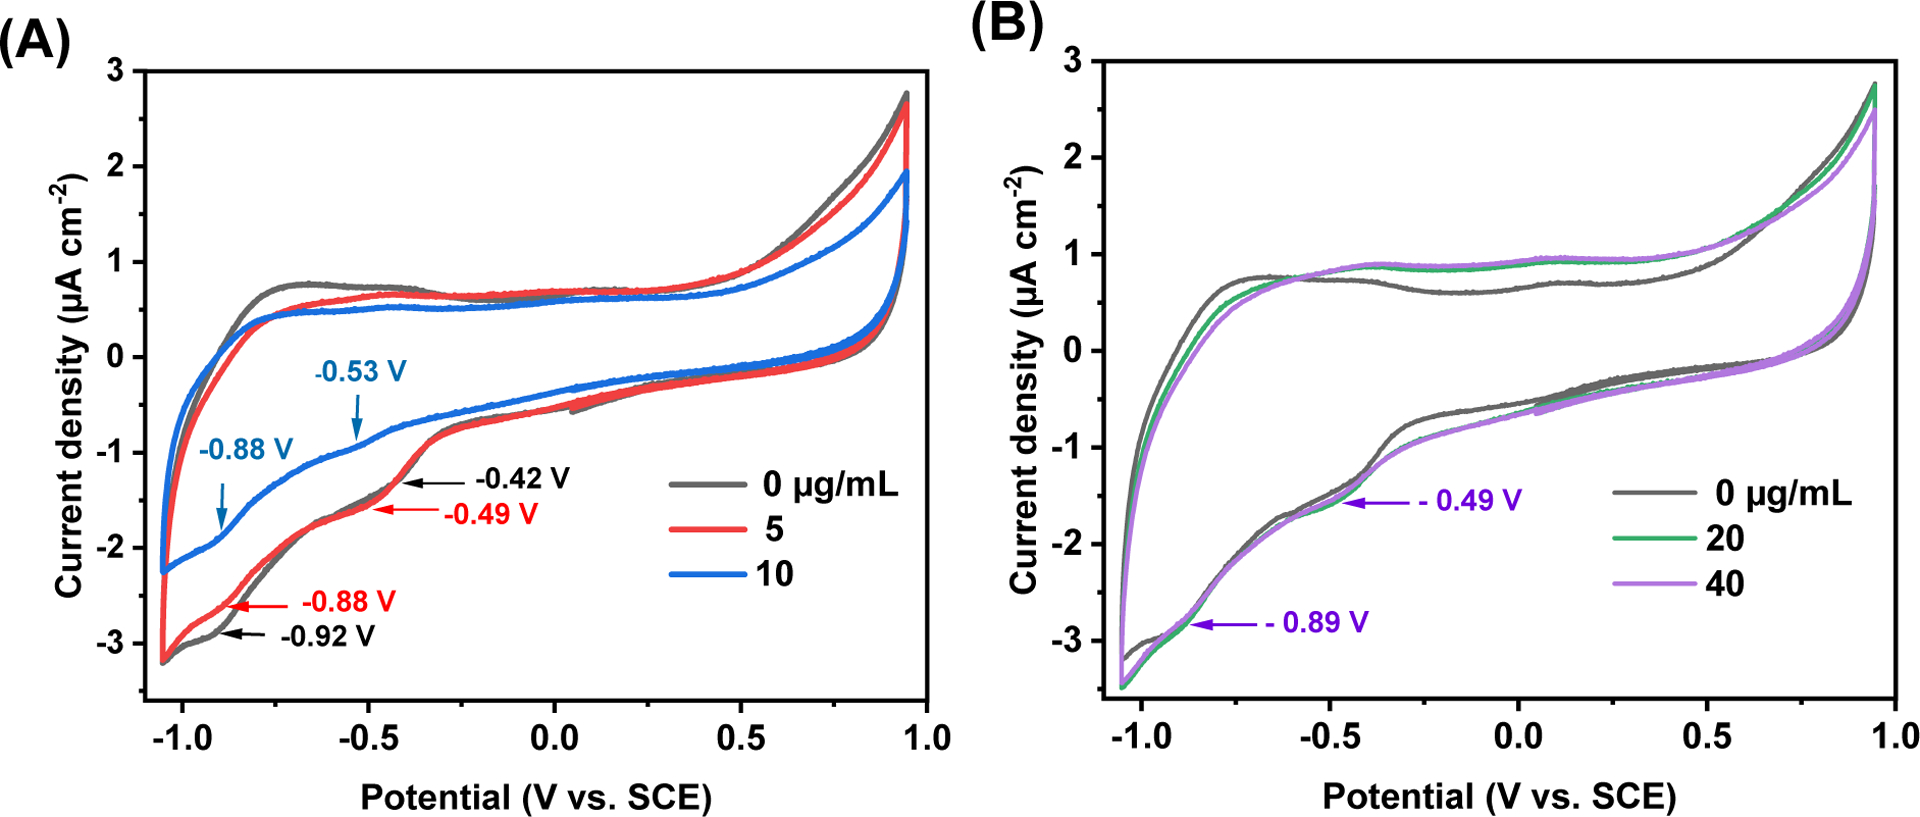
Cyclic voltammograms of 10 μg/mL of Y15-CDs (A) in the presence of 0, 5, and 10 μg/mL of DNA and (B) in the presence of 0, 20, and 40 μg/mL of DNA recorded in H2O using 0.1 M NaCl as supporting electrolyte, glassy carbon (GC) electrode as working electrode, Ag/AgCl as reference electrode, and a Pt wire as a counter electrode.
While a marginal change in current densities is witnessed after the addition of 5 μg/mL of DNA to the Y15-CDs solution, 10 μg/mL of DNA has a profound impact on the current densities. This data qualitatively informs on the strength of the interaction between Y15-CDs and DNA where a low concentration of DNA may not provide sufficient binding affinity to form the Y15-CDs-DNA complexes. Under this condition, non-interacting Y15-CDs can freely diffuse on the electrode surface. The fact that the current densities decrease after the addition of 10 μg/mL of DNA originate from: 1) a change of diffusion coefficient of the redox active species as Y15-CDs-DNA complexes are larger than Y15-CDs, and 2) the intercalation of Y15-CDs within the DNA secondary structures create a tunneling barrier that limits the rate of charge transfer. Figure 12B shows the cyclic voltammograms of Y15-CDs upon the addition of higher concentrations of DNA at 20 and 40 μg/mL. While the current densities are similar to those recorded for the pristine Y15-CDs, the Epi1 and Epi2 peaks shift to −0.89 and −0.49 V, respectively. It is fair to assume that these slight changes report on the dominance of electrostatic interactions between Y15-CDs and DNA, preventing the intertwining of Y15-CDs in DNA structures. Taken together, we posit that cyclic voltammetry qualitatively demonstrates the existence of both intercalative and electrostatic interactions between Y15-CDs and DNA. Excess of DNA might promote electrostatic interactions, which are consistent with the results from the DNA binding experiment conducted by fluorescence spectroscope.
3.4. Cell imaging
The cell imaging of Y15-CDs in HFF, U2OS and PC3 cells were captured using a fluorescence microscope. Figure 13 shows the fluorescence images of the cells incubated with 1 mg/mL of Y15-CDs for 30 min. Besides the Y15-CDs, the cells were also stained with DAPI to localize the cell nucleus. Under the blue channel (DAPI channel) with the excitation wavelength of 405 nm, all the cells emit bright blue fluorescence with no significant background signals, which represent the shape and location of nucleus. To distinguish the fluorescence signals from Y15-CDs and DAPI, green fluorescence channel at excitation wavelength of 488 nm was applied to observe the signals from Y15-CDs. As observed in Figure 13, after the treatment with Y15-CDs, green fluorescence signals from Y15-CDs in the three cell lines are all well distributed in both the cytoplasm and nucleus, suggesting that Y15-CDs can enter cells and penetrate the nuclear membrane. In addition, the fluorescence intensity in the nucleus is higher than that in cytoplasm. There might be two causes to explain this phenomenon. One is that Y15-CDs prefer to accumulate in the nucleus. Another is that after entering the nucleus, Y15-CDs could bind with DNA and increase the intensity of fluorescence, which has already been apparent in DNA binding studies. Overall, the cell imaging study demonstrates the nucleus targeting ability of Y15-CDs in normal and cancer cells.
Figure 13.
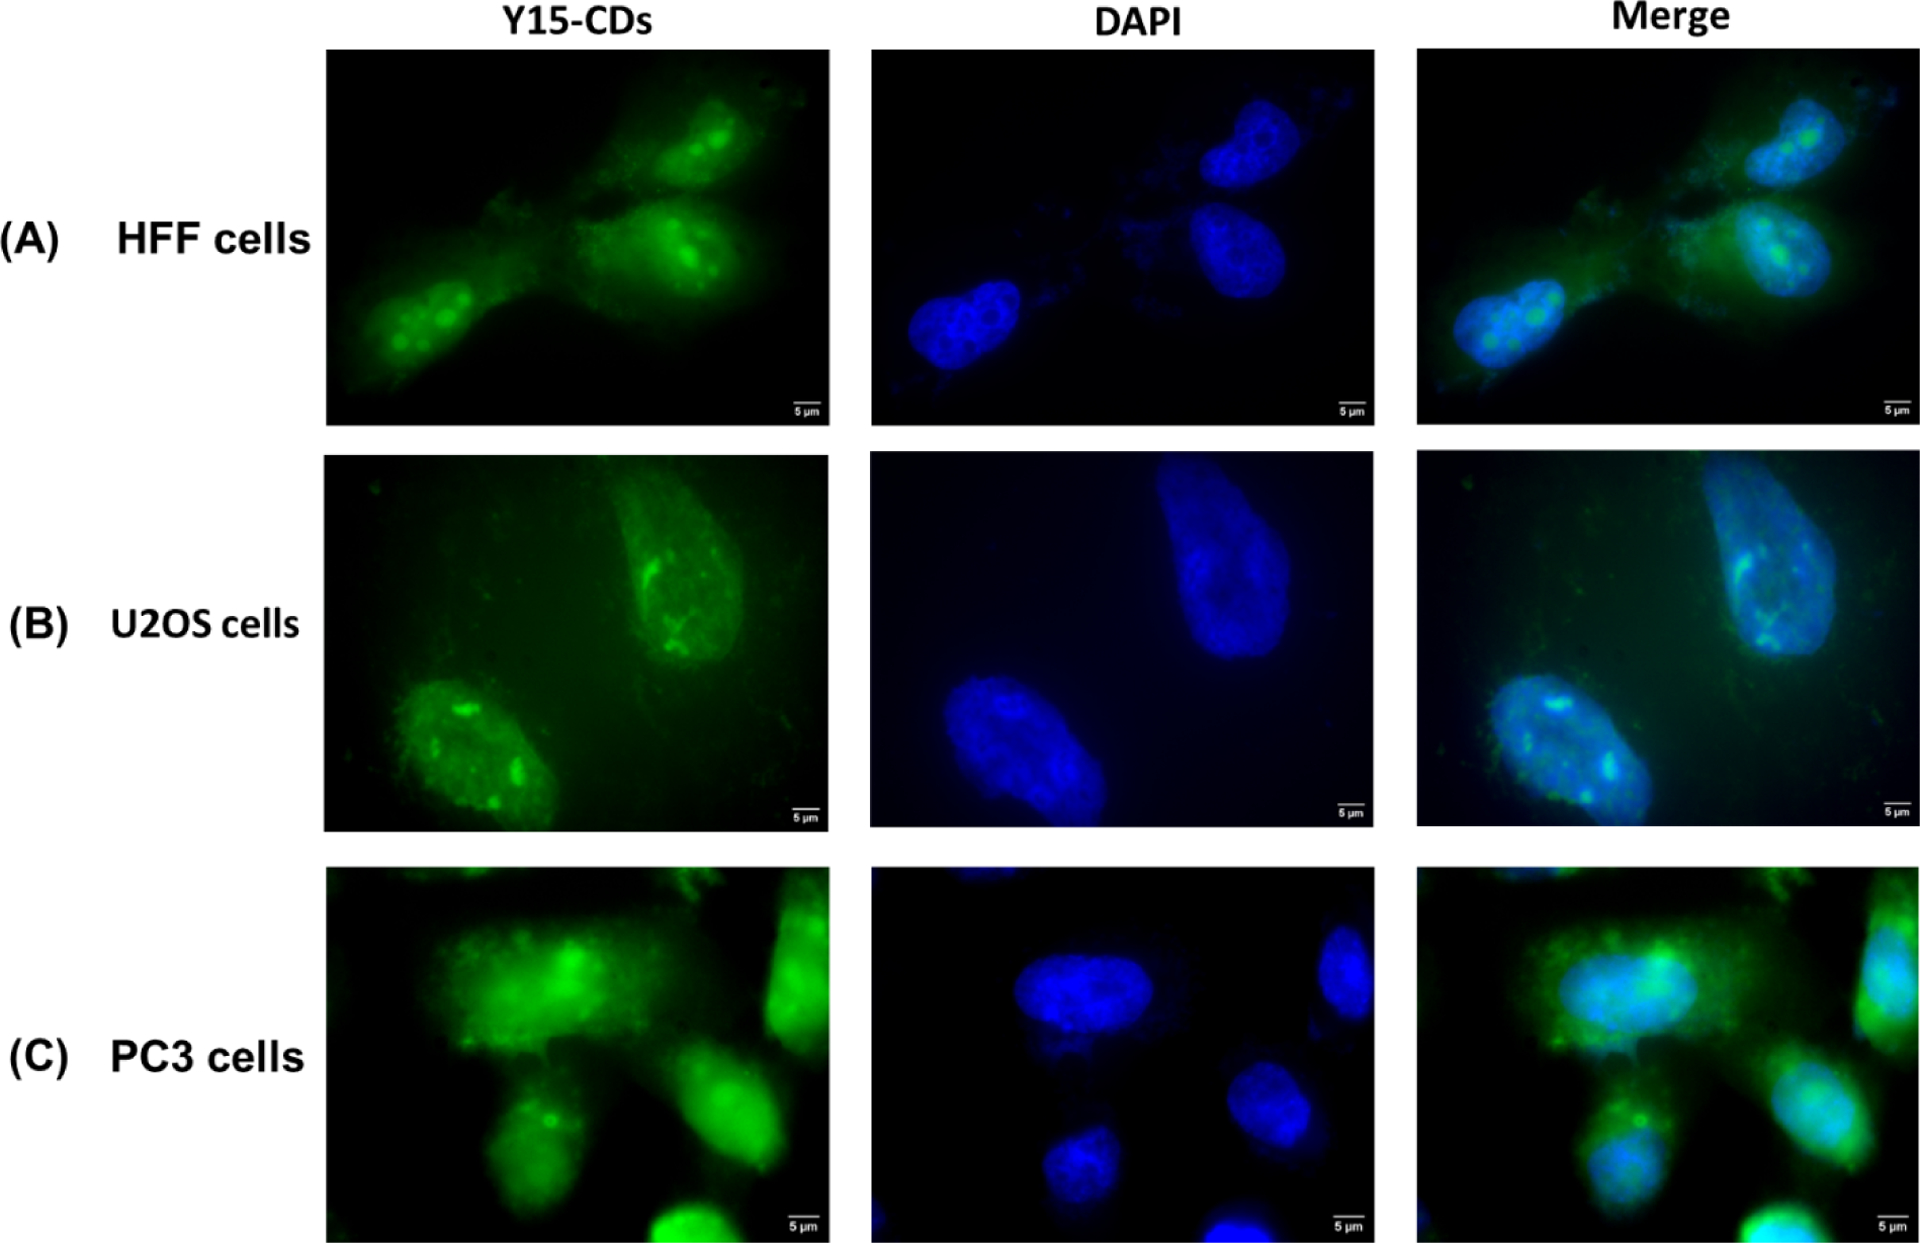
Fluorescence images of (A) human foreskin fibroblasts (HFF), (B) osteosarcoma (U2OS) and (C) prostate cancer (PC3) cells incubated with Y15-CDs (1 mg/mL) for 30 min.
3.5. In vitro cytotoxicity assay
Focal adhesion kinase (FAK) is a tyrosine kinase overexpressed in tumor cells such as osteosarcoma, neuroblastoma, pancreatic tumor, etc. It plays a vital role in cell migration, survival, proliferation, and adhesion, and is regarded as a functional protein in the cytoplasm and nucleus. In the nucleus, FAK can regulate gene expression to influence tumorigenesis [22, 52, 53]. FAK inhibitor, Y15, has been reported as an effective drug in cancer therapy [23, 54]. To understand whether Y15-CDs possess an ability to inhibit the growth of cancer cells, an MTT assay was conducted in this experiment for PC3 and U2OS cells. Meanwhile, HFF cells were involved to study the cytotoxicity of Y15-CDs to normal/healthy cells as control. Y15 and FA-EDA were regarded as positive and negative controls, respectively, to investigate the necessity of existence of Y15 in carbon dots. As shown in Figure 14A, Y15 exhibits high cytotoxicity to HFF, PC3 and U2OS cells even at low concentrations. The half maximal inhibitory concentration (IC50) of Y15 to HFF, PC3 and U2OS cells are 4.82, 4.81 and 1.93 μM, respectively. A relative higher IC50 in HFF cells than that in U2OS cells indicates the selective cytotoxicity of Y15 to U2OS cells due to FAK overexpression. FA-EDA, the product synthesized only by FA and EDA as precursors shows low toxicity to HFF, PC3 and U2OS cells (Figure 14B). The cell viabilities are still above 75% after incubation in FA-EDA solution for 72 h at the concentration of 300 μM. In Figure 14C, cell viabilities of the three cell lines treated with the Y15-CDs are all decreased with the concentration increased to above 37.5 μM. The concentrations lower than 9.38 μM are not enough to inhibit the cell growth. With the concentration increasing from 18.75 to 300 μM, Y15-CDs exhibit stranger inhibition ability to cancer cells (PC3 and U2OS) than to normal cells (HFF). At the highest concentration (300 μM), viabilities of PC3 and U2OS cells decreased to 22 %, while the viability of HFF cells is around 65 %. Comparison with the results in Figure 14B, we can propose that the cytotoxicity of Y15-CDs to cells is mainly because of the presence of Y15 in Y15-CDs. The IC50 of Y15-CDs in HFF, PC3 and U2OS calculated based on the curves in Figure 14D are 2044, 109 and 103 μM, respectively. From Figure 13, we have learnt that Y15-CDs can enter cells, target nuclei, and bind with DNA. The stronger inhibition ability of Y15-CDs to cancer cells than to normal cells and the enhanced selectivity of Y15-CDs to cancer cells compared with that of Y15 might be because Y15-CDs could inhibit the overexpressed FAK in both the cytoplasm and the nucleus of cancer cells. Therefore, the in vitro cytotoxicity study indicates that as-prepared Y15-CDs can selectively inhibit the growth of cancer cells.
Figure 14.
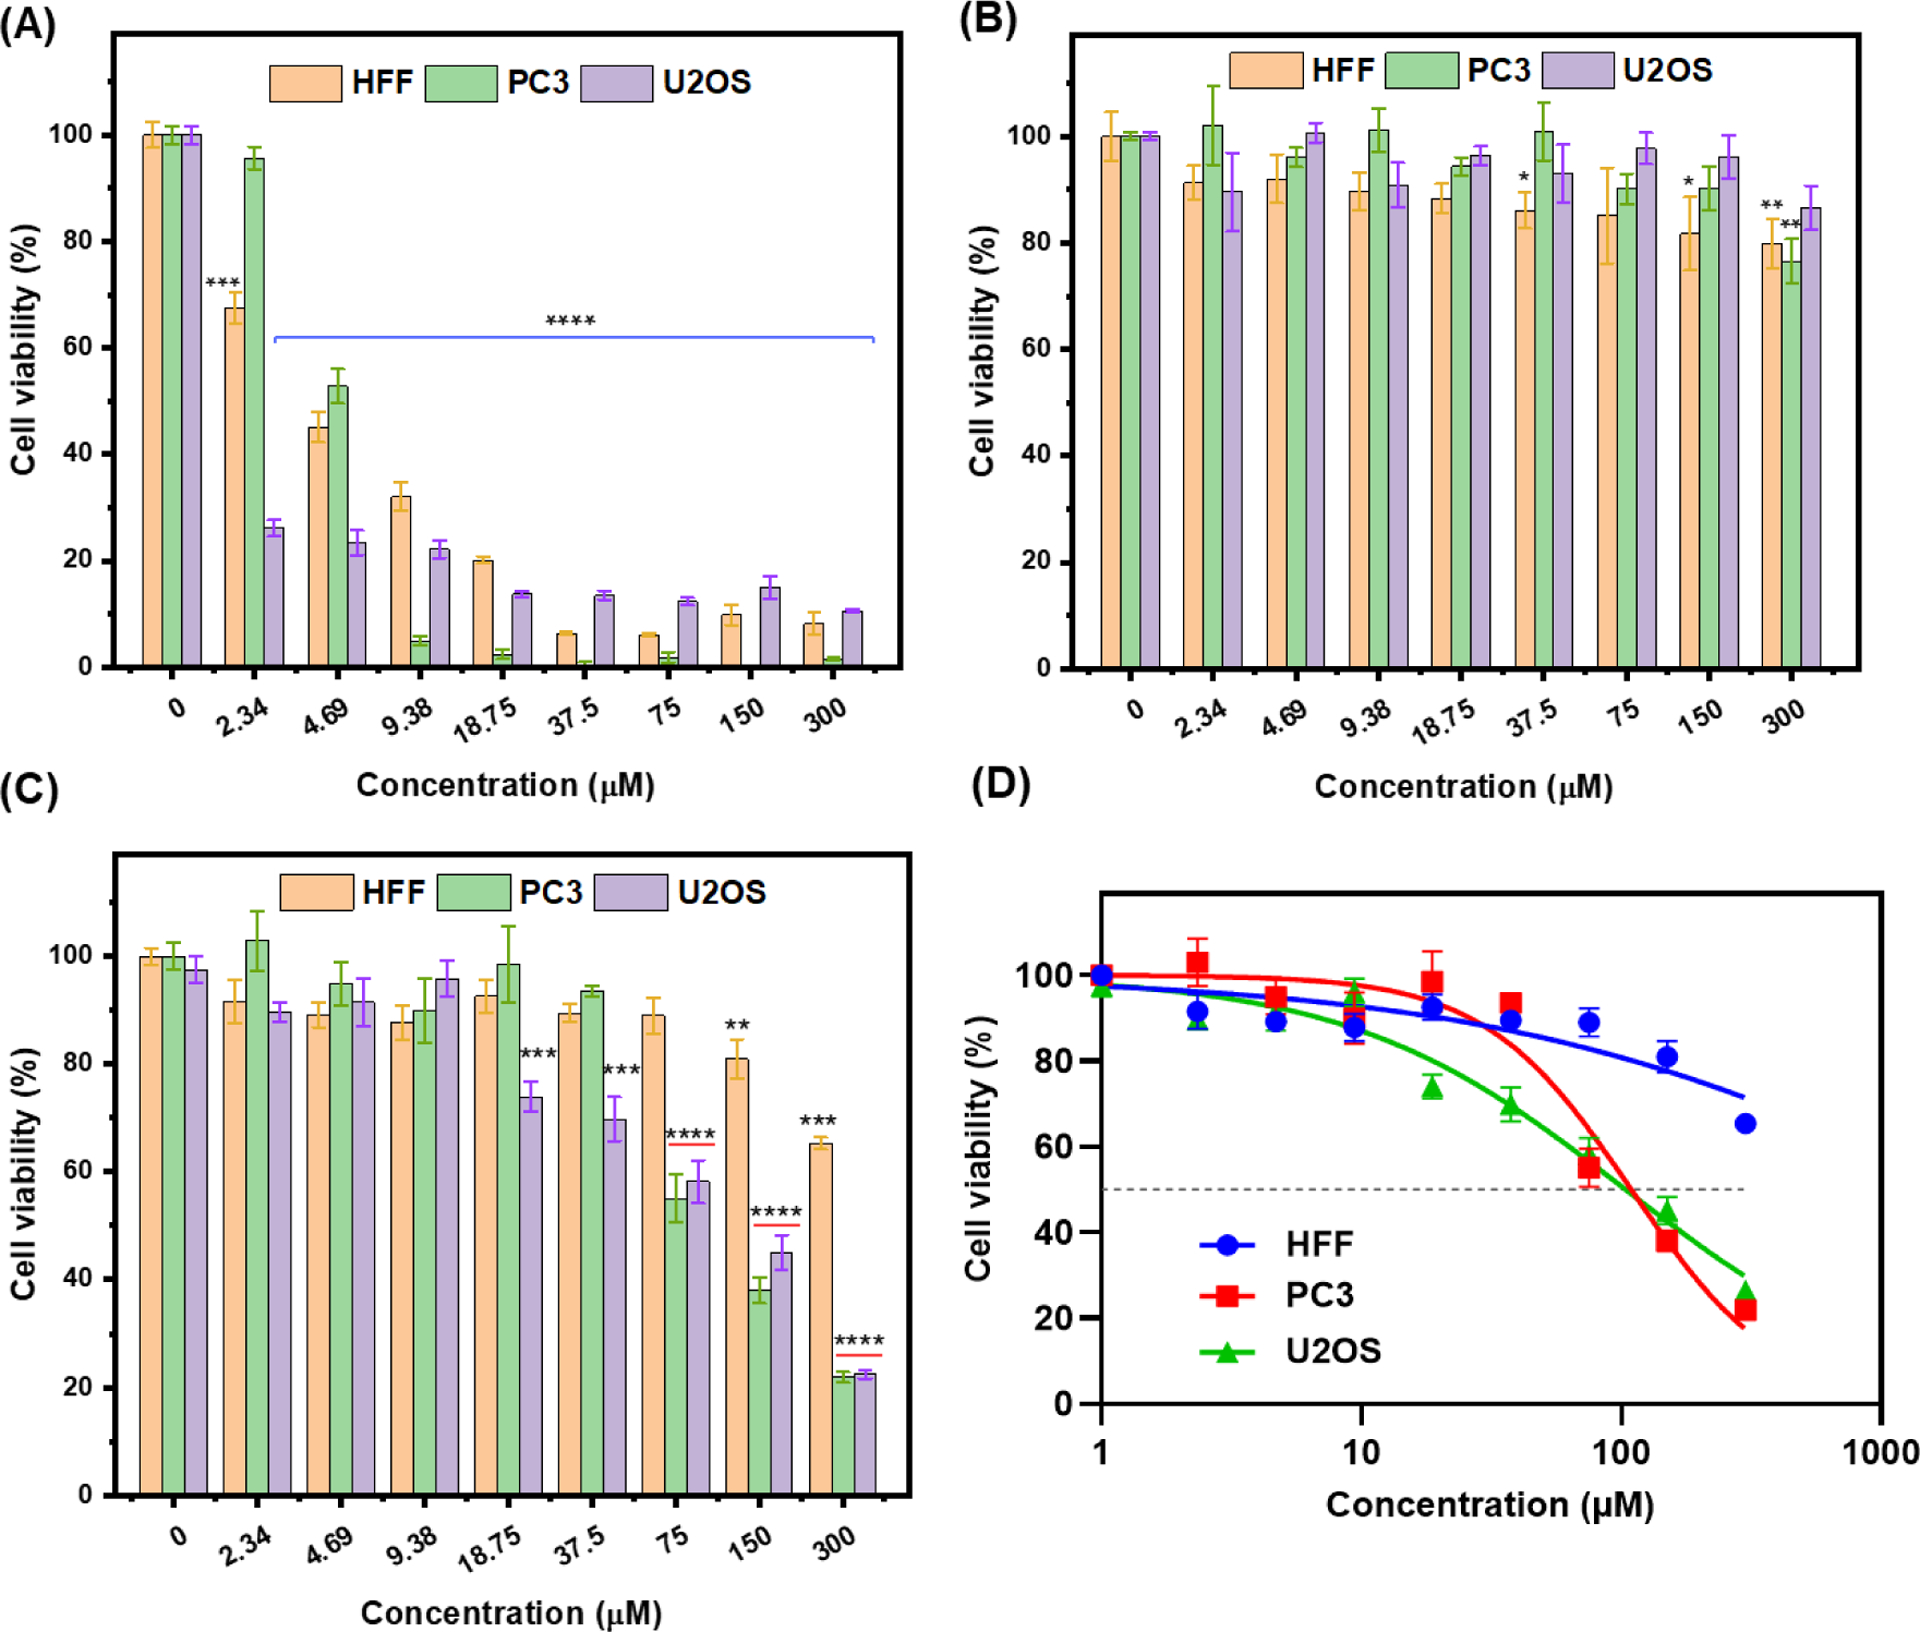
In vitro cytotoxicity evaluation of (A) Y15, (B) FA-EDA and (C) Y15-CDs at different concentrations in HFF, PC3 and U2OS cells incubated for 72 h at 37 °C; (D) comparation of the cell viabilities of Y15-CDs to HFF, PC3, and U2OS cells. Data are showing as mean ± SEM. Statistical significance was determined by using a one-way ANOVA analysis. *p<0.05, **p<0.01, ***p<0.001, ****p<0.0001 compared to non-treated controls.
4. Conclusion
In summary, 1, 2, 4, 5-benzenetetramine (Y15), a focal adhesion kinase (FAK), derived cationic carbon dots named Y15-CDs were successfully synthesized in this work. The UV-vis, fluorescence, Fourier-transform infrared (FTIR) and X-ray photoelectron (XPS) spectroscopies, atomic force microscopy (AFM), transmission electron microscopy (TEM), thermogravimetric analysis (TGA) and zeta potential measurements suggest that Y15-CDs are positively charged ellipse-shape nanoparticles with a particle size of 2–4 nm and possess an excitation-dependent photoluminescence emission. Based on the DNA binding experiments performed on agarose gel electrophoresis, UV-vis, fluorescence, and circular dichroism spectroscopies, and cyclic voltammetry, Y15-CDs might bind with DNA via electrostatic and partially intercalative interactions. The cell imaging of Y15-CDs in HFF, PC3 and U2OS cells prove that Y15-CD can penetrate the nuclear membranes, target the nucleus, and bind with DNA. As the nucleus targeting is beneficial in cancer therapy, the cytotoxicity of Y15-CDs to normal cells (HFF cells) and cancer cells (PC3 and U2OS cells) were compared, which indicates that Y15-CDs exhibit a higher cytotoxicity to cancer cells than to normal cells, which demonstrates an application potential of Y15-CDs in cancer therapy. This study focuses on the nucleus targeting property, DNA binding mechanisms of the drug derived cationic carbon dots and their effects on growth of both cancer and normal cells, which provide a new idea and guideline for designing carbon dots or nanoparticles that possess selective anticancer ability without effect on normal cells or tissues.
Supplementary Material
Acknowledgments
Professor Roger M. Leblanc thanks the support from the National Science Foundation under the grant 2041413, and National Institute of Health under the grant SUB00002778. Research reported in this study was also partly supported by National Institutes of Health under award number R01HL156958 (YZ) and by Department of Defense under award number BC180657 (YZ).
Footnotes
Publisher's Disclaimer: This is a PDF file of an unedited manuscript that has been accepted for publication. As a service to our customers we are providing this early version of the manuscript. The manuscript will undergo copyediting, typesetting, and review of the resulting proof before it is published in its final form. Please note that during the production process errors may be discovered which could affect the content, and all legal disclaimers that apply to the journal pertain.
CRediT authorship contribution statement
Jiuyan Chen: Conceptualization, Methodology, Validation, Formal analysis, Data curation, Investigation, Writing-original draft, Writing-review & editing, Project administration. Fang Li: Conceptualization, Methodology, Validation, Formal analysis, Data curation, Investigation, Writing-review & editing, Project administration. Jun Gu: Conceptualization, Methodology, Investigation, Formal analysis. Xiao Zhang: Methodology, Investigation, Formal analysis. Mattia Bartoli: Investigation, Formal analysis, Writing-original draft. Justin B. Domena: Investigation, Formal analysis. Yiqun Zhou: Conceptualization, Formal analysis, Writing-review & editing, Visualization. Wei Zhang: Investigation, Formal analysis. Victor Alfonso Paulino: Investigation, Formal analysis, Writing-review & editing. Braulio C.L.B. Ferreira: Investigation, Formal analysis, Writing-original draft. Nicholas Michael Brejcha: Investigation, Formal analysis. Liang Luo: Investigation. Chiara Arduino: Investigation. Fulvia Verde: Resources, Supervision, Validation. Fangliang Zhang: Conceptualization, Resources, Supervision, Validation. Fuwu Zhang: Conceptualization, Resources, Supervision, Validation, Writing-review & editing. Alberto Tagliaferro: Resources, Supervision, Validation, Writing-review & editing. Jean-Hubert Olivier: Conceptualization, Resources, Supervision, Validation, Writing-review & editing. Yanbin Zhang: Conceptualization, Funding acquisition, Resources, Supervision, Visualization, Methodology, Project administration, Writing-review & editing. Roger M. Leblanc: Conceptualization, Funding acquisition, Resources, Supervision, Visualization, Methodology, Project administration, Writing-review & editing.
Declaration of interests
The authors declare that they have no known competing financial interests or personal relationships that could have appeared to influence the work reported in this paper.
References
- [1].Duncan R, Nanomedicine gets clinical, Materials Today 8(8) (2005) 16–17. 10.1016/S1369-7021(05)71032-4. [DOI] [Google Scholar]
- [2].Wang B, Song H, Qu X, Chang J, Yang B, Lu S, Carbon dots as a new class of nanomedicines: Opportunities and challenges, Coordination Chemistry Reviews 442 (2021) 1–18. 10.1016/j.ccr.2021.214010. [DOI] [Google Scholar]
- [3].Raj S, Khurana S, Choudhari R, Kesari KK, Kamal MA, Garg N, Ruokolainen J, Das BC, Kumar D, Specific targeting cancer cells with nanoparticles and drug delivery in cancer therapy, Semin Cancer Biol 69 (2021) 166–177. 10.1016/j.semcancer.2019.11.002. [DOI] [PubMed] [Google Scholar]
- [4].Liu J, Li R, Yang B, Carbon Dots: A new type of carbon-based nanomaterial with wide applications, ACS Cent Sci 6(12) (2020) 2179–2195. 10.1021/acscentsci.0c01306. [DOI] [PMC free article] [PubMed] [Google Scholar]
- [5].Ji C, Zhou Y, Leblanc RM, Peng Z, Recent developments of carbon dots in biosensing: A review, ACS Sens 5(9) (2020) 2724–2741. 10.1021/acssensors.0c01556. [DOI] [PubMed] [Google Scholar]
- [6].Zhou Y, Mintz KJ, Sharma SK, Leblanc RM, Carbon dots: Diverse preparation, application, and perspective in surface chemistry, Langmuir 35(28) (2019) 9115–9132. 10.1021/acs.langmuir.9b00595. [DOI] [PubMed] [Google Scholar]
- [7].Yan F, Jiang Y, Sun X, Bai Z, Zhang Y, Zhou X, Surface modification and chemical functionalization of carbon dots: A review, Mikrochim Acta 185(9) (2018) 1–34. 10.1007/s00604-018-2953-9. [DOI] [PubMed] [Google Scholar]
- [8].Unnikrishnan B, Wu RS, Wei SC, Huang CC, Chang HT, Fluorescent carbon dots for selective labeling of subcellular organelles, ACS Omega 5(20) (2020) 11248–11261. 10.1021/acsomega.9b04301. [DOI] [PMC free article] [PubMed] [Google Scholar]
- [9].Liu H, Yang J, Li Z, Xiao L, Aryee AA, Sun Y, Yang R, Meng H, Qu L, Lin Y, Zhang X, Hydrogen-bond-induced emission of carbon dots for wash-free nucleus imaging, Anal Chem 91(14) (2019) 9259–9265. 10.1021/acs.analchem.9b02147. [DOI] [PubMed] [Google Scholar]
- [10].Song Y, Li X, Cong S, Zhao H, Tan M, Nuclear-targeted of TAT peptide-conjugated carbon dots for both one-and two-photon fluorescence imaging, Colloids Surf B Biointerfaces 180 (2019) 449–456. 10.1016/j.colsurfb.2019.05.015. [DOI] [PubMed] [Google Scholar]
- [11].Yang L, Wang Z, Wang J, Jiang W, Jiang X, Bai Z, He Y, Jiang J, Wang D, Yang L, Doxorubicin conjugated functionalizable carbon dots for nucleus targeted delivery and enhanced therapeutic efficacy, Nanoscale 8(12) (2016) 6801–6809. 10.1039/C6NR00247A. [DOI] [PubMed] [Google Scholar]
- [12].Liu Z, Qiu K, Liao X, Rees TW, Chen Y, Zhao Z, Ji L, Chao H, Nucleus-targeting ultrasmall ruthenium(iv) oxide nanoparticles for photoacoustic imaging and low-temperature photothermal therapy in the NIR-II window, Chem Commun (Camb) 56(20) (2020) 3019–3022. 10.1039/c9cc09728g. [DOI] [PubMed] [Google Scholar]
- [13].Fahrenkrog B, Aebi U, The nuclear pore complex: nucleocytoplasmic transport and beyond, Nat Rev Mol Cell Biol 4(10) (2003) 757–766. 10.1038/nrm1230. [DOI] [PubMed] [Google Scholar]
- [14].Yue L.-j., Wei Y.-y., Fan J.-b., Chen L, Li Q, Du J.-l., Yu S.-p., Yang Y.-z., Research progress in the use of cationic carbon dots for the integration of cancer diagnosis with gene treatment, New Carbon Materials 36(2) (2021) 373–389. 10.1016/S1872-5805(21)60025-2. [DOI] [Google Scholar]
- [15].Gao P, Liu S, Su Y, Zheng M, Xie Z, Fluorine-doped carbon dots with intrinsic nucleus-targeting ability for drug and dye delivery, Bioconjug Chem 31(3) (2020) 646–655. 10.1021/acs.bioconjchem.9b00801. [DOI] [PubMed] [Google Scholar]
- [16].Hua XW, Bao YW, Zeng J, Wu FG, Nucleolus-targeted red emissive carbon dots with polarity-sensitive and excitation-independent fluorescence emission: high-resolution cell imaging and in vivo tracking, ACS Appl Mater Interfaces 11(36) (2019) 32647–32658. 10.1021/acsami.9b09590. [DOI] [PubMed] [Google Scholar]
- [17].Duan Q, Che M, Hu S, Zhao H, Li Y, Ma X, Zhang W, Zhang Y, Sang S, Rapid cancer diagnosis by highly fluorescent carbon nanodots-based imaging, Anal Bioanal Chem 411(5) (2019) 967–972. 10.1007/s00216-018-1500-1. [DOI] [PubMed] [Google Scholar]
- [18].He X, Chen P, Zhang J, Luo TY, Wang HJ, Liu YH, Yu XQ, Cationic polymer-derived carbon dots for enhanced gene delivery and cell imaging, Biomater Sci 7(5) (2019) 1940–1948. 10.1039/c8bm01578c. [DOI] [PubMed] [Google Scholar]
- [19].Zhang L, Wang Z, Wang H, Dong W, Liu Y, Hu Q, Shuang S, Dong C, Gong X, Nitrogen-doped carbon dots for wash-free imaging of nucleolus orientation, Mikrochim Acta 188(6) (2021) 183. 10.1007/s00604-021-04837-7. [DOI] [PubMed] [Google Scholar]
- [20].Waters AM, Stafman LL, Garner EF, Mruthyunjayappa S, Stewart JE, Mroczek-Musulman E, Beierle EA, Targeting focal adhesion kinase suppresses the malignant phenotype in rhabdomyosarcoma cells, Transl Oncol 9(4) (2016) 263–273. 10.1016/j.tranon.2016.06.001. [DOI] [PMC free article] [PubMed] [Google Scholar]
- [21].Beierle EA, Ma X, Stewart J, Nyberg C, Trujillo A, Cance WG, Golubovskaya VM, Inhibition of focal adhesion kinase decreases tumor growth in human neuroblastoma, Cell Cycle 9(5) (2010) 1005–1015. 10.4161/cc.9.5.10936. [DOI] [PMC free article] [PubMed] [Google Scholar]
- [22].Hochwald SN, Nyberg C, Zheng M, Zheng D, Wood C, Massoll NA, Magis A, Ostrov D, Cance WG, Golubovskaya VM, A novel small molecule inhibitor of FAK decreases growth of human pancreatic cancer, Cell Cycle 8(15) (2009) 2435–2443. 10.4161/cc.8.15.9145. [DOI] [PMC free article] [PubMed] [Google Scholar]
- [23].Baibarac M, Smaranda I, Nila A, Serbschi C, Optical properties of folic acid in phosphate buffer solutions: The influence of pH and UV irradiation on the UV-VIS absorption spectra and photoluminescence, Sci Rep 9(1) (2019) 1–11. 10.1038/s41598-019-50721-z. [DOI] [PMC free article] [PubMed] [Google Scholar]
- [24].He YY, Wang XC, Jin PK, Zhao B, Fan X, Complexation of anthracene with folic acid studied by FTIR and UV spectroscopies, Spectrochim Acta A Mol Biomol Spectrosc 72(4) (2009) 876–889. 10.1016/j.saa.2008.12.021. [DOI] [PubMed] [Google Scholar]
- [25].Sanad MF, Puente Santiago AR, Tolba SA, Ahsan MA, Fernandez-Delgado O, Shawky Adly M, Hashem EM, Mahrous Abodouh M, El-Shall MS, Sreenivasan ST, Allam NK, Echegoyen L, Co-Cu bimetallic metal organic framework catalyst outperforms the Pt/C benchmark for oxygen reduction, J Am Chem Soc 143(10) (2021) 4064–4073. 10.1021/jacs.1c01096. [DOI] [PubMed] [Google Scholar]
- [26].Mehta VN, Jha S, Singhal RK, Kailasa SK, Preparation of multicolor emitting carbon dots for HeLa cell imaging, New J. Chem 38(12) (2014) 6152–6160. 10.1039/C4NJ00840E. [DOI] [Google Scholar]
- [27].Mintz KJ, Bartoli M, Rovere M, Zhou Y, Hettiarachchi SD, Paudyal S, Chen J, Domena JB, Liyanage PY, Sampson R, Khadka D, Pandey RR, Huang S, Chusuei CC, Tagliaferro A, Leblanc RM, A deep investigation into the structure of carbon dots, Carbon 173 (2021) 433–447. 10.1016/j.carbon.2020.11.017. [DOI] [Google Scholar]
- [28].Das P, Ganguly S, Saha A, Noked M, Margel S, Gedanken A, Carbon-dots-initiated photopolymerization: an in situ synthetic approach for MXene/poly(norepinephrine)/copper hybrid and its application for mitigating water pollution, ACS Appl Mater Interfaces 13(26) (2021) 31038–31050. 10.1021/acsami.1c08111. [DOI] [PubMed] [Google Scholar]
- [29].Su W, Guo R, Yuan F, Li Y, Li X, Zhang Y, Zhou S, Fan L, Red-emissive carbon quantum dots for nuclear drug delivery in cancer stem cells, J Phys Chem Lett 11(4) (2020) 1357–1363. 10.1021/acs.jpclett.9b03891. [DOI] [PubMed] [Google Scholar]
- [30].Ayiania M, Smith M, Hensley AJR, Scudiero L, McEwen J-S, Garcia-Perez M, Deconvoluting the XPS spectra for nitrogen-doped chars: an analysis from first principles, Carbon 162 (2020) 528–544. 10.1016/j.carbon.2020.02.065. [DOI] [Google Scholar]
- [31].Atchudan R, Edison TNJI, Perumal S, Muthuchamy N, Lee YR, Hydrophilic nitrogen-doped carbon dots from biowaste using dwarf banana peel for environmental and biological applications, Fuel 275 (2020) 1–10. 10.1016/j.fuel.2020.117821. [DOI] [Google Scholar]
- [32].Zhou Y, Zahran EM, Quiroga BA, Perez J, Mintz KJ, Peng Z, Liyanage PY, Pandey RR, Chusuei CC, Leblanc RM, Size-dependent photocatalytic activity of carbon dots with surface-state determined photoluminescence, Appl Catal B 248 (2019) 157–166. 10.1016/j.apcatb.2019.02.019. [DOI] [PMC free article] [PubMed] [Google Scholar]
- [33].Lazar P, Mach R, Otyepka M, Spectroscopic fingerprints of graphitic, pyrrolic, pyridinic, and chemisorbed nitrogen in N-doped graphene, The Journal of Physical Chemistry C 123(16) (2019) 10695–10702. 10.1021/acs.jpcc.9b02163. [DOI] [Google Scholar]
- [34].Lerf A, He H, Riedl T, Forster M, Klinowski J, 13C and 1H MAS NMR studies of graphite oxide and its chemically modified derivatives, Solid State Ionics 101 (1997) 857–862. 10.1016/S0167-2738(97)00319-6. [DOI] [Google Scholar]
- [35].Talebpour Z, Haghighi F, Taheri M, Hosseinzadeh M, Gharavi S, Habibi F, Aliahmadi A, Sadr AS, Azad J, Binding interaction of spherical silver nanoparticles and calf thymus DNA: Comprehensive multispectroscopic, molecular docking, and RAPD PCR studies, Journal of Molecular Liquids 289 (2019) 1–9. 10.1016/j.molliq.2019.111185. [DOI] [Google Scholar]
- [36].Shahabadi N, Fatahi S, Maghsudi M, Synthesis of a new Pt(II) complex containing valganciclovir drug and calf-thymus DNA interaction study using multispectroscopic methods, Journal of Coordination Chemistry 71(2) (2018) 258–270. 10.1080/00958972.2018.1433828. [DOI] [Google Scholar]
- [37].Sirajuddin M, Ali S, Haider A, Shah NA, Shah A, Khan MR, Synthesis, characterization, biological screenings and interaction with calf thymus DNA as well as electrochemical studies of adducts formed by azomethine [2-((3,5-dimethylphenylimino)methyl)phenol] and organotin(IV) chlorides, Polyhedron 40(1) (2012) 19–31. 10.1016/j.poly.2012.03.048. [DOI] [Google Scholar]
- [38].Kalanur SS, Katrahalli U, Seetharamappa J, Electrochemical studies and spectroscopic investigations on the interaction of an anticancer drug with DNA and their analytical applications, Journal of Electroanalytical Chemistry 636(1–2) (2009) 93–100. 10.1016/j.jelechem.2009.09.018. [DOI] [Google Scholar]
- [39].Psomas G, Mononuclear metal complexes with ciprofloxacin: Synthesis, characterization and DNA-binding properties, J Inorg Biochem 102(9) (2008) 1798–1811. 10.1016/j.jinorgbio.2008.05.012. [DOI] [PubMed] [Google Scholar]
- [40].Sirajuddin M, Ali S, Badshah A, Drug-DNA interactions and their study by UV-Visible, fluorescence spectroscopies and cyclic voltametry, J Photochem Photobiol B 124 (2013) 1–19. 10.1016/j.jphotobiol.2013.03.013. [DOI] [PubMed] [Google Scholar]
- [41].Bhattacharjee A, Das S, Das B, Roy P, Intercalative DNA binding, protein binding, antibacterial activities and cytotoxicity studies of a mononuclear copper(II) complex, Inorganica Chimica Acta 514 (2021) 1–12. 10.1016/j.ica.2020.119961. [DOI] [Google Scholar]
- [42].Alsaif NA, Al-Mehizia AA, Bakheit AH, Zargar S, Wani TA, A spectroscopic, thermodynamic and molecular docking study of the binding mechanism of dapoxetine with calf thymus DNA, South African Journal of Chemistry 73 (2020) 44–50. 10.17159/0379-4350/2020/v73a7. [DOI] [Google Scholar]
- [43].Lisa John V, Joy F, Jose Kollannoor A, Joseph K, Nair Y, P.V. T, Amine functionalized carbon quantum dots from paper precursors for selective binding and fluorescent labelling applications, J Colloid Interface Sci 617 (2022) 730–744. 10.1016/j.jcis.2022.03.070. [DOI] [PubMed] [Google Scholar]
- [44].Biswas N, Chaudhuri A, Chakraborty S, Choudhury CR, Example of square planar copper(II) biuret complex: crystal structure, DNA and protein binding activity and molecular docking study, Inorganic and Nano-Metal Chemistry 48(10) (2019) 495–507. 10.1080/24701556.2019.1572623. [DOI] [Google Scholar]
- [45].Almarhoon ZM, Al-Onazi WA, Alothman AA, Al-Mohaimeed AM, Al-Farraj ES, Synthesis DNA binding, and molecular docking studies of dimethylaminobenzaldehyde-based bioactive schiff bases, Journal of Chemistry 2019 (2019) 1–14. 10.1155/2019/8152721. [DOI] [Google Scholar]
- [46].Li J, Sun C, Lin Y, Zhi H, Fu Y, Liu Z, The interaction of proanthocyanidins with DNA molecules studied by atomic force microscopy and spectroscopic method, Ultramicroscopy 230 (2021) 1–5. 10.1016/j.ultramic.2021.113393. [DOI] [PubMed] [Google Scholar]
- [47].Ponkarpagam S, Mahalakshmi G, Vennila KN, Elango KP, Multi-spectroscopic, voltammetric and molecular docking studies on binding of anti-diabetic drug rosigiltazone with DNA, Spectrochim Acta A Mol Biomol Spectrosc 234 (2020) 1–7. 10.1016/j.saa.2020.118268. [DOI] [PubMed] [Google Scholar]
- [48].Maurya N, Imtiyaz K, Alam Rizvi MM, Khedher KM, Singh P, Patel R, Comparative in vitro cytotoxicity and binding investigation of artemisinin and its biogenetic precursors with ctDNA, RSC Adv 10(41) (2020) 24203–24214. 10.1039/D0RA02042G. [DOI] [PMC free article] [PubMed] [Google Scholar]
- [49].Sirajuddin M, Ali S, Shah NA, Khan MR, Tahir MN, Synthesis, characterization, biological screenings and interaction with calf thymus DNA of a novel azomethine 3-((3,5-dimethylphenylimino)methyl)benzene-1,2-diol, Spectrochim Acta A Mol Biomol Spectrosc 94 (2012) 134–142. 10.1016/j.saa.2012.03.068. [DOI] [PubMed] [Google Scholar]
- [50].Jalali F, Dorraji PS, Electrochemical and spectroscopic studies of the interaction between the neuroleptic drug, gabapentin, and DNA, J Pharm Biomed Anal 70 (2012) 598–601. 10.1016/j.jpba.2012.06.005. [DOI] [PubMed] [Google Scholar]
- [51].Zhou J, Yi Q, Tang L, The roles of nuclear focal adhesion kinase (FAK) on Cancer: A focused review, J Exp Clin Cancer Res 38(1) (2019) 1–11. 10.1186/s13046-019-1265-1. [DOI] [PMC free article] [PubMed] [Google Scholar]
- [52].Hu C, Chen X, Wen J, Gong L, Liu Z, Wang J, Liang J, Hu F, Zhou Q, Wei L, Shen Y, Zhang W, Antitumor effect of focal adhesion kinase inhibitor PF562271 against human osteosarcoma in vitro and in vivo, Cancer Sci 108(7) (2017) 1347–1356. 10.1111/cas.13256. [DOI] [PMC free article] [PubMed] [Google Scholar]
- [53].Megison ML, Gillory LA, Stewart JE, Nabers HC, Mrozcek-Musulman E, Beierle EA, FAK inhibition abrogates the malignant phenotype in aggressive pediatric renal tumors, Mol Cancer Res 12(4) (2014) 514–526. 10.1158/1541-7786.MCR-13-0505. [DOI] [PMC free article] [PubMed] [Google Scholar]
Associated Data
This section collects any data citations, data availability statements, or supplementary materials included in this article.


