

Summary
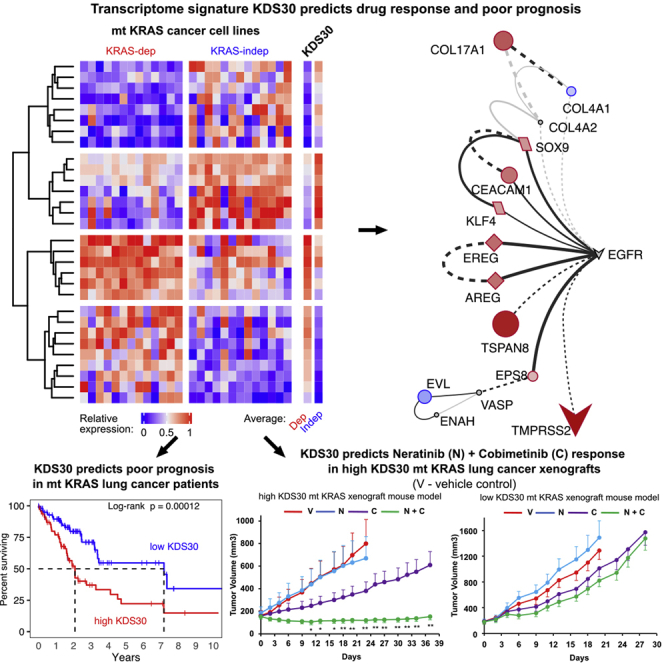
KRAS mutations are prevalent in pancreatic and lung cancers, but not all mutant (mt) KRAS tumors are addicted to mt KRAS. Here, we discovered a 30-gene transcriptome signature “KDS30” that encodes a novel EGFR/ERBB2-driven signaling network and predicts mt KRAS, but not NRAS or HRAS, oncogene addiction. High KDS30 tumors from mt KRAS lung and pancreatic cancer patients are enriched in genes upregulated by EGFR, ERBB2, mt KRAS or MEK. EGFR/ERBB2 (neratinib) and MEK (cobimetinib) inhibitor combination inhibits tumor growth and prolongs mouse survival in high, but not low, KDS30 mt KRAS lung and pancreatic xenografts, and is synergistic only in high KDS30 mt KRAS patient-derived organoids. Furthermore, mt KRAS high KDS30 lung and pancreatic cancer patients live significantly shorter lives than those with low KDS30. Thus, KDS30 can identify lung and pancreatic cancer patients whose tumors are addicted to mt KRAS, and predicts EGFR/ERBB2 and MEK inhibitor combination response.
Subject areas: Cancer, Transcriptomics
Graphical abstract
Highlights
-
•
KDS30 infers mt KRAS, but not mt HRAS or mt NRAS, oncogene addiction
-
•
KDS30 predicts poor prognosis in mt KRAS lung and pancreatic cancer patients
-
•
KDS30 predicts neratinib/cobimetinib response in mt KRAS lung and pancreatic cancer
-
•
EGFR/ERBB2-driven signaling network is a hallmark of high KDS30 KRAS-addicted tumors
Cancer; Transcriptomics
Introduction
The Ras proteins HRAS, KRAS, and NRAS belong to the superfamily of small guanosine triphosphatases (GTPases) that function as molecular switches cycling between GDP (inactive) and GTP (active) states.1 This binary switch is regulated by GTPase-activating proteins (GAPs) that accelerate the intrinsic GTPase activity of Ras leading to inactive Ras-GDP state, and Guanine-nucleotide-exchange factors (GEFs) that promote formation of active Ras-GTP state.2 Ras proteins are signal transducers that transfer biological information from external stimuli, such as growth factors, to multiple signaling pathways, such as Raf/Mek/Erk/Ets, PI3K/Akt/IKK/NFkB, RalGDS/Ral/Sec5/TBK1, TIAM1/Rac/PAK, and PLCε/DAG/PKC, that regulate gene expression, cytoskeleton organization, cell division, differentiation, and survival.3,4
Ras mutations are common in human cancers with an overall frequency of one in three cancer patients. Among the three Ras genes, KRAS mutations are most prevalent, with the highest frequencies among the deadliest cancers: 90% in pancreatic ductal adenocarcinoma (PDAC), 40% in colorectal cancer (CRC), and 30% in non-small cell lung cancer (NSCLC).5,6 Tumors that harbor KRAS mutations are highly aggressive, invasive, metastatic, associate with poor patient prognosis, and are resistant to several treatment modalities.7,8,9,10,11 Recently, inhibitors targeting one isoform of mt KRAS, KRAS-G12C, were developed and two of these, sotorasib and adagrasib, were FDA-approved for patients with advanced lung cancer and whose tumors harbor KRAS G12C mutations.12,13,14,15 However, the majority of KRAS mutations in human cancers are G12D and G12V, and these have been much harder to target.16 An alternative approach to targeting mt KRAS-driven cancers, independent of the type of KRAS mutation, is to target mt KRAS dependency, or KRAS “addiction”. It is now well documented that among human tumors that harbor KRAS mutations only some are mt KRAS-dependent whereas others are mt KRAS-independent, and that mt KRAS-dependent cancer cells have unique vulnerabilities.17,18,19,20,21,22,23,24,25,26 Therefore, understanding the mechanism of mt KRAS dependency is critical for understanding how mt KRAS drives tumorigenesis, and consequently, for identifying novel targets and developing innovative therapies against tumors driven by oncogenic mt KRAS.
The mechanisms underlying KRAS dependency are not well understood. Furthermore, it is now well established that the mutation status of KRAS alone is not sufficient to predict KRAS dependency,24,27 and neither is the type of KRAS mutation.17,20,21,24 Therefore, comprehensive genomic integrative studies are vital for identification of reliable molecular signatures, and their associated pathways, that define mt KRAS dependency. In this study we have identified a 30-gene expression mt KRAS dependency signature “KDS30” that predicts significantly shorter overall survival (OS) of mt KRAS lung and pancreatic cancer patients. Furthermore, we uncovered that mt KRAS addiction is driven, at least in part, by an EGFR/ERBB2-centric novel signaling network, and that mt KRAS-addicted tumors (high KDS30) are significantly more sensitive than mt KRAS-independent tumors (low KDS30) to the combination treatment of EGFR/ERBB2 and MEK inhibitors, both in human cancer cell lines and in xenograft models in vivo. Finally, we demonstrate that the combination of EGFR/ERBB2 and MEK inhibitors is synergistic at inhibiting the viability of high KDS30 mt KRAS-dependent but not low KDS30 mt KRAS-independent patient-derived tumor organoids.
Results
Discovery of a 30-gene transcriptome mt KRAS dependency signature
Figure 1 shows a workflow diagram summarizing the studies carried out in this manuscript. To unravel a transcriptome signature that defines mt KRAS dependency, we first identified two groups of mt KRAS-harboring human cancer cell lines, one most mt KRAS-dependent and one least mt KRAS-dependent. This was accomplished by analyzing 129 mt KRAS-harboring human cancer cell lines from the publicly available Cancer Cell Line Encyclopedia (CCLE) where CRISPR/Cas9 sensitivity screen was performed under project Achilles (listed in Table S1).28,29 Figure 2A shows KRAS dependency CERES scores29 inferred from this CRISPR/Cas9 KRAS knockout screen with smaller CERES score values indicating larger effect on cell viability on loss of the KRAS gene.28 We thus refer to cell lines with smallest and largest CERES scores as most and least KRAS-dependent, respectively. To identify a transcriptome signature of mt KRAS dependency, we compared gene expression profiles of the top 10% cancer cell lines most dependent on mt KRAS (13 cell lines with CERES scores below the 0.1 quantile; here, ranging from −1.6 to −2.2, Figure 2A, green; cell line names are listed below the heatmap in Figure 2B and highlighted in green in Table S1) to those top 10% least dependent on mt KRAS (13 cell lines with CERES scores above the 0.9 quantile; here, ranging from −0.55 to −0.16, Figure 2A, maroon; cell line names are listed below the heatmap in Figure 2B and highlighted in red in Table S1). Application of the prediction analysis of microarrays (PAM) algorithm30 on these cell lines (see STAR Methods) gave a list of genes differentially expressed between the two groups leading to an expression pattern that associates with mt KRAS dependency. To ensure the robustness of this association, we repeated the PAM analysis 26 times each time on 25 cell lines with one cell line removed at a time. This led to the selection of a 30-gene KRAS dependency signature (KDS30) where the 30 genes repeatedly characterized mt KRAS dependency group (see STAR Methods). Figure 2B shows relative expression of the 30 genes in the top 10% most mt KRAS-dependent cell lines (marked in green) and top 10% least mt KRAS-dependent cell lines (marked in maroon). From these transcriptome measurements, a KDS30 score of any cancer cell line or any tumor sample can be calculated as a Pearson Correlation Coefficient (PCC) between the average of the top 10% most mt KRAS-dependent cancer cell lines (marked as “Average Dep” in Figure 2B and listed in Table S1) and the relative expression of the 30 genes in that cell line or tumor sample (see “Calculation of the KDS30 score” in the STAR Methods section). The KDS30 scores can range from −1 to 1 and serve as a tool to assess the degree of mt KRAS dependency of a cell line or a tumor sample as supported by the results described immediately below.
Figure 1.

Study workflow
KRAS CERES scores for all mt KRAS cell lines (CCLE) were extracted from project Achilles. Transcriptome data of mt KRAS CCLE with highest and lowest CERES scores were then supplied to PAM algorithm and 30 genes were identified as most descriptive of high mt KRAS dependency (see main text for details). We name the signature “KDS30.” TCGA data were used to test prognostic value of KDS30 and databases with drug viability results were mined to test KDS30 ability to predict drug responses. The in-silico studies were validated using mt KRAS human cancer cell lines, xenograft models and patient-derived tumor organoids (PDOs).
Figure 2.

Discovery of a 30-gene expression mt KRAS dependency signature KDS30
(A) Effect of KRAS loss on cell viability in mt KRAS cancer cell lines. Sensitivity to KRAS loss relative to other cell lines was determined via CRISPR/Cas9 gRNA KRAS knockout by project Achilles/CERES algorithm and are referred to as ‘KRAS dependency score (CERES)’. Highlighted are 10% cell lines most KRAS-dependent (green) and 10% cell lines least KRAS-dependent (maroon). Cell lines’ names are provided below the heatmap in Figure 2B.
(B) Relative expression of the 30 genes underlying KRAS dependency signature from the application of PAM algorithm on top 10% cell lines most and least dependent on KRAS (colors as in Figure 2A, respectively). The resulting KDS30 is presented in column “Dep”. Red: high expression with 1 indicating most expressed gene among the 30 genes. Blue: low expression.
(C and D) Spearman correlation ‘R’ calculated between KDS30 and KRAS CERES scores across mt KRAS (C) and WT KRAS (D) cancer cell lines.
(E–G) KDS30 association with KRAS dependency scores as measured in three genome-wide screens (project Achilles, project DRIVE and DepMap/DEMETER2). Cell lines with highest/lowest KDS30 scores were selected (X-axis) and plotted against their ‘KRAS dependency score’ (Y-axis) as determined with gRNA screen by project Achilles/CERES (E), or shRNA screens by project DRIVE/ATARiS (F) and DepMap/DEMETER2 (G). In (E), X-axis: KDS30 > 0.8 for “High KDS30” cell lines and KDS30 <−0.1 for “Low KDS30” cell lines. In (F), KDS30 > 0.8 vs. KDS30 < 0.2, respectively. In (G), KDS30 > 0.8 vs. KDS30 <−0.3, respectively.
(H) KDS30 association with KRAS dependency as determined by Singh et al. 2009. X-axis: KRAS-dependent (“dep”, n = 17) and KRAS-independent (“indep”, n = 13) cell lines (also listed in Table S1), Y-axis: KDS30 scores. (I-J) KDS30 scores correlated with project Achilles/CERES scores for KRAS in mt KRAS pancreatic (I) and mt KRAS lung (J) cancer cell lines. See also Figure S1.
The 30-gene transcriptome signature KDS30 predicts KRAS dependency in cell lines that harbor mt KRAS, but not WT KRAS, mt HRAS or mt NRAS
To validate the KDS30 transcriptome signature ability to predict KRAS dependency, we first correlated KDS30 scores to gRNA CRISPR-derived CERES scores in both the 129 mt KRAS cell lines and the 603 WT KRAS cell lines from CCLE. Accordingly, we found a statistically significant correlation between KRAS gRNA CRISPR-derived dependency CERES scores and KDS30 scores calculated across the 129 mt KRAS cell lines (R = −0.47 [95% CI:−0.59 to −0.32], p<0.001) (Figure 2C). In contrast, there was no correlation across the 603 WT KRAS cell lines (R = −0.07 [95%CI:−0.15 to −0.01], p = 0.07) (Figure 2D), indicating that KDS30 is specific for predicting KRAS dependency level of mt KRAS but not WT KRAS cancer cell lines. A Student’s t-test was performed to further examine the association between KRAS CERES scores and KDS30 scores in the 129 mt KRAS cancer cell lines with highest and lowest KDS30 scores. Figure 2E shows that the KRAS gRNA CRISPR-derived CERES scores associate with KDS30 scores at a highly statistically significant level (Student’s t test p = 6.83e-7). These results demonstrate that KDS30 scores predict the extent of KRAS gene loss on cell viability as measured by CERES scores. We next examined the ability of KDS30 to predict oncogene addiction to two closely related RAS family members mt HRAS and mt NRAS, and found no correlation between KDS30 scores and either HRAS or NRAS gRNA CRISPR-derived CERES scores in the 21 mt HRAS (PCC = −0.23) and 57 mt NRAS (PCC = 0.03) cell lines included in the same project Achilles sensitivity screen database. These results indicate that KDS30 does not predict the effects of NRAS and HRAS gene loss on cell viability in mt NRAS and mt HRAS cancer cell lines, respectively.
KDS30 predicts mt KRAS dependency in shRNA and siRNA screens
We next determined whether the KDS30 scores correlate with mt KRAS dependency in two other genome-wide KRAS depletion screens: project DRIVE31 and DepMap’s DEMETER2 scores32 where shRNAs were used to downregulate KRAS. We found a statistically significant correlation of KDS30 scores with shRNA derived KRAS dependency ATARiS scores in project DRIVE (78 mt KRAS cell lines, PCC = −0.46, p = 2.6e-5) and with DEMETER2 scores in DepMap’s DEMETER2 dataset (125 mt KRAS cell lines, PCC = −0.39, p = 5.7e-6). Moreover, Student’s t-test analysis of the cell lines with highest and lowest KDS30 scores showed a statistically significant association between shRNA-derived KRAS dependency ATARiS and DEMETER2 scores and KDS30 scores in both screens (Figures 2F and 2G, respectively). Thus, KDS30 scores predict the extent of KRAS gene shRNA depletion on cell viability as measured by ATARiS and DEMETER2 scores.
We also examined if KDS30 can predict KRAS dependency status of the 13 KRAS-dependent and 17 KRAS-independent mt KRAS cell lines from the study by Singh et al.17 where KRAS dependency status was determined following a KRAS siRNA depletion (listed in Table S1). Applying a threshold of KDS30 = 0.5 to define cells that are dependent on KRAS, Figure 2H shows that all 13 KRAS-dependent cells were scored correctly with KDS30 above 0.5, whereas 14 out of 17 KRAS-independent cells were scored correctly with KDS30 scores smaller than 0.3. We can thus conclude that using KDS30 scores we were able to correctly separate 27 out of the 30 cell lines into their respective KRAS-dependent (mean KDS30 scores = 0.7) vs. KRAS-independent (mean KDS30 scores = 0.28) status. In contrast to KDS30 scores, neither project Achilles/CERES scores nor DepMap/DEMETER2 scores could be used to effectively predict KRAS dependency of the Singh et al. cell lines (Figure S1). This further underscores the utility of KDS30 to discriminate between KRAS-dependent and KRAS-independent cancer cell lines, offering a robust diagnostic method for determining KRAS dependency status of mt KRAS cancer cell lines.
KDS30 predicts mt KRAS dependency in mt KRAS lung and pancreatic cancer cell lines
We showed that KDS30 scores correlate with KRAS gRNA CRISPR-derived dependency CERES scores across 129 mt KRAS cell lines from any cancer type (Figure 2C). Next, we sought to determine whether KDS30 can predict mt KRAS dependency in cancers where KRAS mutations are prevalent such as pancreatic, lung, and colon cancers. KDS30 scores correlated with CRISPR-derived CERES KRAS dependency scores at a statistically significant level in pancreatic (Figure 2I) and lung (Figure 2J), but not colon (Figure S1), cancer cell lines.
KDS30 serves as a prognostic biomarker in mt KRAS LUAD and mt KRAS PAAD patients
The ability of the novel 30-gene transcriptome signature KDS30 to accurately predict mt KRAS dependency in mt KRAS cancer cell lines prompted us to evaluate whether patients with high KDS30 score mt KRAS tumors live shorter lives. To this end, we calculated the KDS30 scores of mt KRAS tumors from TCGA cancer patients and evaluated these scores in terms of patient risk of earlier death (or, hazard ratio HR) and overall survival (OS). Among all cohorts analyzed (lung, pancreatic, colon, breast, ovarian and other cancer patients), only LUAD and PAAD patients showed a statistically significant HR associated with high KDS30 scores (Figure 3A, red). Figure 3B shows that mt KRAS LUAD patients whose tumors have KDS30 score higher than 0.3 have significantly shorter median OS (2.1 years) than mt KRAS LUAD patients whose tumors have lower than 0.3 KDS30 score (7.2 years). Therefore, mt KRAS LUAD patients with high KDS30 had median 5.1 years shorter lives than those with low KDS30 scores. Similarly, Figure 3C shows that mt KRAS PAAD patients whose tumors have higher than 0.46 KDS30 score have significantly shorter median OS (15 months) than mt KRAS PAAD patients whose tumors have KDS30 score lower than 0.46 (23 months). Therefore, mt KRAS PAAD patients with high KDS30 had median 8 months shorter lives than those with low KDS30 scores. This ability of KDS30 to predict poor OS was also observed in three more independent cohorts of mt KRAS PAAD patients collected from International Cancer Genome Consortium (ICGC) (see Figure S2). The subsequent prognostic receiver operating characteristic (ROC) curve analysis33 further supported the statistically significant differences in OS. In this new analysis, 1 minus OS of high KDS30 patients is plotted against 1 minus OS of low KDS30 patients and the area under the resulting ROC curve (AUC) is calculated to determine the probability of the high KDS30 patients to live shorter lives compared to low KDS30 patients. For instance, Figure S2 shows prognostic ROC curve of the mt KRAS LUAD patients with the AUC between 0.67 and 0.72 (see STAR Methods) suggesting that high KDS30 mt KRAS LUAD patients have a probability between 0.67 and 0.72 to live shorter lives compared to those with low KDS30 tumors. Similarly, high KDS30 mt KRAS PAAD patients have a probability of 0.69 to live shorter lives compared to those with low KDS30 tumors (Figure S2).
Figure 3.

KDS30 predicts poor survival in mt KRAS lung and pancreatic cancer patients
(A) X-axis: Cox proportional hazard ratio and 95% confidence intervals (CI) on a log10 scale. Y-axis: only tumor types with minimum 50 mt KRAS cases are plotted. High KDS30 scores associate with significantly higher HR in mt KRAS LUAD and mt KRAS PAAD cancer patients (marked in red).
(B and C) Kaplan-Meier (K-M) plots for mt KRAS LUAD and mt KRAS PAAD cancer patients. Censored OS of patients whose tumors were most correlated with KDS30 (green) are plotted against OS of the remaining patients (black). The difference in median OS is statistically significant in both cohorts. In LUAD/PAAD, a KDS30 threshold of 0.3/0.46 was applied.
(D) High “H” and low “L” KDS30 mt KRAS PAAD tumors presented in Figure 3C were further stratified into basal-like “B” (dark green and gray) and classical “C” (light green and black) tumors as per Moffitt et al. definition (see STAR Methods and Table S1). ‘Number at risk’ tables below each K-M plot show the number of patients that were alive at indicated time points. Dashed lines: median OS in each group.
(E and F) Comparison of KDS30 scores in mt KRAS tumors versus matching normal samples in lung (n = 11) and pancreatic (n = 4) cancer patients, respectively. p-value: one-sided paired t-test with alternative hypothesis “greater”. See also Figure S2.
KDS30 allows further stratification of the classical and basal-like pancreatic cancer tumor subtypes
Moffitt et al.34 identified a gene expression signature that distinguishes between classical and basal-like PDAC tumor subtypes and suggested that the latter was enriched for genes related to KRAS activation. This prompted us to determine whether KDS30 associates with either of the two tumor subtypes. Application of a hierarchical clustering on mt KRAS PAAD patient tumor samples using Moffitt et al.34 gene list (also provided in Table S1) allowed us to identify two categories of patient tumors, either classical or basal-like subtypes, but neither one associated with patient tumors KDS30 scores (21 and 52 high KDS30 tumors that are basal and classical, respectively, against 8 and 32 low KDS30 tumors that are basal and classical, respectively; Chi-squared test p-value = 0.43). Importantly, however, Figure 3D shows that PAAD patients with basal-like tumors that have high KDS30 scores had much shorter survival (median OS 8.2 months, dark green) than patients with classical tumors that have low KDS30 scores (median OS 22.6 months, black), whereas patients with high KDS30 classical tumors had intermediate survival (median OS 16.7 months, light green). Even though only a few patients had low KDS30 basal-like tumors in this dataset (L-B), their OS clearly separated out from high KDS30 basal-like tumors (Figure 3D, dark green and light gray lines). Again, the AUC values for the prognostic ROC curves further confirmed the presence of statistically significant differences between these groups where patients with high KDS30 and basal (H-B) tumors appear to have a probability of 0.71 and 0.84 to live shorter lives than patients with high KDS30 and classical (H-C) tumors, or low KDS30 and classical (L-C) tumors, respectively (Figure S2). These results demonstrate that KDS30 allows further stratification of the classical and basal-like PDAC subtypes offering a significant improvement in predicting pancreatic cancer patient prognosis based on the KRAS dependency status of their tumors.
The ability of KDS30 to predict poor survival prompted us to determine its specificity for tumor samples over their adjacent normal tissue samples. Figures 3E and 3F show that the KDS30 scores were consistently higher in tumor samples compared to adjacent normal tissues for both lung (n = 11 tumor/normal pairs) and pancreatic (n = 4 tumor/normal pairs) cancer patients in TCGA (p = 0.008 and p = 0.02, respectively).
KDS30 reveals a novel EGFR/ERBB2-driven signaling network
The discovery that KDS30 successfully predicts mt KRAS dependency and survival in lung and pancreatic cancer patients prompted us to determine whether, in mt KRAS-dependent tumors, the 30 genes exploit unique signal transduction networks to drive mt KRAS dependency. To this end, we first subjected the list of the 30 genes of KDS30 to the protein-protein interaction (PPI) network reconstruction using the STRING database35 and visualized the results with Cytoscape.36 The analysis revealed an EGFR-driven novel signaling network linking 9 upregulated proteins (indicated in red in Figure 4A; EGFR Pathway Substrate 8 (EPS8), the EGFR ligands Amphiregulin (AREG) and Epiregulin (EREG), Tetraspanin 8 (TSPAN8), carcinoembryonic antigen Cell Adhesion Molecule 1 (CEACAM1), SRY-Box Transcription Factor 9 (SOX9) and KruppelLike Factor 4 (KLF4), TMPRSS2 and COL17A1)) and 2 downregulated proteins (indicated in blue in Figure 4A; CollagenType IV Alpha 1 Chain (COL4A1) and Enah/Vasp-Like (EVL)) in high KDS30 mt KRAS most dependent cells compared to low KDS30 least mt KRAS-dependent cells. Consistent with these results, GO enrichment analysis performed with ShinyGo37 on the 30 genes of KDS30 revealed that 14 out of the 30 genes have biological functions related to “ERBB signaling pathways”, “EGFR signaling pathways”, and “Regulation of ERBB signaling pathways” which have the top three most statistically significant enrichments with FDR = 0.000016, 0.00013, and 0.0012, respectively (Figure 4B and Table S2). These 14 genes encode the following proteins: EPS8, AREG, EREG, TSPAN8, CEACAM1, Vasoactive Intestinal Peptide Receptor 1 (VIPR1), Lipid Raft Linker 1 (RFTN1), SH3 Domain and Tetratricopeptide Repeats 2 (SH3TC2), COL4A1, RNA Binding Protein, mRNA Processing Factor 2 (RBPMS2), EVL, O-Fucosylpeptide 3-Beta-N-Acetylglucosaminyltransferase (LFNG), SOX9 and KLF4. Among these 14 proteins, 6 (AREG, EREG, SOX9, SH3TC2, CEACAM1 and EPS8) mediate ERBB signaling pathway (FDR = 1.6e-5). The mean expression of these genes was higher in the most KRAS-dependent cell lines compared to the least KRAS-dependent cell lines, according to their KDS30 scores. This was observed with any type of cancer (Figure 4B, first 2 columns marked “Any”) as well as in pancreatic (Figure 4B, columns 3 and 4) and lung (Figure 4B, columns 5 and 6) cancer cell lines. Finally, EnrichR38 tool analysis of the 30 genes revealed “KRAS Signaling up” (genes transcriptionally upregulated by activated KRAS), to be the most significantly enriched MSigDB Hallmark Gene Set39 (p = 0.003, Table S2).
Figure 4.

ERBB signaling constitutes the core of KRAS dependency
(A) PPI network of the 30 genes generated with STRING and visualized with Cytoscape. Colors indicate log2FC (nodes’ size indicates absolute log2FC) in gene expression between 20 most mt KRAS-dependent and 20 most mt KRAS-independent cell lines.
(B) Results from GO enrichment analysis of the 30 genes using ShinyGO. Only terms with FDR<0.01 are plotted. Expression of genes from each category was averaged among cell lines with smallest and highest KDS30 scores. ‘Any (L)’ represents mt KRAS cancer cell lines with 10 lowest KDS30 scores. ‘Any (H)’ represents mt KRAS cancer cell lines with 10 highest KDS30 scores. ‘Panc (L)’ and ‘Panc (H)’ represent mt KRAS pancreatic cancer cell lines with 4 lowest and 4 highest KDS30 scores, respectively. ‘Lung (L)’ and ‘Lung (H)’ represent mt KRAS lung cancer cell lines with 4 lowest and 4 highest KDS30 scores, respectively.
(C and E) EGFR/ERBB2 (in blue), MEK (in red) and RAF (in green) inhibitors that were found to selectively kill high KDS30 over low KDS30 PAAD (in C) or LUAD (in E) cancer cells, considering max top 40 drugs. PRISM_1ry: primary PRISM Repurposing screen, PRISM_2ry: secondary PRISM Repurposing screen, CTRP: Cancer Therapeutics Response Portal v2. Y-axis: difference in mean FC or mean AUC, see main text. Only inhibitors of EGFR/ERBB2/MEK/RAF with p<0.05 are shown.
(D and F) Results from drug sensitivity data analysis for mt KRAS pancreatic cancer cells included in the PRISM 2ry screen (D) and mt KRAS lung cancer cell lines included in the CTRP screen (F). Mean AUC of high KDS30 cells was subtracted from mean AUC of low KDS30 cells and plotted on X-axis. See main text for thresholds. Student’s t-test was applied to determine the statistical significance to observe the difference and plotted on Y-axis. MEK inhibitors are highlighted in red. EGFR/ERBB2 inhibitors are highlighted in blue. NERA: neratinib; SELU: selumetinib; TRAM: trametinib; PD31: PD-318088; AFAT: afatinib; GEFI: gefitinib; AZD8: AZD8931; DACO: dacomitinib; TUCA: tucatinib; CANE: canertinib; COBI: cobimetinib; AS70: AS-703026; OSIM: Osimertinib; ERLO: erlotinib. See also Figure S3.
To further validate these cancer cell line findings in cancer patient tumors, we performed Gene Set Enrichment Analysis (GSEA40) of the transcriptomic data of mt KRAS tumors from either mt KRAS LUAD or mt KRAS PAAD cancer patients. Figure S3 shows that the most enriched term in patient tumors with high KDS30 scores is the established signature of KRAS oncogenic pathway activation “SINGH_KRAS_DEPENDENCY_SIGNATURE”. This is a significant finding as it underscores the power of KD30 scoring system and its applicability to KRAS dependency diagnosis in patient tumor samples. Other oncogenic signature gene sets from MSigDB that were also enriched in high KDS30 tumors from mt KRAS LUAD and mt KRAS PAAD patients included the oncogenic signatures KRAS.DF.V1_UP (“Genes up-regulated in epithelial lung cancer cell lines over-expressing an oncogenic KRAS”), MEK_UP.V1_UP (“Genes upregulated upon stable overexpression of MAP2K1 in ESR1-positive MCF-7 breast cancer cells”), EGFR_UP.V1_UP (“Genes up-regulated in ESR1 positive MCF-7 breast cancer cells engineered to express ligand-activatable EGFR”), ERBB2_UP.V1_UP (“Genes up-regulated in ESR1 positive MCF-7 breast cancer cells engineered to express ligand-activatable ERBB2”). Taken together, our GSEA of mt KRAS LUAD and mt KRAS PAAD patient high KDS30 tumors’ transcriptomic data analyses results, coupled with GO enrichment analysis and the PPI STRING of the 30 genes revealed that KRAS dependency is driven, at least in part, by an EGFR/ERBB2-centric signaling network.
Mt KRAS lung and pancreatic cancer cells with high KDS30 scores are significantly more sensitive to EGFR/ERBB2 and MEK inhibitors than those with low KDS30 scores
The ability of KDS30 to predict mt KRAS dependency and OS of mt KRAS LUAD and mt KRAS PAAD patients, prompted us to determine whether we can use KDS30 as a biomarker to identify drugs that can selectively kill tumors that are addicted to mt KRAS. To this end, we mined drug response data from three independent sources: (1) The primary PRISM Repurposing data of 4,686 drugs screened at a single dose against 120 mt KRAS cancer cell lines (of those, 21 are LUAD and 35 PAAD); (2) the secondary PRISM Repurposing data of 147 drugs screened in a dose response manner against 105 mt KRAS cancer cell lines (of those, 19 are LUAD and 31 PAAD; MTS010 screen); and (3) the Cancer Therapeutics Response Portal (CTRP v2) of 545 drugs screened in a dose response manner against 163 mt KRAS cancer cell lines (of those, 25 are LUAD and 34 PAAD). In each screen, we compared the drug sensitivity of lung and pancreatic cancer cell lines with highest KDS30 scores (KDS30>0.6 for lung and KDS30>0.85 for pancreas) to that of lung and pancreatic cancer cell lines that had the lowest KDS30 scores (KDS30<0.2 for lung and KDS30<0.3 for pancreas). For each drug, either the fold change (FC from the single dose screen) or the area under the curve (AUC from the dose response screens) were used respectively, to determine the difference in the mean FC or AUC of the highest and lowest KDS30 cancer cell lines. The comprehensive results of these analyses are listed in Tables S3 and S4. Figure 4C shows that for mt KRAS human pancreatic cancer cell lines, inhibitors of MEK (in red, e.g., cobimetinib, trametinib, selumetinib, AZD8330, AS-703026, PD-318088) were consistently among the top 20 drugs selectively inhibiting the viability of highest over lowest KDS30 cancer cell lines. Figure 4C also shows that EGFR/ERBB2 inhibitors (in blue, e.g., dacomitinib, osimertinib, lapatinib, XL-647, poziotinib, GW-583340, EGF816, CGP-53353, canertinib, tucatinib, erlotinib, AZD8931, WZ8040) were among the top drugs selectively inhibiting the viability of highest over lowest KDS30 pancreatic cancer cell lines. Similarly, Figure 4D shows that several EGFR/ERBB2 inhibitors (in blue, e.g., neratinib, gefitinib, dacomitinib, afatinib, EGF816/nazartinib, AZD8931) and MEK inhibitors (in red, e.g., selumetinib, trametinib, PD31) were among the top drugs that selectively inhibited the viability of highest over lowest KDS30 mt KRAS human lung cancer cell lines. Figures 4E and 4F represent volcano plots of these findings for mt KRAS PAAD and mt KRAS LUAD cell lines using either PRISM secondary screen or CTRP as examples, respectively (see Tables S3 and S4 for a full list of drugs that selectively kill high over low KDS30 mt KRAS PAAD and mt KRAS LUAD cell lines). The observation that MEK and EGFR/ERBB2 inhibitors kill selectively highest over lowest KDS30 cells suggests that only highly mt KRAS dependent cancer cells are likely to use EGFR/ERBB2/KRAS-driven MAPK signaling pathway to drive KRAS dependency, consistent with Figures 4A and 4B, Table S2 as well as the above-described GSEA results of mt KRAS tumors from LUAD and PAAD patients.
Combination of EGFR/ERBB2 and MEK inhibitors induces apoptosis only in high KDS30 mt KRAS-dependent human lung and pancreatic cancer cells
The identification of EGFR/ERBB2 and MEK inhibitors as selective cell viability inhibitors of high KDS30 mt KRAS-dependent over low KDS30 mt KRAS-independent cancer cells (Figures 4C–4F), prompted us to test the hypothesis that combinations of EGFR/ERBB2 and MEK inhibitors will induce apoptosis selectively in mt KRAS-dependent human cancers. To this end, we compared the sensitivity of H358 and Panc0203 (highly mt KRAS-dependent lung and pancreatic cancer cell lines with KDS30 scores of 0.71 and 0.89, respectively) to that of LU99 and Panc1 (mt KRAS-independent lung and pancreatic cancer cell lines with KDS30 scores of −0.31 and 0.28, respectively) to combinations of MEK and EGFR/ERBB2 inhibitors. The cells were treated with either single agents or combinations of inhibitors of EGFR/ERBB2 (neratinib, gefitinib, osimertinib, lapatinib, dacomitinib) and MEK (cobimetinib, selumetinib, trametinib) that were among the top drugs identified in Figure 4, and the effects of single agent treatments were compared to those of combination treatments. Figure 5 shows that in the mt KRAS-addicted high KDS30 H358 lung cancer cells, the EGFR inhibitor gefitinib suppressed the levels of P-EGFR, P-ERBB2 and P-ERK1/2, whereas the MEK inhibitor selumetinib suppressed the levels of P-ERK1/2 but significantly increased those of P-EGFR and P-ERBB2. The ability of selumetinib to increase P-EGFR and P-ERBB2 levels was blocked by gefitinib, and the combination of selumetinib and gefitinib resulted in suppression of P-EGFR, P-ERBB2 and P-ERK1/2 levels. Furthermore, the combination, but not single agent, treatment induced apoptosis as evident by Caspase-3 activation and PARP cleavage (Figure 5). In the mt KRAS-independent low KDS30 LU99 lung cancer cells, gefitinib suppressed the levels of P-EGFR and P-ERBB2, but unlike in H358 cells, had no effects on P-ERK1/2 levels. The MEK inhibitor selumetinib suppressed the levels of P-ERK1/2 but only slightly increased those of P-EGFR and P-ERBB2. The combination of selumetinib and gefitinib resulted in suppression of P-EGFR, P-ERBB2 and P-ERK1/2, but in contrast to H358 cells, the combination did not induce apoptosis in LU99 cells (Figure 5). Similar results were observed when the same MEK inhibitor selumetinib was combined with osimertinib, another EGFR inhibitor, or with EGFR/ERBB2 inhibitors lapatinib, neratinib or dacomitinib, where the combinations selumetinib/osimertinib, selumetinib/lapatinib, selumetinib/neratinib, and selumetinib/dacomitinib induced apoptosis in H358, but not in LU99, cells (Figure 5, see Table 1 for drug doses used). Furthermore, combinations with other MEK inhibitors such as trametinib/osimertinib, cobimetinib/osimertinib, cobimetinib/neratinib, all induced apoptosis in H358, but not in LU99, cells (Figure 5, Table 1).
Figure 5.

mt KRAS addicted lung cancer lines are highly sensitive to the combination of EGFR/ERBB2 inhibitors with MEK inhibitors
High KDS30 H358 and low KDS30 LU99 lung cancer cells were treated with vehicle control (Ctrl), an EGFR/ERBB2 inhibitor and a MEK inhibitor, either alone or in combination as indicated on each figure panel, for 48 h and processed for western blotting as described in STAR Methods. pEGFR, pErbB2, pERK: phosphorylated EGFR, ErbB2, and ERK, respectively. c-Casp3 and c-PARP: cleaved Casp3 and PARP, respectively. Actin: loading control. Single ∗ and double ∗∗ indicate gels each protein is blotted from. See also Figure S4.
Table 1.
| Drug Combinations | Panc0203 | Panc1 | H358 | LU99 |
|---|---|---|---|---|
| Dacometinib + Selumetinib | 1.5 + 1 | 1.5 + 50 | 1.5 + 8 | 1.5 + 8 |
| Osimetinib + Selumetinib | 6 + 1 | 15 + 50 | 6 + 8 | 6 + 8 |
| Neratinib + Selumetinib | 2 + 1 | 2 + 50 | 0.5 + 8 | 1 + 8 |
| Gefitinib + Selumetinib | 15 + 1 | 25 + 50 | 8 + 8 | 8 + 8 |
| Lapatinib + Selumetinib | 8 + 1 | 15 + 50 | 8 + 8 | 8 + 8 |
| Osimetinib + Trametinib | 6 + 1 | 15 + 50 | 6 + 0.01 | 6 + 0.01 |
| Osimetinib + Cobimetinib | 6 + 0.4 | 15 + 12 | 6 + 0.4 | 6 + 0.8 |
| Neratinib + Cobimetinib | 2 + 0.4 | 2 + 12 | 0.5 + 0.4 | 1 + 0.8 |
Listed combinations were tested on 4 cancer cell lines, as indicated in the column names (Panc0203, Panc1, H358, LU99). Numbers indicate concentrations used, in µM, for each drug in a pair.
In the mt KRAS-addicted high KDS30 Panc0203 pancreatic human cancer cells, the EGFR inhibitor gefitinib decreased the levels of P-EGFR and P-ERBB2 and slightly increased P-ERK1/2 levels, whereas the MEK inhibitor selumetinib decreased the levels of P-ERK1/2 but did not affect those of P-EGFR and P-ERBB2 (Figure S4). In contrast, the combination of selumetinib and gefitinib resulted in suppression of P-EGFR, P-ERBB2, and P-ERK1/2 levels. Furthermore, the combination, but not single agent, treatment induced apoptosis (Figure S4). In the mt KRAS-independent low KDS30 Panc1 pancreatic cancer cells, gefitinib suppressed the levels of P-EGFR and P-ERBB2 and had no effects on P-ERK1/2 levels. The MEK inhibitor selumetinib suppressed the levels of P-ERK1/2 but increased those of P-ERBB2 with no effects on the levels of P-EGFR. The combination of selumetinib and gefitinib resulted in suppression of P-EGFR, P-ERBB2, and P-ERK1/2, but in contrast to Panc0203, the combination did not induce apoptosis in Panc1 cells (Figure S4). Similarly, the combinations of selumetinib/osimertinib, selumetinib/lapatinib, and trametinib/osimertinib induced apoptosis in Panc0203, but not in Panc1, cells (Figure S4). Furthermore, the combinations of selumetinib/neratinib, selumetinib/dacomitinib, cobimetinib/osimertinib, and cobimetinib/neratinib induced apoptosis more potently in Panc0203 cells than in Panc1 cells. Neratinib and dacomitinib as single agents induced apoptosis in Panc1 but not in Panc0203 cells. However, the induction of apoptosis in Panc1 cells with neratinib and dacomitinib, as single agents, was less potent than when neratinib and dacomitinib were used in combination with MEK inhibitors in the high KDS30 Panc0203 cells (Figure S4, Table 1).
The MEK inhibitor cobimetinib and the EGFR/ERBB2 inhibitor neratinib combination is efficacious in vivo in mt KRAS human lung and pancreatic cancer xenografts with high but not those with low KDS30 scores
The higher efficacy of the combinations of inhibitors of MEK and EGFR/ERBB2/4 to induce apoptosis in high as compared to low KDS30 mt KRAS lung and pancreatic cancer cells prompted us to determine the effects of MEK and EGFR/ERBB2 inhibitor combination on tumor growth in vivo in mouse xenografts. To this end, we performed the following in vivo xenografts studies with the combination of neratinib and cobimetinib as representatives of EGFR/ERBB2 inhibitors and MEK inhibitors, respectively. As such, we subcutaneously implanted one set of nude mice with high KDS30 mt KRAS H358 cells and another set with low KDS30 mt KRAS LU99 cells. After tumors were palpable, mice were divided into four groups: control, cobimetinib alone, neratinib alone, and the combination of both drugs. Figure 6 shows that treatment with the combination was highly efficacious and suppressed tumor growth in H358 (Figure 6A) but not LU99 (Figure 6B) xenografts. By day 23, some of the H358 vehicle-treated and neratinib-treated mice reached the tumor size limits of the protocol and had to be sacrificed (Figure 6A). By day 23, H358 tumors from mice treated with vehicle, neratinib, and cobimetinib, grew on average by 387%, 262%, and 141%, respectively. In contrast, H358 tumors from mice treated with the combination regressed on average by 22% (Figure 6A). The suppression of H358 tumor growth persisted until day 37 (Figure 6A).
Figure 6.

Combination of cobimetinib and neratinib is more effective than single agent treatments in high KDS30, but not low KDS30, human lung cancer xenografts in vivo
(A and B) High KDS30 H358 tumor cells (A) and low KDS30 LU99 tumor cells (B) were subcutaneously implanted in nude mouse flanks and the mice treated by oral gavage as described in STAR Methods.
(C and D) Corresponding mouse survival data. Red: vehicle V, blue: neratinib N, purple: cobimetinib C, Green: N + C combination. Each group had 4 to 6 mice. In (A,B) data are represented as mean ± SE. ∗ (p<0.05) and ∗∗ (p<0.01) indicate significant differences in tumor volume between cobimetinib single agent- and cobimetinib and neratinib combination-treated mice. Student’s t-test was applied to determine significance. See also Figure S5.
Statistically significant (p < 0.01) differences between the tumor volumes from vehicle and combination treated mice started at day 6 and continued through day 23 at which point some of the vehicle-treated mice had to be sacrificed (Figure 6). Similarly, statistically significant (∗p<0.05; ∗∗p < 0.01) differences between the tumor volumes from cobimetinib single agent- and cobimetinib and neratinib combination-treated mice started at day 11 and continued through day 37 (Figure 6). Thus, the combination was much more effective at suppressing tumor growth than single agent treatments consistent with our in vitro studies of Figure 5. In contrast, the low KDS30 mt KRAS LU99 xenografts were much less sensitive to cobimetinib and neratinib as single agents as well in combination (Figure 6B). Furthermore, the combination was not more effective at inhibiting tumor growth than single agent treatments (no statistical differences between the various groups). These results clearly demonstrate that high KDS30 mt KRAS H358 lung tumors are much more sensitive to in vivo treatment with the cobimetinib and neratinib combination than the low KDS30 mt KRAS LU99 lung tumors, further confirming our in vitro results presented in Figure 5. Furthermore, Figure 6C shows that in the high KDS30 H358 mice, but not in low KDS30 LU99 mice, the combination treatment was much more effective than single agent treatments at prolonging mouse survival (mice were sacrificed when their tumors reached 2000 mm3 as per IACUC protocol). The median survival (MS) for H358 mice treated with the combination was 101 days, whereas the MS of mice treated with vehicle, neratinib or cobimetinib were 34, 53, and 63, respectively (Figure 6C). The difference in MS between the combination and the vehicle treatment was 67 days and was highly statistically significant with p-value of 0.0056. In contrast, the differences in MS between cobimetinib, neratinib, and the vehicle mice were not statistically significant. Furthermore, in the low KDS30 LU99 mice, there were no statistical differences in the MS curves of mice from any of the 4 treatment groups.
We also performed similar studies in pancreatic cancer xenograft models by subcutaneously implanting nude mice with high KDS30 mt KRAS Panc0203 cells and low KDS30 mt KRAS Panc1 cells and treating the mice as described above. Figure S5 shows that treatment with the combination significantly inhibited the tumor growth of Panc0203 but not Panc1 xenografts. By day 20, some of the mice from Panc0203 vehicle group reached the tumor size limits of the protocol and had to be sacrificed (Figure S5). By day 20, Panc0203 tumors from mice treated with vehicle, neratinib, and cobimetinib grew on average by 474%, 396%, and 174%, respectively. In contrast, Panc0203 tumors from mice treated with the combination grew only by 72% (Figure S5). Thus, the combination was more effective at inhibiting tumor growth than single agent treatments consistent with our in vitro studies. In contrast, the low KDS30 mt KRAS Panc1 xenografts were resistant to cobimetinib and neratinib as single agents as well in combination (Figure S5). These results clearly demonstrate that high KDS30 mt KRAS Panc0203 pancreatic tumors are much more sensitive to in vivo treatment with the cobimetinib and neratinib combination than the low KDS30 mt KRAS Panc1 pancreatic tumors, further confirming our in vitro results presented in Figure S4.
Furthermore, Figure S5 shows that in the high KDS30 Panc0203 mice, but not in low KDS30 Panc1 mice, the combination treatment was much more effective than single agent treatments at prolonging mouse median survival (MS). The MS for Panc0203 mice treated with the combination was 42.5 days whereas the MS of mice treated with vehicle, neratinib or cobimetinib were 24, 27.5, and 32.5, respectively (Figure S5). The difference in MS between the combination and the vehicle treatment was 18.5 days and was highly statistically significant with p-value of 0.0069. The difference in MS between the cobimetinib and the vehicle was much smaller (8.5 days) with a lower p-value of 0.031. In the low KDS30 Panc1 mice, there were no statistical differences in the MS of the mice from any of the 4 treatment groups.
Cobimetinib and neratinib combination is synergistic in high KDS30 mt KRAS lung cancer patient-derived tumor organoids
Although cell culture and xenograft studies are important, demonstrating that the MEK and EGFR/ERBB2/4 inhibitor combination is synergistic in mt KRAS high but not low KDS30 cancer patient derived organoids (PDOs) provides further support for the high efficacy of the combination in mt KRAS-addicted cancers. To this end, we mined the PDOs library of CrownBioscience and calculated KDS30 scores from RNAseq data. As such, we were able to identify 4 mt KRAS lung cancer PDO models: LU2512B and LU11873B with high KDS30 scores of 0.69 and 0.63, respectively, and LU11554B and LU5176B with lower KDS30 scores of 0.45 and 0.18, respectively. (We note that we were unable to identify, from Crown Bioscience library, mt KRAS pancreatic cancer PDOs with high and low KDS30 scores to perform similar validation studies in this cancer type.) These 4 models were treated in a matrix format with 10 concentrations of cobimetinib and neratinib alone or in combination for 6-7 days and the PDOs viability was determined by CellTiter-Glo as described in the STAR Methods section. The tool SynergyFinder41 was used to analyze the viability data, to calculate bliss synergy scores (Bliss) and to plot the corresponding 2D contour maps and 3D response surface plots (Figure 7). Bliss score below −5 (green) indicates antagonism whereas bliss score above 5 (red) indicates synergy between cobimetinib and neratinib combination. For most concentrations, the 2 drugs were synergistic at inhibiting the viability of the higher KDS30 LU11873B and LU2512B PDOs with an average Bliss synergy of 11.6 and 7.3, respectively (Figures 7A and 7B). In contrast, in the lower KDS30 LU11554B and LU5176B, the 2 drugs did not synergize and the Bliss scores were −5.9 and −1.1, respectively (Figures 7C and 7D). These results corroborate our cell lines and in vivo xenograft studies.
Figure 7.

Cobimetinib and neratinib combination is synergistic in high KDS30 mt KRAS lung cancer patient-derived organoids (PDOs)
High KDS30 PDOs (LU11873B KDS30 = 0.63, LU2512B KDS30 = 0.69; A, B, respectively), and low KDS30 PDOs (LU11554B KDS30 = 0.45, LU5176B KDS30 = 0.18; C, D, respectively) were treated in a matrix format with 10 concentrations of cobimetinib and neratinib alone or in combination for 6-7 days and the PDO viability was determined by CellTiter-Glo. The tool SynergyFinder was used to analyze the viability data, to calculate bliss synergy score (Bliss) and to plot the 2D contour maps (left) and corresponding 3D response surface plots (right). z-axis: Bliss calculated for the cobimetinib and neratinib combination at doses as indicated on x- and y-axis. Red: synergy, Green: no synergy.
Discussion
KRAS mutation status was previously thought to predict KRAS dependency/addiction with mt KRAS-harboring tumors considered to be KRAS-dependent, whereas those harboring WT KRAS considered as KRAS-independent.42 It is now well-established that the KRAS mutation status does not accurately predict KRAS addiction and that not all tumors that harbor mt KRAS are dependent on KRAS for survival.17,18,19,20,21,22,23,24,25,26 Here, we derived a 30-gene transcriptome signature, KDS30, that predicts mt KRAS dependency. The predictive power of the derived KDS30 signature was confirmed in 30 mt KRAS cell lines where KRAS addiction was experimentally determined by Singh et al.17 and in larger datasets such as those from projects Achilles/CERES (129 mt KRAS cell lines), DepMap/DEMETER2 (125 mt KRAS cell lines), and DRIVE/ATARiS (78 mt KRAS cell lines) where KRAS dependency scores based on either KRAS gRNA deletion (CERES scores) or KRAS shRNA depletion (DEMETER2 or ATARiS scores) statistically significantly correlated with the 30-gene transcriptome KDS30 scores. This ability to predict oncogene addiction was highly specific for mt KRAS in that KDS30 did not predict addiction to the closely related mt HRAS and mt NRAS oncogenes. Furthermore, KDS30 predicted KRAS addiction in human cancer cell lines that harbor mt, but not WT, KRAS. This mutant KRAS specificity was further demonstrated by a statistically significantly higher KDS30 scores in tumors compared to normal tissues from matched tumor/normal patient biopsies. Thus, KDS30 is a transcriptome signature that can be used to specifically predict the extent of mt KRAS addiction, a significant finding that could have major implications for biomarker-driven clinical trials requiring selection of patients whose tumors are likely to respond to mt KRAS signaling-based therapies, as discussed below.
In addition to predicting mt KRAS addiction, KDS30 also predicts significantly shorter OS in mt KRAS early stage lung and pancreatic cancer patients suggesting these high KDS30 scoring KRAS-addicted tumors harbor a deadlier disease compared to their low KDS30 counterparts. Of note, we observed no association between gender or age and KRAS-dependency (data not shown). Our analyses also show that a large proportion of mt KRAS lung (43%) and mt KRAS pancreatic (44%–69%) cancer patients in the TCGA database have tumors whose transcriptomes present with high KDS30 scores inferring poor prognosis. Thus, using the KDS30 signature, we can identify a uniform population of mt KRAS lung and pancreatic cancer patients whose tumors are mt KRAS-dependent and are likely to be more aggressive, further emphasizing the need for identifying signal transduction pathways that can be targeted to specifically thwart mt KRAS-addicted lung and pancreatic tumors (see below). Furthermore, in pancreatic cancer patients, the basal subtype tumors are known to be deadlier than the classical subtypes, and we demonstrated in this study that KDS30 is able to further stratify these subtypes into shorter and longer surviving patient sub-groups. Indeed, pancreatic cancer patients whose tumors are of the basal subtype and that have high KDS30 scores have significantly shorter median OS as compared to pancreatic cancer patients with basal tumors that have low KDS30 scores. Similar results were obtained with pancreatic cancer patients whose classical subtype tumors have high and low KDS30 scores. As such, KRAS dependency is a better phenotype in linking tumor biology and survival.
Our integrative approach revealed a novel EGFR/ERBB2-driven signaling network as a hallmark of high KDS30 mt KRAS-addicted tumors. For example, PPI STRING analysis shows that 11 out of the 30 genes of KDS30 code for proteins that interact to form a novel EGFR-driven signaling network, and ShinyGo analysis shows that 14 out of the 30 genes have biological functions related to EGFR and ERBB signaling pathways. Importantly, GSEA analysis shows that tumors from mt KRAS lung and mt KRAS pancreatic cancer patients are enriched in genes upregulated in ligand-activatable EGFR and ERBB2, and genes upregulated when mt KRAS or MEK are over-expressed. Furthermore, several genes from KDS30 encode proteins that either are EGFR ligands (e.g., AREG43 and EREG44) or EGFR substrates (e.g., CEACAM145 and EPS846). High expression of CEACAM1 has previously been linked to poor prognosis of lung and pancreatic cancer patients.47 Similarly, high expression of AREG has prognostic values in pancreatic and lung cancer patients.48,49,50
Further validation of EGFR/ERBB2-driven signaling network as a hallmark of high KDS30 mt KRAS-addicted tumors was provided by our integrative transcriptome and drug sensitivity data, demonstrating that high KDS30 mt KRAS-dependent cancer cells are significantly more sensitive to EGFR/ERBB2 and MEK inhibitors. Furthermore, we demonstrated that combinations of inhibitors of EGFR/ERBB2 (neratinib, lapatinib, dacomitinib, gefitinib, osimertinib) and MEK (cobimetinib, trametinib, and selumetinib) are significantly more effective at inducing apoptosis in mt KRAS-dependent over mt KRAS-independent human lung and pancreatic cancer cells. Importantly, in vivo, the combination of cobimetinib and neratinib significantly inhibits tumor growth and prolonged mouse survival in high, but not low, KDS30 mt KRAS human lung and mt KRAS human pancreatic xenograft mouse models. Furthermore, the combination of cobimetinib and neratinib was synergistic at inhibiting the viability of high, but not low KDS30 mt KRAS human lung cancer PDOs.
In light of these findings, KDS30 could provide a potential tool to facilitate pre-selection of mt KRAS lung and mt KRAS pancreatic cancer patients most likely to respond to EGFR/ERBB2 inhibitor and MEK inhibitor combination-based therapies. Although combinations of ERBB and MEK inhibitors have been evaluated clinically, clinical activity was observed in only a subset of patients (see below). Importantly, whether clinical activity is associated with KRAS addiction has not been investigated. For example, in a Phase I clinical trial of the EGFR/ERBB2 inhibitor dacomitinib combined with the MEK inhibitor PD-0325901 (NCT02039336), tumor regression was observed in 6 out of 8 (75%) NSCLC, 1 out of 3 (33%) pancreatic cancer and 1 out of 24 (4%) of colon cancer evaluable patients,51 suggesting that the remaining patients did not harbor the molecular make up to respond to the dacomitinib and PD-0325901 combination. Here, a patient pre-selection with a biomarker such as KDS30 could have increased the % of patients that could benefit from this combination. Furthermore, in this “all comers” clinical trial design some patients experienced dose-limiting toxicity. Here again, a biomarker-driven selection of the patients for this combination could have possibly avoided exposing the non-responders to this combination. Another example of a combination trial where only a subset of patients benefited is that of lapatinib and trametinib in mt KRAS NSCLC, pancreatic and colon cancer patients (NCT02230553), with tumor regression seen in 6 out of 24 patients.52 These EGFR/ERBB2 and MEK inhibitor combination clinical trials as well as other clinical trials using combinations of erlotinib and selumetinib as well as afatinib and selumetinib,53,54,55 coupled with our ability to identify patients whose tumors are addicted to mt KRAS (i.e., have high KDS30) and our data that high KDS30 mt KRAS lung and pancreatic cancer cells, xenografts (tumor growth and mouse survival) and PDOs are much more sensitive to these combinations, warrants validating KDS30 in clinical trial as a biomarker to select lung and pancreatic cancer patients that are more likely to respond to the combination of EGFR/ERBB2 and MEK inhibitors.
In summary, we discovered KDS30, a 30-gene transcriptome signature that predicts mt KRAS dependency, drug response and survival of mt KRAS lung and mt KRAS pancreatic cancer patients. The prognostic power of this signature has been demonstrated by predicting OS in mt KRAS lung and mt KRAS pancreatic cancer patients where a high KDS30 score strongly associated with a high-risk group of patients. Importantly, the KDS30 signature inferred a hallmark of mt KRAS addicted cancers that is dominated by an EGFR/ERBB2-centric signaling network, with mt KRAS addicted tumors and PDOs selectively sensitive to the combination of EGFR/ERBB2 and MEK inhibitors. These results warrant further validation of KDS30 with the ultimate goal of selecting lung and pancreatic cancer patients whose tumors are addicted to mt KRAS and that are more likely to respond to drugs targeting EGFR/ERBB2- and MEK-driven cellular networks.
Limitations of the study
In this study we discovered a novel 30-gene transcriptome signature “KDS30” that predicts mt KRAS oncogene addiction. Furthermore, our studies demonstrated that KDS30 predicts response to the combination treatment of inhibitors of EGFR/ERBB2 (e.g., neratinib) and MEK (e.g., cobimetinib) in cultured cells as well as mt KRAS lung and pancreatic tumor xenografts as well as mt KRAS patient-derived organoids. The limitation of this study relates to the lack of clinical studies where patients were treated with a combination of EGFR/ERBB2 and MEK inhibitor and where tumor RNAseq data is available. As such, it is currently not feasible to validate the ability of KDS30 to predict drug response in patients treated with this combination. However, we were able to show that KDS30 predicts poor survival in mt KRAS lung and pancreatic cancer patients.
STAR★Methods
Key resources table
| REAGENT or RESOURCE | SOURCE | IDENTIFIER |
|---|---|---|
| Antibodies | ||
| ERK | Cell Signaling Technology, Inc., Denver, USA | catalog no. 4695S |
| pERK | Cell Signaling Technology | catalog no. 9101S |
| EGFR | Santa Cruz Biotechnology, Inc. Santa Cruz, CA, USA | catalog no. sc-373746; RRID:AB_10920395 |
| pEGFR (Tyr-1068) | Cell Signaling Technology | catalog no. 3777S |
| pHER2/ErbB2 (Tyr-1221/1222) | Cell Signaling Technology | catalog no. 2243S |
| cleaved Caspase-3 | Cell Signaling Technology | catalog no. 9664S |
| cleaved PARP | Cell Signaling Technology | catalog no. 9541S |
| β-Actin | Sigma-Aldrich, St. Louis, MO, USA | catalog no. A5441 |
| Biological samples | ||
| human lung cancer PDO | Crown Bioscience (Beijing) | LU11873B |
| human lung cancer PDO | Crown Bioscience (Beijing) | LU2512B |
| human lung cancer PDO | Crown Bioscience (Beijing) | LU5176B |
| human lung cancer PDO | Crown Bioscience (Beijing) | LU11554B |
| Chemicals, peptides, and recombinant proteins | ||
| neratinib | Selleckchem, USA | catalog no. S2150 |
| cobimetinib | Chemie Tek, USA | catalog no. CT-G0973 |
| PEG300 | Sigma-Aldrich, USA | catalog no. 202371 |
| dacomitinib | ChemieTek, Indianapolis, IN, USA | catalog no. CT-DACO |
| lapatinib | ChemieTek, Indianapolis, IN, USA | catalog no. CT-LP001 |
| osimertinib | SelleckChem, Houston, TX, USA | catalog no. S7297 |
| gefitinib | Cayman Chemical Company, Ann Arbor, Michigan, USA | catalog no. 13166 |
| trametinib | ChemieTek, Indianapolis, IN, USA | catalog no. CT-GSK212 |
| selumetinib | SelleckChem, Houston, TX, USA | catalog no. S1008 |
| Critical commercial assays | ||
| Cell authentication | University of Arizona | Genetics Core |
| CellTiter-Glo | Promega, USA | catalog no. G7572 |
| Mycoplasma Detection Kit | InvivoGen | catalog no. rep-pt1 |
| DMEM | Gibco, ThermoFisher Scientific, USA | catalog no. 11966025 |
| RPMI 1640 | Gibco, ThermoFisher Scientific, USA | catalog no. 27016021 |
| Deposited data | ||
| CCLE mutationdata | Tsherniak et al.56 | https://depmap.org/portal/download/(release 20Q2) |
| CCLE gene expression | Tsherniak et al.56 | R/Bioconductor “depmap” and “ExperimentHub” (“EH3292”, release 20Q1) |
| project Achilles CRISPR/Cas9 CERES scores | Dempster et al.,28 Meyers et al.29 | R/Bioconductor “depmap” and “ExperimentHub” (“EH3290”, release 20Q1) |
| project DRIVE/ATARiS scores | McDonald et al.31 | https://data.mendeley.com/datasets/y3ds55n88r/5 (DRIVE_ATARiS_data.rds) |
| DepMap/DEMETER2 scores | McFarland et al.32 | R/Bioconductor “depmap” and “ExperimentHub” (“EH3080”, release 20Q1) |
| Primary PRISM screen | Tsherniak et al.56 | https://depmap.org/portal/download/(19Q4 screen) |
| Secondary PRISM screen | Tsherniak et al.56 | https://depmap.org/portal/download/(19Q4 screen) |
| Cancer Therapeutics Response Portal, CTRP v2 | Rees et al.57 | https://portals.broadinstitute.org/ctrp/ |
| Genomic Data Commons Data Portal (mt KRAS cases) | NIH GDC Data Portal | https://portal.gdc.cancer.gov |
| International Cancer Genome Consortium (mt KRAS PCAWG, PAAD-US and PACA-AU cohorts) | ICGC Data Portal | https://dcc.icgc.org/releases |
| Experimental models: Cell lines | ||
| Panc0203 | AmericanType Culture Collection | CRL-2553 |
| Panc1 | AmericanType Culture Collection | CRL-1469 |
| H358 | AmericanType Culture Collection | CRL-5807 |
| LU99 | JCRB Cell Bank, Japan | JCRB0080 |
| Experimental models: Organisms/strains | ||
| Female Athymic Nude mice | Charles River Laboratories (Wilmington, MA) | Crl:NU(NCr)-Foxn1nu |
| Software and algorithms | ||
| R v 4.0.2 | http://www.R-project.org | |
| RStudio | http://www.rstudio.com/ | |
| PAM: Prediction Analysis for Microarrays | Tibshirani et al.30 | ‘pamr’ v 1.56.1 |
| STRING database | Szklarczyk et al.35 | https://string-db.org |
| Cytoscape | Smoot et al.36 | https://cytoscape.org |
| ShinyGo | Ge et al.37 | http://bioinformatics.sdstate.edu/go/ |
| Enrichr | Kuleshov et al.38 | https://maayanlab.cloud/Enrichr/ |
| GSEA | Subramanian et al.40 | https://www.gsea-msigdb.org/gsea/index.jsp |
| SynergyFinder | Ianevski et al.41 | https://synergyfinder.org/ |
Resource availability
Lead contact
Further information and requests for resources and reagents should be directed to and will be fulfilled by the lead contact, Said Sebti (said.sebti@vcuhealth.org).
Materials availability
This study did not generate new unique reagents.
Experimental model and subject details
Cell lines, cell culture and reagents
Human pancreatic (Panc0203/female and Panc1/male) and one human lung (H358/male) cancer cell lines were purchased from AmericanType Culture Collection (ATCC). The second human lung cancer cell line (LU99/male) was purchased from JCRB Cell Bank, Japan. Cells were authenticated by the University of Arizona Genetics Core. Both Panc0203 and Panc1 cell lines are heterozygous for KRAS p.Gly12Asp mutation. Both H358 and LU99 cell lines are heterozygous for KRAS p.GlyG12Cys. Panc1 cells were cultured in DMEM (Gibco, ThermoFisher Scientific, USA) and all other cells were cultured in RPMI 1640 (Gibco, ThermoFisher Scientific, USA), supplemented with 10% heat-inactivated fetal bovine serum (R&D Systems, USA), and 1% penicillin-streptomycin (Sigma, USA). Cells were grown at 37°C with 5% CO2. All cell lines were mycoplasma free, monitored regularly with HEK-blue2 cells and Mycoplasma Detection Kit from InvivoGen (catalog no. rep-pt1).
Antitumor studies of human tumor xenografts in nude mice
Six week-old female athymic nude mice (Crl:NU(NCr)-Foxn1nu) were purchased from Charles River Laboratories (Wilmington, MA). The mice were housed, maintained, and treated in accordance with the Institutional Animal Care and Use Committee procedures and guidelines (IACUC Protocol Number AD10002149). Exponentially growing human lung cancer cell lines H358 and LU99 and pancreatic cancer cell lines Panc0203 and Panc1 were harvested via trypsinization, pelleted at 300 x g for 5 min, resuspended in sterile Dulbecco’s PBS (DPBS: Gibco) at 10 × 106 cells (H358 and Panc0203), 5 × 10⁶ (LU99), and 8 × 10⁶ (Panc1) cells per 100 μL. Separate sets of mice were injected subcutaneously into right and left flank of each mouse with either Panc0203, Panc1, H358 or LU99 cells. The tumor xenografts were monitored with an electronic caliper three times per week. Tumor volume was calculated using the following formula: , where L is length and W is width defined as the smallest and the largest measurement, respectively. When the tumors reached 150-200 mm3, animals were randomized and treatment schedules (control, neratinib, cobimetinib, neratinib + cobimetinib) were implemented. The vehicle received 30% PEG300 (Mn 300, catalog no. 202371, from Sigma-Aldrich, USA) + 0.4% Tween-80 + 27.84% 2-hydroxypropyl-β-cyclodextrin (HPCD) w/v in sterile water (catalog no. 332607, Sigma, USA); the neratinib group received 10 mg/kg/day of neratinib (catalog no. S2150, from Selleckchem, USA); cobimetinib group received 5 mg/kg/day of cobimetinib (catalog no. CT-G0973, from Chemie Tek, USA) for first 11 days and then 2.5 mg/kg/day for the rest of the experiment. Vehicle, neratinib and cobimetinib (100 μL) alone or in combination were administered by oral gavage once daily for up to 36 days.
Lung cancer patient-derived organoids (PDOs) culture and drug treatment
Four human lung cancer PDOs: LU11873B and LU2512B (high KDS30 with scores 0.63 and 0.69, respectively) and LU5176B and LU11554B (low KDS30 with scores 0.18 and 0.45, respectively) were used in this study. The study was carried out by Crown Bioscience (Beijing) Inc. as per their protocol. Briefly, organoids were collected by adding 20 μL of 100x Dispase solution in 2 mL organoid medium (Advanced DMEM/F12 (Life Technologies, Cat # 12634028), supplemented with FGF7, FGF10, Noggin, Rspondin-3 and Heregulin-beta), and incubated at 37°C with 5% CO2 for 30 min. Matrigel was added to the collected organoids to a final concentration of 5% (v/v) and the organoids suspension kept on ice. A 40 μL cell suspension was added to 384-well plate at a density of 100, 300, 250 and 700 cells/well for LU2512B, LU11554B, LU11873B, and LU5176B, respectively, and incubated the plate in a 37°C CO2 incubator. Vehicle control, neratinib and cobimetinib were added at 10 different concentrations ranging from 0-30 μM (0, 0.003, 0.01, 0.03, 0.1, 0.3, 1, 3, 10, and 30 μM) either as a single drug alone or in combination, using 3 replicate wells per concentration. Staurosporine was used as an internal positive drug control for the experiments. On day 6–7, the viability of organoids under single drug alone or in combinations were imaged with an EnVision MultiLabel Reader (PerkinElmer) and after adding CellTiter-Glo 3D reagent, luminescent signal was measured using Envision plate reader. The results were supplied to a software “SynergyFinder 2.0” (http://synergyfinder.org) and Bliss model was used to report synergy scores.
Method details
Genomic characterization of cancer cell lines
Cell line data are available at Broad’s Cancer Dependency Map (DepMap) portal (https://depmap.org/portal/download/).56 “CCLE_mutation_data.csv” (release 20Q2) was used to determine RAS mutation status of CCLE cancer cell lines. Gene expression profiles were collected using R/Bioconductor “depmap” and “ExperimentHub” with the accession number “EH3292” (release 20Q1) representing RNA-seq derived Transcript Per Million (TPM) protein coding gene expression data calculated using RSEM, followed by log2(TPM+1) transformation.58 The accession number “EH3290” (release 20Q1) was used to collect project Achilles CRISPR/Cas9 derived KRAS, HRAS and NRAS CERES “dependency” scores. The accession number “EH3080” was used to collect DepMap DEMETER2 KRAS scores (release 20Q1).32 The project DRIVE31 ATARiS KRAS scores were collected from “DRIVE_ATARiS_data.rds” dataset from https://data.mendeley.com/datasets/y3ds55n88r/5. All scores represent the scaled inferred effect on cell growth upon gene’s either knock-out (CERES scores) or shRNA-driven knock-down (both DEMETER2 and ATARiS scores), with lowest scoring cell lines being most affected and thus most dependent on the gene.
Derivation of the 30-gene KRAS dependency signature
Most and least KRAS-dependent cell lines were assumed according to the project Achilles KRAS CERES dependency scores. Gene expression profiles of both KRAS dependency groups were analyzed in R using the prediction analysis of microarrays (PAM) algorithm30 with “threshold” parameter set to 2.3. To ensure the robustness of the resulting gene list, the PAM algorithm was run 26 times removing one cell line at a time with the “threshold” parameter set to 2. Intersection of the 27 gene lists resulted in a set of 32 genes. Upon careful manual investigation, two genes (S100A6, TM4SF1) had constant high value across all 26 cell lines, leading to inflated correlations and were thus removed. This procedure yielded a set of 30 genes with specific mean gene expression levels across KRAS-dependent cell lines (listed in Table S1) that we refer to as “KRAS dependency expression signature”, or simply “KDS30”.
Calculation of the KDS30 score
The R/CRAN ‘heatmaply’ percentize() function was applied on the 30 genes in the most addicted KRAS cells, followed by mean() and percentize() (Table S1). We refer to such transformed gene expression profile as “KDS30” and use it for a sample score calculation as follows: percentize() is applied on the expression of the 30 genes and a Pearson Correlation Coefficient (PCC) between the percentized values of the 30 genes and “KDS30” giving a “KDS30 score” of the sample.
Collection of gene expression and clinical data for mt KRAS cancer patients
The ‘RNA-Seq/HTSeq – FPKM’ manifest files for mt KRAS patients were collected from Genomic Data Commons Data Portal (https://portal.gdc.cancer.gov) on 2021/08/20. Gene expression data was fetched using the ‘gdc-rnaseq-tool.py’ python script (https://github.com/cpreid2/gdc-rnaseq-tool). The trailing.x numbers from ENSG sequences were dropped and the corresponding gene Symbol IDs were retrieved using the R/Bioconductor package ‘EnsDb.Hsapiens.v75’. R ‘GenomicDataCommons’ gdc_clinical() function was used to collect the clinical information (“case_id”, “days_to_death”, “vital_status” were used from the ‘demographic’ object, and “case_id”, “submitter_id”, “days_to_last_follow_up” from the ‘diagnoses’ object). UUIDtoUUID() and UUIDtoBarcode() functions from R ‘TCGAutils’ were used to translate the UUIDs to TCGA barcodes. Patients with “Primary Solid Tumor” following the TCGA barcode format XXXX-XX-XXXX-01X were used.
Cox proportional hazards regression analysis
Univariate Cox regression model was used on each individual mt KRAS patient cohort using R ‘survival’ coxph() function as follows:
Coxph_model <- coxph(Surv(donor_days, death_event) ∼ `KDS30.scores`, data = df)
where `KDS30.scores` represent KDS30 scores of the corresponding patients. Summary(Coxph_model) was used to collect hazard ratio (HR), 95% confidence intervals (CI) and p values of the calculated HR.
Only cohorts for which a minimum of 50 mt KRAS patients were available were included in this analysis.
Survival analysis of lung and pancreatic cancer patients
KDS30 scores of mt KRAS lung and pancreatic cancer patients were supplied to surv_cutpoint() from the R package ‘survminer’ to determine the optimal KDS30 cut-off point. R/CRAN package ‘survival’ and the function ‘survfit’ was used to perform Kaplan-Meier analysis using the optimal cut-off point for grouping the patients into high (above the cut-off) and low (below the cut-off) KDS30 tumors. Log-rank test p values for determining statistical difference in OS were calculated with the function ‘survdiff’. All OS analyses were performed considering censored data for which the time of last follow-up was used.
Basal-like and classical tumor subtyping of pancreatic cancer patients
PAAD patients were clustered on the expression of Moffitt et al.34 genes (using 24 and 25 genes whose high expression is indicative of basal-like and classical tumor subtypes, respectively; note: basal-like ANXA8L2 was missing). Heatmap() function from R/Bioconductor ‘ComplexHeatmap’ package was used with “clustering_distance_columns” set to “pearson” and “clustering_method_columns” set to “ward.D”. Two major clusters emerged and all patients with majority of the 25 “classical” genes upregulated were considered as “classical” tumors. We refer to the remaining patients as having “basal-like” tumors.
Collecting normal matching samples from the TCGA database
PAAD and LUAD patients that had RNA-seq collected on both ‘Primary Solid Tumor’ and matching ‘Solid Tissue Normal’ (i.e., the “Sample” label in TCGA barcode of the patient was marked as either ‘01’ or ‘11’, respectively, or following the TCGA barcode format: XXXX-XX-XXXX-01X or XXXX-XX-XXXX-11X, respectively) were extracted giving 4 pancreatic and 11 lung patients with matching tumor/normal samples.
Additional pancreatic cancer patient data
This relates to Figure S2. In addition to the analysis of the pancreatic cancer patients from TCGA cohort collected from GDC data portal that we described in the main text and summarize in Figure 3, we also analyzed the patients’ data available through ICGC on https://dcc.icgc.org/releases. Relative to this URL, expression data were downloaded from ‘PCAWG/transcriptome/gene_expression/tophat_star_fpkm.v2_aliquot_gl.tsv.gz’ and the corresponding clinical information was downloaded from ‘PCAWG/transcriptome/metadata/rnaseq.extended.metadata.aliquot_id.V4.tsv’ (data release from Oct 10, 2019). Only samples with ‘is_tumor’ value equal to ‘yes’ and ‘project_code’ value equal to ‘PACA-AU’ were kept. Only patients with missense KRAS mutation were kept. Mutational profile information was collected from ‘PCAWG/consensus_snv_indel/final_consensus_passonly.snv_mnv_indel.icgc.public.maf.gz’ file. This procedure led to the identification of 70 mt KRAS pancreatic cancer patients that we used in the survival analysis. We refer to this cohort as PCAWG. Two more cohorts of pancreatic cancer patients were collected from the ICGC data released on March 27, 2019, and last updated on Nov 26, 2019: https://dcc.icgc.org/releases/release_28/Projects. Relative to this path, the following files were collected: ‘PAAD-US/exp_seq.PAAD-US.tsv.gz’, ‘PAAD-US/simple_somatic_mutation.open.PAAD-US.tsv.gz’ and ‘PAAD-US/donor.PAAD-US.tsv.gz’ representing data for pancreatic adenocarcinoma cancer patients deposited by US project, and which we refer to as PAAD-US. ‘normalized_read_count’ in expression data were transformed to TPM values via multiplication by factor 106. Only mt KRAS cancer patients representing samples for ‘Primary Solid Tumor’ (coded with 01 in patient’s TCGA barcode), with both expression and clinical information, were kept in the analysis. This procedure resulted in the selection of 88 mt KRAS patients that we used in the survival analysis. Similarly, the following files were collected: 'PACA-AU/exp_seq.PACA-AU.tsv.gz', 'PACA-AU/simple_somatic_mutation.open.PACA-AU.tsv.gz', and 'PACA-AU/donor.PACA-AU.tsv.gz' for pancreatic cancer patients deposited by Australian project, and which we refer to as PACA-AU. ‘normalized_read_count’ values in PACA-AU expression represent FPKM values and were used as such. Only mt KRAS cancer patients, with both expression and clinical information, were kept in the analysis. This procedure resulted in the selection of 81 mt KRAS patients that we used in the survival analysis.
Gene names provided in the gene expression data from the PCAWG and PACA-AU cohorts were transformed from the provided Ensembl IDs to Symbol IDs by dropping the trailing.x numbers from ENSG sequences, followed by the corresponding gene Symbol ID retrieval using the R/Bioconductor package ‘EnsDb.Hsapiens.v75’ with the mapping:
edb <- EnsDb.Hsapiens.v75
gn <- genes(edb, columns = c("gene_id","gene_name"))
Drug response data source
Primary and secondary PRISM Repurposing 19Q4 screen data were collected from DepMap portal (https://depmap.org/portal/download/).56 The Cancer Therapeutics Response Portal drug data57 were collected from Broad’s portal (CTRP v2, https://portals.broadinstitute.org/ctrp/).
Testing the association between KRAS dependency and drug response
Cell lines with KDS30 scores and their matching drug responses were analyzed for a potential association with KRAS dependency phenotype as follows. Briefly, mt KRAS lung and pancreatic cancer cell lines were classified into highly KRAS-dependent and highly KRAS-independent as specified in the main text. Then, Student’s t-test was applied between the two groups to identify individual drugs that selectively kill highly KRAS-dependent cells over highly KRAS-independent ones and to quantify the differences in mean FC (Primary PRISM screen) or AUC values (remaining two datasets).
Drug response data overview
The primary PRISM Repurposing screen ("primary-screen-replicate-collapsed-logfold-change.csv") contains cell viability data for 4,686 drugs. In this screen, drugs were applied with a single dose on 120 transcriptionally profiled mt KRAS human cancer cell lines. In the work presented here, the logfold-change values were transformed by applying 2score transformation and the association between high KDS30 group and drug response was determined using Student’s t-test as described above. From the secondary PRISM Repurposing screen (“secondary-screen-dose-response-curve-parameters.csv”) we used the MTS010 screen. The screen assays 147 drugs on 105 mt KRAS cancer cell lines in a dose response manner, following an 8-step 4-fold dilution. To assess which drugs selectively kill high KDS30 cell lines, AUC of the highest KDS30 cell lines were compared against AUC of the lowest KDS30 cell lines and Student’s t-test was performed as described above. Finally, the Cancer Therapeutics Response Portal (CTRP v2) AUC data were collected from https://portals.broadinstitute.org/ctrp/ and analyzed in a similar fashion, where mt KRAS lung and mt KRAS pancreatic cancer cell lines were classified into high or low KDS30 cells and Student’s t-test was applied to identify drugs that selectively kill high KDS30 cell lines over low KDS30 cell lines. Data was analyzed in R, using custom scripts.
Effects on signaling pathways and apoptosis by western blotting methods
Human pancreatic (Panc0203 and Panc1) and human lung (H358 and LU99) cancer Cells were plated at 0.3 x 10⁶ cells per well in 6-well plates and treated the next day with EGFR inhibitors (neratinib, dacomitinib, lapatinib, osimertinib, and gefitinib) and MEK inhibitors (trametinib, selumetinib, and cobimetinib) as single agent or in combination for 48 h (all different combinations and drugs concentrations used in this study are provided in the table below). The control groups were treated with vehicle (0.1% DMSO). After treatment, cells were washed twice with ice-cold DPBS (Gibco, Thermofisher, USA), lysed in M-PER Mammalian Protein Extraction Reagent (Thermo Scientific, IL, USA) directly on the plate, and processed for SDS-PAGE and western blot analysis. The following antibodies were purchased from Cell Signaling Technology, Inc., Denver, USA: ERK (catalog no. 4695S), p-ERK (catalog no. 9101S), p-EGFR(Tyr-1068) (catalog no. 3777S), p-HER2/ErbB2 (Tyr 1221/1222) (catalog no. 2243S), cleaved Caspase-3 (catalog no. 9664S), cleaved PARP (catalog no. 9541S). EGFR (catalog no. sc-373746), was purchased from Santa Cruz Biotechnology, Inc. Santa Cruz, CA, USA. β-Actin (catalog no. A5441) was purchased from Sigma-Aldrich, St. Louis, MO, USA. EGFR and MEK inhibitors were purchased from the following commercial sources: neratinib, selumetinib, and osimetinib were from SelleckChem, Houston, TX, USA; lapatinib, trametinib, dacometinib, and cobimetinib were from ChemieTek, Indianapolis, IN, USA; gefitinib from Cayman Chemical Company, Ann Arbor, Michigan, USA. The used concentrations of different drugs are listed in Table 1.
Quantification and statistical analysis
All of the computational analyses and the corresponding statistical analyses can be found in method details under related sections, corresponding figure legends, and results. R statistical software was used to conduct the computational analyses. Inkscape was used to present the results. Antitumor efficacy studies were performed using three to six mice per group, and the data are presented as mean ± SE. Student’s t-test was applied to determine differences between the groups. Microsoft Excel was used for this analysis and graphs.
Acknowledgments
This work was funded in part by NIH grant R35 CA197731 (Said Sebti, PhD). We would like to thank the Mouse Models Core Shared Resource for technical assistance and the Bioinformatics Shared Resource for editorial reading of the revised manuscript. Both facilities are supported by funding from VCU Massey, an NCI-designated cancer center, through Cancer Center Support Grant P30 CA016059.
Author contributions
S.M.S. designed experiments and supervised the work. S.M.S. and K.M.T. conceptualized and designed the studies. K.M.T acquired the data from databases, conducted the computational analyses and prepared the corresponding figures. A.R., R.W., and A.K. performed experiments, analyzed the experimental data, and prepared the corresponding figures. S.M.S. and K.M.T. interpreted the data and wrote the manuscript. All authors reviewed the manuscript.
Declaration of interests
A provisional patent application related to this work has been filed for SMS and KMT.
Published: January 31, 2023
Footnotes
Supplemental information can be found online at https://doi.org/10.1016/j.isci.2023.106082.
Supplemental information
The genes are sorted by their relative gene expression, from the most to least expressed gene. The column highlighted in yellow shows the relative expression of the 30 genes that define KDS30 signature. This table also provides a list of 129 mt KRAS CCLE used in the analysis for which KRAS CERES scores could be retrieved. The tab ‘Singh 2009’ lists CCLE deemed as either KRAS-dependent or KRAS-independent. The tab ‘Moffitt 2015’ is a list of genes from Moffitt et al. 2015 study that were used to define basal- and classical tumor subtypes of pancreatic cancer TCGA data, as presented in Figure 3
Data and code availability
Data
-
•
All data analyzed in this study are publicly available. Instructions on how to access each dataset are specified in the key resources table.
Code
-
•
This paper does not report original code.
-
•
Any additional information required to reanalyze the data reported in this paper is available from the lead contact upon request.
References
- 1.Simanshu D.K., Nissley D.V., McCormick F. RAS proteins and their regulators in human disease. Cell. 2017;170:17–33. doi: 10.1016/j.cell.2017.06.009. [DOI] [PMC free article] [PubMed] [Google Scholar]
- 2.Bos J.L., Rehmann H., Wittinghofer A. GEFs and GAPs: critical elements in the control of small G proteins. Cell. 2007;129:865–877. doi: 10.1016/j.cell.2007.05.018. [DOI] [PubMed] [Google Scholar]
- 3.Barbacid M. Ras genes. Annu. Rev. Biochem. 1987;56:779–827. doi: 10.1146/annurev.bi.56.070187.004023. [DOI] [PubMed] [Google Scholar]
- 4.Hanahan D., Weinberg R.A. Hallmarks of cancer: the next generation. Cell. 2011;144:646–674. doi: 10.1016/j.cell.2011.02.013. [DOI] [PubMed] [Google Scholar]
- 5.Cox A.D., Fesik S.W., Kimmelman A.C., Luo J., Der C.J. Drugging the undruggable RAS: mission possible? Nat. Rev. Drug Discov. 2014;13:828–851. doi: 10.1038/nrd4389. [DOI] [PMC free article] [PubMed] [Google Scholar]
- 6.Li S., Balmain A., Counter C.M. A model for RAS mutation patterns in cancers: finding the sweet spot. Nat. Rev. Cancer. 2018;18:767–777. doi: 10.1038/s41568-018-0076-6. [DOI] [PubMed] [Google Scholar]
- 7.Chetty R., Govender D. Gene of the month: KRAS. J. Clin. Pathol. 2013;66:548–550. doi: 10.1136/jclinpath-2013-201663. [DOI] [PubMed] [Google Scholar]
- 8.Jones R.P., Sutton P.A., Evans J.P., Clifford R., McAvoy A., Lewis J., Rousseau A., Mountford R., McWhirter D., Malik H.Z. Specific mutations in KRAS codon 12 are associated with worse overall survival in patients with advanced and recurrent colorectal cancer. Br. J. Cancer. 2017;116:923–929. doi: 10.1038/bjc.2017.37. [DOI] [PMC free article] [PubMed] [Google Scholar]
- 9.Lièvre A., Bachet J.-B., Le Corre D., Boige V., Landi B., Emile J.-F., Côté J.F., Tomasic G., Penna C., Ducreux M., et al. KRAS mutation status is predictive of response to cetuximab therapy in colorectal cancer. Cancer Res. 2006;66:3992–3995. doi: 10.1158/0008-5472.CAN-06-0191. [DOI] [PubMed] [Google Scholar]
- 10.Pao W., Wang T.Y., Riely G.J., Miller V.A., Pan Q., Ladanyi M., Zakowski M.F., Heelan R.T., Kris M.G., Varmus H.E. KRAS mutations and primary resistance of lung adenocarcinomas to gefitinib or erlotinib. PLoS Med. 2005;2:e17. doi: 10.1371/journal.pmed.0020017. [DOI] [PMC free article] [PubMed] [Google Scholar]
- 11.Slebos R.J., Kibbelaar R.E., Dalesio O., Kooistra A., Stam J., Meijer C.J., Wagenaar S.S., Vanderschueren R.G., van Zandwijk N., Mooi W.J. K-ras oncogene activation as a prognostic marker in adenocarcinoma of the lung. N. Engl. J. Med. 1990;323:561–565. doi: 10.1056/NEJM199008303230902. [DOI] [PubMed] [Google Scholar]
- 12.FDA Grants Accelerated Approval to Sotorasib for KRAS G12C Mutated NSCLC. (2021). https://www.fda.gov/drugs/resources-information-approved-drugs/fda-grants-accelerated-approval-sotorasib-kras-g12c-mutated-nsclc
- 13.Hong D.S., Fakih M.G., Strickler J.H., Desai J., Durm G.A., Shapiro G.I., Falchook G.S., Price T.J., Sacher A., Denlinger C.S., et al. KRASG12C inhibition with sotorasib in advanced Solid tumors. N. Engl. J. Med. 2020;383:1207–1217. doi: 10.1056/NEJMoa1917239. [DOI] [PMC free article] [PubMed] [Google Scholar]
- 14.Press Release: Mirati Therapeutics’ Adagrasib Receives Breakthrough Therapy Designation from U.S. Food and Drug Administration for Patients with Advanced Non-Small Cell Lung Cancer Harboring the KRASG12C Mutation. (Online source). (2021). https://ir.mirati.com/press-releases/press-release-details/2021/Mirati-Therapeutics-Adagrasib-Receives-Breakthrough-Therapy-Designation-from-U.S.-Food-and-Drug-Administration-for-Patients-with-Advanced-Non-Small-Cell-Lung-Cancer-Harboring-the-KRAS-G12C-Mutation/default.aspx
- 15.Skoulidis F., Li B.T., Dy G.K., Price T.J., Falchook G.S., Wolf J., Italiano A., Schuler M., Borghaei H., Barlesi F., et al. Sotorasib for lung cancers with KRAS p.G12C mutation. N. Engl. J. Med. 2021;384:2371–2381. doi: 10.1056/NEJMoa2103695. [DOI] [PMC free article] [PubMed] [Google Scholar]
- 16.Moore A.R., Rosenberg S.C., McCormick F., Malek S. RAS-targeted therapies: is the undruggable drugged? Nat. Rev. Drug Discov. 2020;19:533–552. doi: 10.1038/s41573-020-0068-6. [DOI] [PMC free article] [PubMed] [Google Scholar]
- 17.Singh A., Greninger P., Rhodes D., Koopman L., Violette S., Bardeesy N., Settleman J. A gene expression signature associated with “K-Ras addiction” reveals regulators of EMT and tumor cell survival. Cancer Cell. 2009;15:489–500. doi: 10.1016/j.ccr.2009.03.022. [DOI] [PMC free article] [PubMed] [Google Scholar]
- 18.Luo J., Emanuele M.J., Li D., Creighton C.J., Schlabach M.R., Westbrook T.F., Wong K.-K., Elledge S.J. A genome-wide RNAi screen identifies multiple synthetic lethal interactions with the Ras oncogene. Cell. 2009;137:835–848. doi: 10.1016/j.cell.2009.05.006. [DOI] [PMC free article] [PubMed] [Google Scholar]
- 19.Scholl C., Fröhling S., Dunn I.F., Schinzel A.C., Barbie D.A., Kim S.Y., Silver S.J., Tamayo P., Wadlow R.C., Ramaswamy S., et al. Synthetic lethal interaction between oncogenic KRAS dependency and STK33 suppression in human cancer cells. Cell. 2009;137:821–834. doi: 10.1016/j.cell.2009.03.017. [DOI] [PubMed] [Google Scholar]
- 20.Singh A., Sweeney M.F., Yu M., Burger A., Greninger P., Benes C., Haber D.A., Settleman J. TAK1 inhibition promotes apoptosis in KRAS-dependent colon cancers. Cell. 2012;148:639–650. doi: 10.1016/j.cell.2011.12.033. [DOI] [PMC free article] [PubMed] [Google Scholar]
- 21.Muzumdar M.D., Chen P.-Y., Dorans K.J., Chung K.M., Bhutkar A., Hong E., Noll E.M., Sprick M.R., Trumpp A., Jacks T. Survival of pancreatic cancer cells lacking KRAS function. Nat. Commun. 2017;8:1090. doi: 10.1038/s41467-017-00942-5. [DOI] [PMC free article] [PubMed] [Google Scholar]
- 22.Aguirre A.J., Hahn W.C. Synthetic lethal vulnerabilities in KRAS-mutant cancers. Cold Spring Harb. Perspect. Med. 2018;8:a031518. doi: 10.1101/cshperspect.a031518. [DOI] [PMC free article] [PubMed] [Google Scholar]
- 23.Kazi A., Xiang S., Yang H., Delitto D., Trevino J., Jiang R.H.Y., Ayaz M., Lawrence H.R., Kennedy P., Sebti S.M. GSK3 suppression upregulates β-catenin and c-Myc to abrogate KRas-dependent tumors. Nat. Commun. 2018;9:5154. doi: 10.1038/s41467-018-07644-6. [DOI] [PMC free article] [PubMed] [Google Scholar]
- 24.Kazi A., Xiang S., Yang H., Chen L., Kennedy P., Ayaz M., Fletcher S., Cummings C., Lawrence H.R., Beato F., et al. Dual farnesyl and geranylgeranyl transferase inhibitor thwarts mutant KRAS-driven patient-derived pancreatic tumors. Clin. Cancer Res. 2019;25:5984–5996. doi: 10.1158/1078-0432.CCR-18-3399. [DOI] [PMC free article] [PubMed] [Google Scholar]
- 25.Kazi A., Chen L., Xiang S., Vangipurapu R., Yang H., Beato F., Fang B., Williams T.M., Husain K., Underwood P., et al. Global phosphoproteomics reveal CDK suppression as a vulnerability to KRas addiction in pancreatic cancer. Clin. Cancer Res. 2021;27:4012–4024. doi: 10.1158/1078-0432.CCR-20-4781. [DOI] [PMC free article] [PubMed] [Google Scholar]
- 26.Mottini C., Cardone L. Beyond the genomic mutation: rethinking the molecular biomarkers of K-RAS dependency in pancreatic cancers. Int. J. Mol. Sci. 2020;21:E5023. doi: 10.3390/ijms21145023. [DOI] [PMC free article] [PubMed] [Google Scholar]
- 27.Santana-Codina N., Roeth A.A., Zhang Y., Yang A., Mashadova O., Asara J.M., Wang X., Bronson R.T., Lyssiotis C.A., Ying H., Kimmelman A.C. Oncogenic KRAS supports pancreatic cancer through regulation of nucleotide synthesis. Nat. Commun. 2018;9:4945. doi: 10.1038/s41467-018-07472-8. [DOI] [PMC free article] [PubMed] [Google Scholar]
- 28.Dempster J.M., Rossen J., Kazachkova M., Pan J., Kugener G., Root D.E., Tsherniak A. Cancer Biology; 2019. Extracting Biological Insights from the Project Achilles Genome-Scale CRISPR Screens in Cancer Cell Lines. [DOI] [Google Scholar]
- 29.Meyers R.M., Bryan J.G., McFarland J.M., Weir B.A., Sizemore A.E., Xu H., Dharia N.V., Montgomery P.G., Cowley G.S., Pantel S., et al. Computational correction of copy number effect improves specificity of CRISPR-Cas9 essentiality screens in cancer cells. Nat. Genet. 2017;49:1779–1784. doi: 10.1038/ng.3984. [DOI] [PMC free article] [PubMed] [Google Scholar]
- 30.Tibshirani R., Hastie T., Narasimhan B., Chu G. Diagnosis of multiple cancer types by shrunken centroids of gene expression. Proc. Natl. Acad. Sci. USA. 2002;99:6567–6572. doi: 10.1073/pnas.082099299. [DOI] [PMC free article] [PubMed] [Google Scholar]
- 31.McDonald E.R., de Weck A., Schlabach M.R., Billy E., Mavrakis K.J., Hoffman G.R., Belur D., Castelletti D., Frias E., Gampa K., et al. Project drive: acompendium of cancer dependencies and synthetic lethal relationships uncovered by large-scale, deep RNAi screening. Cell. 2017;170:577–592.e10. doi: 10.1016/j.cell.2017.07.005. [DOI] [PubMed] [Google Scholar]
- 32.McFarland J.M., Ho Z.V., Kugener G., Dempster J.M., Montgomery P.G., Bryan J.G., Krill-Burger J.M., Green T.M., Vazquez F., Boehm J.S., et al. Improved estimation of cancer dependencies from large-scale RNAi screens using model-based normalization and data integration. Nat. Commun. 2018;9:4610. doi: 10.1038/s41467-018-06916-5. [DOI] [PMC free article] [PubMed] [Google Scholar]
- 33.Combescure C., Perneger T.V., Weber D.C., Daurès J.P., Foucher Y. Prognostic ROC curves: a method for representing the overall discriminative capacity of binary markers with right-censored time-to-event endpoints. Epidemiology. 2014;25:103–109. doi: 10.1097/EDE.0000000000000004. [DOI] [PubMed] [Google Scholar]
- 34.Moffitt R.A., Marayati R., Flate E.L., Volmar K.E., Loeza S.G.H., Hoadley K.A., Rashid N.U., Williams L.A., Eaton S.C., Chung A.H., et al. Virtual microdissection identifies distinct tumor- and stroma-specific subtypes of pancreatic ductal adenocarcinoma. Nat. Genet. 2015;47:1168–1178. doi: 10.1038/ng.3398. [DOI] [PMC free article] [PubMed] [Google Scholar]
- 35.Szklarczyk D., Gable A.L., Lyon D., Junge A., Wyder S., Huerta-Cepas J., Simonovic M., Doncheva N.T., Morris J.H., Bork P., et al. STRING v11: protein-protein association networks with increased coverage, supporting functional discovery in genome-wide experimental datasets. Nucleic Acids Res. 2019;47:D607–D613. doi: 10.1093/nar/gky1131. [DOI] [PMC free article] [PubMed] [Google Scholar]
- 36.Smoot M.E., Ono K., Ruscheinski J., Wang P.-L., Ideker T. Cytoscape 2.8: new features for data integration and network visualization. Bioinformatics. 2011;27:431–432. doi: 10.1093/bioinformatics/btq675. [DOI] [PMC free article] [PubMed] [Google Scholar]
- 37.Ge S.X., Jung D., Yao R. ShinyGO: a graphical gene-set enrichment tool for animals and plants. Bioinformatics. 2020;36:2628–2629. doi: 10.1093/bioinformatics/btz931. [DOI] [PMC free article] [PubMed] [Google Scholar]
- 38.Kuleshov M.V., Jones M.R., Rouillard A.D., Fernandez N.F., Duan Q., Wang Z., Koplev S., Jenkins S.L., Jagodnik K.M., Lachmann A., et al. Enrichr: a comprehensive gene set enrichment analysis web server 2016 update. Nucleic Acids Res. 2016;44:W90–W97. doi: 10.1093/nar/gkw377. [DOI] [PMC free article] [PubMed] [Google Scholar]
- 39.Liberzon A., Birger C., Thorvaldsdóttir H., Ghandi M., Mesirov J.P., Tamayo P. The Molecular Signatures Database (MSigDB) hallmark gene set collection. Cell Syst. 2015;1:417–425. doi: 10.1016/j.cels.2015.12.004. [DOI] [PMC free article] [PubMed] [Google Scholar]
- 40.Subramanian A., Tamayo P., Mootha V.K., Mukherjee S., Ebert B.L., Gillette M.A., Paulovich A., Pomeroy S.L., Golub T.R., Lander E.S., Mesirov J.P. Gene set enrichment analysis: a knowledge-based approach for interpreting genome-wide expression profiles. Proc. Natl. Acad. Sci. USA. 2005;102:15545–15550. doi: 10.1073/pnas.0506580102. [DOI] [PMC free article] [PubMed] [Google Scholar]
- 41.Ianevski A., He L., Aittokallio T., Tang J. SynergyFinder: a web application for analyzing drug combination dose-response matrix data. Bioinformatics. 2017;33:2413–2415. doi: 10.1093/bioinformatics/btx162. [DOI] [PMC free article] [PubMed] [Google Scholar]
- 42.Aoki K., Yoshida T., Matsumoto N., Ide H., Sugimura T., Terada M. Suppression of Ki-ras p21 levels leading to growth inhibition of pancreatic cancer cell lines with Ki-ras mutation but not those without Ki-ras mutation. Mol. Carcinog. 1997;20:251–258. [PubMed] [Google Scholar]
- 43.Santamaría E., Rodríguez-Ortigosa C.M., Uriarte I., Latasa M.U., Urtasun R., Alvarez-Sola G., Bárcena-Varela M., Colyn L., Arcelus S., Jiménez M., et al. The epidermal growth factor receptor ligand amphiregulin protects from cholestatic liver injury and regulates bile acids synthesis. Hepatology. 2019;69:1632–1647. doi: 10.1002/hep.30348. [DOI] [PubMed] [Google Scholar]
- 44.Iijima M., Anai M., Kodama T., Shibasaki Y. Epiregulin-blocking antibody inhibits epiregulin-dependent EGFR signaling. Biochem. Biophys. Res. Commun. 2017;489:83–88. doi: 10.1016/j.bbrc.2017.03.006. [DOI] [PubMed] [Google Scholar]
- 45.Abou-Rjaily G.A., Lee S.J., May D., Al-Share Q.Y., Deangelis A.M., Ruch R.J., Neumaier M., Kalthoff H., Lin S.-H., Najjar S.M. CEACAM1 modulates epidermal growth factor receptor--mediated cell proliferation. J. Clin. Invest. 2004;114:944–952. doi: 10.1172/JCI21786. [DOI] [PMC free article] [PubMed] [Google Scholar]
- 46.Fazioli F., Minichiello L., Matoska V., Castagnino P., Miki T., Wong W.T., Di Fiore P.P. Eps8, a substrate for the epidermal growth factor receptor kinase, enhances EGF-dependent mitogenic signals. EMBO J. 1993;12:3799–3808. doi: 10.1002/j.1460-2075.1993.tb06058.x. [DOI] [PMC free article] [PubMed] [Google Scholar]
- 47.Dankner M., Gray-Owen S.D., Huang Y.-H., Blumberg R.S., Beauchemin N. CEACAM1 as a multi-purpose target for cancer immunotherapy. OncoImmunology. 2017;6:e1328336. doi: 10.1080/2162402X.2017.1328336. [DOI] [PMC free article] [PubMed] [Google Scholar]
- 48.Wang L., Wu H., Wang L., Lu J., Duan H., Liu X., Liang Z. Expression of amphiregulin predicts poor outcome in patients with pancreatic ductal adenocarcinoma. Diagn. Pathol. 2016;11:60. doi: 10.1186/s13000-016-0512-4. [DOI] [PMC free article] [PubMed] [Google Scholar]
- 49.Yokoyama M., Ebert M., Funatomi H., Friess H., Buchler M., Johnson G., Korc M. Amphiregulin is a potent mitogen in human pancreatic-cancer cells - correlation with patient survival. Int. J. Oncol. 1995;6:625–631. doi: 10.3892/ijo.6.3.625. [DOI] [PubMed] [Google Scholar]
- 50.Fontanini G., De Laurentiis M., Vignati S., Chinè S., Lucchi M., Silvestri V., Mussi A., De Placido S., Tortora G., Bianco A.R., et al. Evaluation of epidermal growth factor-related growth factors and receptors and of neoangiogenesis in completely resected stage I-IIIA non-small-cell lung cancer: amphiregulin and microvessel count are independent prognostic indicators of survival. Clin. Cancer Res. 1998;4:241–249. [PubMed] [Google Scholar]
- 51.van Geel R.M.J.M., van Brummelen E.M.J., Eskens F.A.L.M., Huijberts S.C.F.A., de Vos F.Y.F.L., Lolkema M.P.J.K., Devriese L.A., Opdam F.L., Marchetti S., Steeghs N., et al. Phase 1 study of the pan-HER inhibitor dacomitinib plus the MEK1/2 inhibitor PD-0325901 in patients with KRAS-mutation-positive colorectal, non-small-cell lung and pancreatic cancer. Br. J. Cancer. 2020;122:1166–1174. doi: 10.1038/s41416-020-0776-z. [DOI] [PMC free article] [PubMed] [Google Scholar]
- 52.Huijberts S.C.F.A., van Geel R.M.J.M., van Brummelen E.M.J., Opdam F.L., Marchetti S., Steeghs N., Pulleman S., Thijssen B., Rosing H., Monkhorst K., et al. Phase I study of lapatinib plus trametinib in patients with KRAS-mutant colorectal, non-small cell lung, and pancreatic cancer. Cancer Chemother. Pharmacol. 2020;85:917–930. doi: 10.1007/s00280-020-04066-4. [DOI] [PubMed] [Google Scholar]
- 53.Ko A.H., Bekaii-Saab T., Van Ziffle J., Mirzoeva O.M., Joseph N.M., Talasaz A., Kuhn P., Tempero M.A., Collisson E.A., Kelley R.K., et al. A multicenter, open-label Phase II clinical trial of combined MEK plus EGFR inhibition for chemotherapy-refractory advanced pancreatic adenocarcinoma. Clin. Cancer Res. 2016;22:61–68. doi: 10.1158/1078-0432.CCR-15-0979. [DOI] [PMC free article] [PubMed] [Google Scholar]
- 54.Carter C.A., Rajan A., Keen C., Szabo E., Khozin S., Thomas A., Brzezniak C., Guha U., Doyle L.A., Steinberg S.M., et al. Selumetinib with and without erlotinib in KRAS mutant and KRAS wild-type advanced nonsmall-cell lung cancer. Ann. Oncol. 2016;27:693–699. doi: 10.1093/annonc/mdw008. [DOI] [PMC free article] [PubMed] [Google Scholar]
- 55.van Brummelen E.M.J., Huijberts S., van Herpen C., Desar I., Opdam F., van Geel R., Marchetti S., Steeghs N., Monkhorst K., Thijssen B., et al. Phase I study of afatinib and selumetinib in patients with KRAS-mutated colorectal, non-small cell lung, and pancreatic cancer. Oncol. 2021;26 doi: 10.1002/onco.13631. 290-e545. [DOI] [PMC free article] [PubMed] [Google Scholar]
- 56.Tsherniak A., Vazquez F., Montgomery P.G., Weir B.A., Kryukov G., Cowley G.S., Gill S., Harrington W.F., Pantel S., Krill-Burger J.M., et al. Defining a cancer dependency map. Cell. 2017;170:564–576.e16. doi: 10.1016/j.cell.2017.06.010. [DOI] [PMC free article] [PubMed] [Google Scholar]
- 57.Rees M.G., Seashore-Ludlow B., Cheah J.H., Adams D.J., Price E.V., Gill S., Javaid S., Coletti M.E., Jones V.L., Bodycombe N.E., et al. Correlating chemical sensitivity and basal gene expression reveals mechanism of action. Nat. Chem. Biol. 2016;12:109–116. doi: 10.1038/nchembio.1986. [DOI] [PMC free article] [PubMed] [Google Scholar]
- 58.Ghandi M., Huang F.W., Jané-Valbuena J., Kryukov G.V., Lo C.C., McDonald E.R., Barretina J., Gelfand E.T., Bielski C.M., Li H., et al. Next-generation characterization of the cancer cell line Encyclopedia. Nature. 2019;569:503–508. doi: 10.1038/s41586-019-1186-3. [DOI] [PMC free article] [PubMed] [Google Scholar]
Associated Data
This section collects any data citations, data availability statements, or supplementary materials included in this article.
Supplementary Materials
The genes are sorted by their relative gene expression, from the most to least expressed gene. The column highlighted in yellow shows the relative expression of the 30 genes that define KDS30 signature. This table also provides a list of 129 mt KRAS CCLE used in the analysis for which KRAS CERES scores could be retrieved. The tab ‘Singh 2009’ lists CCLE deemed as either KRAS-dependent or KRAS-independent. The tab ‘Moffitt 2015’ is a list of genes from Moffitt et al. 2015 study that were used to define basal- and classical tumor subtypes of pancreatic cancer TCGA data, as presented in Figure 3
Data Availability Statement
Data
-
•
All data analyzed in this study are publicly available. Instructions on how to access each dataset are specified in the key resources table.
Code
-
•
This paper does not report original code.
-
•
Any additional information required to reanalyze the data reported in this paper is available from the lead contact upon request.