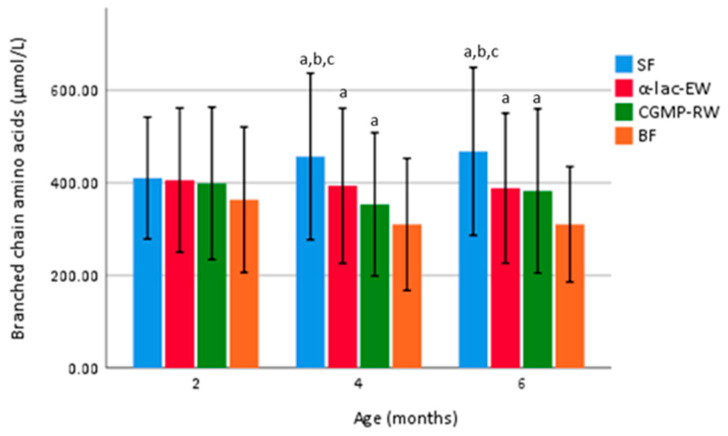
Figure 4.
Mean (± SD) total BCCA (isoleucine, leucine, valine) plasma concentration in the randomized subgroup (n = 50 in each group) at four and six months of age. Groups compared by one-way ANOVA, post hoc Bonferroni. p value < 0.05 are considered statistically significant and marked by superscript letters. a Significantly different vs. BF. b SF vs. α-lac-EW. c SF vs. CGMP-RW. SF, standard formula; α-lac-EW, experimental formula with α-lactalbumin enriched whey; CGMP-RW, experimental formula with reduced CGMP whey; BF, breast-fed.

