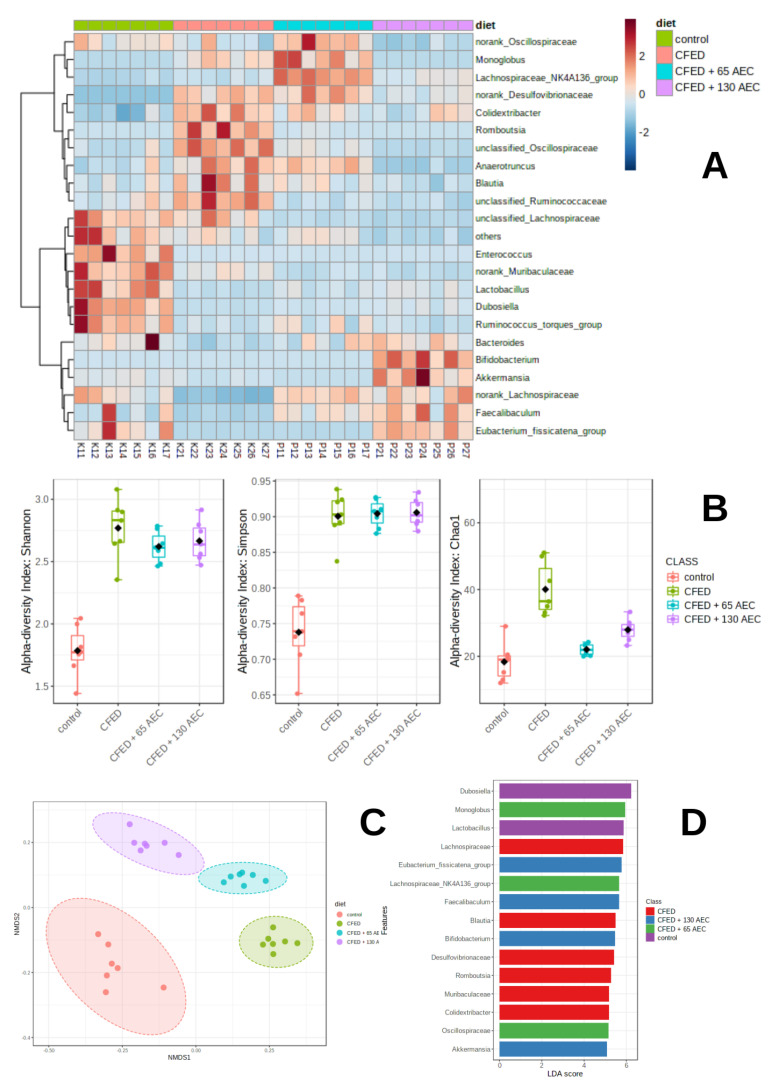
Figure 4.
Clustering and community profiling of gut microbiota in mice induced with CFED. Heatmap clustering of individual gut microbiota (bottom) according to diet groups (top) based on Euclidean distance (A) Boxplot of distribution of alpha diversity values (Shannon, Simpson, and Chao1) among diet groups (B) Non-metric multidimensional scaling (NMDS) plot of all samples using the Bray-Curtis resemblance matrix (C) Linear discriminant analysis (LDA) effect size (LEfSe) analyses of gut microbiota according to diet at the genus level; each colored bar indicates a genus that was significantly enriched in each consecutive group (D) CFED: cholesterol- and fat-enriched diet.

