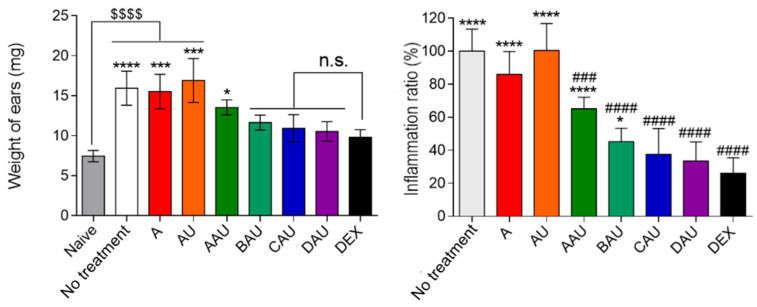
Figure 4.
Anti-inflammatory activity of the colloidal systems with ursolic acid. The vehicle is the A formulation, and the control is an ointment containing dexamethasone 0.5% (w/w). Left graph shows weight of ears and right graph shows the inflammatory index (%) obtained. The data represent the mean ± S.D. of 5 mice. The statistical significances of ear thickness and inflammatory index were analyzed using variance analysis following Tukey’s multiple comparison test; * p < 0.05, *** p < 0.001, **** p ≤ 0.0001, and n.s. p > 0.05 compared to dexamethasone group; $$$$ is p ≤ 0.0001 compared to naïve group; ### p < 0.001 and #### p ≤ 0.0001 compared to no treatment group. A = formulation with OA%/S%/W% ratio of 40/50/10; B = formulation with OA%/S%/W% ratio of 30/50/20; C = formulation with OA%/S%/W% ratio of 20/50/30; D = formulation with OA%/S%/W% ratio of 10/50/40; AAU = formulation A loaded with AU; BAU = formulation B loaded with AU; CAU = formulation C loaded with AU; DAU = formulation D loaded with AU; DEX = dexamethasone.

