

Summary:
Preclinical models of neurodevelopmental disorders typically use single inbred mouse strains, which fail to capture the genetic diversity and symptom heterogeneity that is common clinically. We tested if modeling genetic background diversity in mouse genetic reference panels would recapitulate population and individual differences in responses to a syndromic mutation in the high-confidence autism risk gene, CHD8. We measured clinically relevant phenotypes in >1,000 mice from 33 strains, including brain and body weights and cognition, activity, anxiety, and social behaviors using 5 behavioral assays: cued fear conditioning, open field tests in dark and bright light, direct social interaction, and social dominance. Trait disruptions mimicked those seen clinically, with robust strain and sex differences. Some strains exhibited large effect size trait disruptions, sometimes in opposite directions, and remarkably others expressed resilience. Therefore, systematically introducing genetic diversity into models of neurodevelopmental disorders provides a better framework for discovering individual differences in symptom etiologies.
Graphical Abstract

Introduction:
Individuals exhibit striking clinical heterogeneity in the presence and severity of neurodevelopmental disorder (NDD) symptoms and co-occurring behaviors, even with the same highly penetrant gene mutations.1,2 The predominant use of single isogenic strains in preclinical in vivo models of NDDs has prevailed for decades, even though genetic background has long been hypothesized to underlie individual differences in clinical heterogeneity.3–6 Inbred strains offer advantages compared to outbred strains, including genetic reproducibility and the availability of whole genome sequences and gene expression data. However, studying a single inbred strain cannot inform of the impact of genetic background on trait disruptions caused by single-gene mutations. This ‘n of 1’ genome strategy can be improved by using genetic approaches that capture the biobehavioral and genetic heterogeneity observed in patient populations.7–13
Two main strategies have been used to demonstrate the influence of genetic background on disrupted phenotypes caused by single-gene mutations: the use of 1) different, unrelated inbred strains and 2) panels of genetically diverse recombinant inbred strains.14,15 The latter strategy has been used to model human genetic diversity and has led to the discovery of mechanisms underlying individual differences in risk for numerous diseases.16–23 The contribution of genetic background to the etiology and pathophysiology of NDDs is far less understood. This presents significant barriers to developing robust translational models that are needed to discover new treatments. Multi-strain studies that incorporate broad and reproducible variation in genetic background can reveal the degree to which genetic background mediates behavioral outcomes due to single-gene disruptions and identify genetic and environmental modifiers. This strategy can facilitate the discovery of etiological mechanisms underlying symptom differences and leverage specific backgrounds for improving preclinical discovery of mechanism-based treatments.
Using a mouse genetic reference panel (GRP) approach, we demonstrated strain heterogeneity and heritability of fear learning and affiliative social behavior in wild-type (WT) mice.24,25 The results showed that the most popular mouse strains used in preclinical studies, for example C57BL/6J (B6), may not be optimal for investigating the behavioral phenotypes caused by NDD-related gene deletions. Here, we report the results of a systematic analysis of the penetrance of trait disruptions caused by a loss-of-function mutation in a high-confidence autism spectrum disorder (ASD) risk-gene (CHD8) from two GRPs, the Collaborative Cross (CC) and BXD collections, which are derived from fully-sequenced founder strains.26–28 We introduced a clinically relevant haploinsufficiency of chromodomain helicase DNA-binding protein 8 (Chd8) into F1 offspring from each GRP strain, followed by comprehensive phenotyping. CHD8 encodes a protein that regulates chromatin remodeling and gene expression and plays a critical role in brain development.29 In clinical populations, functional mutations in CHD8 are associated with macrocephaly, ASD, intellectual disability, and anxiety, with variable penetrance and severity of all traits.30–34 We hypothesized that Chd8 haploinsufficiency (Chd8+/−) would impact relevant traits across the combined strain population (Chd8+/− population effects) but that the severity would differ across genetic backgrounds (Chd8+/− strain effects). Comparison of Chd8+/− population and strain effects provides an estimate of the penetrance of trait disruptions caused by Chd8+/−, including the direction and magnitude of the difference in traits across the population and in individual strains that are susceptible or resilient.
We report that systematic assessments in over 1,000 mice revealed sexually dimorphic population-based and individual strain differences in the penetrance of Chd8+/− on 14 traits. This preclinical resource provides improved translational potential for understanding population and individual differences in symptom etiologies and discovering genetic and molecular mechanisms underlying susceptibility and resilience.
Results:
Penetrance of trait disruptions caused by Chd8 haploinsufficiency in a genetically diverse population depends on the trait
B6 females that were heterozygous for loss-of-function mutations in Chd8 (i.e., C57BL/6J-Chd8+/−) were mated with sires from 27 CC, 5 BXD, and B6 strains to produce F1 WT and Chd8+/− male (n = 521) and female (n = 520) littermates across 33 strains (Fig. 1).35 Maternal genotype was held constant, and sires were removed before litter birth to control for strain differences in parental care. Subjects were characterized for weanling (P21), adolescent (P35), young adult (~P125), and terminal (~P220) body weights, brain weights as a proxy for macrocephaly, social sniffing and aggression towards a same-sex B6 juvenile in the direct social interaction (DSI) task, dominance over opposite Chd8 genotype cagemates and strangers in the social dominance (SD) task, locomotor activity in a dark open field chamber (DOF) for 30minutes, anxiety-like behavior in the center of a bright open field chamber for 30-minutes (BOF), and fear learning, memory, and extinction in an auditory cued fear conditioning task.
Figure 1. Modeling population and individual differences in phenotypic responses to Chd8 haploinsufficiency.
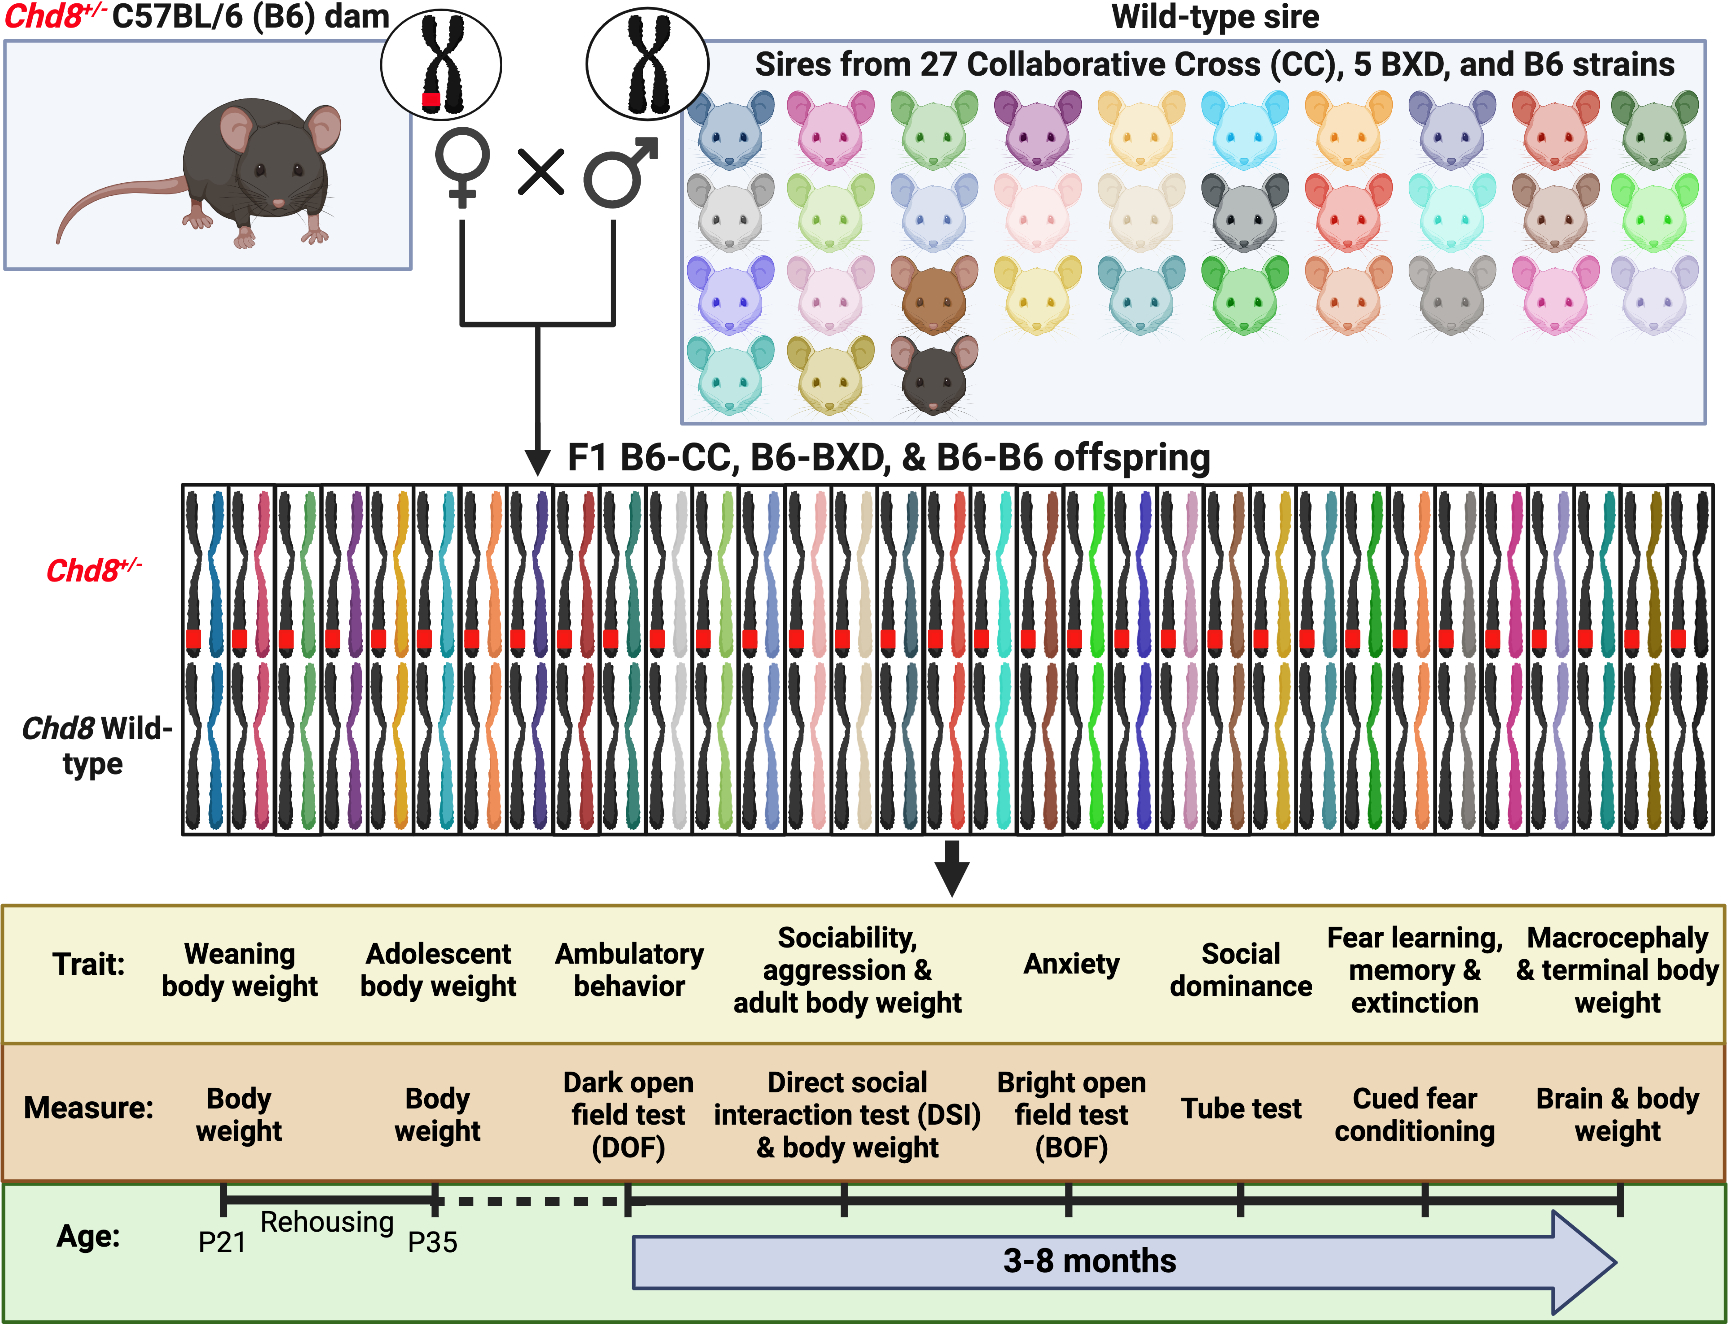
Chd8 heterozygous (Chd8+/−) C57BL/6 (B6) dams were mated with wild-type (WT) sires from 27 Collaborative Cross (CC), 5 BXD, and B6 strains to produce F1 B6-CC, B6-BXD, and B6-B6 male and female and WT and Chd8+/− offspring. Subjects were weaned and genotyped at postnatal day (P) 21 and rehoused before P35 to 2 WT and 2 Chd8+/− same -sex and -strain mice per cage, with littermates preferentially housed together. Behavioral testing began at a mean age of ~P115 and was conducted in the order shown on the timeline. Thirty-three strains (8 subjects per Chd8 genotype and sex) were included for all measures except the social dominance test, which included 21 strains (6 subjects per Chd8 genotype and sex). Figure adapted from Sittig et al., 2016.8
Chd8+/− population and Chd8+/− strain effects were analyzed with parametric (ANOVA) and non-parametric (Mann Whitney-U test) significance tests in addition to effect size estimates (Tables S1–S2). Cohen’s D effect sizes (d) quantified the magnitude (large, ≥|0.8|; medium, ≥|0.5|; small, ≥|0.2|; negligible, ≥|0.0|) and direction (positive d = increase in Chd8+/− compared to WT; negative d = decrease in Chd8+/−) of trait differences between Chd8+/− and WT subjects in the combined genetically diverse strain population and within the same recombinant inbred strain and sex. Cohen’s D effect sizes also quantified the magnitude and direction of significant sex differences (positive d = increase in males compared to females).
Chd8+/− population effects revealed the largest impact on SD (increased, d = 2.57 against cagemates; d = 2.08 against strangers), macrocephaly (increased, d = 0.7), and locomotor activity in the DOF test (decreased, d = −0.7), with large to medium effect sizes (Fig. 2A–D). Chd8+/− impacted other traits with small to negligible population effect sizes, including body weights (decreased at weaning d = −0.4, adolescence d = −0.3, young adulthood d = −0.3, and terminal d = −0.3 timepoints; Fig. 2E–H), social sniffing (increased, d = 0.4) and aggression (increased, d = 0.1; Fig. 2I–J), and anxiety-like behavior (increased, d = −0.3; Fig. 2K). Fear learning variables, including acquisition, expression, and extinction were not significantly different between the Chd8+/− and WT populations and generated negligible effect sizes (d = ± 0.1; Fig. 2L–N).
Figure 2. Population-based penetrance of phenotypic differences caused by Chd8 haploinsufficiency differs across traits.

Trait distributions for Chd8 genotype groups in the combined strain and sex population. Mann-Whitney U tests revealed significant median population shifts (*p < 0.05) between wild-type (WT: blue) and Chd8+/− (HET; orange) populations in social dominance over opposite Chd8 genotype cagemates (A; U=4399, p < 0.001) and strangers (B; U= 5694, p < 0.001), brain weight (C; U= 82,140, p < 0.001), distance traveled in the dark open field (DOF) test (D; U= 191,343, p < 0.001), body weight at weaning (E; U= 169,334, p < 0.001), adolescence (F; U= 156,371, p < 0.001), adulthood (G; U= 153,917, p < 0.001), and study termination (H; U= 152,971, p < 0.001), duration of partner sniffing (I; U= 105,271, p < 0.001) and aggression (J; U= 124514, p < 0.05) in the direct social interaction (DSI) task, and anxiety-like behavior in the bright open field (BOF) task (increased anxiety is reflected by decreased % center distance, K; U= 158549, p <0.001). Gray shading reflects overlapping WT and HET populations. Percent time freezing during fear acquisition (L; U= 130,309, p = 0.18), expression (M; U = 126,341, p= 0.11), and extinction (N; U= 138,703, p = 0.35) were not significantly different. Heritability estimates (H2) are calculated for the WT population and are based on inter- and intra- strain variance for each trait. Total n = 498 for panels A-B and ~1,041 for panels C-N. See also Table S1.
Genetic background modifies the effect of Chd8 haploinsufficiency on decreased body weight and macrocephaly
In Chd8+/− males and females, body weight trajectories were significantly decreased compared to WT (Fig. 3A). There was variation in the impact of Chd8+/− on body weight trajectories across individual strains, including strains for which both males and females were not significantly impacted, such as B6-CC7, and strains for which both sexes were significantly impacted, such as B6-CC28 (Fig. 3B–C).
Figure 3. Genetic background modifies the effect of Chd8 haploinsufficiency on decreased body weight and macrocephaly.

Body weights increased over time (A; Repeated measures ANOVA weight: F3, 2,649 = 3,6181.0, p < 0.001) and in males more than females (weight by sex: F3, 2,649 = 1,506.0, p < 0.001). Chd8+/− males and females had smaller body weight trajectories than WT (weight by genotype effect: F3, 2,649 = 42.7, p < 0.001; A). Strain significantly modified the impact of Chd8 genotype on body weight trajectories (weight by genotype by strain: F96, 2,649 = 2.0, p < 0.001). B6-CC7, B6-CC28, and B6-CC10 body weight trajectories highlight representative strains that were differentially impacted by Chd8+/− (B-D). Chd8+/− males and females had lower body weights compared to WT at weaning (E; males F1, 516 = 31.3, p < 0.001, females F1, 519 = 24.9, p < 0.001), adolescence (H; males F1, 518 = 25.6, p < 0.001, females F1, 519 = 17.9, p < 0.001), adulthood (K; males F1, 520 = 19.1, p < 0.001, females F1, 518 = 13.4, p < 0.001), and at the end of life (“terminal”; N; males F1, 513 = 26.3, p < 0.001, females F1, 506 = 21.4, p < 0.001). The impact of Chd8+/− on body weights at each time point and brain weights depended on strain and sex (F-G, I-J, L-M, O-P, R-S). Chd8+/− brains weighed more than WT brains in males (F1, 518 = 101.9, p < 0.001) and females (F1, 511 = 34.0, p < 0.001; Q) and the impact was greater in males (Chd8 genotype by sex interaction: F1, 1,031 = 4.1, p < 0.05; T). Note that graphs in Q-T do not start at 0. Females brains weighed more than males (F1, 1,031 = 42.0, p < 0.001; Q). Trait means +/− SEM are plotted for all line and bar graphs. * = p < 0.05 ANOVA; + = p < 0.05 Mann-Whitney U test. Violin plots show individual data points per defined group. The label for B6 (B6-B6) is highlighted in red. See also Figure S1.
In the combined population, Chd8+/− males and females weighed less than WT males and females at weaning, adolescence, adulthood, and study termination (Fig 3E, H, K, N). Across individual strains, Chd8+/− differentially impacted body weights at all time points in males and females (Fig. 3F–G, I–J, L–M, O–P). Chd8+/− mice had significantly decreased body weights in 12–30% of strain and sex groups depending on the specific developmental time point. There were also sex differences in the impact of Chd8+/− on decreased body weight across strains. For example, B6-B6 Chd8+/− males and females had significantly decreased body weights at weaning, but only females continued to have significantly decreased body weights throughout life. Interestingly, adolescent B6-CC10 Chd8+/− males were the only group with significantly increased body weights compared to WT. Adolescent and adult B6-CC10 Chd8+/− females had decreased body weights compared to WT (Fig. 3D).
Chd8+/− males and females had increased brain weights compared to WT with a greater effect in males (d = 0.89) than females (d = 0.51, Fig. 3Q, T). Chd8+/− brains were significantly larger than WT brains in 67% of strains in males and 42% of strains in females (Fig. 3R–S). Chd8+/− brains were not significantly different from WT in B6-CC2, B6-CC22, B6-CC8, B6-B6, B6-CC60, B6-CC25, and B6-CC44 males and females. In some strains a larger sample size may have borne out significance (e.g., B6-B6 males p = 0.54), while in others (e.g., B6-CC25 males) there was resilience. Notably, B6-CC12, Chd8+/− females were impacted more than males.
The impact of Chd8 haploinsufficiency on social behaviors depends on genetic background and sex
In the 6-minute DSI task, Chd8+/− males (d = 0.41) and females (d = 0.36) spent more time sniffing a same-sex B6 juvenile compared to WT (Fig. 4A). However, at the individual strain level, the effect reached significance in only B6-CC6 males and B6-CC27 and B6-CC23 females (Fig. 4B–C). Aggression during DSI was not a robust phenotype at the population or strain levels, with a few exceptions; B6-BXD8 and B6-BXD42 Chd8+/− males and B6-CC7 Chd8+/− females had increased aggression, while B6-CC1 Chd8+/− males had decreased aggression compared to WT (Fig. 4D–F).
Figure 4: The impact of Chd8 haploinsufficiency on social behaviors depends on genetic background and sex.

Chd8+/− males (F1, 517 = 22.2, p < 0.001) and females (F1, 516 = 21.6, p < 0.001) spent more time sniffing a same-sex B6 juvenile during the DSI task compared to WT (A). Males had higher sniffing durations than females (A; F1, 1,035 = 172.2, p < 0.001). Chd8+/− males exhibited increased aggression compared to WT males (D; F1, 517 = 7.3, p < 0.05). Chd8+/− males also had increased aggression in the DSI test compared to Chd8+/− females (F1, 1,035 = 5.8, p < 0.001). The impact of Chd8+/− on sniffing and aggression depended on strain in males (B, E) and females (C, F). In the SD task, Chd8+/− males (F1, 248 = 420.4, p < 0.001) and females (F1, 248 = 926.2, p < 0.001) won more matches against WT same -sex and –strain cagemates (G) as well as strangers from different cages (K; males F1, 248 = 289.4, p < 0.001, females F1, 248 = 491.0, p < 0.05). The effect was greater in females than in males (H, L). Context also mattered as Chd8+/− females won more matches against familiar cagemates (G) compared to strangers (K; F1,497 = 11.0, p < 0.001). In males, a context by strain by Chd8 genotype 3-way interaction (F1, 497 = 491.0, p < 0.001) indicated that B6-CC12 WT males were significantly dominant over Chd8+/− cagemates while there was no difference in dominance between strangers (I, M). Violin plots show individual data points. Trait means +/− SEM are plotted in B, C, E, F, H-J, and L-N. * = p < 0.05 ANOVA; + = p < 0.05 Mann-Whitney U test. For DSI males and females, strains are presented in rank order of WT sniffing durations, and the same order is maintained for aggression (E, F). For SD, strains are presented in rank order of low-to-high % wins of WT females against cagemates; this order is maintained in I, M, and N. The label for B6 is highlighted in red.
The SD task measured dominance over strain-, age-, and sex- matched cagemates and strangers with opposite Chd8 genotypes. SD is measured by analyzing the percentage of “wins” for each subject, which is defined as the last mouse to leave a narrow tube upon facing another mouse in the center of the tube over multiple trials with different partners. Twelve strains did not generate sufficient age-matched WT-Chd8+/− pairs for SD matches across cages and therefore were not tested. Chd8+/− males and females won more matches against WT cagemates (Fig. 4G) and strangers (Fig. 4K). The effect was greater in females (d = 2.5–3.4) than in males (d = 1.7–2.0; Fig. 4H, L). The impact in males and females was larger between cagemates (d = 2.0 versus 3.4) than strangers (d = 1.7 versus 2.5; Fig. 4G, K). In 67% of strains, Chd8+/− males and females won significantly more matches than WT cagemates (Fig. 4I–J). In 62% of strains, Chd8+/− males and females were dominant over WT strangers (Fig. 4M–N). There were sex differences in the impact of Chd8+/− on SD between cagemates and strangers in 38% of strains, including in B6-B6 (Fig. 4I–J, M–N). Remarkably, B6-CC12 WT males were dominant over Chd8+/− cagemates while there were no differences between strangers (Fig. 4I, M).
DSI sniffing and aggression durations were positively correlated in the male population (r = 0.32, p < 0.001). Sniffing duration was also positively correlated with SD wins against cagemates and strangers in males (cagemates r = 0.23, p < 0.001; strangers r = 0.21, p < 0.001) and females (cagemates r = 0.23, p < 0.001; strangers r = 0.20, p < 0.001). SD wins between cagemates and strangers were positively correlated in males (r = 0.76, p < 0.001) and females (r = 0.80, p < 0.001).
Strain and sex modify the impact of Chd8 haploinsufficiency on decreased activity behavior, increased anxiety-like behavior, and bidirectional fear conditioning responses
Chd8+/− decreased the distance traveled in both males (d= −0.74) and females (d = −0.76) compared to WT (Fig. 5A). Across individual strains and sexes, the DOF task revealed a range of activity levels and impacts of Chd8+/− on decreased activity levels (Fig. 5B–C). Chd8+/− mice had decreased DOF activity levels in 52% of strains in males and 61% of strains in females. There were 8 strains for which activity levels in both males and females were not significantly impacted by Chd8+/−: B6-CC22, B6-CC23, B6-CC24, B6-CC7, B6-CC27, B6-BXD21, B6-CC40, and B6-CC16. Some strains displayed sex differences, such as B6-CC8, for which activity levels in males were not impacted but females were, and B6-CC1 in which males were impacted but not females. B6-B6 females (d = −1.63) were more severely impacted than B6-B6 males (d = −0.90).
Figure 5. Genetic background modifies the impact of Chd8 haploinsufficiency on decreased activity, increased anxiety-like behavior, and bidirectional fear conditioning responses.

In the DOF test, Chd8+/− males (F1, 519 = 125.2, p < 0.001) and females (F1, 516 = 119.4, p < 0.001) traveled less distance in the DOF compared to WT (A). WT females had increased activity in the DOF test compared to WT males (F1, 1,037 = 4.3, p < 0.001; A). Out of the total distance traveled in the BOF test, Chd8+/− males (F1, 520 = 16.2, p < 0.001) and females (F1, 516 = 14.0, p < 0.001) traveled less in the center of the BOF (% center distance) compared to WT (D). Females had increased anxiety-like behavior in the BOF test compared to males, indicated by decreased % center distance traveled (D; F1, 1,038 = 17.0, p < 0.001). There were no effects of Chd8+/− on fear conditioning in males and females in the combined population, including fear acquisition, expression, and extinction (K, N, Q). Females froze more than males during fear acquisition (d = −0.4) and expression (d = −0.1) and froze less during extinction (d = 0.2), indicating more robust cued fear conditioning and extinction (K, N, Q). The impact of Chd8+/− on DOF ambulatory behavior, BOF anxiety-like behavior, and fear learning and memory depended on the strain and sex (B-C, E-F, L-M, O-P, R-S). Fear conditioning trajectories across the combined population versus representative strains are highlighted in B6-CC24, B6-CC10, and B6-CC28 (H-J). See also Figure S2. Violin plots show individual data points. Trait means +/− SEM groups are plotted in B-C, E-J, L-M, O-P, and R-S. * = p < 0.05 ANOVA; + = p < 0.05 Mann-Whitney U test. The label for B6 is highlighted in red.
Chd8+/− mice displayed increased anxiety-like behaviors as indicated by decreased BOF percent center distances compared to WT in males (d = −0.32) and females (d = −0.29, Fig. 5D). Strain impacted the effect of Chd8+/− on anxiety-like behavior (Fig. 5E–F). Chd8+/− males in 18% and Chd8+/− females in 9% of strains had significantly increased anxiety-like behavior compared to WT. There were sex differences in 7 strains, and in 5 of these strains, males had increased anxiety-like behavior while females did not. Remarkably, B6-B6 females (d = 1.10) were the only strain and sex group to display decreased anxiety-like behavior due to Chd8+/−, while males were not significantly impacted. B6-CC57 was the only strain where both Chd8+/− males and females had increased anxiety-like behavior.
Distance traveled in the DOF test positively correlated with BOF percent center distance in males (r = 0.136, p < 0.05) and females (r = 0.243, p < 0.001). More strain and sex groups had decreased DOF activity due to Chd8+/− than decreased BOF percent center distance. B6-CC28, B6-CC57, and B6-CC60 males and B6-CC17 females had significantly decreased DOF activity and increased anxiety-like behavior. B6-B6 females were the only group where Chd8+/− decreased activity and anxiety-like behavior. Effect sizes for DOF activity did not correlate with effect sizes for BOF percent center distance (see Fig. 8C).
Figure 8. Genetic background regulates the covariance of traits impacted by Chd8 haploinsufficiency across a population.

Exploratory factor analysis (EFA) on Chd8+/− strain effect sizes resulted in five factor scores (FS; A). Loadings ≥ 0.4 are bolded and color-coded with the corresponding trait. Hierarchical cluster analysis (HCA) on Chd8+/−strain effects produced congruent results to EFA reflected by the dendrogram (B). Significant (p < 0.05) Spearman’s correlation coefficients for Chd8+/− strain effects across traits are bolded (C). Heatmaps of Chd8+/− strain effects summed across 12 traits (total effect size) and across individual traits and principal components (PC 1–5) with strains and sexes ordered by their similarities as determined by HCA (represented by dendrogram; D). Cohen’s d effect size means (+/− SEM) for each cluster varies across traits (E). Line colors represent different clusters. Line thickness and numbers in the legend reflect the number of strain and sex groups per cluster. See also Table S3. BW: body weight; DOF: Dark Open Field; BOF: Bright Open Field; DSI: Direct Social Interaction
During fear conditioning, on the training day, freezing during the fifth tone-shock presentation (CS5) was significantly greater than to the first tone presentation (CS1), indicating that the population associated the tone with a shock (RM ANOVA F1, 1,027 = 5,459.0, p < 0.001). Fear acquisition, expression, and extinction scores significantly differed (RM ANOVA: F2, 1,027 = 1,810.18, p < 0.001). Subjects had higher freezing responses during fear expression compared to acquisition. Subjects also froze less at the end of fear extinction compared to expression, indicating that mice extinguished fear at the population level (Fig. 5G). In males and females, there were no differences in fear acquisition, expression, and extinction between the WT and Chd8+/− populations (Fig. 5K, N, Q). However, across individual strains, results indicate substantial heterogeneity in both fear learning and memory profiles and the impact of Chd8+/− on fear learning and memory (Fig. 5L–M, O–P, R–S). For example, B6-CC10 Chd8+/− males had increased fear acquisition, while B6-CC28 Chd8+/− males had decreased fear acquisition compared to their WT counterparts (Fig. 5L). B6-CC8 Chd8+/− males were the only sex and strain group with decreased fear expression compared to WT (Fig. 5O). Similarly, Chd8+/− mice in some strain and sex groups had decreased fear extinction (e.g., B6-CC43 males) while others had increases (e.g., B6-CC42 males; Fig. 5R). These data reflect bidirectional manifestations of Chd8+/− on fear learning across strains. Moreover, there were sex differences within strains. For example, even though B6-CC28 Chd8+/− males and females had decreased fear acquisition compared to WT, there were bidirectional effects of Chd8+/− on extinction between sexes (Fig. 5J).
In males, fear acquisition positively correlated with expression (r = 0.152, p< 0.001) and extinction (r = 0.142, p< 0.001) while fear expression correlated with extinction (r = 0.273, p< 0.001). In females, fear expression correlated with fear extinction (r = 0.098, p< 0.05).
Chd8 haploinsufficiency impacts variation amongst traits
A Principal Components Analysis (PCA) reduced traits into principal components (PCs) to capture the shared population variance. The PCA did not include SD scores because not all strains were tested. The 5 extracted PCs revealed expected relationships between trait variation in the population, including body weights (PC1), social behaviors (PC4), and fear learning (PC5; Fig. 6A). Moreover, percent freezing during fear expression positively varied with BOF anxiety-like behavior, while both were inversely related to DOF ambulatory behavior in PC2. PC3 revealed that BOF anxiety-like behavior positively covaried with weanling body weights and terminal brain weights.
Figure 6. Trait relations and the impact of Chd8 haploinsufficiency on trait principal components and SD.

Principal Component Analysis (PCA) extracted 5 principal components (PCs) that captured 68% of the trait variance (A). Bold numbers indicate coefficients greater than 0.4, reflecting traits that highly covary within a PC. Traits are color-coded by similarity to each other along with their respective high loading coefficients. F statistics are reported for each PC from 3-way ANOVA (* p < 0.05; A). Note that BOF percent center time is shown, and a higher percent time in the center indicates lower anxiety (A). Data points in the line graphs B-H represent the mean PC score (B-F), or percent SD wins (G-H). PC scores are the net value of the traits weighted by the PC loading coefficient. The slope and direction of the lines connecting the WT and Chd8+/− indicate the magnitude and direction of the effect. Thirty-three strains were included in the PCA (A-F), and 21 strains were tested for SD (G, H; 3-way Chd8 genotype by strain by sex interaction, stranger opponent: F1, 498 = 4.4, P < 0.001; cagemate opponent: F1, 498 = 6.5, P < 0.001). Lines in G-H connect WT and Chd8+/− (HET) males and females per strain, and colors represent different strains (See Table S2 for PC and SD SEM).
Decreased PC1 scores in the Chd8+/− population indicated reduced body weights compared to WT, with the effect stronger in males than females (Fig. 6A–B). Reduced PC2 scores in the Chd8+/− population revealed reduced activity and increased fear expression and anxiety-like behavior (Fig. 6A, C). Differences in activity might contribute to differences in measures of anxiety and fear expression for some strains. Moreover, PC3 scores indicated increased brain weights and anxiety-like behavior in Chd8+/− mice compared to WTs, which covaried only with body weights at weaning but not at other times. The effect was stronger in males than females (Fig. 6A, D). Increased PC4 scores in Chd8+/− males, but not females, reflected increased DSI aggression and sniffing compared to WT (Fig. 6A, E). Moreover, the impact of Chd8+/− on PC4 scores depended on the strain. There was no Chd8+/− population effect on PC5 scores. Instead, a significant Chd8 genotype by strain interaction revealed that strain modified the impact of Chd8+/− on PC5 scores, including the direction, in Chd8+/− mice compared to WTs (Fig. 6A, F). There was striking variation amongst strains in differences between WT and Chd8+/− for all PCs but PCs 3–5 were particularly heterogeneous. Thus, the PCA revealed the traits that covary across the population and the PCs uniquely impacted by Chd8+/−. Similarly, while Chd8+/− males and females across strains won more SD matches than WTs (Fig. 6G–H), there was variation between strains and sexes, including in the occurrence, magnitude, and direction of differences.
Strain and sex modify penetrance of Chd8 haploinsufficiency across every trait
As a correlate to assessing traits that are most severely impacted across a clinical population, we examined the effect size distribution for individual strains for each trait. Remarkably, every trait, including those with large to negligible population effect sizes, exhibited a large range of Chd8+/− strain effects, including large and negligible strain effect sizes (Fig. 7A).
Fig 7. Severity of Chd8 haploinsufficiency trait disruption varies broadly for every trait and is modified by strain and sex.

The population distributions of Chd8+/− strain effect sizes vary across traits (A; N = 66 strain and sex groups d per trait). Cohen’s D effect size distributions for Chd8+/− strain effects across 12 traits revealed marked heterogeneity in the combination of impacted traits within strains and sexes (B). Colors represent traits. Red lines highlight large effect sizes (i.e., |d| = 0.8). The summed absolute value of the effect sizes across 12 traits for males (blue) and females (red) varies between strains and sexes (C). Strains are ordered in ascending trait means for males (B-C). The number of traits on which strains and sexes are impacted with large effect sizes also varies (D). Strains in panel D are graphed in the same order as panel C. BW: body weight. See also Table S2.
There was marked heterogeneity on the impact of Chd8+/− across traits with the specific strain and sex that had the lowest and highest effect sizes differing across all traits (Fig. 7B). The combination of specific traits that were impacted consistently differed between strains and sexes, underscoring the complexity of trait alteration, and highlighting how genetic modifiers might interact with Chd8+/− to influence clinical heterogeneity.
To better understand differences in how strains and sexes were impacted across many traits, absolute values of Cohen’s D effect sizes for every trait, except SD, were summed into a total effect size score per strain and sex (Fig. 7C). Total effect sizes ranged from a minimum of 5 in B6-CC22 females to a maximum of 14 in B6-BXD32 males and B6-CC45 females. There were sex differences in total effect size for many strains.
Next, to identify how many traits had a large effect size across strain and sex groups, the number of traits with a large Cohen’s D (i.e., |d| > 0.74) was summed across 12 traits (Fig. 7D). It was most common for males and females in approximately 27% of strains to have large effect sizes across 5 and 4 traits (33–42% of traits measured), respectively, although the traits and strains that were impacted differed between sexes. The least impacted strains had large effect sizes across 3 traits in males (6% of strains) and 2 traits in females (9% of strains). The most impacted strains had large effect sizes across 8 traits in males (18% of strains) and 7 traits in females (12% of strains). B6-CC22 males and females had some of the smallest effect sizes, with a large effect size across only 2 traits in females and 3 traits in males. B6-CC45 males and females had large effect sizes across 8 traits in males and 7 in females, but the combination of traits differed. Taken together, Chd8+/− has complex effects on the pattern and severity of trait disruptions across strains and sexes.
Chd8 haploinsufficiency caused co-occurring trait disruptions across the population and amongst strains and sexes
To identify if there were patterns in the combination of traits impacted by Chd8+/− in the population, an exploratory factor analysis (EFA) of Chd8+/− strain effect sizes (d) across 12 traits in males and females was performed. In addition, hierarchical clustering analysis (HCA) was performed, and Spearman’s correlation coefficients were extracted. The 5 extracted factor scores (FS) and HCA revealed associations on the impact of Chd8+/− between related traits, including body weight trajectories (Fig 8A–C; FS1). In addition, the impact of Chd8+/− on DSI aggression and sniffing coincided with fear acquisition and expression (FS2). Weanling body weight effect sizes covaried both negatively (FS3) and positively (FS4) with BOF effect sizes, indicating two distinct relationships between the impact of Chd8+/− on weanling body weights and anxiety-like behavior in the population. Fear expression effect sizes were correlated with acquisition and extinction but loaded independently on FS5, indicating that the impact of Chd8+/− on fear expression is independent of the impact of Chd8+/− on other traits, including other phases of fear conditioning; this may reflect a differential impact of activity and anxiety on different phases of fear conditioning for specific strains. Chd8+/− strain effect sizes for brain weight and DOF distance did not significantly correlate nor covary with other trait effect sizes, reflecting the high penetrance of Chd8+/− on macrocephaly and activity across strain and sex regardless of the impact of Chd8+/− on other traits. To classify strains and sexes by similarities in effect sizes across traits, an HCA was performed on Chd8+/− strain effects in males and females. Next, heatmaps of Chd8+/− strain effects across traits and PCs were constructed to visualize the impact of Chd8+/− across traits within and between cluster groups. The dendrogram identified 6 main clusters, each differing in size, sex composition, and average effect sizes (Fig. 8D). Within clusters, strains and sexes shared effect sizes for some traits, while there was heterogeneity amongst other traits.
Cluster 5 was the largest (36% of strains and sexes, 54% male) and most resilient cluster, with the smallest cluster effect size mean. Cluster 5 was characterized most notably by large effect sizes for macrocephaly and decreased DOF distance in Chd8+/− compared to WT mice (Fig. 8E). Chd8+/− mice in Cluster 5 also had decreased weanling and adult body weights, fear acquisition and extinction, and increased anxiety-like behavior with medium effect sizes on average.
Cluster 3, the second largest cluster (24% of strains and sexes, 69% male), differed from Cluster 5 by being particularly susceptible (i.e., having very large effect sizes) to macrocephaly and decreased body weights after weaning in Chd8+/− mice compared to WT.
Cluster 1 was the third largest cluster (18% of strains and sexes, 2% males) and amongst the most susceptible for decreased DOF ambulatory behavior in Chd8+/− mice. Clusters 1 and 3 had negligible effect sizes for fear learning variables.
Cluster 2 consisted of 12% of strains and sexes (50% male) and was amongst the Clusters most impacted for increased DSI sniffing and the least impacted for decreased DOF ambulatory behavior in Chd8+/− mice. In addition, on average, Cluster 2 had negligible effect sizes for BOF anxiety-like behavior and medium effect sizes for increased fear acquisition and expression in Chd8+/− mice.
Cluster 4 comprised 8% of strains and sexes (40% male) with the largest cluster effect size average and included strains and sexes severely impacted on body weights and ambulatory behavior but unimpacted on BOF anxiety-like behavior on average.
Remarkably, Cluster 6 consisted only of B6-CC10 males and exhibited the largest cluster effect size for macrocephaly. B6-CC10 males were the only strain and sex group with increased body weights in Chd8+/− compared to WT males with large effect sizes. B6-CC10 Chd8+/− males also had increased BOF anxiety-like behavior, DSI aggression, and fear acquisition compared to WT males with large effect sizes. Taken together, the HCA revealed strain and sexes with unique combinations of trait disruptions, with variable effect sizes and directions across Clusters.
Discussion:
An in-depth understanding of human disease requires greater insight into the ways in which genetic background impacts symptom presence and severity. This is particularly relevant for highly heritable but genetically heterogenous disorders like ASD, for which recent studies highlight the role of both common and rare genetic variants, and their interaction, in disorder risk and symptom severity.1,2,36–39 Analyses of CHD8 patient-derived iPSC-derived neurons revealed an important role of donor-genetic background in modulating the impact of CHD8 haploinsufficiency on the development of inhibitory and excitatory neurons.40 This is relevant for understanding individual differences in cortical excitation and correlations with clinical symptom severity.40,41 Complementing such results, the present in vivo data demonstrate that a systematic introduction of genetic diversity into a B6/inbred mouse model of Chd8+/− can uncover a range of trait disruptions in a genetically diverse population, leading to the identification of susceptible and resilient individual strains and groups of strains.
Systematic strain diversity provides a platform for NDD investigations
Identifying susceptible and resilient genetic backgrounds is an essential first step to determining the underlying molecular and neural circuit mechanisms of heterogeneity. The selection of the CC GRP, derived from 8 founder strains,27,42–44 captures 90% of the common genetic variation present in the 3 major Mus musculus subspecies (>40M SNPs), and provides a powerful model of genetic diversity on a variant level that is similar to humans.45–47 We also included 5 BXD strains based on their high levels of sociability in an panel of 47 BXD strains25 to increase the likelihood of observing heterogeneity in social behavior in the F1 population. While it remains to be determined if specific genetic elements that modify a mutation’s impact vary across species, the systematic application of GRPs can be used to: 1) identify highly penetrant symptom profiles due to rare NDD-relevant genetic mutations, 2) determine the most relevant strains for experimental manipulations to examine the neural circuit and molecular basis of functional disruptions and resilience, 3) screen putative interventions to improve function in susceptible genetic backgrounds, and 4) determine if the specific genetic elements that modify a mutation’s impact vary across species by screening in GRPs from different species.
An important strategy for GRP characterization studies is to broadly sample the impact of genetic background by maximizing strain number, and this often requires sample sizes to be powered to detect medium-to-large effect size trait disruptions. This ‘wide net’ approach allows the most interesting strains to be identified across a variety of traits, which can then be the focus of follow-up studies with larger samples. The sample size (N=8 per Chd8 genotype, sex, and strain) was determined based on phenotypic variance for behavioral traits in the BXD and CC panels,24,25,48–50 effects sizes from studies on Chd8+/− in the B6 strain,35,51–54 and strain number recommendations for recombinant inbred panel studies.55,56 Variability in behavioral phenotyping can be impacted by a variety of non-biological variables and thus, replication of findings is important. This is facilitated by open access to the original datasets and methods, which is provided here. The high variability within WT strains and Chd8 genotype groups for some traits like social sniffing and aggression—behaviors regulated by context and experience—likely reflects biological variability due to individual differences in early life environment such as maternal care or within-cage dominance hierarchies.57–59
The most popular mouse background used in studies of NDD risk genes, B6, served as an important basis of comparison for trait penetrance differences. Previous studies of Chd8+/− on social behavior in B6 have demonstrated increased social interactions caused by Chd8+/− with small effect sizes and included at least 15 subjects per Chd8 genotype group.35,53,54 In the present study, only 3 strains had significant increases in social sniffing in the DSI test, with sex differences in each strain. In contrast, the SD test revealed social behavior disruptions due to Chd8+/− in most strains and sexes with 6 subjects per group. Performance in the SD test correlated with DSI sniffing in males and females, confirming a relationship with social behaviors in a different context. Thus, the murine SD test may be a more ethologically relevant test of social behaviors, with output involving less variability than other commonly used tasks, including the DSI and 3-chamber social interaction tasks.
The study of highly penetrant, rare mutations that are causal for NDDs has been recognized as a key strategy for determining convergent and unique mechanisms of action.60–63 The present study demonstrates the importance of examining phenotypic heterogeneity systematically in the context of genetic diversity. Given the number of causal genes for NDDs already identified, examining the influence of strain background on the expression of disrupted traits or resilience of phenotypes produced by other gene mutations will require a larger scale, multi-site effort. We suggest that for Chd8, the entire study of 33 strains is not necessary to recapitulate. The current dataset will provide opportunities to select specific strains for genomic and phenotypic characterization to determine the underlying mechanisms that generate the extreme differences of phenotypic disruption caused by Chd8+/− and the factors mediating resilience to the mutation. It would be informative to probe the impact of mutations in other high confidence NDD genes in the select strains that exhibit particular resilience and susceptibility.
Translation of GRP Population and Individual Strain Differences in Phenotypes to Human NDDs
We hypothesized that there would be strain differences in phenotype penetrance due to Chd8+/− based on studies from our laboratory24,25 and others reporting heterogeneity of complex traits and responses to single-gene mutations using GRPs.7,14,22,27,56,64–69 At the population level, traits in Chd8+/− mice exhibited disruptions that partially overlapped with trait heterogeneity observed in the WT population but with different effect sizes. At an individual level, for all traits, there were major differences in the effect size across strains, thus consistent with symptom heterogeneity in individuals with CHD8 mutations. Somewhat surprising, however, individual Chd8+/− strains exhibited highly complex phenotypic profiles. Trait outcomes were broadly represented, with strains exhibiting large effects on some traits and resilience to other trait disruptions. Strain and sex groups further differed by the number of traits severely impacted, such as B6-CC12 females exhibiting 2 trait disruptions with large effect sizes while B6-B6 females exhibited 7. No strain was singularly resilient or susceptible to all the measured trait disruptions caused by Chd8+/−. Therefore, studies that aim to discover biological mechanisms contributing to disorder risk and severity should consider which trait, or combination of traits, are impacted in a particular mouse strain. Understanding the molecular and circuit mechanisms underlying Chd8+/− in genetically diverse populations will likely require investigating multiple diverse genetic backgrounds, as one genetic background may be resilient to specific trait disruptions and is therefore unable to capture a complete picture of the impact of specific genetic mutations.
At the population level, increased social dominance, macrocephaly, and decreased DOF ambulatory behavior were the most impacted traits due to Chd8+/−. At the individual strain level, most strains contributed to the population level effect by consistently being impacted in the same direction. However, traits for which individual strains showed more heterogeneity in the severity and direction of the disruption due to Chd8+/− contributed to smaller or negligible population effect sizes. This masked strain and sex groups that had opposite effects compared to the population. This parallels clinical features of ASD, for which individuals present with core trait disruptions that may manifest in opposite directions, such as hyper- versus hypo- sociability or sensory sensitivities.
At the population level, NDDs commonly have a sex bias, such as the higher prevalence of ASD in males compared to females.70 CHD8 haploinsufficiency may also have a male bias.30,52,71 However, our data reveal that females were also impacted by Chd8+/−, but the manifestation of trait disruptions by sex differed depending on the strain background. Moreover, while males were more severely impacted by Chd8+/− on increased brain weights compared to females at the population level, females were more impacted on increased SD due to Chd8+/− than males.
At the individual strain level, sex was also a major factor in mediating outcomes. For example, although males and females in the most widely studied strain of Chd8+/−, B6, were impacted with a large effect size on the same number of traits (7 traits), there were clear sex differences in the severity and occurrence of trait disruptions. For example, B6 females were particularly sensitive to reduced body weight due to Chd8+/−, while B6 males were only impacted significantly at weaning. In addition, B6 females were the only strain to display decreased anxiety-like behaviors due to Chd8+/−, and B6 males were unaffected. Moreover, B6 Chd8+/− females were more severely impacted on decreased activity in the DOF task than B6 Chd8+/− males. On the other hand, B6 males were more susceptible to macrocephaly, fear expression, and SD compared to B6 females. Since genetic background and sex are major contributors to biological outcomes due to Chd8 haploinsufficiency, these variables should be addressed in future studies.
Considering the same-strain heterogeneity of trait disruptions due to Chd8+/− for males and females of all 33 strains, the possibility of accounting for heterogeneity solely based on differences in CHD8 expression from genetic differences in the WT allele is unlikely. It is more likely that there are differences in non-coding regulatory regions in the WT allele inherited from 33 strain backgrounds that interact with sex to contribute to the observed trait differences. Even within clusters, strains were not impacted in an identical way across all traits, further suggesting polygenic contributions to trait disruptions. Nevertheless, future studies can align the genomes from the 33 strain backgrounds in this study with the mouse reference genome to determine genetic variation in the Chd8 gene across strains, and differences in protein expression across strains can be measured embryonically during peak Chd8 expression. A related mechanism may be variation in the sensitivity to Chd8 transcriptional regulation exhibited by downstream target genes for which there are key non-coding variations across the strains investigated here.72–74
Conclusion
Complex trait disruptions due to Chd8+/− were captured in a diverse GRP population. Sex is an important modifier of trait penetrance, as is often observed in ASD, but less known for rare mutations. We also found evidence that specific traits may covary in the population, in addition to their disruption by Chd8+/−. The analyses facilitated the classification of groups of strains and sexes with shared patterns in the occurrence, magnitude, and direction of trait disruptions. The high degree of heterogeneity is not surprising given prior studies and the hypothesized association between genetic background and clinical heterogeneity in ASD. The findings reveal critical concepts regarding the genesis and complexity of trait heterogeneity. The results also emphasize that one strain background may not be optimal for evaluating specific phenotypes. This study provides for the first time a curated list of openly available CC and BXD strains and sexes that can serve as genetic and molecular anchor points for mechanistic discoveries on the origins of susceptibility, resilience, and trait covariance for high-confidence NDD genes. From this foundation comes the promise of discovering NDD etiologies and improving the use of model systems for screening treatments at the population level and in particularly vulnerable individual strains.
STAR METHODS
RESOURCE AVAILABILITY
Lead contact
Further information and requests for resources should be directed to and will be fulfilled by the lead contact, Pat Levitt (plevitt@chla.usc.edu).
Materials availability
This study did not generate new unique reagents.
Data and code availability
Statistical results for data analyses of traits by genotype, sex, and strain are listed in the supplemental data tables in this manuscript. Raw trait data for each subject have been deposited onto Mendeley at https://doi.org/DOI:10.17632/cgkghx79my.1
This paper does not report original code.
Any additional information required to reanalyze the data reported in this paper is available from the lead contact upon request.
EXPERIMENTAL MODEL AND SUBJECT DETAILS
Animals
Mice were housed in the Ray R. Irani vivarium at the USC main campus from 2019–2021. Mice were housed in standard ventilated cages on a 12 h light/dark cycle (lights on at 6:00 AM) in a temperature (20–22°C) and humidity (40–60%) controlled room with ad libitum access to standard rodent chow and filtered water. C57BL/6J (B6) mice that were heterozygous for Chd8 (Chd8+/−) were received from Dr. Feng Zhang. This B6-Chd8 mouse line was generated through Cas9-mediated germline editing followed by germline transmission and inheritance. Chd8+/−mice in this study are descendants from one founder with germline transmission of a loss-of-function Chd8 allele containing a 7-nucleotide deletion in exon 1, resulting in a 50% reduction in CHD8 protein expression at embryonic day 18 compared to WT littermates.35 B6-Chd8+/− dams were bred with males from 27 Collaborative Cross (CC) and 5 BXD recombinant inbred strains, in addition to B6 males, all obtained from The Jackson Laboratory (Bar Harbor, ME) at 6 to 8 weeks of age and allowed to habituate to the colony for two weeks before breeding. This breeding strategy results in F1 progeny inheriting a single nuclear allele derived from the mother and the second allele derived from genetically diverse sires from GRP strains or B6. Mitochondrial DNA is held constant (B6), and Chd8 heterozygosity is inherited from the mother. CC and BXD strains were chosen based on health data provided for CC strains by the Complex Traits Consortium, in addition to prior work from our laboratory demonstrating variability in sociality in a BXD panel. CC strains noted to have reduced survivability or health challenges like frequent dermatitis were not selected. Sires were removed before litter birth to control for differences in paternal care. The experimental F1 WT and Chd8+/− B6-CC, B6-BXD, and B6-B6 male and female littermates were weaned at P21 and housed with 2–5 same-sex cagemates. All mice in this study were genotyped for Chd8 with validated in-house genotyping protocols using tail snips (~1–1.5 mm) collected at weaning. At euthanasia, additional tail samples were harvested, and subjects were genotyped for a second time to confirm Chd8 genotype. Experimental mice were tested in three cohorts over 2 years. The first cohort included 17 strains, the second cohort included 12 strains, and the last cohort included 4 strains. Subjects were tested in the following order with at least a 1-week break between tests: DOF, DSI, BOF, and cued fear conditioning. The subset of 21 strains tested in the SD test were tested at least one week before fear conditioning. SD matches were between age- and weight- matched conspecifics. Within-cage SD was conducted after the experience of SD over strangers (between cages). SD was not tested in 12 GRP strains because of significant age differences of subjects housed in different cages. All experimental procedures were approved by the University of Southern California (USC) Institutional Animal Care and Use Committee under protocol 11844-CR011. In addition, all experimental procedures followed the Guidelines for the Care and Use of Laboratory Animals by the National Institutes of Health.
METHOD DETAILS
Behavioral tests were conducted during the light cycle (between 6:00 AM and 5:00 PM). Mice were transported to the testing room or a holding room adjacent to the testing room at least 45 minutes before testing. Body weights were taken at weaning (P21), in adolescence (P35), as young adults directly after the DSI test (~P125), and as older adults directly before euthanasia (~P192). A total of 1,051 mice entered the study. Researchers were blind to the Chd8 genotype of the subjects during behavioral testing and collection of body and brain weights. The order of strains that underwent behavioral testing was randomized. Males and females were tested in separate groups so that both sexes were not occupying the same behavioral suite during any test. Groups being tested were separated by about a day. Behavioral tests were separated within subjects by at least one week and conducted in the order described above. Once entered into the study, subjects were included for the entire study duration. A small number of subjects were excluded due to unexpected death or pronounced physical defects such as malocclusion. There were not enough exclusions to statistically analyze strain or genotype effects, but no exclusions were specific to any one strain.
Dark Open Field (DOF) Test
Baseline activity levels were assessed using the DOF test at a mean age of P115 (standard deviation: 13). In this task, mice were placed into a dark Plexiglas testing arena measuring 26.99 cm L × 26.99 cm W × 20.32 cm H (Med Associates, Inc.; up to 6 activity chambers were in use at the same time, but only one sex was tested at any given time, and typically only one sex was tested on a given day) that was enclosed in a larger cabinet with a fan to ensure darkness and quiet during the 30-minute test. Activity levels of the freely moving subjects were captured with infrared sensors fixed throughout the box that were fed into a computer with Med Associates activity tracker software installed. Data for each run was later extracted from the activity tracker software for further analysis. Distance traveled was the main dependent variable analyzed for the DOF test in this study.
Direct Social Interaction (DSI) Task
Social behaviors towards a same-sex conspecific were assessed in the DSI test at a mean age of P125 (standard deviation: 14) under approximately 70 lumens lighting conditions. Subjects were placed in the rectangular Plexiglass testing chamber (30 L X 19 W X 19 H cm) for a 10-minute habituation period. Then, a sex-matched B6 juvenile (P26-P30; mean P28) was placed into the testing chamber for the 6-minute test. Juvenile B6 males and females were used in the DSI test to minimize potential aggressive behaviors. Behavior was videotaped from top-down and frontal viewpoints. Videos were later scored by trained researchers blind to subject genotype with Boris, an open-source behavioral scoring software. Behaviors scored and analyzed included durations and frequencies of sniffing, aggression, and mounting. Sniffing was defined as the subject’s nose being approximately 1 cm away from the juvenile and sniffing anywhere on the juvenile’s body, including their tail. Aggression was scored when it became overt and included biting, dragging, tumbling, and forceful pushing. Mounting was scored when the subjects were on their hindlegs with their forepaws extended and a hunched posture over any part of the juvenile’s body. Only 1.4% of mice across 10 (3%) strains displayed mounting. Therefore, mounting was excluded from further analyses. After the study concluded, one researcher assigned an equal number of videos to score from each genotype, sex, and strain group across a team of 5 researchers. Before scoring behavioral videos for this study, all researchers scored a set of training videos from different strains that displayed a range of sniffing and aggression durations during the DSI task. Researchers completed training when results from multiple scoring sessions were consistent with the results of senior researchers. Video files were named with non-descriptive ID numbers and were coalesced into folders on a server accessible by the entire research team. Video assignments were listed on a shared Excel sheet that did not include genotype information. After behavioral videos were scored, results were added to a shared master Excel sheet that listed the subject ID information but did not include genotype information. In addition, 25% of the videos were randomly chosen and reassigned to 5 researchers who differed from the original scorer. Results were compared for accuracy and averaged across scorers if there was less than a 10% difference between scorers for all variables. If videos did not meet inclusion criteria, the video was scored again until there was reliability across scoring sessions.
Bright Open Field Test (BOF)
Anxiety-like behaviors were assessed with the BOF test. The BOF test began when subjects were placed into the center of a brightly illuminated Plexiglas test chamber measuring 26.99 cm L × 26.99 cm W × 20.32 cm H (Med Associates, Inc.; the same activity system as used in the DOF test). Adjustable LED lights at the top of the chamber were calibrated daily to achieve a brightness of ~2,000 lumens using a lux meter placed in the bottom and center of each chamber. The test chamber was enclosed in a larger cabinet during the 30-minute test to ensure an isolated environment and reduced noise. The mouse’s location was tracked by a series of infrared sensors fixed throughout the box and transmitted to Med Associates activity tracker software. The tracking accuracy of the sensors was verified by more than one researcher regularly throughout this study. The distance traveled along the outside perimeter, and the distance traveled in the center of the box (4.37 cm2), were later extracted from the activity tracker software for further analysis of the percent center distance traveled.
Social Dominance (SD) Test
Age- and weight- matched Chd8+/− and WT mice from a subset of strains (N=21) of the same sex and strain were paired in the SD test. The SD test began when a Chd8+/− and WT mouse simultaneously entered the opposite ends of a narrow clear plastic tube (12 inches long, variable diameters (see below); ePlastics, San Diego, CA). Two researchers that were blind to Chd8 genotype coordinated the removal of each mouse from the home cage and placement into the opposite openings of the tube with their noses oriented inside the tube openings until the mice entered and met in the approximate middle of the tube. The mouse that was the first to leave the tube was recorded as the “loser”, and the mouse remaining in the tube was recorded as the “winner”. “Winners” that did not leave the tube following the “losers” exit were coaxed to exit by continuing through the tube by gentle nudging of their backside with a flexible rubber rod. Before SD testing, mice were trained to run through the tube approximately 10 times for two consecutive training days. Mice were trained to run through the tube by consistently placing their nose into the tube opening until they advanced into the tube and then gently nudging their backside with a rubber rod to coax them to continue through the tube. Once mice entered the tube, they were generally willing to continue entering and exiting freely (running back and forth in the tube) without researcher interference. However, some strains preferred to remain in the tube and were nudged gently through the tube during acclimation. Tube sizes were either small (1.250” outer diameter [OD] × 1.000” interior diameter [ID]), medium (1.250” OD × 1.125” ID), or large (1.500” OD × 1.250” ID) and were selected to best fit each strain so that a mouse could not turn around to exit the tube, but instead could exit only by moving forward or backward. All SD matches reported in this study were between Chd8+/− and WT same sex and strain conspecifics. Males and females were first tested against unfamiliar conspecifics from different cages and then against their opposite Chd8 genotype cagemates. Each subject participated in 4 matches between opposite Chd8 genotype strangers and 2 matches between cagemates.
Fear Conditioning
To assess learning and memory, cued fear conditioning was conducted in a standard automated near-infrared video fear conditioning system (Med Associates). The testing chamber (30 L X 25 W X 21 H cm) had stainless steel walls and floor bars, and a transparent acrylic door and was enclosed in a sound-attenuating chamber; tests were always conducted in complete darkness while the chambers were illuminated with infrared light and activity was recorded using a front-facing infrared camera. Up to four chambers were run simultaneously, and males and females were tested during separate sessions, typically on different days. The fear conditioning test encompassed 4 days and included habituation on day 1, training on day 2 (i. e., fear acquisition), memory testing on day 3 (i. e., fear expression), and memory extinction testing on day 4 (i. e., fear extinction). On habituation day 1, mice were acclimated for 30 minutes to the test chamber. On training day 2, 5 presentations of a 5 kHz, 90 dB, 30-second tone (conditioned stimulus; CS) were paired with a mild 0.5 mA, 2-second foot-shock unconditioned stimulus (US). The CS and US co-terminated. The first CS-US presentation occurred 180 seconds after the start of the test; subsequent CS-US presentations were separated by 180 seconds. On test day 3, cued fear was measured approximately 24 hours later in a novel context. Textured clear plastic walls and smooth white plastic floor inserts provided a novel context, and subjects were presented with 10 CS presentations, each 30 seconds long with 60 second inter-CS intervals. Approximately 24 hours later, on the last testing day, the extinction of fear memory was tested in the same manner as on testing day 3. Fear conditioning tests were videotaped (30 frames/s) under near-infrared light and freezing times were scored automatically using VideoFreeze software (Med Associates). Freezing times were defined as no movement for 1 second (30 frames). Testing chambers were cleaned by first spot cleaning waste with Kimwipes, followed by wiping down with paper towels with water, followed by 70% ethanol, and then dried thoroughly.
Fear learning during training on day 2 was assessed with fear acquisition scores that were calculated by subtracting the percent time the subject spent freezing to the first tone presentation (before mice received the first foot-shock) from the fifth presentation of the tone paired with a mild foot-shock. Fear memory was assessed with fear expression scores that were calculated by averaging the percent freezing during the first three presentations of the tone presented in a novel environment without foot-shocks (tone alone) on testing day 3. Fear memory extinction was calculated by subtracting fear expression scores from the average percent freezing to the last three tone presentations on extinction day 4. We endeavored to control for Chd8 genotype group differences in baseline freezing in fear acquisition scores by including the percent freezing to the first presentation of the tone alone (CS5-CS1). The average percent freezing during the 180 seconds before the first tone presentation and freezing to the tone alone (CS1) are listed in Data Tables 1 and 2 for each strain, sex, and Chd8 genotype group. Fear expression was also considered in fear extinction scores to control for group differences in fear learning on fear extinction.
Body and Brain Weights
Body weights were measured for all subjects at weaning (P21) and adolescence (P35). Adult body weights were collected directly after the DSI test (mean = P125 +/− 14) and at euthanasia directly before brain removal (mean = P 192 +/− 13). Mice were euthanized with vaporized (~4%) isoflurane exposure, and upon cessation of breathing, death was confirmed by decapitation. Directly after isoflurane exposure but before decapitation, subjects body weights were recorded, and tail snips (~4 mm) were collected to confirm Chd8 genotypes. Brains were extracted immediately, and brain weights were obtained. Two researchers, expert at dissections, collected all brains, and the entire process from the point of euthanasia to weighing the brain took approximately 10 minutes per subject.
QUANTIFICATION AND STATISTICAL ANALYSIS
Traits analyzed include weanling, adolescent, adult, and terminal body weights, brain weight, DOF distance traveled, DSI aggression and sniffing durations, percent distance traveled in the center of the BOF, fear acquisition, fear expression, and fear extinction for all 33 strains. The percentage of wins during the SD test between opposite Chd8 genotype cagemates and strangers was also analyzed for 21 strains. Outliers were assessed in the combined population as well as by strain and sex groups by visual inspection of histograms and z-score cut off criteria of 3. Normality was evaluated in the combined population by Skewness and Kurtosis values, and Kolmogorov-Smirnov and Shapiro-Wilk test statistics. Homogeneity of variance across traits, strains, and sexes was analyzed with coefficients of variation (CoV) and Levene’s test. CoV was calculated by dividing the strain, sex, and genotype group standard deviation by the group mean.
The impact of Chd8 heterozygosity on trait distributions across strains was investigated with parametric and non-parametric tests, including one-way analysis of variance (ANOVA) and Mann-Whitney U tests. In Table S1 and Table S2, we report R2 values, F-statistics, and p-values from ANOVAs in addition to Mann-Whitney U test statistics and corresponding p-values. In addition, group means and median differences with 95% confidence intervals are reported in Table S1 and Table S2. Parametric and non-parametric effect size estimates are also reported, including Cohen’s D with 95% confidence intervals, Vargha & Delaney’s A probability of stochastic superiority, and the Common Language effect size. Statistics for the strain population, with sexes combined and separated, are listed in Table S1 and by strains and sex groups in Table S2. In addition, RM ANOVAs were performed to evaluate body weight and fear conditioning trajectories by groups. These results are listed in the corresponding figure legends, which also highlight statistical results for main comparisons discussed in the text. All statistical analyses and calculations were conducted in SPSS and Excel. Figures and graphs were constructed with Tableau, Prism, and BioRender.
Effect size estimates
Cohen’s D is the main effect size estimate reported in the text and some figures. Cohen’s D was calculated by subtracting the mean trait value for Chd8+/− mice from the mean trait value for Chd8 WT mice within a strain and sex for Chd8+/− strain effect sizes or across all strains combined for Chd8+/− population effect sizes. The mean difference was then divided by the pooled standard deviation. Common language effect sizes are also reported in supplementary data tables and is the probability that a trait for a randomly selected Chd8+/− subject will be greater than a randomly sampled Chd8 WT subject with the null value being 50%.
Heritability
Broad-sense heritability (H2) values were calculated using one way-ANOVA to determine the proportion of phenotypic variance accounted for by strain in the WT population.
Principal Component Analysis
All subject’s trait values were standardized by z-scoring within their strain group for body weights, DOF activity, DSI sniffing and aggression, BOF percent center activity, fear conditioning variables, and brain weights. PCA involved a rotated component matrix on z-scores across 12 traits for each subject with Varimax rotation and Kaiser normalization.
Factor Analysis and Hierarchical Clustering Analysis
Exploratory factor analysis (EFA) was conducted on Cohen’s D effect sizes for body weights, DOF activity, DSI sniffing and aggression, BOF percent center activity, fear conditioning variables, and brain weights across strain and sex groups (N=66) with the principal axis factoring extraction method. Hierarchical cluster analysis (HCA) was also performed on trait Cohen’s D values with agglomeration schedule, proximity matrix, Ward’s linkage, and squared Euclidian distance.
Data and materials availability:
Datasets used in the analysis are available as supplementary tables with this paper and on Mendeley at https://doi.org/DOI:10.17632/cgkghx79my.1
Supplementary Material
Table S1. Chd8+/− population effect descriptives and statistics for all traits. Descriptive statistics and statistical results for comparisons of trait disruptions in the combined strain population by WT and Chd8+/− groups and by sex. Related to Figure 2.
Table S2. Chd8+/− strain effect descriptives and statistics. Descriptive statistics and statistical results for comparisons of trait disruptions between WT and Chd8+/− groups within each strain and sex. Related to Figure 6.
Key resources table.
| REAGENT or RESOURCE | SOURCE | IDENTIFIER |
|---|---|---|
| Antibodies | ||
| Bacterial and virus strains | ||
| Biological samples | ||
| Chemicals, peptides, and recombinant proteins | ||
| Critical commercial assays | ||
| Deposited data | ||
| Raw behavioral dataset | This paper | Mendeley https://doi.org/ DOI: 10.17632/cgkghx79my.1 |
| Experimental models: Cell lines | ||
| Experimental models: Organisms/strains | ||
| Mouse: CC1: CC001/Unc | The Jackson Laboratory | 21238 |
| Mouse: CC2: CC002/Unc | The Jackson Laboratory | 21236 |
| Mouse: CC6: CC006/TauUnc | The Jackson Laboratory | 22869 |
| Mouse: CC7: CC007/Unc | The Jackson Laboratory | 29625 |
| Mouse: CC8: CC008/GeniUnc | The Jackson Laboratory | 26971 |
| Mouse: CC10: CC010/GeniUnc | The Jackson Laboratory | 21889 |
| Mouse: CC12: CC012/GeniUnc | The Jackson Laboratory | 28409 |
| Mouse: CC13: CC013/GeniUnc | The Jackson Laboratory | 21892 |
| Mouse: CC16: CC016/GeniUnc | The Jackson Laboratory | 24684 |
| Mouse: CC17: CC017/Unc | The Jackson Laboratory | 22870 |
| Mouse: CC18: CC018/Unc | The Jackson Laboratory | 21890 |
| Mouse: CC22: CC022/GeniUnc | The Jackson Laboratory | 25424 |
| Mouse: CC23: CC023/GeniUnc | The Jackson Laboratory | 25131 |
| Mouse: CC24: CC024/GeniUnc | The Jackson Laboratory | 21891 |
| Mouse: CC25: CC025/GeniUnc | The Jackson Laboratory | 18857 |
| Mouse: CC27: CC027/GeniUnc | The Jackson Laboratory | 25130 |
| Mouse: CC28: CC028/GeniUnc | The Jackson Laboratory | 25126 |
| Mouse: CC32: CC032/GeniUnc | The Jackson Laboratory | 20946 |
| Mouse: CC40: CC040/TauUnc | The Jackson Laboratory | 23831 |
| Mouse: CC42: CC042/GeniUnc | The Jackson Laboratory | 20947 |
| Mouse: CC43: CC043/GeniUnc | The Jackson Laboratory | 23828 |
| Mouse: CC44: CC044/Unc | The Jackson Laboratory | 26426 |
| Mouse: CC45: CC045/GeniUnc | The Jackson Laboratory | 25425 |
| Mouse: CC57: CC057/Unc | The Jackson Laboratory | 24683 |
| Mouse: CC60: CC060/Unc | The Jackson Laboratory | 26427 |
| Mouse: CC61: CC061/GeniUnc | The Jackson Laboratory | 23826 |
| Mouse: CC75: CC075/Unc | The Jackson Laboratory | 27293 |
| Mouse: BXD8: BXD8/TyJ | The Jackson Laboratory | 84 |
| Mouse: BXD21: BXD21/TyJ | The Jackson Laboratory | 77 |
| Mouse: BXD32: BXD32/TyJ | The Jackson Laboratory | 78 |
| Mouse: BXD42: BXD42/TyJ | The Jackson Laboratory | 3230 |
| Mouse: BXD62: BXD62/RwwJ | The Jackson Laboratory | 7107 |
| Mouse: B6: C57BL/6J | The Jackson Laboratory | 664 |
| Oligonucleotides | ||
| Recombinant DNA | ||
| Software and algorithms | ||
| Other | ||
Chd8 mutation in 33 genetic reference panel mouse strains recapitulates clinical heterogeneity
Strains differ in Chd8 mutation impact on traits from large to small effect sizes
Some strains exhibit resilience to the Chd8 mutation for specific traits
Mouse genetic diversity provides platform to study risk and resilience to Chd8 mutation
Individuals with neurodevelopmental disorders present with wide variability in symptoms which can be modified by their unique combination of genetic variants. Tabbaa et al. (2022) reveal that studying genetic mutations in an ASD-risk gene (Chd8) across many genetically diverse mouse strains recapitulates individual differences in symptom occurrence, manifestation, and severity.
Acknowledgments:
The authors thank Amanda Whipple and Patricia Aguiar for their assistance with behavioral testing and colony management. We thank Sunny Lee, Shreya Harappanahally, Shrestha Vijayendra, and Khalifa Elmagarmid for their assistance in scoring behavioral videos. We are grateful to Rob Williams, Kathie Eagleson, Brian Dias, and Rex Moats for their feedback on versions of this manuscript. We also thank our funding sources: National Institute of Mental Health R21MH118685 (P.L., A.K.), National Science Foundation Postdoctoral Research Fellowship in Biology DBI 2011039 (M.T.), Saban Research Institute Research Career Development Fellowship (M.T.), Simms Mann Chair in Developmental Neurogenetics (P.L.), Developmental Neuroscience and Neurogenetics Program, Children’s Hospital Los Angeles (P.L.), and WM Keck Chair in Neurogenetics, Keck School of Medicine, University of Southern California (P.L.).
Footnotes
Declaration of interests:
P.L. is a member of the journal’s advisory board. Authors declare that they have no other competing interests.
Publisher's Disclaimer: This is a PDF file of an unedited manuscript that has been accepted for publication. As a service to our customers we are providing this early version of the manuscript. The manuscript will undergo copyediting, typesetting, and review of the resulting proof before it is published in its final form. Please note that during the production process errors may be discovered which could affect the content, and all legal disclaimers that apply to the journal pertain.
References
- 1.Antaki D, Guevara J, Maihofer AX, Klein M, Gujral M, Grove J, Carey CE, Hong O, Arranz MJ, Hervas A, et al. (2022). A phenotypic spectrum of autism is attributable to the combined effects of rare variants, polygenic risk and sex. Nat. Genet., 1–9. 10.1038/s41588-022-01064-5. [DOI] [PMC free article] [PubMed] [Google Scholar]
- 2.Warrier V, Zhang X, Reed P, Havdahl A, Moore TM, Cliquet F, Leblond CS, Rolland T, Rosengren A, EU-AIMS LEAP, et al. (2022). Genetic correlates of phenotypic heterogeneity in autism. Nat. Genet. 10.1038/s41588-022-01072-5. [DOI] [PMC free article] [PubMed] [Google Scholar]
- 3.Jeste SS, and Geschwind DH (2014). Disentangling the heterogeneity of autism spectrum disorder through genetic findings. Nat. Rev. Neurol. 10, 74–81. 10.1038/nrneurol.2013.278. [DOI] [PMC free article] [PubMed] [Google Scholar]
- 4.Sl S, Rf A, and Ma S (1988). Autism and genetics. A decade of research. Arch. Gen. Psychiatry 45. 10.1001/archpsyc.1988.01800340081013. [DOI] [PubMed] [Google Scholar]
- 5.Ritvo ER, Freeman BJ, Mason-Brothers A, Mo A, and Ritvo AM (1985). Concordance for the syndrome of autism in 40 pairs of afflicted twins. Am. J. Psychiatry 142, 74–77. 10.1176/ajp.142.1.74. [DOI] [PubMed] [Google Scholar]
- 6.Folstein S, and Rutter M (1977). Infantile autism: a genetic study of 21 twin pairs. J. Child Psychol. Psychiatry 18, 297–321. 10.1111/j.1469-7610.1977.tb00443.x. [DOI] [PubMed] [Google Scholar]
- 7.Chesler EJ (2014). Out of the bottleneck: the Diversity Outcross and Collaborative Cross mouse populations in behavioral genetics research. Mamm. Genome Off. J. Int. Mamm. Genome Soc. 25, 3–11. 10.1007/s00335-013-9492-9. [DOI] [PMC free article] [PubMed] [Google Scholar]
- 8.Sittig LJ, Carbonetto P, Engel KA, Krauss KS, Barrios-Camacho CM, and Palmer AA (2016). Genetic background limits generalizability of genotype-phenotype relationships. Neuron 91, 1253–1259. 10.1016/j.neuron.2016.08.013. [DOI] [PMC free article] [PubMed] [Google Scholar]
- 9.Williams RW (2009). Herding cats: the sociology of data integration. Front. Neurosci. 3, 154–156. 10.3389/neuro.01.016.2009. [DOI] [PMC free article] [PubMed] [Google Scholar]
- 10.Crabbe JC, Wahlsten D, and Dudek BC (1999). Genetics of mouse behavior: interactions with laboratory environment. Science 284, 1670–1672. 10.1126/science.284.5420.1670. [DOI] [PubMed] [Google Scholar]
- 11.Bolivar VJ, Walters SR, and Phoenix JL (2007). Assessing autism-like behavior in mice: variations in social interactions among inbred strains. Behav. Brain Res. 176, 21–26. 10.1016/j.bbr.2006.09.007. [DOI] [PMC free article] [PubMed] [Google Scholar]
- 12.Nadler JJ, Zou F, Huang H, Moy SS, Lauder J, Crawley JN, Threadgill DW, Wright FA, and Magnuson TR (2006). Large-scale gene expression differences across brain regions and inbred strains correlate with a behavioral phenotype. Genetics 174, 1229–1236. 10.1534/genetics.106.061481. [DOI] [PMC free article] [PubMed] [Google Scholar]
- 13.Moy SS, Nadler JJ, Young NB, Perez A, Holloway LP, Barbaro RP, Barbaro JR, Wilson LM, Threadgill DW, Lauder JM, et al. (2007). Mouse behavioral tasks relevant to autism: phenotypes of 10 inbred strains. Behav. Brain Res. 176, 4–20. 10.1016/j.bbr.2006.07.030. [DOI] [PMC free article] [PubMed] [Google Scholar]
- 14.Ashbrook DG, Arends D, Prins P, Mulligan MK, Roy S, Williams EG, Lutz CM, Valenzuela A, Bohl CJ, Ingels JF, et al. (2021). A platform for experimental precision medicine: The extended BXD mouse family. Cell Syst. 12, 235–247.e9. 10.1016/j.cels.2020.12.002. [DOI] [PMC free article] [PubMed] [Google Scholar]
- 15.Swanzey E, O’Connor C, and Reinholdt LG (2021). Mouse Genetic Reference Populations: Cellular Platforms for Integrative Systems Genetics. Trends Genet. 37, 251–265. 10.1016/j.tig.2020.09.007. [DOI] [PMC free article] [PubMed] [Google Scholar]
- 16.Rasmussen AL, Okumura A, Ferris MT, Green R, Feldmann F, Kelly SM, Scott DP, Safronetz D, Haddock E, LaCasse R, et al. (2014). Host genetic diversity enables Ebola hemorrhagic fever pathogenesis and resistance. Science 346, 987–991. 10.1126/science.1259595. [DOI] [PMC free article] [PubMed] [Google Scholar]
- 17.Rogala AR, Morgan AP, Christensen AM, Gooch TJ, Bell TA, Miller DR, Godfrey VL, and de Villena FP-M (2014). The Collaborative Cross as a resource for modeling human disease: CC011/Unc, a new mouse model for spontaneous colitis. Mamm. Genome Off. J. Int. Mamm. Genome Soc. 25, 95–108. 10.1007/s00335-013-9499-2. [DOI] [PMC free article] [PubMed] [Google Scholar]
- 18.Ferguson B, Ram R, Handoko HY, Mukhopadhyay P, Muller HK, Soyer HP, Morahan G, and Walker GJ (2015). Melanoma susceptibility as a complex trait: genetic variation controls all stages of tumor progression. Oncogene 34, 2879–2886. 10.1038/onc.2014.227. [DOI] [PubMed] [Google Scholar]
- 19.Hackett JB, Glassbrook JE, Muñiz MC, Bross M, Fielder A, Dyson G, Movahhedin N, McCasland J, McCarthy-Leo C, and Gibson HM (2022). A diversity outbred F1 mouse model identifies host-intrinsic genetic regulators of response to immune checkpoint inhibitors. Oncoimmunology 11, 2064958. 10.1080/2162402X.2022.2064958. [DOI] [PMC free article] [PubMed] [Google Scholar]
- 20.Cichocki JA, Furuya S, Venkatratnam A, McDonald TJ, Knap AH, Wade T, Sweet S, Chiu WA, Threadgill DW, and Rusyn I (2017). Characterization of Variability in Toxicokinetics and Toxicodynamics of Tetrachloroethylene Using the Collaborative Cross Mouse Population. Environ. Health Perspect. 125, 057006. 10.1289/EHP788. [DOI] [PMC free article] [PubMed] [Google Scholar]
- 21.Andreux PA, Williams EG, Koutnikova H, Houtkooper RH, Champy M-F, Henry H, Schoonjans K, Williams RW, and Auwerx J (2012). Systems genetics of metabolism: the use of the BXD murine reference panel for multiscalar integration of traits. Cell 150, 1287–1299. 10.1016/j.cell.2012.08.012. [DOI] [PMC free article] [PubMed] [Google Scholar]
- 22.Neuner SM, Heuer SE, Huentelman MJ, O’Connell KMS, and Kaczorowski CC (2019). Harnessing Genetic Complexity to Enhance Translatability of Alzheimer’s Disease Mouse Models: A Path toward Precision Medicine. Neuron 101, 399–411.e5. 10.1016/j.neuron.2018.11.040. [DOI] [PMC free article] [PubMed] [Google Scholar]
- 23.Medetgul-Ernar K, and Davis MM (2022). Standing on the shoulders of mice. Immunity 55, 1343–1353. 10.1016/j.immuni.2022.07.008. [DOI] [PMC free article] [PubMed] [Google Scholar]
- 24.Knoll AT, Halladay LR, Holmes AJ, and Levitt P (2016). Quantitative Trait Loci and a Novel Genetic Candidate for Fear Learning. J. Neurosci. Off. J. Soc. Neurosci. 36, 6258–6268. 10.1523/JNEUROSCI.0177-16.2016. [DOI] [PMC free article] [PubMed] [Google Scholar]
- 25.Knoll AT, Jiang K, and Levitt P (2018). Quantitative trait locus mapping and analysis of heritable variation in affiliative social behavior and co-occurring traits. Genes Brain Behav. 17, e12431. 10.1111/gbb.12431. [DOI] [PMC free article] [PubMed] [Google Scholar]
- 26.Chesler EJ, Miller DR, Branstetter LR, Galloway LD, Jackson BL, Philip VM, Voy BH, Culiat CT, Threadgill DW, Williams RW, et al. (2008). The Collaborative Cross at Oak Ridge National Laboratory: developing a powerful resource for systems genetics. Mamm. Genome Off. J. Int. Mamm. Genome Soc. 19, 382–389. 10.1007/s00335-008-9135-8. [DOI] [PMC free article] [PubMed] [Google Scholar]
- 27.Churchill GA, Airey DC, Allayee H, Angel JM, Attie AD, Beatty J, Beavis WD, Belknap JK, Bennett B, Berrettini W, et al. (2004). The Collaborative Cross, a community resource for the genetic analysis of complex traits. Nat. Genet. 36, 1133–1137. 10.1038/ng1104-1133. [DOI] [PubMed] [Google Scholar]
- 28.Peirce JL, Lu L, Gu J, Silver LM, and Williams RW (2004). A new set of BXD recombinant inbred lines from advanced intercross populations in mice. BMC Genet. 5, 7. 10.1186/1471-2156-5-7. [DOI] [PMC free article] [PubMed] [Google Scholar]
- 29.Weissberg O, and Elliott E (2021). The Mechanisms of CHD8 in Neurodevelopment and Autism Spectrum Disorders. Genes 12, 1133. 10.3390/genes12081133. [DOI] [PMC free article] [PubMed] [Google Scholar]
- 30.Bernier R, Golzio C, Xiong B, Stessman HA, Coe BP, Penn O, Witherspoon K, Gerdts J, Baker C, Vulto-van Silfhout AT, et al. (2014). Disruptive CHD8 mutations define a subtype of autism early in development. Cell 158, 263–276. 10.1016/j.cell.2014.06.017. [DOI] [PMC free article] [PubMed] [Google Scholar]
- 31.Ostrowski PJ, Zachariou A, Loveday C, Beleza-Meireles A, Bertoli M, Dean J, Douglas AGL, Ellis I, Foster A, Graham JM, et al. (2019). The CHD8 overgrowth syndrome: A detailed evaluation of an emerging overgrowth phenotype in 27 patients. Am. J. Med. Genet. C Semin. Med. Genet. 181, 557–564. 10.1002/ajmg.c.31749. [DOI] [PubMed] [Google Scholar]
- 32.Neale BM, Kou Y, Liu L, Ma’ayan A, Samocha KE, Sabo A, Lin C-F, Stevens C, Wang L-S, Makarov V, et al. (2012). Patterns and rates of exonic de novo mutations in autism spectrum disorders. Nature 485, 242–245. 10.1038/nature11011. [DOI] [PMC free article] [PubMed] [Google Scholar]
- 33.Beighley JS, Hudac CM, Arnett AB, Peterson JL, Gerdts J, Wallace AS, Mefford HC, Hoekzema K, Turner TN, O’Roak BJ, et al. (2020). Clinical Phenotypes of Carriers of Mutations in CHD8 or Its Conserved Target Genes. Biol. Psychiatry 87, 123–131. 10.1016/j.biopsych.2019.07.020. [DOI] [PMC free article] [PubMed] [Google Scholar]
- 34.Talkowski ME, Rosenfeld JA, Blumenthal I, Pillalamarri V, Chiang C, Heilbut A, Ernst C, Hanscom C, Rossin E, Lindgren AM, et al. (2012). Sequencing chromosomal abnormalities reveals neurodevelopmental loci that confer risk across diagnostic boundaries. Cell 149, 525–537. 10.1016/j.cell.2012.03.028. [DOI] [PMC free article] [PubMed] [Google Scholar]
- 35.Platt RJ, Zhou Y, Slaymaker IM, Shetty AS, Weisbach NR, Kim J-A, Sharma J, Desai M, Sood S, Kempton HR, et al. (2017). Chd8 Mutation Leads to Autistic-like Behaviors and Impaired Striatal Circuits. Cell Rep. 19, 335–350. 10.1016/j.celrep.2017.03.052. [DOI] [PMC free article] [PubMed] [Google Scholar]
- 36.Ronemus M, Iossifov I, Levy D, and Wigler M (2014). The role of de novo mutations in the genetics of autism spectrum disorders. Nat. Rev. Genet. 15, 133–141. 10.1038/nrg3585. [DOI] [PubMed] [Google Scholar]
- 37.Ramaswami G, and Geschwind DH (2018). Genetics of autism spectrum disorder. Handb. Clin. Neurol. 147, 321–329. 10.1016/B978-0-444-63233-3.00021-X. [DOI] [PubMed] [Google Scholar]
- 38.Weiner DJ, Wigdor EM, Ripke S, Walters RK, Kosmicki JA, Grove J, Samocha KE, Goldstein JI, Okbay A, Bybjerg-Grauholm J, et al. (2017). Polygenic transmission disequilibrium confirms that common and rare variation act additively to create risk for autism spectrum disorders. Nat. Genet. 49, 978–985. 10.1038/ng.3863. [DOI] [PMC free article] [PubMed] [Google Scholar]
- 39.Hanson E, Bernier R, Porche K, Jackson FI, Goin-Kochel RP, Snyder LG, Snow AV, Wallace AS, Campe KL, Zhang Y, et al. (2015). The cognitive and behavioral phenotype of the 16p11.2 deletion in a clinically ascertained population. Biol. Psychiatry 77, 785–793. 10.1016/j.biopsych.2014.04.021. [DOI] [PMC free article] [PubMed] [Google Scholar]
- 40.Paulsen B, Velasco S, Kedaigle AJ, Pigoni M, Quadrato G, Deo AJ, Adiconis X, Uzquiano A, Sartore R, Yang SM, et al. (2022). Autism genes converge on asynchronous development of shared neuron classes. Nature 602, 268–273. 10.1038/s41586-021-04358-6. [DOI] [PMC free article] [PubMed] [Google Scholar]
- 41.Velmeshev D, Schirmer L, Jung D, Haeussler M, Perez Y, Mayer S, Bhaduri A, Goyal N, Rowitch DH, and Kriegstein AR (2019). Single-cell genomics identifies cell type-specific molecular changes in autism. Science 364, 685–689. 10.1126/science.aav8130. [DOI] [PMC free article] [PubMed] [Google Scholar]
- 42.Collaborative Cross Consortium (2012). The Genome Architecture of the Collaborative Cross Mouse Genetic Reference Population. Genetics 190, 389–401. 10.1534/genetics.111.132639. [DOI] [PMC free article] [PubMed] [Google Scholar]
- 43.Threadgill DW, and Churchill GA (2012). Ten years of the collaborative cross. G3 Bethesda Md 2, 153–156. 10.1534/g3.111.001891. [DOI] [PMC free article] [PubMed] [Google Scholar]
- 44.Welsh CE, Miller DR, Manly KF, Wang J, McMillan L, Morahan G, Mott R, Iraqi FA, Threadgill DW, and de Villena FP-M (2012). Status and access to the Collaborative Cross population. Mamm. Genome Off. J. Int. Mamm. Genome Soc. 23, 706–712. 10.1007/s00335-012-9410-6. [DOI] [PMC free article] [PubMed] [Google Scholar]
- 45.Roberts A, Pardo-Manuel de Villena F, Wang W, McMillan L, and Threadgill DW (2007). The polymorphism architecture of mouse genetic resources elucidated using genome-wide resequencing data: implications for QTL discovery and systems genetics. Mamm. Genome Off. J. Int. Mamm. Genome Soc. 18, 473–481. 10.1007/s00335-007-9045-1. [DOI] [PMC free article] [PubMed] [Google Scholar]
- 46.Keane TM, Goodstadt L, Danecek P, White MA, Wong K, Yalcin B, Heger A, Agam A, Slater G, Goodson M, et al. (2011). Mouse genomic variation and its effect on phenotypes and gene regulation. Nature 477, 289–294. 10.1038/nature10413. [DOI] [PMC free article] [PubMed] [Google Scholar]
- 47.Srivastava A, Morgan AP, Najarian ML, Sarsani VK, Sigmon JS, Shorter JR, Kashfeen A, McMullan RC, Williams LH, Giusti-Rodríguez P, et al. (2017). Genomes of the Mouse Collaborative Cross. Genetics 206, 537–556. 10.1534/genetics.116.198838. [DOI] [PMC free article] [PubMed] [Google Scholar]
- 48.Dickson PE, McNaughton KA, Hou L, Anderson LC, Long KH, and Chesler EJ (2015). Sex and strain influence attribution of incentive salience to reward cues in mice. Behav. Brain Res. 292, 305–315. 10.1016/j.bbr.2015.05.039. [DOI] [PMC free article] [PubMed] [Google Scholar]
- 49.Logan RW, Robledo RF, Recla JM, Philip VM, Bubier JA, Jay JJ, Harwood C, Wilcox T, Gatti DM, Bult CJ, et al. (2013). High-precision genetic mapping of behavioral traits in the diversity outbred mouse population. Genes Brain Behav. 12, 424–437. 10.1111/gbb.12029. [DOI] [PMC free article] [PubMed] [Google Scholar]
- 50.Mao J-H, Langley SA, Huang Y, Hang M, Bouchard KE, Celniker SE, Brown JB, Jansson JK, Karpen GH, and Snijders AM (2015). Identification of genetic factors that modify motor performance and body weight using Collaborative Cross mice. Sci. Rep. 5, 16247. 10.1038/srep16247. [DOI] [PMC free article] [PubMed] [Google Scholar]
- 51.Gompers AL, Su-Feher L, Ellegood J, Copping NA, Riyadh MA, Stradleigh TW, Pride MC, Schaffler MD, Wade AA, Catta-Preta R, et al. (2017). Germline Chd8 haploinsufficiency alters brain development in mouse. Nat. Neurosci. 20, 1062–1073. 10.1038/nn.4592. [DOI] [PMC free article] [PubMed] [Google Scholar]
- 52.Jung H, Park H, Choi Y, Kang H, Lee E, Kweon H, Roh JD, Ellegood J, Choi W, Kang J, et al. (2018). Sexually dimorphic behavior, neuronal activity, and gene expression in Chd8-mutant mice. Nat. Neurosci. 21, 1218–1228. 10.1038/s41593-018-0208-z. [DOI] [PubMed] [Google Scholar]
- 53.Katayama Y, Nishiyama M, Shoji H, Ohkawa Y, Kawamura A, Sato T, Suyama M, Takumi T, Miyakawa T, and Nakayama KI (2016). CHD8 haploinsufficiency results in autistic-like phenotypes in mice. Nature 537, 675–679. 10.1038/nature19357. [DOI] [PubMed] [Google Scholar]
- 54.Suetterlin P, Hurley S, Mohan C, Riegman KLH, Pagani M, Caruso A, Ellegood J, Galbusera A, Crespo-Enriquez I, Michetti C, et al. (2018). Altered Neocortical Gene Expression, Brain Overgrowth and Functional Over-Connectivity in Chd8 Haploinsufficient Mice. Cereb. Cortex N. Y. N 1991 28, 2192–2206. 10.1093/cercor/bhy058. [DOI] [PMC free article] [PubMed] [Google Scholar]
- 55.Reilly KM (2016). Using the Collaborative Cross to Study the Role of Genetic Diversity in Cancer-Related Phenotypes. Cold Spring Harb. Protoc. 2016, pdb.prot079178. 10.1101/pdb.prot079178. [DOI] [PMC free article] [PubMed] [Google Scholar]
- 56.Williams RW, and Williams EG (2017). Resources for Systems Genetics. Methods Mol. Biol. Clifton NJ 1488, 3–29. 10.1007/978-1-4939-6427-7_1. [DOI] [PubMed] [Google Scholar]
- 57.Starr-Phillips EJ, and Beery AK (2014). Natural variation in maternal care shapes adult social behavior in rats. Dev. Psychobiol. 56, 1017–1026. 10.1002/dev.21182. [DOI] [PubMed] [Google Scholar]
- 58.Laviola G, and Terranova ML (1998). The developmental psychobiology of behavioural plasticity in mice: the role of social experiences in the family unit. Neurosci. Biobehav. Rev. 23, 197–213. 10.1016/s0149-7634(98)00021-9. [DOI] [PubMed] [Google Scholar]
- 59.Champagne FA, and Curley JP (2005). How social experiences influence the brain. Curr. Opin. Neurobiol. 15, 704–709. 10.1016/j.conb.2005.10.001. [DOI] [PubMed] [Google Scholar]
- 60.State MW, and Levitt P (2011). The conundrums of understanding genetic risks for autism spectrum disorders. Nat. Neurosci. 14, 1499–1506. 10.1038/nn.2924. [DOI] [PMC free article] [PubMed] [Google Scholar]
- 61.Willsey HR, Willsey AJ, Wang B, and State MW (2022). Genomics, convergent neuroscience and progress in understanding autism spectrum disorder. Nat. Rev. Neurosci. 23, 323–341. 10.1038/s41583-022-00576-7. [DOI] [PMC free article] [PubMed] [Google Scholar]
- 62.Sestan N, and State MW (2018). Lost in Translation: Traversing the Complex Path from Genomics to Therapeutics in Autism Spectrum Disorder. Neuron 100, 406–423. 10.1016/j.neuron.2018.10.015. [DOI] [PMC free article] [PubMed] [Google Scholar]
- 63.de la Torre-Ubieta L, Won H, Stein JL, and Geschwind DH (2016). Advancing the understanding of autism disease mechanisms through genetics. Nat. Med. 22, 345–361. 10.1038/nm.4071. [DOI] [PMC free article] [PubMed] [Google Scholar]
- 64.Roy S, Sleiman MB, Jha P, Ingels JF, Chapman CJ, McCarty MS, Ziebarth JD, Hook M, Sun A, Zhao W, et al. (2021). Gene-by-environment modulation of lifespan and weight gain in the murine BXD family. Nat. Metab. 3, 1217–1227. 10.1038/s42255-021-00449-w. [DOI] [PMC free article] [PubMed] [Google Scholar]
- 65.Delprato A, Algéo M-P, Bonheur B, Bubier JA, Lu L, Williams RW, Chesler EJ, and Crusio WE (2017). QTL and systems genetics analysis of mouse grooming and behavioral responses to novelty in an open field. Genes Brain Behav. 16, 790–799. 10.1111/gbb.12392. [DOI] [PMC free article] [PubMed] [Google Scholar]
- 66.Dickson PE, Miller MM, Calton MA, Bubier JA, Cook MN, Goldowitz D, Chesler EJ, and Mittleman G (2016). Systems genetics of intravenous cocaine self-administration in the BXD recombinant inbred mouse panel. Psychopharmacology (Berl.) 233, 701–714. 10.1007/s00213-015-4147-z. [DOI] [PMC free article] [PubMed] [Google Scholar]
- 67.Laughlin RE, Grant TL, Williams RW, and Jentsch JD (2011). Genetic dissection of behavioral flexibility: reversal learning in mice. Biol. Psychiatry 69, 1109–1116. 10.1016/j.biopsych.2011.01.014. [DOI] [PMC free article] [PubMed] [Google Scholar]
- 68.Molenhuis RT, Bruining H, Brandt MJV, van Soldt PE, Abu-Toamih Atamni HJ, Burbach JPH, Iraqi FA, Mott RF, and Kas MJH (2018). Modeling the quantitative nature of neurodevelopmental disorders using Collaborative Cross mice. Mol. Autism 9, 63. 10.1186/s13229-018-0252-2. [DOI] [PMC free article] [PubMed] [Google Scholar]
- 69.Gu B, Shorter JR, Williams LH, Bell TA, Hock P, Dalton KA, Pan Y, Miller DR, Shaw GD, Philpot BD, et al. (2020). Collaborative Cross mice reveal extreme epilepsy phenotypes and genetic loci for seizure susceptibility. Epilepsia 61, 2010–2021. 10.1111/epi.16617. [DOI] [PMC free article] [PubMed] [Google Scholar]
- 70.Christensen DL, Braun KVN, Baio J, Bilder D, Charles J, Constantino JN, Daniels J, Durkin MS, Fitzgerald RT, Kurzius-Spencer M, et al. (2018). Prevalence and Characteristics of Autism Spectrum Disorder Among Children Aged 8 Years - Autism and Developmental Disabilities Monitoring Network, 11 Sites, United States, 2012. Morb. Mortal. Wkly. Rep. Surveill. Summ. Wash. DC 2002 65, 1–23. 10.15585/mmwr.ss6513a1. [DOI] [PMC free article] [PubMed] [Google Scholar]
- 71.Stessman HAF, Xiong B, Coe BP, Wang T, Hoekzema K, Fenckova M, Kvarnung M, Gerdts J, Trinh S, Cosemans N, et al. (2017). Targeted sequencing identifies 91 neurodevelopmental-disorder risk genes with autism and developmental-disability biases. Nat. Genet. 49, 515–526. 10.1038/ng.3792. [DOI] [PMC free article] [PubMed] [Google Scholar]
- 72.Sung MK, Bang H, and Choi JK (2014). Understanding Epistatic Interactions between Genes Targeted by Non-coding Regulatory Elements in Complex Diseases. Genomics Inform. 12, 181–186. 10.5808/GI.2014.12.4.181. [DOI] [PMC free article] [PubMed] [Google Scholar]
- 73.Jones SA, Cantsilieris S, Fan H, Cheng Q, Russ BE, Tucker EJ, Harris J, Rudloff I, Nold M, Northcott M, et al. (2019). Rare variants in non-coding regulatory regions of the genome that affect gene expression in systemic lupus erythematosus. Sci. Rep. 9, 15433. 10.1038/s41598-019-51864-9. [DOI] [PMC free article] [PubMed] [Google Scholar]
- 74.Wilkinson B, Grepo N, Thompson BL, Kim J, Wang K, Evgrafov OV, Lu W, Knowles JA, and Campbell DB (2015). The autism-associated gene chromodomain helicase DNA-binding protein 8 (CHD8) regulates noncoding RNAs and autism-related genes. Transl. Psychiatry 5, e568. 10.1038/tp.2015.62. [DOI] [PMC free article] [PubMed] [Google Scholar]
Associated Data
This section collects any data citations, data availability statements, or supplementary materials included in this article.
Supplementary Materials
Table S1. Chd8+/− population effect descriptives and statistics for all traits. Descriptive statistics and statistical results for comparisons of trait disruptions in the combined strain population by WT and Chd8+/− groups and by sex. Related to Figure 2.
Table S2. Chd8+/− strain effect descriptives and statistics. Descriptive statistics and statistical results for comparisons of trait disruptions between WT and Chd8+/− groups within each strain and sex. Related to Figure 6.
Data Availability Statement
Statistical results for data analyses of traits by genotype, sex, and strain are listed in the supplemental data tables in this manuscript. Raw trait data for each subject have been deposited onto Mendeley at https://doi.org/DOI:10.17632/cgkghx79my.1
This paper does not report original code.
Any additional information required to reanalyze the data reported in this paper is available from the lead contact upon request.