

Abstract
Autism spectrum disorders (ASDs) are developmental in origin; however, little is known about how they affect the early development of behavior and sensory coding. The most common inherited form of autism is Fragile X syndrome (FXS), caused by a mutation in FMR1. Mutation of fmr1 in zebrafish causes anxiety-like behavior, hyperactivity, and hypersensitivity in auditory and visual processing. Here, we show that zebrafish fmr1−/− mutant larvae of either sex also display changes in hunting behavior, tectal coding, and social interaction. During hunting, they were less successful at catching prey and displayed altered behavioral sequences. In the tectum, representations of prey-like stimuli were more diffuse and had higher dimensionality. In a social behavioral assay, they spent more time observing a conspecific but responded more slowly to social cues. However, when given a choice of rearing environment fmr1−/− larvae preferred one with reduced visual stimulation, and rearing them in this environment reduced genotype-specific effects on tectal excitability. Together, these results shed new light on how fmr1−/− changes the early development of neural systems and behavior in a vertebrate.
SIGNIFICANCE STATEMENT Autism spectrum disorders (ASDs) are caused by changes in early neural development. Animal models of ASDs offer the opportunity to study these developmental processes in greater detail than in humans. Here, we found that a zebrafish mutant for a gene which in humans causes one type of ASD showed early alterations in hunting behavior, social behavior, and how visual stimuli are represented in the brain. However, we also found that mutant fish preferred reduced visual stimulation, and rearing them in this environment reduced alterations in neural activity patterns. These results suggest interesting new directions for using zebrafish as a model to study the development of brain and behavior in ASDs, and how the impact of ASDs could potentially be reduced.
Keywords: behavior, environmental enrichment, neural assemblies, optic tectum
Introduction
Autism spectrum disorders (ASDs) are neurodevelopmental in origin. Increasing evidence suggests that a key way in which ASDs alter behavior and cognition is via altering the development of sensory processing (Robertson and Baron-Cohen, 2017). While ASDs can be identified in humans as early as six months of age (Estes et al., 2015), little is known about how the early development of sensory neural processing is altered in ASDs.
The most common single-gene cause of autism is Fragile X syndrome (FXS). This syndrome is caused by a trinucleotide repeat expansion in the Fragile X mental retardation 1 (FMR1) gene, which leads to a lack of its product Fragile X mental retardation protein (FMRP). FMRP is highly expressed in neurons in the brain and regulates many aspects of brain development (O'Donnell and Warren, 2002; Bassell and Warren, 2008; Contractor et al., 2015; Razak et al., 2020). Characteristics of the human FXS phenotype include hyperactivity, attention deficits, and sensory deficits (Hunter et al., 2014; Hagerman et al., 2017; Robertson and Baron-Cohen, 2017). Changes in sensory processing are common in ASDs (Kogan et al., 2004; Scerif et al., 2004; Baranek et al., 2008; Farzin et al., 2008, 2011; Simmons et al., 2009; Marco et al., 2011; Robertson and Baron-Cohen, 2017). ASD individuals often display impaired adaptation to chronic sensory stimulation (Kleinhans et al., 2009; Puts et al., 2014; Ethridge et al., 2016). Fmr1−/− mice have circuit defects in the cortex (Gonçalves et al., 2013; Zhang et al., 2014), larger networks of neurons that respond to sensory stimuli (Arnett et al., 2014), and stronger motor responses and impaired adaptation to whisker stimulation (He et al., 2017). Overall, however, the effects of FMR1 mutation on the development of visually-driven behaviors and associated neural coding remain unknown.
Zebrafish larvae present an attractive model system to address these questions since they are a vertebrate that develop rapidly, and by 5 d postfertilization (dpf) are already able to hunt fast-moving prey using only visual cues (Bianco et al., 2011; Muto and Kawakami, 2013; Bianco and Engert, 2015; Avitan et al., 2020). Social behavior also begins to develop around 15 dpf and is again largely dependent on visual cues (Larsch and Baier, 2018). Zebrafish have a strong genetic and physiological homology to mammals, and they have analogous social and cognitive behavioral processes to those seen in rodents and humans (Stewart et al., 2014). Since early zebrafish hunting and social behavior are visually driven and the complexity of visual stimulation can be easily manipulated, zebrafish provide a new opportunity to address the role of sensory experience in modulating the fmr1−/− phenotype. Previous work has shown that fmr1 mutant (fmr1−/−) zebrafish exhibit behavioral and sensory changes analogous to FXS in humans, including hyperactivity, hyperexcitability, and signs of anxiety (Kim et al., 2014; Constantin et al., 2020; Marquez-Legorreta et al., 2022). Here, we examined the effects of fmr1 mutation on visually driven behaviors and neural activity in larvae. We reveal that fmr1−/− larvae at 9 dpf show deficits in hunting, altered movement sequences, altered tectal coding including increased excitability, and changes in social behavior. However, fmr1−/− fish prefer an environment with reduced sensory stimulation, and rearing fish in such an environment produces genotype-specific effects on tectal excitability.
Materials and Methods
Zebrafish
All procedures were performed with the approval of The University of Queensland Animal Ethics Committee. Fish with the fmr1hu2787 mutation were originally generated by the Ketting laboratory (den Broeder et al., 2009), and obtained for this study from the Sirotkin laboratory (State University of New York). We first in-crossed the mutant line to generate nacre fmr1hu2787 mutants. For calcium imaging and hunting assay experiments, these nacre fmr1hu2787 mutants were crossed with nacre zebrafish expressing the transgene HuC:H2B-GCaMP6s to give pan-neuronal expression of nuclear-localized GCaMP6s calcium indicator. For hunting behavior assays, fmr1+/− fish were then crossed with fmr1−/− fish (with no consistent relationship between the genotype and the sex of the parent) to produce fmr1+/− and fmr1−/− offspring with equal probability. fmr1+/+ fish were crossed with fmr1+/+ fish to generate wild-type (WT) fish with the same genetic background. This crossing strategy was chosen to increase the throughput as compared with the uneven distribution of genotypes that would be obtained from fmr1+/− × fmr1+/− crosses (note that for crosses of different genotypes, the genotype can only be determined after the experiment because of the small size of the larvae). For neural imaging experiments, larvae were drawn from the same fmr1+/− × fmr1−/− clutches used for the hunting assays. For social behavior assays we compared fmr1−/− larvae generated from fmr1−/− × fmr1−/− crosses with WT larvae generated from fmr1+/+ × fmr1+/+ crosses. All results shown include fish from multiple clutches, so that clutch-to-clutch variability contributes noise rather than systematic bias. The sex of the animals was unknown as sex differentiation occurs after the developmental stages used in the current study.
Fish embryos were raised in E3 medium (5 mm NaCl, 0.17 mm KCl, 0.33 mm CaCl2, 0.33 mm MgCl2) at 28.5°C on a 14/10 h light/dark cycle. For the data in Figures 1–5, fish were kept in small groups in 100-mm Petri dishes. For fish raised in a naturalistic sensory environment, Petri dishes were placed on top of gravel of average size 15 mm (Sainsbury et al., 2018). For fish raised in reduced sensory stimulation environment, the Petri dishes were placed on plain stainless steel wire shelves. All fish were placed into their designated sensory environment within 24 h after fertilization. As a robust way of handling clutch-to-clutch variability for the results shown in Figures 1–5, only one fish from each clutch at each age was assayed. Thus, clutch-to-clutch variability contributed random noise to the data, but no systematic effect.
Figure 1.

fmr1−/− fish show craniofacial abnormalities. a, Schematic of the Alcian blue-stained cartilages and the landmarks selected for analysis. b, Example images of Alcian blue staining of fish at 5, 9, and 14 dpf. Red lines indicate the Meckel's cartilage angle (MCA) in one example. fmr1−/− examples are from individuals with the largest MCA; fmr1+/− examples are from individuals closest to the mean MCA. c, CVA analysis revealed significant association between morphologic traits and the age and genotype of the fish. CV1 reflects correlation with age (p = 10−15; magnitude of canonical coefficients and ; see Materials and Methods). CV2 reflects correlation with genotype (p = 10−4; and ). d, The magnitude of the weights of CV2 for pairwise distances between the landmarks on the ventral view. e, The MCA (between points 7, 8, and 9) was less acute in fmr1−/− fish (two-way ANOVA, #p represents effect of genotype, post hoc analysis reveals significant differences at all ages).
Figure 5.
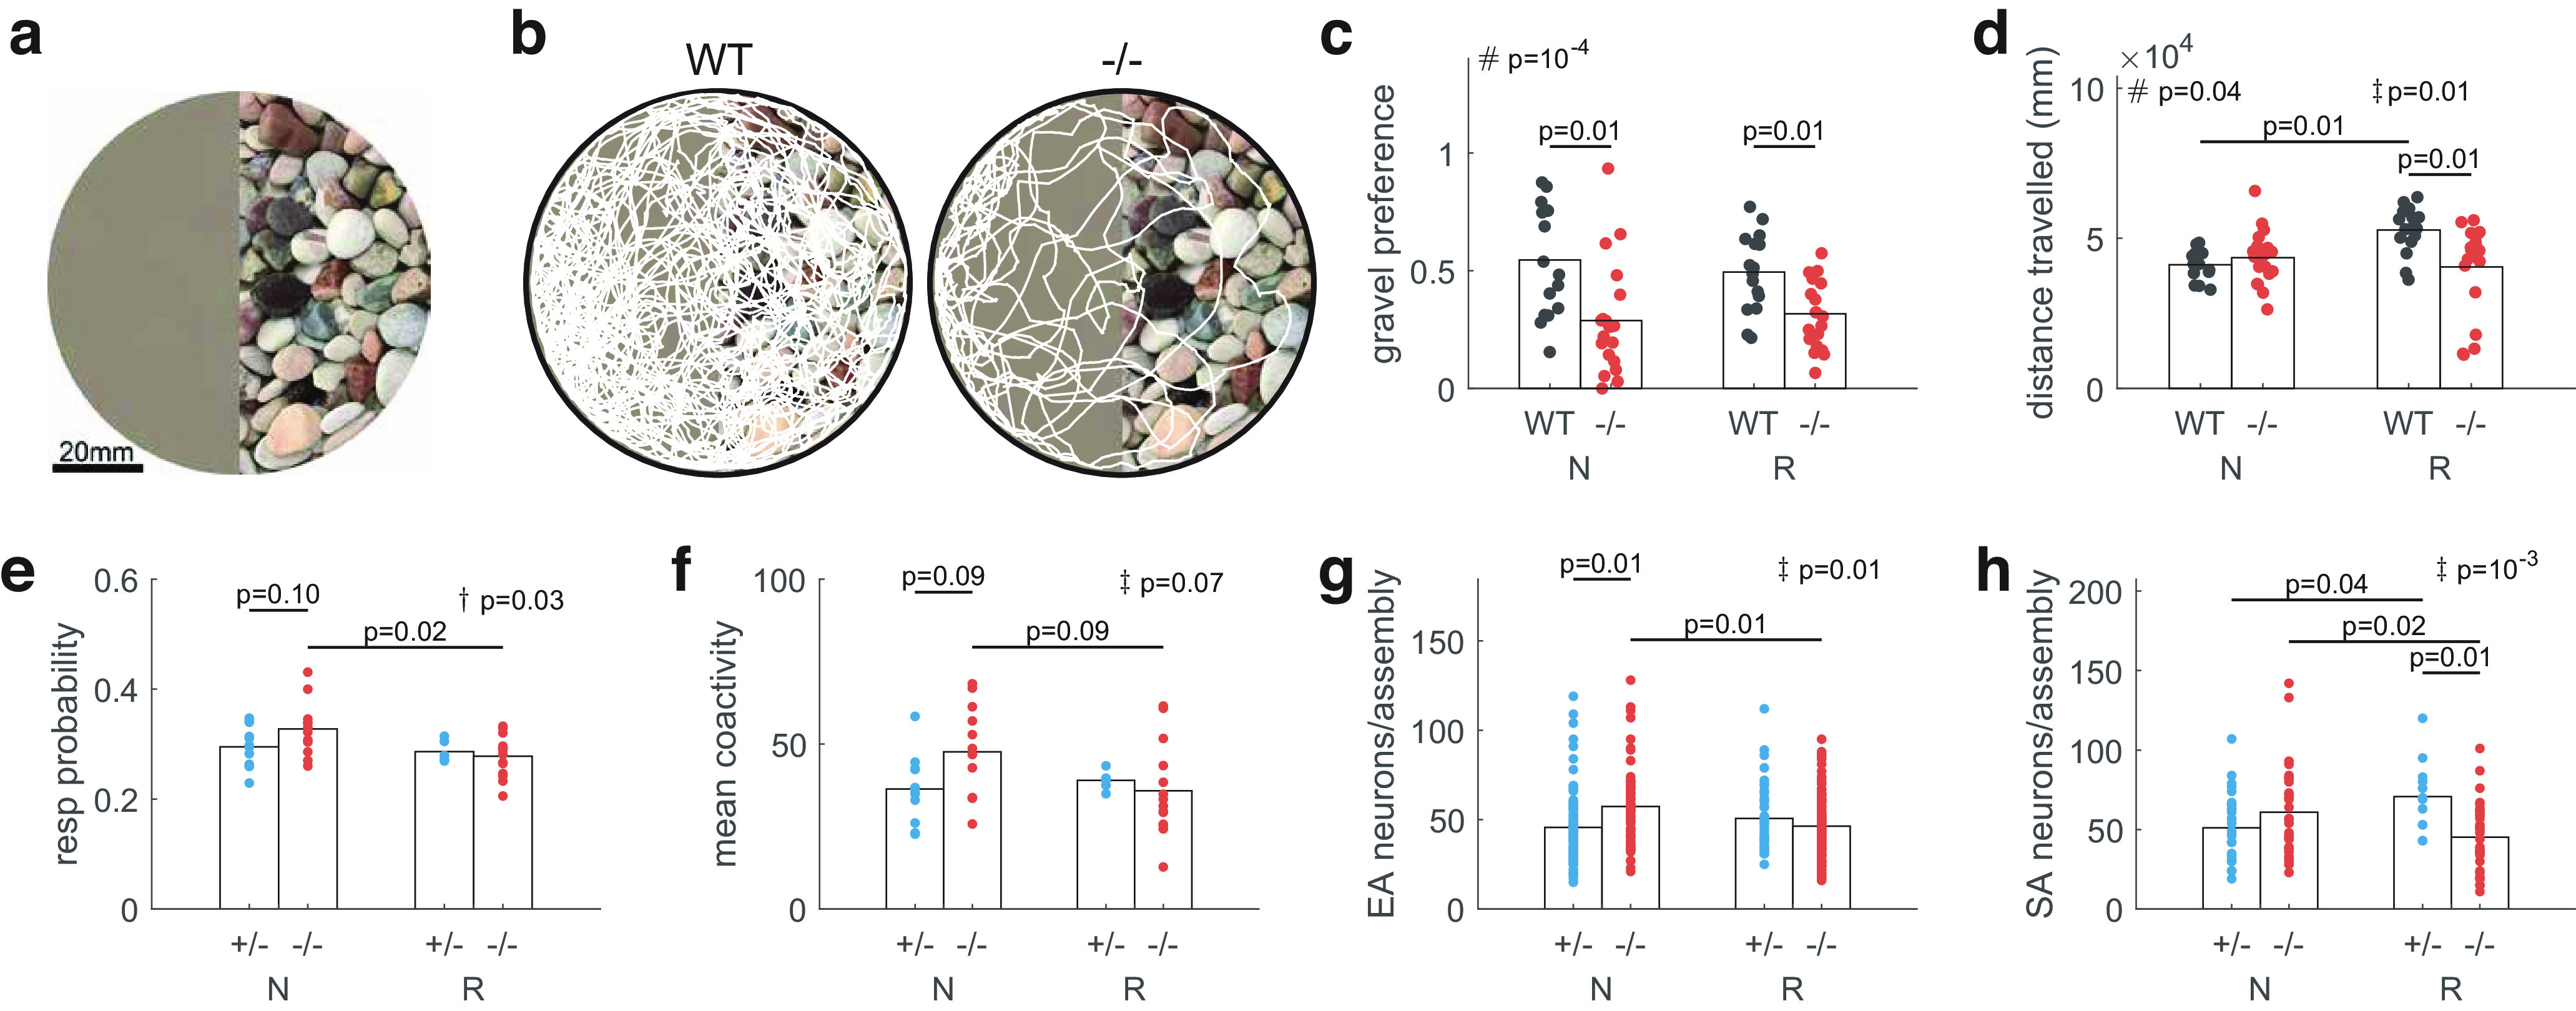
fmr1−/− fish show preference for reduced sensory stimulation and rearing in this environment reduces hyperexcitability. a, The image placed underneath the dish in which the fish were swimming. The featureless side (left) of the image was produced by scrambling and smoothing the gravel image (right) to ensure average brightness and color were matched (see Materials and Methods). b, Example trajectory maps of the position of four 9-dpf fish in a dish over 20 min. c, WT fish had no preference between the featureless and gravel environments, but fmr1−/− fish preferred the featureless environment. Rearing condition did not affect the gravel preference of either genotype. N: fish reared under naturalistic conditions (gravel); R: fish reared under reduced stimulation (no gravel) conditions. d, Total distance traveled was greater for WT(R) than WT(N) and fmr1−/−(R) fish. e, fmr1−/− fish showed a reduction in neural response probability in the R environment compared with the N environment. f, fmr1−/− fish showed a trend toward lower coactivity levels during EA in the R environment compared with the N environment. g, h, fmr1−/− fish had fewer neurons per assembly for both EA (g) and SA (h) in the R environment compared with the N environment. All statistical results shown are two-way ANOVA where # represents genotype effects, † represents rearing condition effects, and ‡ represents interaction effects, followed by post hoc pairwise tests.
For the social assay experiments (Fig. 6), fish embryos (either WT or fmr1−/−) were raised in standard zebrafish housing in The University of Queensland aquatic facility until the day before the experiment. Larvae were obtained from 1-l tanks where several males and females were placed together, fed with live rotifers, and used at random without attempting to identify which clutch they came from. The day before imaging ∼30 larvae were transported to the lab and kept in a 28.5°C incubator until the imaging session. All test fish were paired with size-matched and age-matched WT fish. This process was repeated five times for each condition and the data combined.
Figure 6.
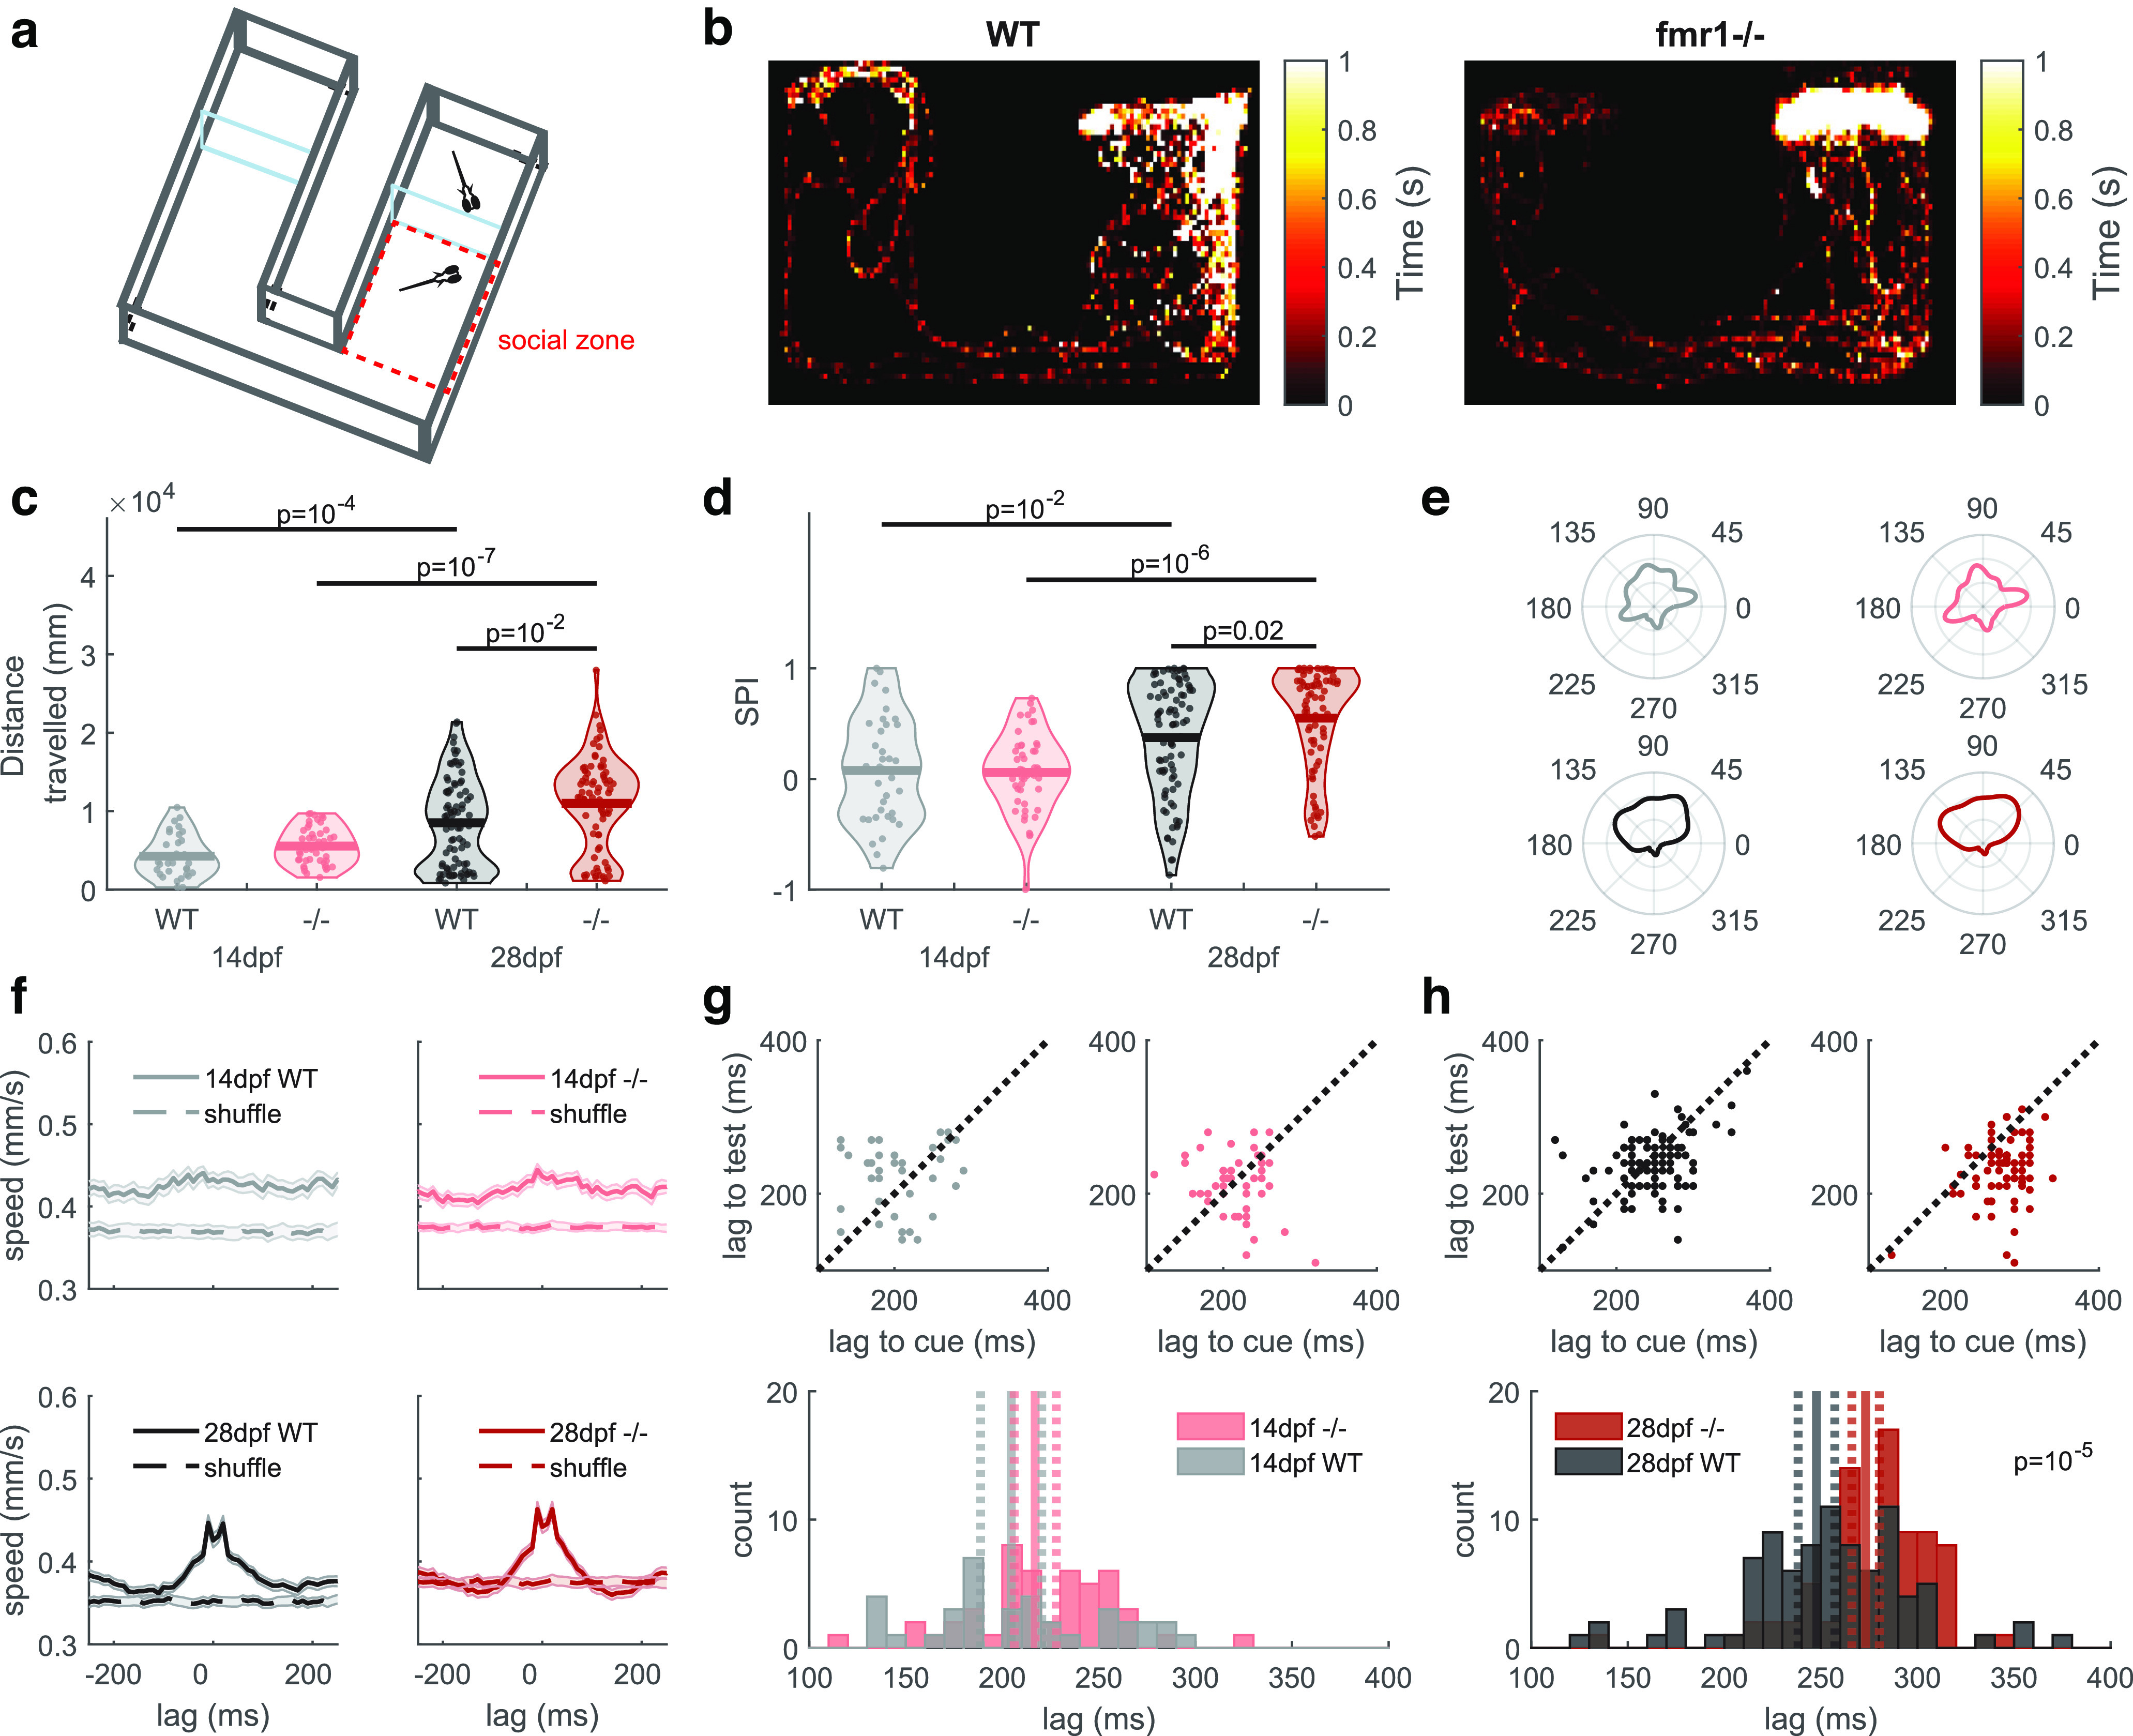
fmr1−/− fish display altered social behavior. a, Schematic of the chamber used for the social assay. b, Example heat maps of the position of a 28 dpf test fish over 30 min [SPI: 0.75 (WT), 0.84 (fmr1−/−)]. c, Total distance traveled was greater for fmr1−/− than WT fish at 28 dpf. d, At 28 dpf, social preference index (SPI) was higher for fmr1−/− fish. For c, d, statistical results shown are from relevant post hoc pairwise tests after two-way ANOVA. e, Average distribution of heading angles of the test fish. Heading angles between 0° and 180° indicate that the test fish was facing upwards, toward the cue fish. f, Average bout-triggered average motion signal for 200 ms each side of movement peaks of the cue fish confirmed coordinated movements triggered in the test fish at 28 but not 14 dpf (shading indicates s.e.m.). g, h, Average movement lag was longer for fmr1−/− fish at 28 dpf but not 14 dpf. In lag time distribution plots, solid lines represent the mean and dashed lines indicate the 95% confidence interval. For h, the p value shows the result from a rank sum test as data were not normally distributed.
Alcian blue staining
Zebrafish larvae were anaesthetised with ethyl-3-aminobenzoate (Sigma-Aldrich), fixed overnight in 4% PFA/PBS and then washed three times for 10 min in PBS. After bleaching in 3% H2O2/0.5% KOH for 1 h, larvae were rinsed in 70% ethanol and then stained for 45 min using fresh, filtered, Alcian blue stain (0.1% Alcian blue, 1% HCl, 70% ethanol and 120 mm MgCl2). Larvae were washed through 70%, 50%, and 25% ethanol (all containing 10 mm MgCl2) followed by overnight rinse in 25% and 50% glycerol (all with 0.1% KOH). Larvae were mounted in 100% glycerol and photographed with a Zeiss StereoDiscovery V8 microscope and HRc camera using Zen software.
We selected six landmarks on the ventral view of the fish and three landmarks on the lateral view. In the ventral view, point 1 was defined by the anterior point of Meckel's cartilage, points 2 and 3 as the posterior most points of the left and right component of Meckel's cartilage, point 4 as the junction of the left and right components of the ceratohyal cartilage, and points 5 and 6 as the posterior most points of the left and right components of the ceratohyal cartilage. To compare the overall morphologic differences between the two genotype, we calculated the pairwise distances between the ventral view landmarks and applied canonical variate analysis (CVA) using MATLAB's built-in function canoncorr. For this computation the genotype variable was represented as binary number, either 0 or 1. The age was rescaled to the range [0,1] so that the canonical coefficients for age and genotype had matching scales and could therefore be directly compared. In lateral views, point 7 was the anterior end of Meckel's cartilage, point 8 the junction of Meckel's cartilage and the palatoquadrate, and points 8 and 9 define the lateral axis of the palatoquadrate. Meckel's cartilage angle (MCA) was measured as the angle between 7–8 and 8–9.
Hunting behavior assay
Individual fish were placed into a feeding chamber (CoverWell Imaging Chambers, catalog #635031, Grace Biolabs) filled with E3 medium and 30–35 paramecia (Paramecium caudatum). The chamber was placed onto a custom-made imaging stage consisting of a clear-bottom heating plate at 29.5°C, an infrared LED ring (850 nm, 365 LDR2-100IR2-850-LA powered by PD3-3024-3-PI, Creating Customer Satisfaction; CCS Inc.) below, and a white LED ring (LDR2-100SW2-LA, CCS) above. Images were recorded using a CMOS camera (Mikrotron 4CXP, Mikrotron) with a 50-mm lens (Edmund) or a 100-mm lens (Nikon) at 500 fps using StreamPix (NorPix). Fish used in Figure 2k,l were recorded using the 100-mm lens with higher resolution and were therefore used for bout analysis in Figure 3. Recording of hunting behavior started after the first attempt for feeding was made by the fish, and each fish was then recorded for 15 min.
Figure 2.
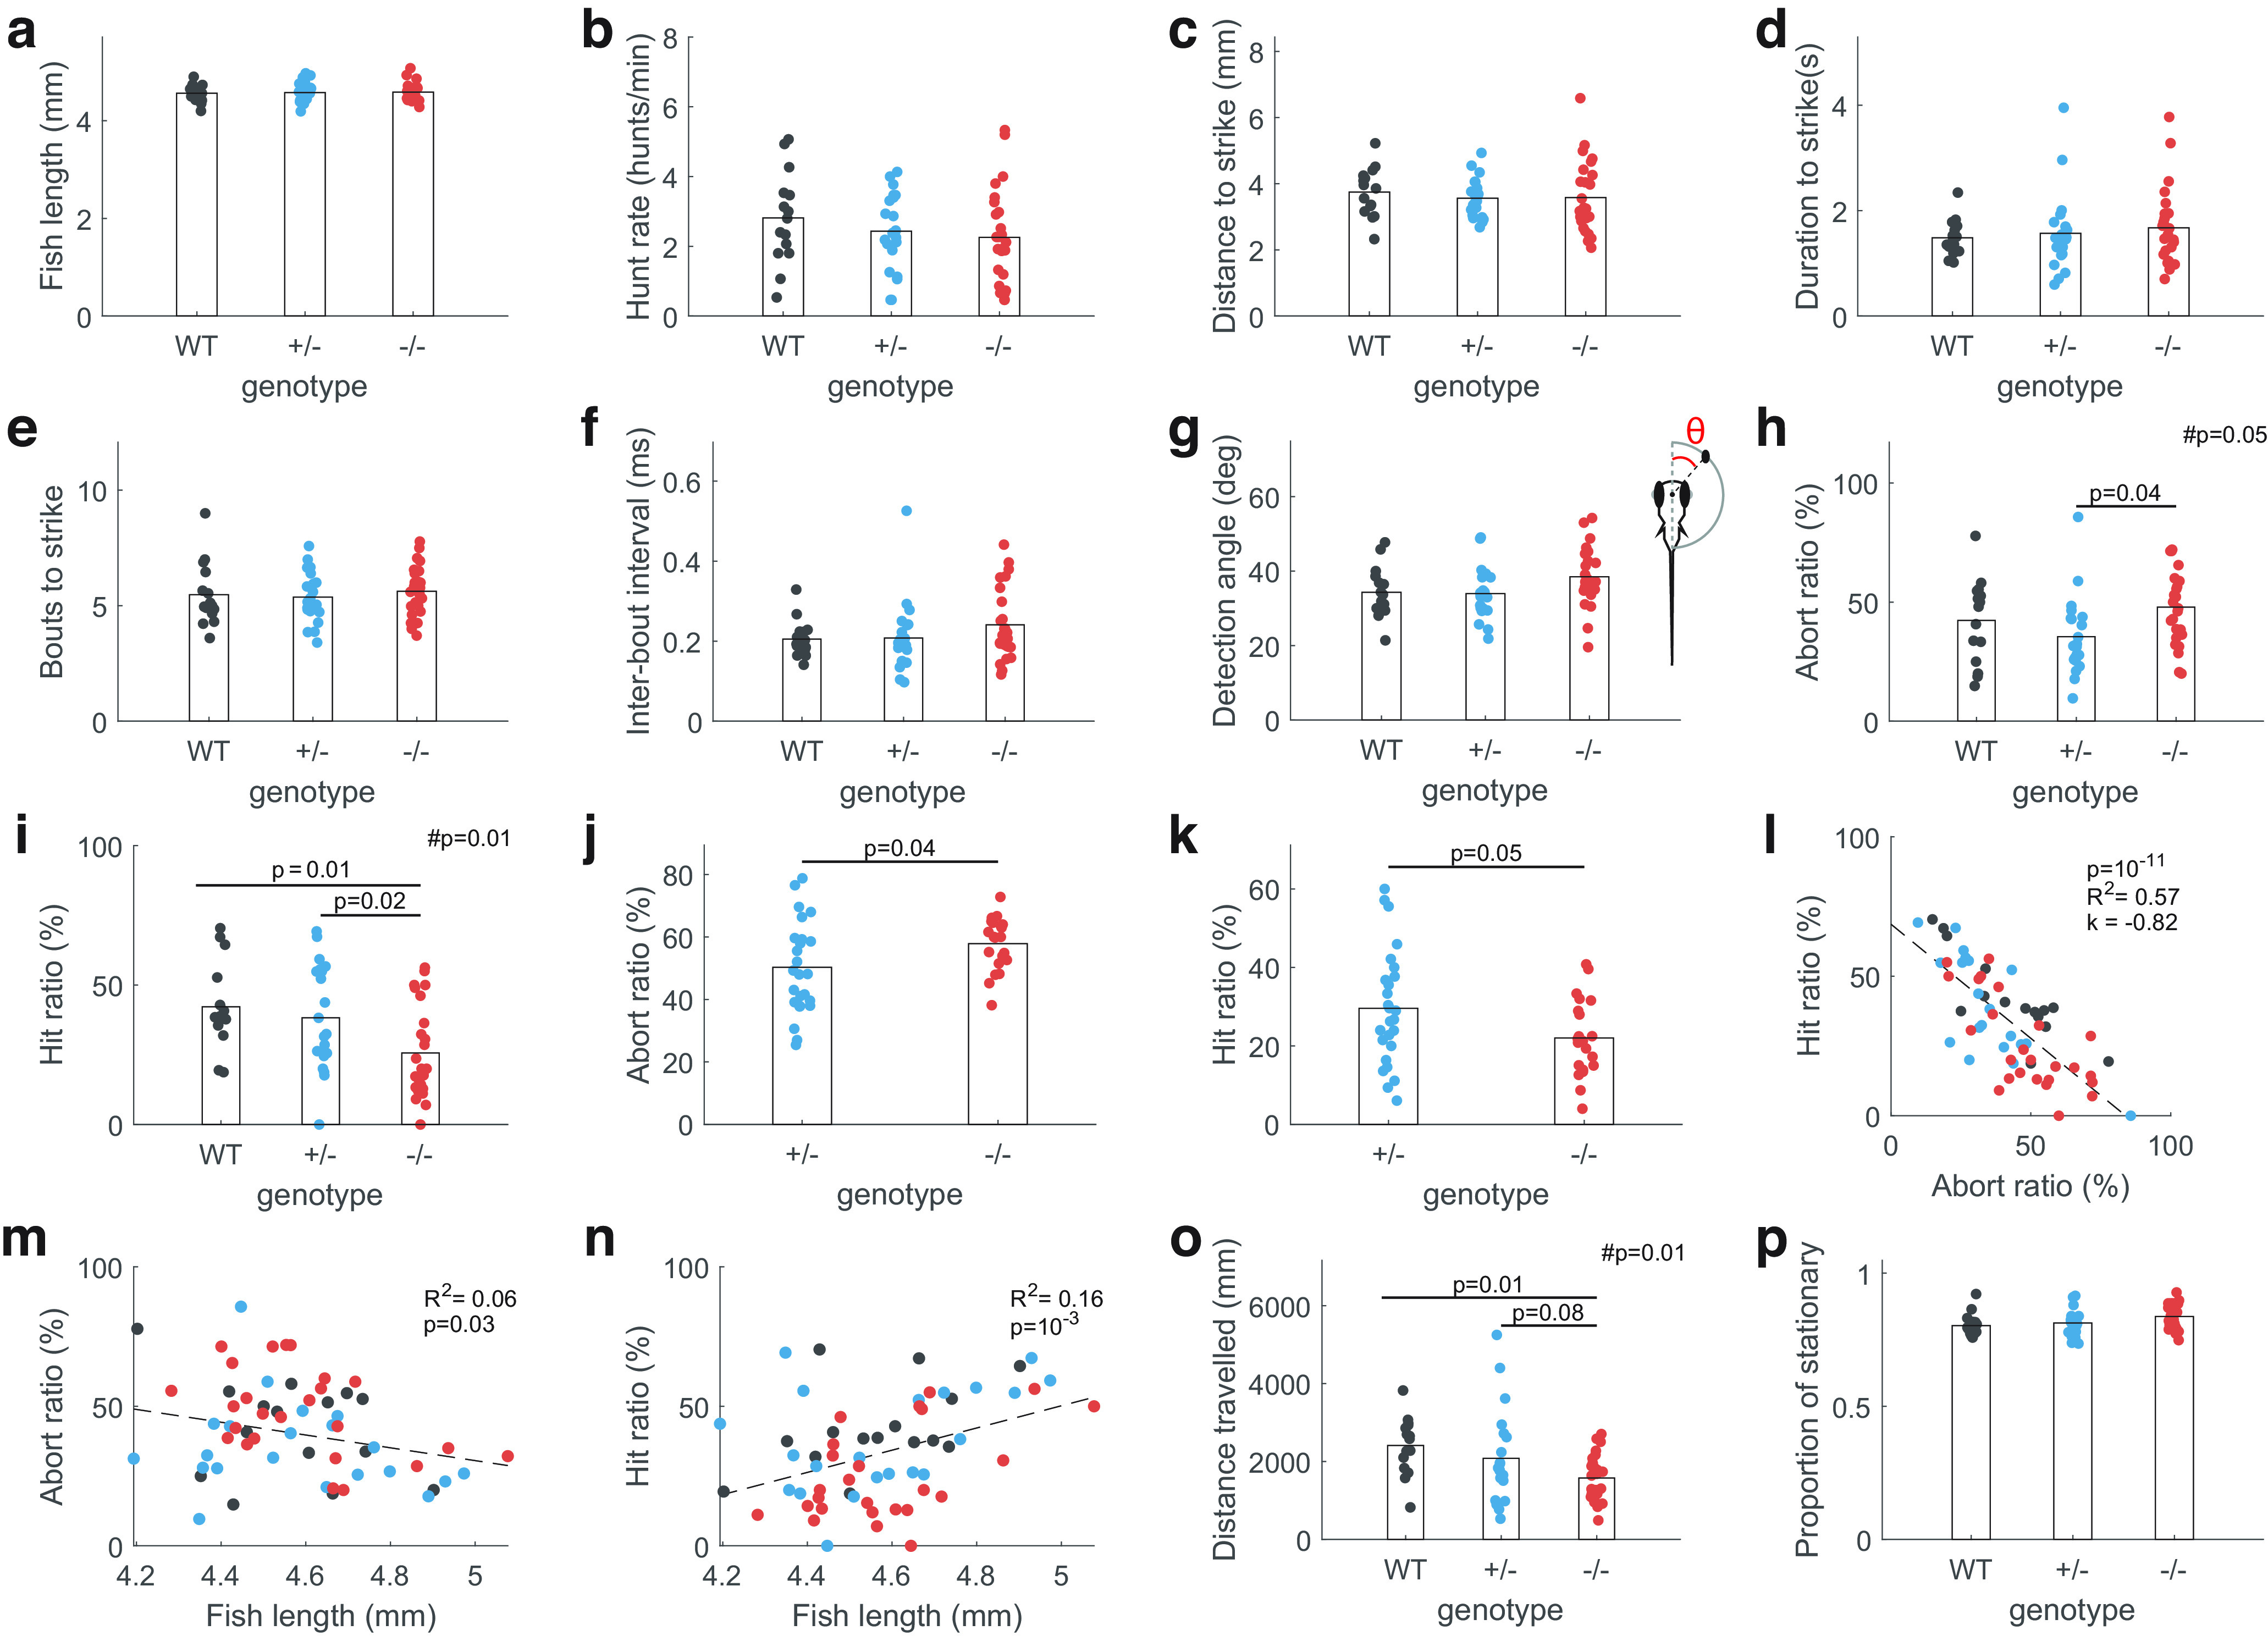
fmr1−/− fish show reduced hunting success. a–f, Fish length, hunt rate, distance to strike, duration to strike, bouts to strike, and interbout interval were all similar between genotypes. g, Detection angle, defined as the angle between the midline of the fish and the location of the paramecium before eye convergence (shown in the insert), was not significantly different between genotypes. h, i, fmr1−/− fish had a higher abort ratio and a lower hit ratio (one-way ANOVA followed by post hoc tests, #p represents effects of genotype). j, k, Similar results were obtained with a separate cohort of fish. l, Fish with high abort ratio had low hit ratio, indicating a relationship between hunting success and the ability to sustain hunting behavior. m, n, Abort rate decreased with length while hit rate increased with length. However, in both cases length only explains a small amount of variance. o, fmr1−/− fish had smaller distance traveled across the entire feeding assay. p, The proportion of time spent stationary was not different between genotypes during exploration within the hunting assay.
Figure 3.
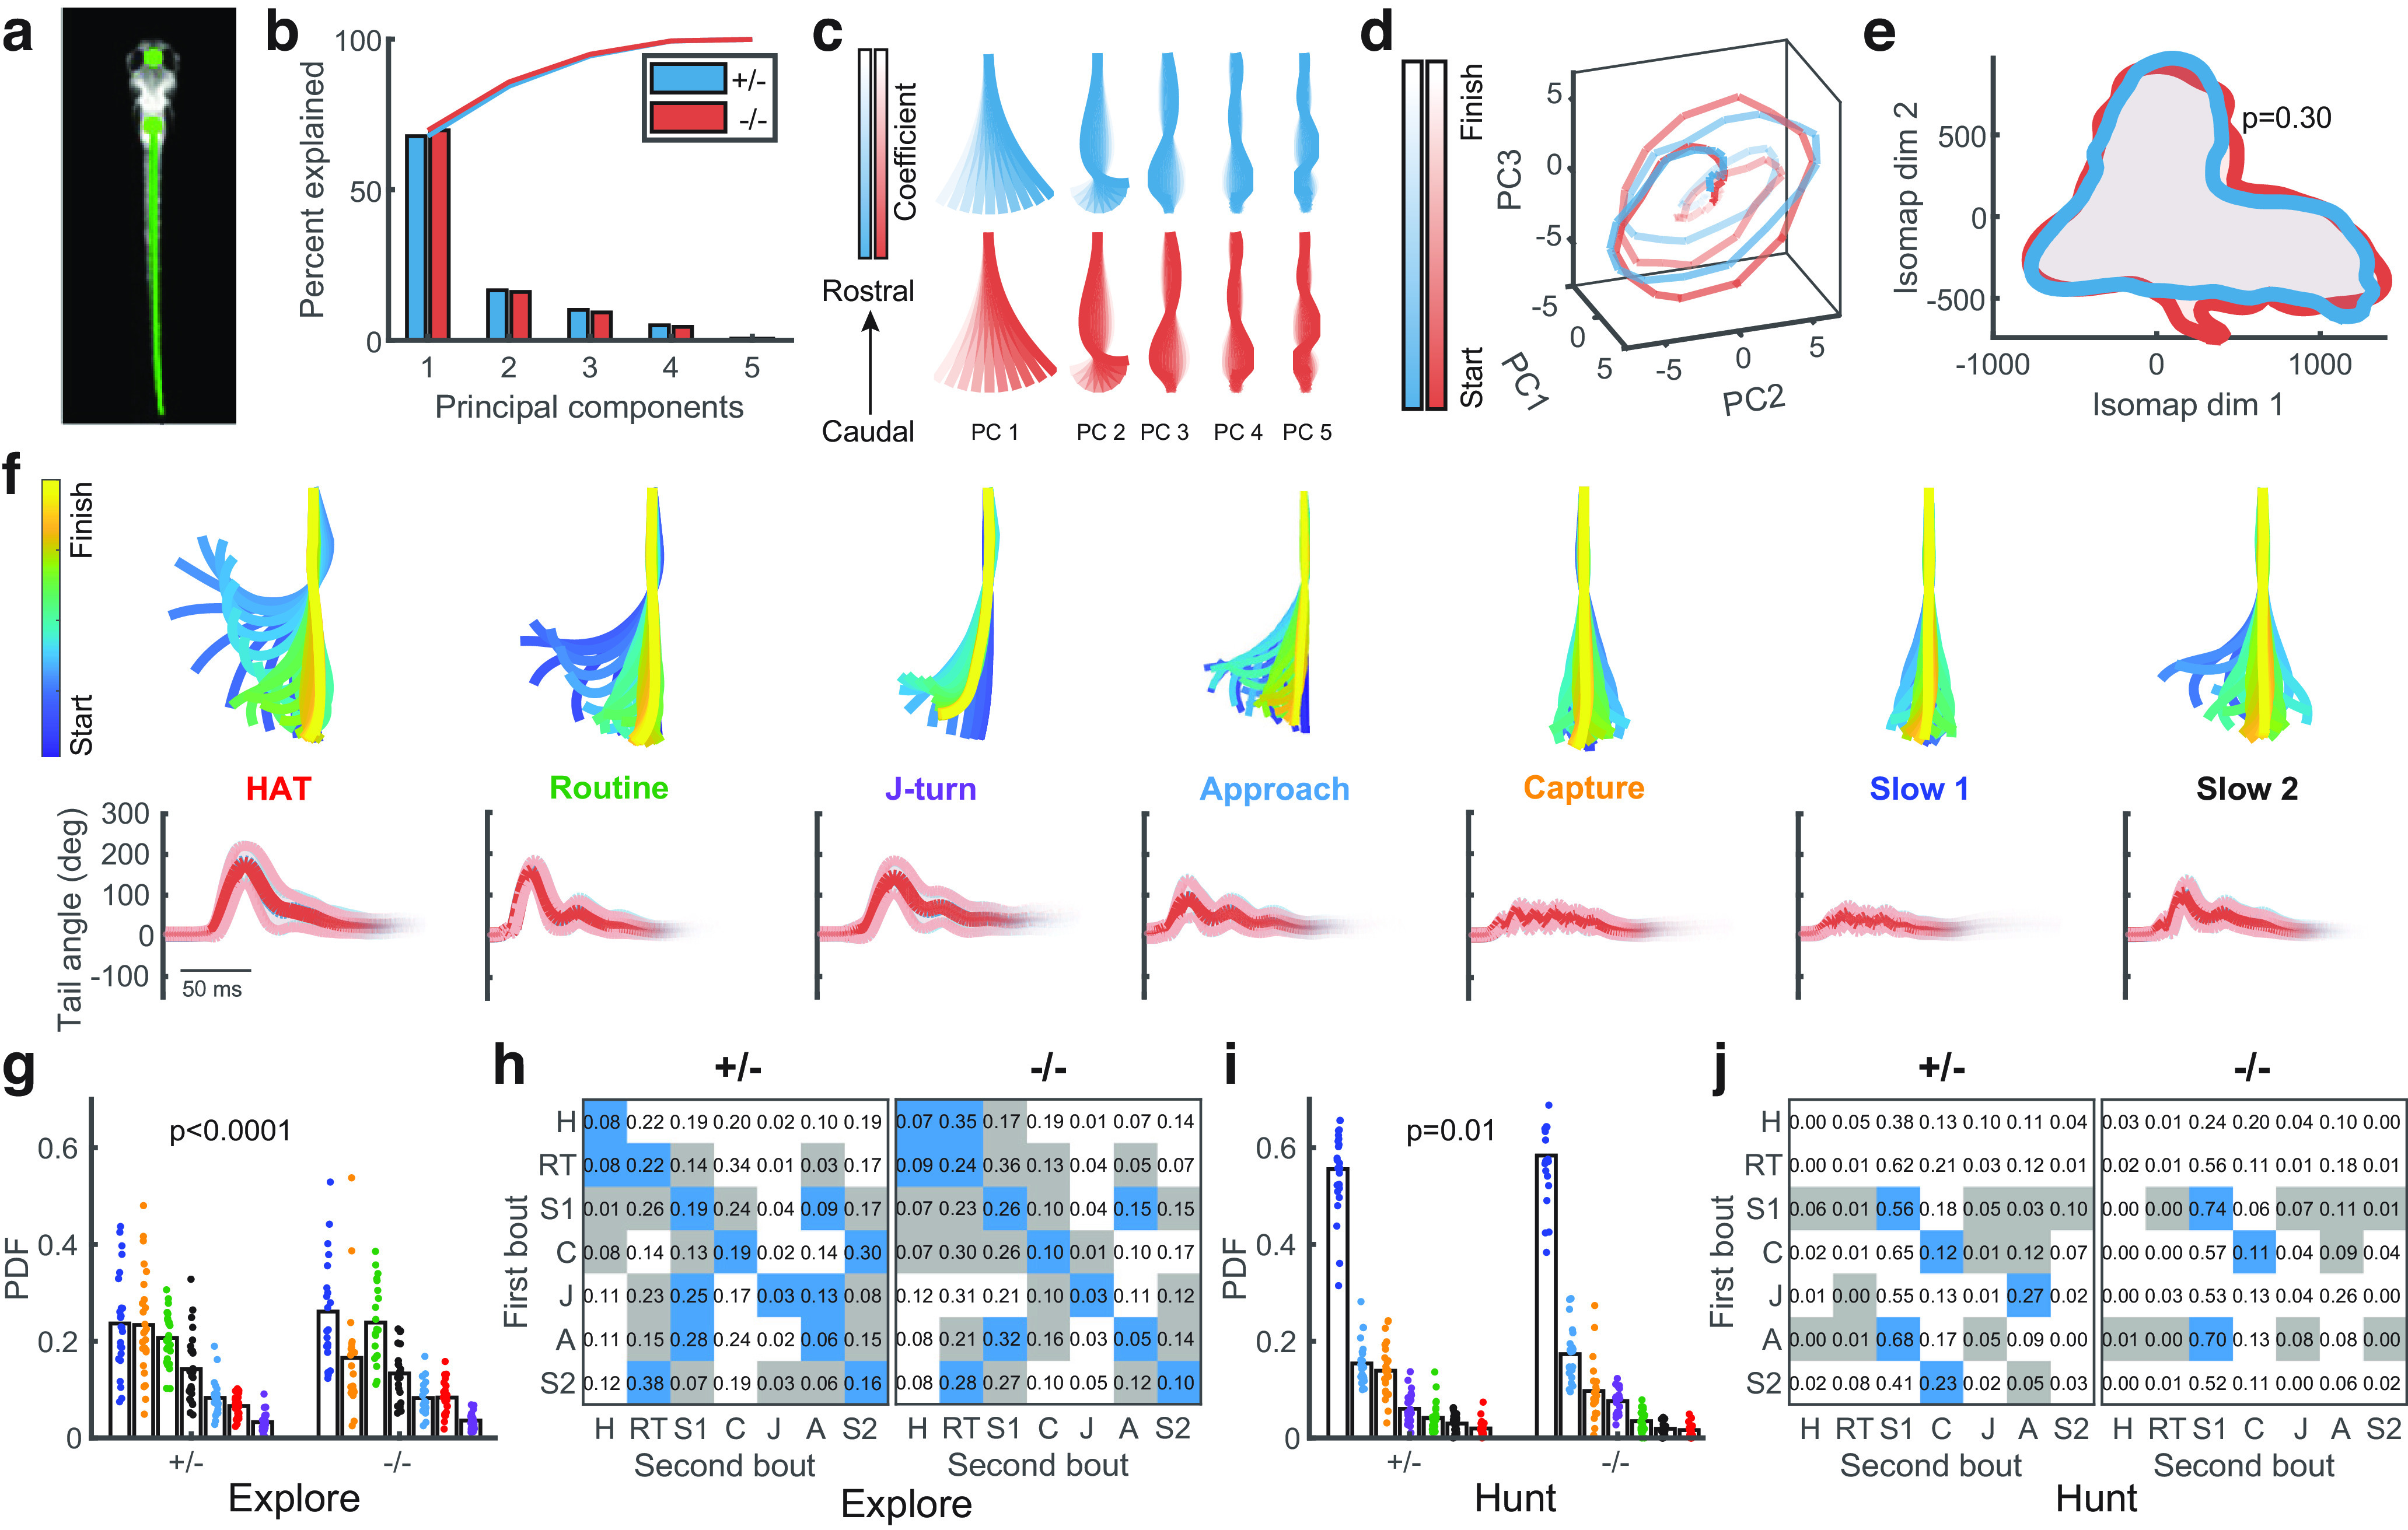
Bout analysis reveals higher-order differences in behavior between genotypes. a, Automated tracking identified the midpoint between the eyes and the swim bladder (large green circles), and 101 points along the tail (small green circles). b, The cumulative variance explained by the first five principal components of tail shape was similar between genotypes. c, The first five principal components were similar between genotypes. d, Example trajectories for each genotype of a Slow1 bout in the space of the first three principal components. e, The outer kernel density estimate contours for the Isomap embedding of each genotype were similar. p value indicates significance of differences in the full 2-D distributions assessed using the Peacock test. f, Top row, Example bouts of each type (lines drawn every 2 ms). Bottom row, Mean angle of last 10 points of tail traces of the identified bout types for each genotype. Thick red and blue lines indicate averages across genotypes (blue lines generally not visible since they are coincident with red lines), thin lines show 1 SD. g, Bout-type selection probabilities during exploration were different between genotypes (discrete two-sample Kolmogorov–Smirnov test; each dot represents one fish). h, Bout-type transition probability matrices averaged over fish during exploration for each genotype. Blue squares represent transition probabilities significantly higher than shuffled data, gray squares represent transition probabilities significantly lower than shuffled data (p < 0.025, shuffle test with Bonferroni correction). The number of significant transitions was greater for −/− fish compared with +/− fish (p = 10–3, shuffle test). i, Bout-type selection probabilities during hunting were different between genotypes. j, The number of significant transitions in the bout transition matrix was less for −/− fish compared with +/− fish (p = 10–4, shuffle test). For h, j, H: HAT, high angle turn; RT: routine turn; S1: slow1; C: capture; J: J-turn; A: approach; S2: slow2.
Analysis of feeding events
The times at which hunting events began in the recordings were identified based on eye convergence (Bianco et al., 2011; Avitan et al., 2020). Events were then manually classified based on whether the fish aborted pursuit of the target paramecium (abort event, score 0), pursued but failed to capture the target (miss event, score 1), or the fish successfully captured the target (hit event, score 2 for capture but then eject, three for fully capture). Event end was determined by eye deconvergence for abort events, and for other events by the end of the strike bout. The target paramecium was defined as the nearest paramecium toward which the first tuning bout was made.
Automated tracking of the fish and paramecia was performed using custom image processing software in MATLAB as detailed by Avitan et al. (2020) with minor modifications. In brief, frames were first preprocessed to remove the static background using a Gaussian background model. The approximate location of the fish was identified by connected components analysis on the resulting foreground mask. The position and orientation of the fish were calculated by tracking the midpoint between the eyes and the center of the swim bladder. This was achieved using a set of correlation filters (Bolme et al., 2010) on pixel values and histogram of oriented gradients features (Felzenszwalb et al., 2010). Filters were rotated through 0°, 5°, 10°,…, 360° and scaled through 60%, 65%, 70%,…, 100% with respect to maximum fish length to accommodate for changes in heading angle and pitch, respectively. Filters were trained by manual annotation of the two tracking points in ten randomly selected frames for each fish.
Detection of paramecia was performed using connected components analysis to extract the location of prey-like blobs in each frame from the foreground mask. Multiobject tracking of paramecia between frames was achieved using Kalman filtering and track assignment, which enabled tracking through collisions and short periods of occlusion. Bout timings and tail kinematics were calculated by first performing morphologic thinning and third-order Savitsky–Golay smoothing to extract 101 evenly spaced points along the midline of the tail. Individual bouts were segmented by applying a manually-selected threshold to the amplitude envelope of the mean angular velocity of the most caudal 20% of tail points. Before applying the threshold, the angular velocity time series was smoothed using a low-pass filter. The amplitude envelope was estimated using a Hilbert transformation.
From the manual annotations and tracking results, we extracted measures to characterize the hunting efficiency. Abort ratio was calculated as the percentage of aborted events. Hit ratio was calculated as the percentage of events for which the fish successfully captured the prey in its mouth. Interbout interval was calculated as the average time between the initiation of feeding related bouts. Detection angle was determined as the angle between the vector defined by the eye midpoint to the target paramecium and the heading angle of the fish.
Analysis of bout types and transitions
To generate the behavioral space, we first excluded any detected bouts and/or hunting sequences where the fish came within 0.25 mm of the dish boundary. To exclude tail-tracking artefacts we removed bouts with displacement <0.1 mm, bouts for which the tail length was greater or <2 SDs from the mean during >35% of the bout, and bouts where angular differences larger than 30° between eye and swim bladder comprised >5% of the bout. Remaining bouts containing smaller tail-length or heading-angle artefacts were smoothed via linear interpolation. If an excluded bout occurred during a hunting event the entire hunting event was excluded. In total 31,454 bouts were removed by these filters, leaving n = 67,206 bouts in total (n = 39,862 for fmr1+/− fish, and n = 27,344 for fmr1−/− fish).
The behavioral-space analysis pipeline was adapted from Mearns et al. (2020). To transform bouts into postural dynamics, principal component analysis (PCA) was performed on tail curvatures from the swim-bladder to the tail-tip. Data were normalized by subtracting the mean tail curvature and dividing by the SD. PCA was first performed on each genotype to create separate PC spaces, and then performed on both genotypes together to create a combined PC space. To classify bout type, we first calculated the distance between each bout's PC trajectory via dynamic time warping (DTW), using a warping window of 10 ms and the first five principal components in the combined PC space. For bouts of different lengths, the shorter-length bout was padded with zeros to match the length of the larger bout. Left/right polarity was removed by performing each alignment twice, with all values reversed for one trajectory the second time, and taking the minimum of the pair as the similarity. Affinity propagation was then performed on the similarity matrix, with the median similarity between bouts used as the preference for the clustering. Initially 2508 exemplars were identified; we then excluded any exemplar containing less than five bouts, leaving 1779 exemplars. Isomap embedding (Tenenbaum et al., 2000) was then performed on the remaining exemplars, by using the DTW distances to construct a nearest-neighbors graph (nearest neighbors = 20), calculating minimum distances between pairs of points, and finding the eigenvectors of the graph distance matrix. To classify bout types, hierarchical clustering (N = 7 clusters) was performed on the first 20-D of the Isomap embedding.
Bout types were named consistent with prior work, including confirming appropriate selection probabilities and timing during hunting and exploring. Differences in bout-type probabilities were tested using the built-in Kolmogorov–Smirnov (KS)-test from the EDF NPAR1WAY Procedure package (SAS). To compare transition matrices, bout-type transitions within unique movement sequences were summed and then divided by the total number of transitions for each genotype. Significant transitions were determined by shuffling bout types 10,000 times between unique movement sequences (excluding bout types at the end of each sequence), recomputing the transition probabilities, and comparing experimental and shuffled transition probabilities (Bonferroni correction n = 49). Genotype differences in the number of significant transitions were tested by shuffling bout types between genotypes, recomputing the significant transitions, and comparing the experimental differences against the distribution of shuffled differences (10,000 shuffles).
Light-sheet imaging
Larvae expressing GCaMP6s pan-neuronally were embedded in 2.5% low-melting point agarose, and volumetric imaging of calcium signals was performed using a custom-built light-sheet microscope with a CMOS camera (Prime BSI, Photometrics). Fifteen planes spaced 10 μm apart were captured at 1 Hz/volume. To assess the volume of the periventricular layer and neuropil each was manually segmented in each larva from 30 to 90 μm from the skin (dorsal surface), and the area of these seven planes was then summed for each larva.
Two-photon calcium imaging
Larvae were embedded in 2.5% low-melting point agarose in the center of a 35-mm diameter Petri dish. Calcium signals in the contralateral tectum to the visual stimulation were recorded with the fish upright using a Zeiss LSM 710 two-photon microscope at the Queensland Brain Institute's Advanced Microscopy Facility. Excitation was via a Mai Tai DeepSee Ti:Sapphire laser 463 (Spectra-Physics) at an excitation wavelength of 930–940 nm. Emitted signals were bandpassed (500–550 nm) and detected with a nondescanned detector. Images (416 × 300 pixels) were acquired at 2.2 Hz.
Fish were first imaged for 30 min in the dark for spontaneous activity (SA). We then recorded tectal responses to stationary 6° diameter dark spots at an elevation of ∼30° to the fish at either 9 or 11 different horizontal locations (45n° or 15° to 165° in 15° steps, respectively, where the heading direction of the fish is defined as 0°). Only responses to the nine locations common to all fish were analyzed here. Each spot was presented for 1 s followed by 19 s of blank screen for a total of 20 times. The presentation order of spot location was randomized, ensuring that spatially adjacent stimuli were never presented sequentially.
Analysis of neural responses
Preprocessing of calcium imaging data
Cell detection and calcium trace extraction were performed using custom MATLAB software as described by Avitan et al. (2017). In brief, x-y drifts were corrected using a rigid imaging registration algorithm. Active pixels were identified as pixels that showed changes in brightness over the recording to create an activity map. This activity map was then segmented using a watershed algorithm. For each segmented region, the correlation coefficient between pairs of pixels were calculated. Then, a Gaussian mixture model was applied to identify the threshold correlation level for assigning highly correlated pixels to a cell, requiring each cell to contain at least 26 pixels. Once the cells had been identified, we calculated the average brightness of the pixels as the raw fluorescence level F(t). The baseline fluorescence was calculated as a smoothed curve fitted to the lower 20% of the values and the instantaneous baseline level F0(t) was taken as the minimum value of the smoothed traced within 3 s centered at t. Neuronal activity levels were calculated as the change of fluorescence level from the baseline as Δ F/F(t) = (F(t)-F0(t))/F0(t). We defined the mean ΔF/F(t) over four to seven frames poststimulus presentation as the stimulus-evoked response. Neural activities occurring within the first 5 s of stimulus presentation were term as evoked activity (EA).
Tuning curves
For each neuron, the average responses to each stimulus were averaged to represent the mean response to the given stimulus. We then applied cubic spline interpolation to estimate response amplitude in 5° steps between presented stimuli angles. A Gaussian function was fitted to this interpolated curve to estimate the tuning curve. Neurons with fitted adjusted R2 larger than 0.7 and a maximum evoked response amplitude larger than 1 ΔF/F(t) were deemed selective neurons and included in further analysis. From the fitted tuning curve, we also obtained the preferred tuning angle and tuning width for each tuned neuron.
Assembly properties
Assemblies were detected as detailed previously (Avitan et al., 2017; Mölter et al., 2018). In brief, we used a graph theory-based approach to automatically detect assemblies without prior assumptions of expected number of assemblies. For statistical analysis of assembly properties, we treated each assembly as a unit. For assembly tuning, we calculated the mean tuning properties of all neurons belonging to a given assembly.
Coactivity pattern
To obtain significant coactivity levels we established a threshold using the coactivity patterns during SA. We took the binarized activity pattern and randomly circularly shifted the pattern 1000 times along the time axis, thus preserving the total activity level. The threshold was chosen as the 95th percentile of the shuffled coactivity level. Frames of significant coactivity were collected and divided into different response epochs for further analysis. We applied PCA analysis on the coactivity patterns from different response epochs to quantify the dimensionality of these responses epochs. Geometrical relations between EA and SA patterns were measured as the residuals of projections of SA patterns onto the orthonormal basis of EA patterns.
Visual environment preference assay
Fish embryos from the same clutch (either WT or fmr1−/−) were split into two equally sized groups and reared separately to control for interclutch variability across rearing conditions. One group was reared in the naturalistic sensory environment (N) and the other in the reduced sensory stimulation environment (R). Fish were reared until 8 or 9 dpf. Four fish from one of the groups were then placed in a custom circular arena (see below for details). Free swimming behavior of the fish was recorded for 20 min continuously. Identical imaging was then performed for the other group.
The arena was of similar dimensions to the Petri dish in which the fish were reared (diameter 85 mm and water depth 5 mm). The arena was made by filling a larger Petri dish with 1.2% agarose (UltraPure, Invitrogen) and then cutting a well in the agarose using an 85-mm Petri dish. A color photographic image of the gravel used for the naturalistic rearing environment, scaled 1:1, was fixed to the underside of one half of the arena. For the other half of the arena, we fixed a flat color background which matched the mean hue and brightness of the gravel image (Fig. 5a). This image was constructed by randomly shuffling the coordinates of the pixels in the gravel image then smoothing using a two-dimensional Gaussian filter. The arena was placed onto a custom-made imaging stage illuminated from the side using a strip of white LED. Images were recorded using a CMOS camera (GrasshopperGS3-U3-23S6M-C, Point Gray) with a 25-mm lens (C-Mount Lens FL-CC2514A-2 M, Ricoh), at a rate of 100 fps.
The position of each fish was tracked using custom software written in MATLAB. The background image was first subtracted by adaptive per-pixel Gaussian modeling on a sliding window comprising every 400th frame spanning a total of 40,000 frames (6 min and 40 s), with a foreground threshold of 2 SDs above the mean pixel value. Additionally, a pixel was only considered foreground if its value was above the threshold in at least two of three temporally adjacent frames (the current frame and the two previous frames). Erroneous foreground objects with total area <8 pixels were removed using a connected components filter. Remaining foreground object masks were spatially smoothed using a two-dimensional Gaussian filter and filtered again by connected components to keep only the four largest objects which correspond to the four fish. The detected centroids were linked between frames based on minimum Euclidean distance to obtain the trajectory for each fish. We then calculated a gravel preference measure for each fish, defined as the proportion of time that the fish spent on the half of the dish with the gravel substrate.
Social behavior assay
Custom U-shaped chambers were constructed using a 3D printer (Formlabs Form 2, Formlabs). Chambers consisted of three compartments separated by two glass walls; two “cue” compartments each sized 20 × 18 mm and a “test” compartment of length 45 mm (Fig. 6a). Chambers were illuminated using a white LED light strip. A test fish (either WT or fmr1−/−) was placed into the test compartment for 5 min to adjust. A WT cue fish was then placed into the left cue compartments. behavior of both fish was then imaged using a CMOS camera (GrasshopperGS3-U3-23S6M-C, Point Gray) with a 25-mm lens (C-Mount Lens FL-CC2514A-2 M, Ricoh) at 100 or 175 fps for 30 min. For practical reasons (the large number of fish involved and the relatively long rearing time), these fish were raised in featureless tanks.
Analysis of social behavior assay
The locations of the cue and test fish were tracked using custom MATLAB software. Regions of interest (ROIs) were manually drawn for the cue and test chambers, respectively, to track each fish separately. To model the background a mean image was created using every 500th frame of the movie. To extract a binary image of the fish in each frame, the background was subtracted and pixels with resulting values greater than zero were considered foreground. The location of each fish was computed as the center of mass of the largest connected component in its corresponding ROI. We calculated the social preference index (SPI) as:
where social frames and nonsocial frames were defined as frames for which the test fish was located within the social zone or nonsocial zone, respectively, as shown in Figure 6a. To quantify the dynamics of fish interaction during social frames we adapted the software written in Python from Dreosti et al. (2015).
For each fish, we calculated the instantaneous speed (mm/s). We considered the cue fish as the reference fish, and identified bout times as the peaks in speed over the full duration of the recording. Peaks were defined as local maxima that were at least 2 SDs greater than the fish's mean speed. We computed the bout-triggered average (BTA) speed of the test fish as the mean over all bouts of the speed of the test fish for the period spanning 200 ms either side of each peak. We quantified the average lag of any movement induced in the test fish by the cue fish as the mean of the delay between each reference peak and the next subsequent peak for the test fish. This process was then repeated with the test fish as the reference.
Experimental design and statistical analysis
To assess the differences in hunting behavior, we examined fish of three different genotypes, namely, WT, fmr1+/−, and fmr1−/− fish. One-factor design with Genotype effects were assessed for these fish. To ensure accurate estimation of hunting behavior, fish that had less than eight hunting events during the assay were excluded (10th percentile of the distribution of number of events per fish; 10 fish were rejected by this criterion, leading to n = 23 for fmr1−/−, n = 19 for fmr1+/−, and n = 15 for WT fish). To validate the hunting behavior results, a separate cohort of fish were examined and same selection criteria was applied (n = 26 for fmr1+/− fish and n = 21 for fmr1−/− fish). To assess brain size differences, n = 10 for fmr1−/− and fmr1+/− fish, respectively. To assess tectal activity differences, n = 12 for fmr1−/− and fmr1+/− fish, respectively. For these one-factor designs, we report genotype effects. To assess gravel preference, we examined clutch matched fish of two genotypes, WT and fmr1−/−, reared under different visual environment (for WT, n = 16 for each of N and R; for fmr1+/−, n = 20 for each of N and R). To assess environmental effects on tectal activities, we compared the neural responses from fmr1+/− with fmr1−/− fish [n = 12 for fmr1−/−(N) and fmr1+/−(N), respectively; n = 14 and 6 for fmr1−/−(R) and fmr1+/−(R), respectively]. For these two-factor genotype × environment designs, we report genotype, environment, and interaction effects (# for genotype effect, † for environment, and ‡ for interaction) followed by post hoc tests. To assess craniofacial abnormalities, we examined fmr1−/− and fmr1+/− fish at 5, 9, and 14 dpf (fmr1−/−: n = 12, 12, 12; fmr1+/−: n = 12, 13, 10, for each age, respectively). To assess social behavior, we examined both WT and fmr1−/− fish at two different age ranges (WT: n = 36, 88, fmr1−/−: n = 48, 80, respectively, for 13–14 dpf and 26–28 dpf). For these two-factor age × genotype designs we examined age, genotype and interaction effects (# for genotype effect) and reported the final results from post hoc tests.
The sample size was chosen based on previous studies (Avitan et al., 2017, 2020). For the neural assembly measures, we treated each assembly as an individual functional unit, and the N values represent the number of assemblies detected. For all other measures, the N values represent the number of fish in each group, with each point representing the average for that measure for one fish.
To test differences between the means for data with multigroup design, ANOVA was used followed by post hoc t tests; p values were corrected for multiple comparisons using the false discovery rate with the Benjamini–Hochberg procedure. For data with single group, the Jarque Bera test was used to determine whether data were normally distributed. If any group of data were not normally distributed the Wilcoxon rank sum test was used, otherwise, two-sample t test was used. All other tests used were specified in the figure captions.
Code accessibility
The custom software used for fish tracking in the hunting, environment preference and social assays is available at https://github.com/GoodhillLab/fmr1-behavior-assay-processing. Code for analysis of bout types and transitions was adapted from Mearns et al. (2020). Code for assessing social interaction dynamics was adapted from Dreosti et al. (2015).
Results
fmr1−/− fish display craniofacial alterations
For this study, we used the fmr1hu2787 line generated from a TILLING (targeted induced local lesions in genomes) screen by den Broeder et al. (2009). A characteristic feature of FXS is altered craniofacial structure, including an elongated face (Heulens et al., 2013). While craniofacial alterations were found in zebrafish fmr1−/− mutants generated using a morpholino knock-down approach (Tucker et al., 2006), and subsequently in a CRISPR/Cas9 knock-out (KO; Hu et al., 2020), such changes were not originally reported in the knock-out of den Broeder et al. (2009). We revisited this issue by crossing fmr1+/+ or fmr1−/− with fmr1−/− fish to produce fmr1+/− and fmr1−/− offspring, performing Alcian blue staining at three developmental ages, and quantitatively compared measurements of facial cartilage structure (Fig. 1a,b). Canonical variate analysis (Zelditch et al., 2004) revealed differences in structure with both age (first canonical variable) and genotype (second canonical variable; Fig. 1c). For the second canonical variable high weights were given for distances quantifying the length of the face (Fig. 1d). In addition, the angle of Meckel's cartilage was significantly different between genotypes (Fig. 1e). These results confirm that craniofacial alterations analogous to human FXS occur in this fmr1−/− knock-out, providing further support for this line as a relevant model system.
Hunting is less successful in fmr1−/− fish
Starting from 5 dpf, zebrafish larvae hunt small, fast-moving prey such as Paramecia, relying on precise sensorimotor coordination (Bianco and Engert, 2015). We focused on 8- to 9-dpf larvae (henceforth referred to as 9 dpf for brevity), after hunting behavior has begun to mature (Avitan et al., 2020), and asked whether this behavior is altered by fmr1 mutation. Wild-type (WT), fmr1+/− or fmr1−/− fish were placed individually into small dishes with Paramecia, and hunting behavior was imaged for 15 min at 500 fps. There were no genotype-specific changes on size and gross locomotor function including hunt rate, distance to strike, duration to strike, number of bouts to strike and interbout interval (Fig. 2a–f). All genotypes also had similar preference for hunting paramecia at angles slightly lateral in the visual field (Fig. 2g), as measured by the position of the target paramecium when eye convergence occurred, indicating the start of the hunting event. However, fmr1−/− fish had a higher fraction of aborted hunting events (where the fish pursued the paramecium of interest but aborted the pursuit and never struck at the prey; Fig. 2h). fmr1−/− fish also had a lower hit ratio (the fraction of successful prey captures out of all hunting events recorded per fish; Fig. 2i). We then conducted the hunting assay again with a separate cohort of fish and the same deficits were observed (Fig. 2j,k). Across all genotypes the abort ratio was negatively correlated with the hit ratio (Fig. 2l), suggesting that the poor hunting performance observed in fmr1−/− fish was mainly because of a failure to sustain hunting behavior. As individual fish can develop at different rates, we then examined the relationship between hunting performance and fish length (Fig. 2m,n). Although these were significantly correlated very little variance was explained by length, suggesting that the reduced hunting success observed in fmr1−/− fish was not simply a reflection of the maturity level of the fish. Although hyperactivity in exploratory behavior assays has been reported for fmr1−/− fish (Kim et al., 2014), we observed a slight reduction in total distance traveled during our hunting assay (Fig. 2o). However, the proportion of time spent stationary during exploration remained unchanged, indicating that this difference was mainly because of an altered behavior pattern during hunting (Fig. 2p). Together, these results demonstrate that fmr1−/− fish were less effective hunters, and this was not because of deficits in gross locomotor function.
fmr1−/− fish show altered behavioral sequences
We then deconstructed hunting sequences into individual bout types, and asked whether the kinematics of the bouts or their sequences were altered in fmr1−/− fish. Tail shape in each movie frame was extracted (Fig. 3a; see Materials and Methods), and the dimensionality of the shape space reduced by principal components analysis (PCA) as in Mearns et al. (2020), initially keeping the genotypes separate. Almost all of the variance was captured by the first few PCs (Fig. 3b). Eigenshapes for fmr1−/− fish were qualitatively indistinguishable from those of fmr1+/− (Fig. 3c), and bouts shown as trajectories through the space of the first three PCs appeared similar (Fig. 3d). To identify different bout types, we applied a similar pipeline to that of Mearns et al. (2020) for both genotypes pooled together: dynamic time warping was used to create a pair-wise similarity matrix between bout trajectories in the low-dimensional space, which was then clustered by affinity propagation to identify a subset of exemplar bout types. Isomap embedding (Tenenbaum et al., 2000) was then used to project the similarity matrix of these exemplars into a 20-dimensional space. Both genotypes occupied the same region of this space when visualized in two dimensions (Fig. 3e). Following Mearns et al. (2020), seven bout types were then extracted by hierarchical clustering (Fig. 3f, top row). Visualizing these bout types by the time evolution of mean tail-tip curvature again indicated no differences between genotypes (Fig. 3f, bottom row). Thus, the basic movement primitives of fmr1+/− and fmr1−/− fish appeared to be the same.
However, there were significant differences between genotypes in the way in which these bouts were used. For this analysis we split bouts depending on whether they occurred during hunting (eyes converged) or exploration (eyes unconverged) periods. In both cases there were significant genotype differences in the frequency with which different bouts type were used (Fig. 3g,i) and in the number of significant transitions within the bout-transition matrices (Fig. 3h,j). In particular, capture swims were used significantly less in fmr1−/− fish, consistent with the higher abort ratio in these fish. During exploration fmr1−/− fish had a greater number of significant transitions (21) than fmr1+/− fish (19), while for hunting fmr1−/− fish had fewer significant transitions (12) than fmr1+/− fish (17). Thus, while the basic repertoire of movements was the same for both genotypes, the way in which these movements were used was different between genotypes. In particular, compared with fmr1+/− fish, fmr1−/− fish displayed more stereotypy (i.e., more regular sequences of behavior) in bout transitions during exploration, but less stereotypy during hunting.
Tectal activity statistics are altered in fmr1−/− fish
In light of the deficits in hunting in fmr1−/− fish observed above, we asked whether fmr1 mutation altered early development of spontaneous and evoked activity in the optic tectum, a brain region critical for successful hunting (Gahtan et al., 2005). Since we did not observe any behavioral differences between fmr1+/− fish and WT fish, for breeding efficiency for the intrinsically low-throughput neural imaging assays we compared fmr1−/− fish with fmr1+/− fish. First, we used light-sheet imaging (see Materials and Methods) of 9-dpf fish to determine whether there were any changes in tectal volume between these genotypes, but found no differences (Fig. 4a); 9-dpf fish were then embedded in low melting point agarose, and two-photon imaging was used to record calcium signals from the tectum in a plane 70 µm below the skin (Avitan et al., 2020; Fig. 4b). Each fish was imaged first in the dark for 30 min of spontaneous activity (SA), followed by a 5-min adjustment period, and then in response to 6° stationary spots (a size likely to be considered as prey; Bianco et al., 2011) at nine positions in the visual field ranging from 45° to 165° in 15° increments. Each stimulus was presented for 1 s followed by a 19-s gap, with 20 repetitions of each stimulus in pseudo-random order. Because of the long decay time of the calcium indicator we defined evoked activity (EA) to be activity in the period from stimulus onset to 5 s postonset, as in Avitan et al. (2021).
Figure 4.
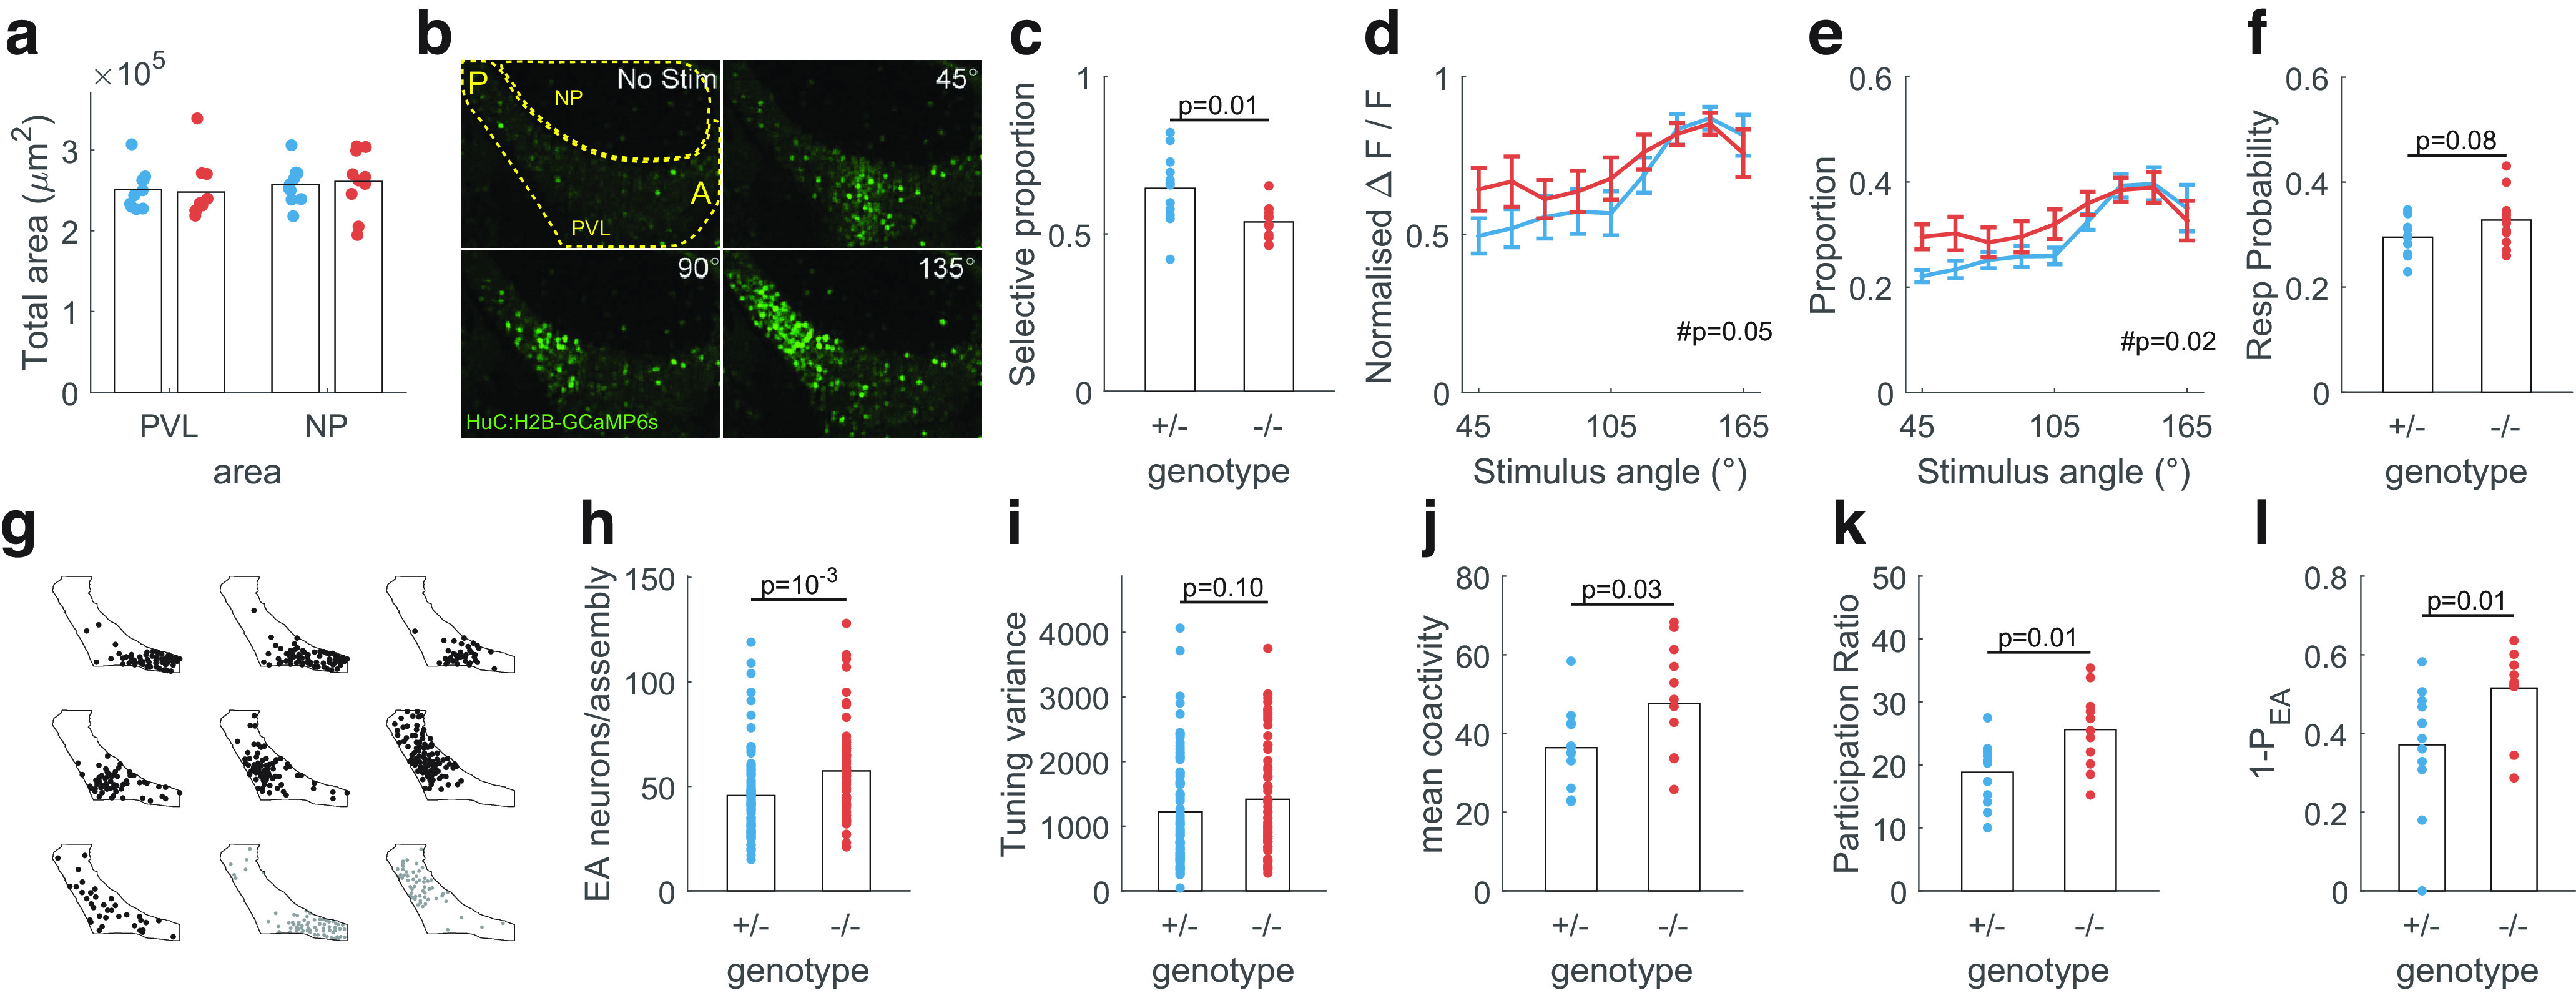
fmr1−/− fish show changes in tectal activity statistics. a, Total area (see Materials and Methods) of the periventricular layer (PVL) and neuropil (NP) were not different between fmr1−/− and fmr1+/− fish. b, PVL activity in response to no stimulus and spots at 45°, 90°, and 135° for an example fmr1−/− fish. Boundaries of PVL and NP were highlighted. A: anterior; P: posterior. c, Proportion of stimulus-selective neurons was lower in fmr1−/− fish. d, Proportions of neurons responding to each stimulus angle were less balanced for fmr1−/− fish. e, Responses to anterior stimuli were stronger in fmr1−/− fish. For d, e, #p represents effect of genotype from two-way ANOVA. Error bars represent SEM. f, Probability of response to visual stimuli was higher in fmr1−/− fish. g, Assemblies detected in an example fmr1−/− fish drawn on the outline of the PVL. Black, EA assemblies. Gray, SA assemblies. h, fmr1−/− fish had more neurons per EA assembly. i, The tuning of EA assembly neurons showed a trend toward higher variance in fmr1−/− fish. j, The number of coactive neurons during EA was higher for fmr1−/− fish. k, The dimensionality of evoked activity was higher for fmr1−/− fish. l, The residuals of the projections of SA onto the EA space were larger for fmr1−/− fish. p values show results of two-sample t test unless otherwise specified.
The tectum is topographically organized with the anterior portion responding to the frontal visual field, and the posterior portion responding to the rear visual field (Kita et al., 2015). However, previous work with WT fish has shown that the tectal representation of visual space at this tectal depth develops nonuniformly: responses are initially weaker and neural decoding worse in the anterior tectum, but by 13–15 dpf, the representation has become uniform across the visual field (Avitan et al., 2020). We therefore asked whether developing tectal representations are altered at 9 dpf in fmr1−/− fish. Stimulus responses in fmr1−/− fish were also topographically organized (Fig. 4b); however, the proportion of stimulus selective cells (those responsive to any stimulus) was lower (Fig. 4c). Within this responsive subpopulation of neurons, the proportion responding to different visual angles was less biased toward the rear visual field (Fig. 4d), suggesting an altered developmental trajectory (Avitan et al., 2020). The response strength was also higher for fmr1−/− fish (Fig. 4e), with a trend toward higher response probability to stimulus presentation (Fig. 4f). Thus, individual response properties of tectal neurons were altered in fmr1−/− fish.
Neural assemblies have been proposed to serve critical roles in neural computation (Buzsáki, 2010). We next identified tectal neural assemblies using the graph clustering algorithm introduced by Avitan et al. (2017; Fig. 4g) and tested for alterations in assembly structure. For stimulus-evoked assemblies (i.e., during the EA period as defined above) the number of neurons per assembly was greater for fmr1−/− than fmr1+/− fish (Fig. 4h), suggesting higher excitability in fmr1−/− fish. In addition, these assemblies showed a trend of larger assembly tuning variance (variance of preferred stimulus angle of assembly member neurons, Fig. 4i) in fmr1−/− fish compared with fmr1+/− fish, suggesting less refined tuning in these fish.
Changes in assembly structure can also impact the geometric structure of the coactivity patterns (Avitan et al., 2021). We observed an increase in coactivity level (mean number of neurons active together) in fmr1−/− fish for EA (Fig. 4j) consistent with the larger number of EA assembly neurons in these fish (Fig. 4h). The EA response pattern in fmr1−/− fish also had higher dimensionality, as measured by the participation ratio (Gao et al., 2017; Fig. 4k). The residual for SA patterns when projected onto the EA space (see Materials and Methods; Avitan et al., 2021) was larger in fmr1−/− fish (Fig. 4l), suggesting EA patterns in these fish were geometrically less similar to spontaneous patterns than in fmr1+/− fish. Thus, overall, fmr1−/− fish showed altered development of tectal activity patterns, with the changes including an overall increase in excitability.
fmr1−/− fish show a preference for reduced sensory stimulation
The environment has also been hypothesized to play an important role in the expression of FXS; however, conflicting results have been obtained for how sensory experience affects the developmental trajectory of FXS mouse models. Restivo et al. (2005) reported that environmental enrichment rescued some abnormalities, but in contrast, Lauterborn et al. (2015) found that enrichment was necessary for differences between the genotypes to be revealed. For the experiments described thus far the fish were raised in Petri dishes placed on a gravel substrate (Sainsbury et al., 2018; see Materials and Methods), which is a more natural visual environment than featureless Petri dishes, and is indeed preferred by adult WT fish (Schroeder et al., 2014). However, humans with ASDs often experience sensory over-responsivity to normal sensory environments, sometimes accompanied by aversive behaviors (Tavassoli et al., 2014). We therefore wondered whether fmr1−/− larvae would prefer an environment with reduced sensory stimulation, and whether rearing in such an environment would change developmental outcomes for these fish.
First, we compared free-swimming behavior (no prey items) for fmr1−/− and WT fish at 9 dpf in 85-mm dishes, where half of each dish had an image of a gravel substrate on the bottom and the other half was featureless (uniform brightness equal to the mean brightness of the gravel half of the dish; Fig. 5a). We raised fish in dishes without gravel (termed “R” for “reduced visual stimulation”) and on gravel (termed “N” for “naturalistic visual stimulation,” although we note that the ecological environment of zebrafish in the wild contains other components; Sundin et al., 2019). WT fish displayed no preference for either side of the dish. However, fmr1−/− fish spent significantly more time on the featureless side of the dish (Fig. 5b,c), consistent with the hypothesis of an active avoidance of sensory stimulation. This was independent of whether the fish were raised in reduced or naturalistic environments (Fig. 5c). There were gene-environment interaction effects for distance traveled, with fmr1−/− fish traveling a shorter distance than WT fish when reared in the reduced environment (Fig. 5d)
Reduced sensory stimulation reduces the impact of fmr1 mutation on tectal activity statistics
Since we found that fmr1−/− fish had a preference for a visual environment with reduced sensory stimulation, and the optic tectum is the main processing hub of visual information, we then asked whether reduced sensory stimulation during development also altered tectal responses in these fish. We raised a separate cohort of fish in dishes without gravel (R) and compared these fish with our original cohort of fmr1+/− and fmr1−/− fish raised on gravel (N).
For response probability there was a rearing-condition effect, with a reduction for fmr1−/−(R) fish compared with fmr1−/−(N) fish (Fig. 5e). However, we found gene-environment interaction effects for mean coactivity level during EA (Fig. 5f), and number of neurons per EA (Fig. 5g) and SA (Fig. 5h) assembly. These measures generally reflect overall neuronal excitability, and in each case post hoc pairwise comparisons revealed a reduction in excitability for fmr1−/−(R) fish compared with fmr1−/−(N) fish. For SA neurons per assembly, the effect of the rearing environment was in the opposite direction for fmr1−/− compared with fmr1+/− fish. We did not find any differences between fmr1−/−(R) fish and fmr1+/−(N) fish, suggesting a reduction of the impact of the fmr1 mutation by reduced sensory stimulation. Thus, overall, rearing fmr1−/− fish with reduced sensory stimulation returned several metrics to values similar to those for fmr1+/− fish.
Social behavior is altered in fmr1−/− fish
So far, we examined hunting behavior, which relies on precise sensorimotor coordination. However, a common symptom of ASDs is changes in social interactions. We therefore asked whether there were alterations in social behavior in fmr1−/− fish. We used a U-shaped behavioral chamber similar to that of Dreosti et al. (2015; Fig. 6a), and compared how the behavior of fmr1−/− versus WT test fish were affected by the presence of a WT cue fish in one arm of the chamber over 30 min (Fig. 6b). Since social behavior develops later than hunting behavior (Dreosti et al., 2015), for these experiments, we examined fish at 13–14 and 26–28 dpf (for simplicity, we will refer to these as just 14 and 28 dpf, respectively). WT and fmr1−/− fish were in nacre background, and the cue fish was size-matched to the test fish.
At 28 dpf, fmr1−/− test fish traveled a greater distance in the chamber than WT test fish (Fig. 6c). This is consistent with hyperactivity of fmr1−/− fish as reported previously (Ng et al., 2013; Wu et al., 2017). As one measure of social interaction we calculated the social preference index (SPI) as in Dreosti et al. (2015), which measures the proportion of time the fish spends in the arm of the chamber containing the cue fish versus the empty arm. Neither genotype displayed a preference between arms at 14 dpf, but by 28 dpf, both genotypes showed a preference for the arm containing the cue fish (Fig. 6d). Surprisingly, however, at 28 dpf, fmr1−/− fish had a stronger preference than WT fish for the arm containing the cue fish (Fig. 6d). This change in SPI could not be explained simply by fish having more chance to be within the social zone as a result of greater distance traveled: when we examined the heading angles of the test fish, we found that at 28 dpf, these were mostly between 0° and 180°, indicating that the fish were mostly heading toward the location of the cue fish (Fig. 6e). Together with the larger SPI for these fish, these results suggest that at 28 dpf, fmr1−/− fish had a greater preference for social interaction.
When cue and test 28-dpf fish could see each other, they tended to respond to each other's movements, with sometimes the test fish leading and sometimes the cue fish leading as indicated by the double-peaked bout-triggered motion signals (Fig. 6f, bottom row) Dreosti et al., 2015). This behavior was not present at 14 dpf (Fig. 6f,g). However, by 28 dpf, fmr1−/− fish, unlike WT fish, showed a clear asymmetry between their behavior and that of the WT cue fish. In particular, fmr1−/− fish took on average 26 ms longer than WT fish to respond to movements of the test fish (Fig. 6h). Thus, although fmr1−/− fish have a greater preference for social interaction than WT fish, they show delayed behavioral responses to conspecific movements.
Discussion
We combined detailed behavioral analysis of exploration, hunting, and social behaviors with large-scale calcium imaging of neural activity to uncover how mutation of fmr1−/− perturbs early development at the systems level. A summary of our results in shown in Figure 7.
Figure 7.
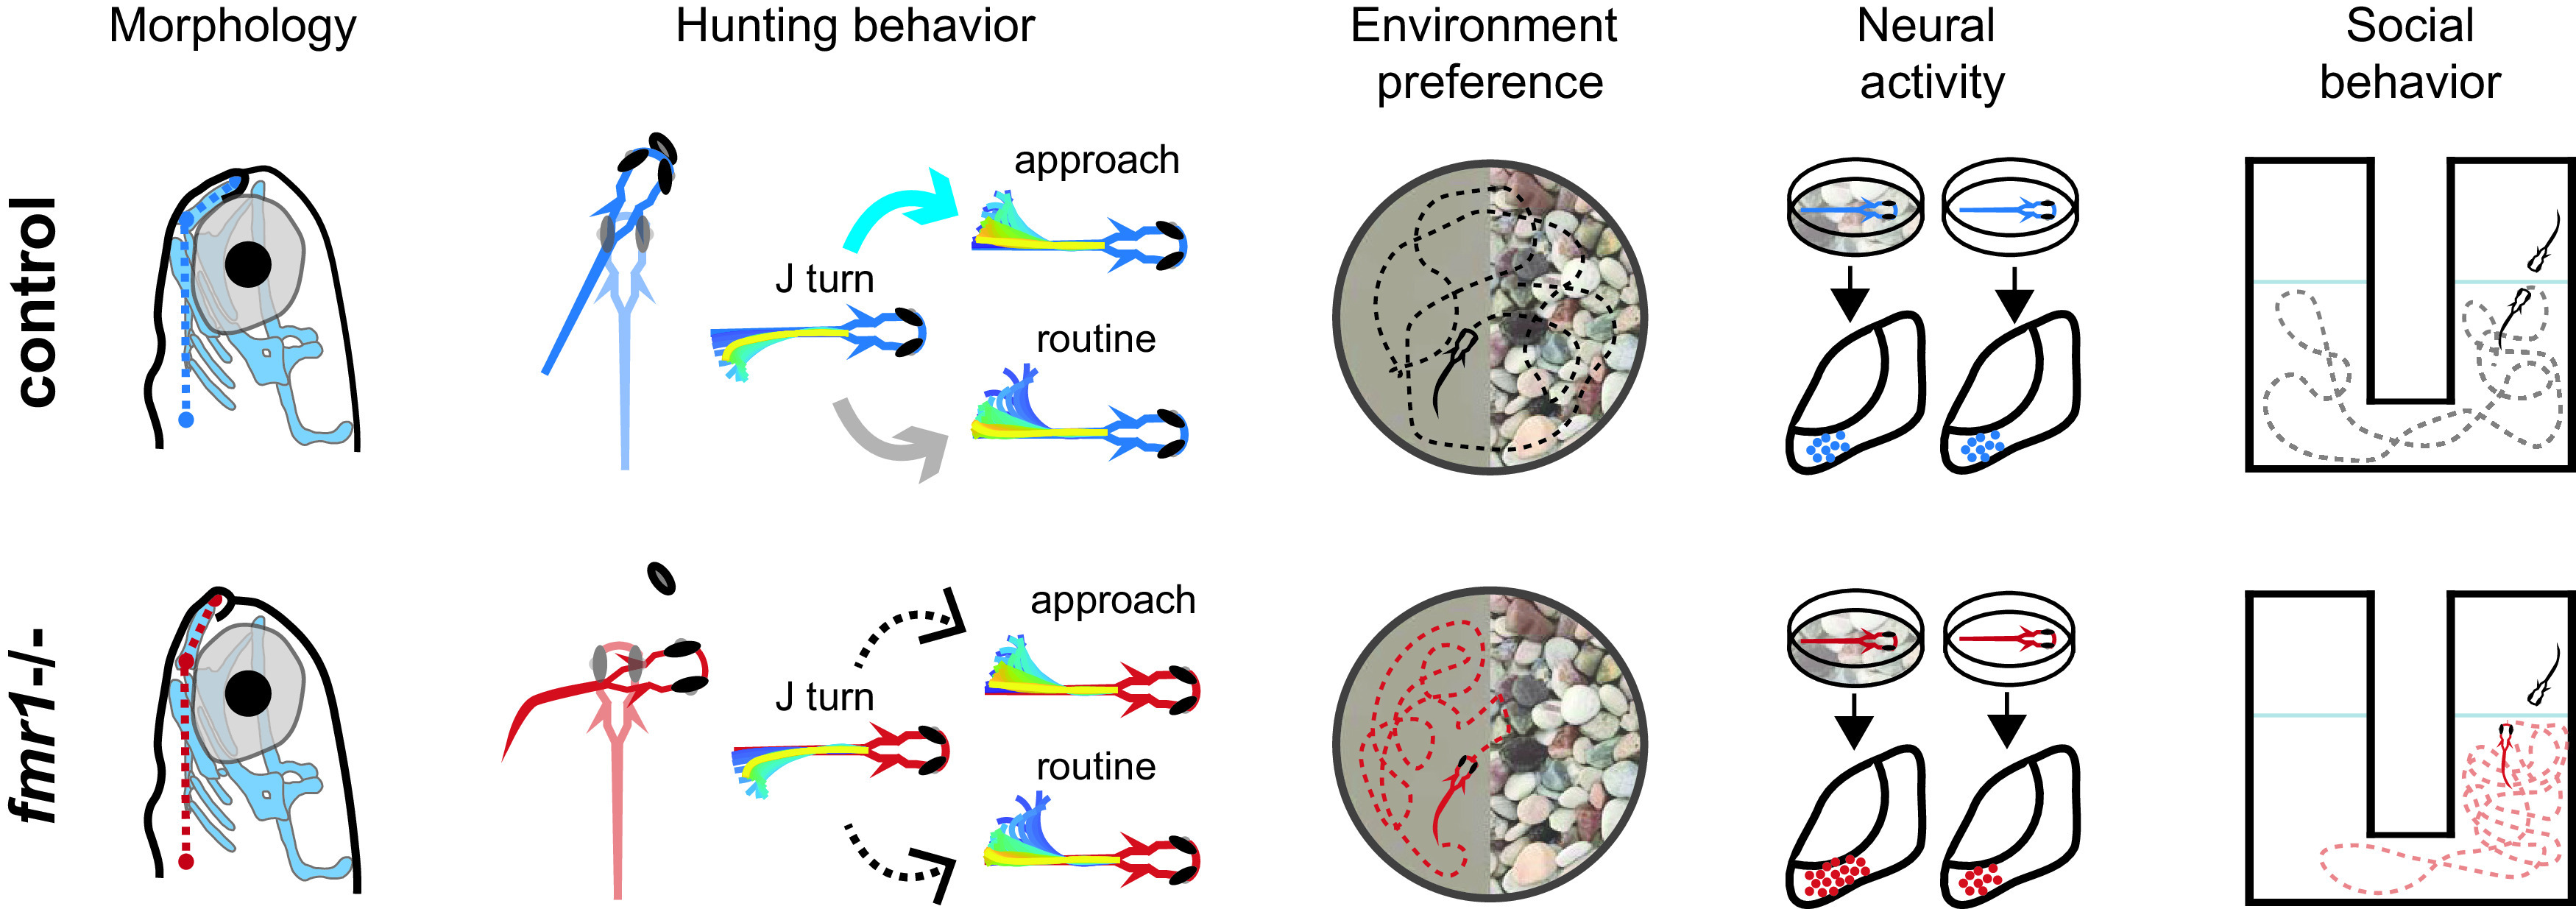
Overview of changes in fmr1−/− fish. Compared with controls, fmr1−/− fish display altered craniofacial morphology, reduced hunting performance, changes in bout transitions, sensory defensiveness, neural hyperexcitability when raised in a naturalistic but not reduced-stimulation environment, and changes in social behavior. (For bout transitions blue arrow represents above-chance probability, gray arrow represents below-chance probability, and dashed arrows represent chance probability.)
Previous studies of zebrafish fmr1 mutants have shown a variety of phenotypic effects. Using a morpholino approach Tucker et al. (2006) reported changes in craniofacial structure and increased axonal branching during development. The initial description of the knock-out line used in the present work did not find craniofacial changes (den Broeder et al., 2009), which has led to doubts about the relevance of this line for studying FXS (Hu et al., 2020). Here, we showed through a more detailed and quantitative analysis that this line does indeed display changes in craniofacial structure, as in human FXS, offering further support for its validity as an FXS model. To determine whether this has a direct effect on the behavior of the zebrafish mutants would require 3D imaging of jaw movements during prey capture, which is an interesting question for future work.
This same line has previously been shown to exhibit changes in open-field behavior in adult fish (Kim et al., 2014), increased axonal branching early in development (Shamay-Ramot et al., 2015; Constantin et al., 2020), abnormal auditory processing (Constantin et al., 2020), and altered network properties during visual habituation (Marquez-Legorreta et al., 2022). Adults from a different fmr1 knock-out line displayed changes in exploratory behavior, avoidance learning, long-term potentiation, and long-term depression (Ng et al., 2013). An fmr1 knock-out generated via CRISPR/Cas9 showed hyperactivity and changes in response to light stimulation at 5 dpf (Hu et al., 2020). Here, we have significantly extended these previous analyses by examining hunting and social behavior, tectal coding, and how the visual environment can alter the expression of the fmr1 knock-out phenotype.
Several aspects of hunting behavior were not significantly different for WT, fmr1+/−, and fmr1−/− fish, namely, hunt rate, interbout interval, duration to strike, bouts to strike, and detection angle. However, fmr1−/− fish showed a lower hit ratio and a higher abort ratio, with no differences between fmr1+/− and WT fish. The structure of individual bouts was similar between fmr1−/− and fmr1+/− fish, but bout-type frequencies and transition probabilities were different. During exploration, fmr1−/− fish had a greater number of significant bout transitions, suggesting a less flexible approach to exploration. However, during hunting, fmr1−/− fish had fewer significant bout transitions than fmr1+/− fish, suggesting a more fractured/disordered hunting sequence. This is exemplified by the inability of fmr1−/− fish to suppress J-turn → Routine Turn transitions and execute J-turn → Approach transitions. Together, these changes disrupt hunting, leading to more aborts and fewer successes.
This combination of similarities and deficits suggests fmr1−/− induced changes in the neural circuits involved in the execution of hunting. We then investigated tectal activity (initially in fish raised in the N environment) and found altered tectal spatial representations and tectal response statistics in fmr1−/− fish including higher response probability, a larger number of neurons per assembly, and larger mean coactivity level for evoked activity. These results suggest an increase in excitability caused by fmr1 mutation. Many of these changes mirror those seen previously in Fmr1−/− mouse cortex (Gonçalves et al., 2013; Cheyne et al., 2019), where larger numbers of neurons were recruited in synchronized activity, and in mouse retina (Perche et al., 2018), where response profiles were altered. A leading hypothesis for the underlying cause of some of these changes is an increase in neural excitation (E) relative to inhibition (I), i.e., E-I balance (Lee et al., 2017). Supporting this, inhibitory interneurons have been implicated in network dysfunction in FXS (Cea-Del Rio and Huntsman, 2014; Braat and Kooy, 2015; Berzhanskaya et al., 2016; Goel et al., 2018). Recently, it has been suggested that E-I balance changes are in fact compensatory in ASDs, helping to restore the system to a normal operating point (Antoine et al., 2019). While E-I balance has yet to be directly investigated in zebrafish tectum, inhibitory neurons have been identified in this structure using a variety of molecular techniques. In particular, Robles et al. (2011) found that almost all dlx5-positive neurons in the tectum are GABAergic, and that this population comprises 5–10% of all tectal neurons. Our finding of increased excitability is consistent with a disruption of E-I balance because of fmr1 mutation.
A well-known symptom of many ASDs is sensory defensiveness, i.e., a negative reaction to one or more types of sensations (Sinclair et al., 2017). Regarding tactile defensiveness, He et al. (2017) found altered locomotor activity in young Fmr1−/− mice and avoidance behavior in adult KO mice on repeated tactile stimulation. Hyperexcitability in circuits involved in vision in Fmr1−/− mice has also been reported (Rais et al., 2018). We found a direct correlate of sensory defensiveness in fmr1−/− fish, namely, a preference for a relatively featureless environment compared with a gravel environment. In contrast WT fish displayed no preference, and for neither genotype was this modulated by the rearing environment. This provides confirmation that sensory defensiveness in ASDs applies across species, and suggests intriguing avenues for future work using zebrafish models.
These results raise the question of whether rearing fmr1−/− fish in an environment they find aversive affects the expression of the fmr1−/− phenotype. In general, there is strong interest in how environmental influences modulate the expression of ASDs. In mice several studies have examined the effects of environmental enrichment (EE; e.g., running wheels and toys) on Fmr1−/− mutants. EE has been shown to enhance neural responsiveness (Polley et al., 2004; Engineer et al., 2004; Mainardi et al., 2010), and reduce inhibition (Sale et al., 2007; Zhou et al., 2011). Restivo et al. (2005) showed that EE largely rescued symptoms of hyperactivity, open-field exploration, habituation and changes in dendritic structure compared with mice reared in the normal lab environment, and a subsequent study showed restoration of long-term potentiation in prefrontal cortex to WT levels (Meredith et al., 2007). In contrast, however, more recent work found that differences in hippocampal spine morphology between Fmr1−/− and WT mice were exacerbated by EE (Lauterborn et al., 2015), and these authors suggested that EE allows for the impact of loss of Fmr1 to be more fully expressed. Our results for environmental effects on tectal activities are consistent with this hypothesis. The impact of the environment on tectal activity manifested primarily in gene-environment interactions. For fmr1−/− fish, there were significant reductions in metrics of excitability, namely, response probability and number of neurons per assembly, for the R environment compared with the N environment. We found no environmental effects on the fmr1+/− fish. Furthermore, the R environment abolished the difference between genotypes that was present in the N environment. An important difference between our study and (Restivo et al., 2005; Meredith et al., 2007) is the time EE was introduced to the animal, and this could help explain why some of our findings are different. In particular, in Restivo et al. (2005) and Meredith et al. (2007), the enriched environment was introduced postweaning (approximately three weeks after birth), while the fish in our study were introduced to the N environment directly following fertilization.
Besides exploratory and hunting behaviors, we also examined the development of social behavior, which emerges slightly later in development; 14 dpf fmr1−/− fish displayed hyperactivity but shared the lack of interest in social interaction (as measured in our simple social preference assay) with WT fish. However, by 28 dpf, social interaction had developed differently between fmr1−/− and WT fish, with fmr1−/− fish displaying a greater preference for social interaction with a WT cue fish than WT fish. This is initially surprising, given the well-documented tendency in ASDs in general for reduced social interaction (McConnell, 2002). However, recent work suggests that FXS may diverge from typical ASDs in this regard in that FXS individuals have intact intention for social interaction (Baker et al., 2019; Guy et al., 2020), and FXS individuals do not show the large reductions in social interest characteristic of idiopathic ASDs in an eye-gaze paradigm (Hong et al., 2019). On the other hand, we also found a reduced effectiveness of social interaction in fmr1−/− fish, in terms of a slower response to movements of the cue fish. This could potentially be simply a motor deficit, although we found no direct evidence for motor deficits in 9 dpf fmr1−/− fish in the prey-capture assay, and indeed, at both 14 and 28 dpf, fmr1−/− fish swam further than WT fish. The altered interaction observed here is consistent with a recent report of deficits in imitating conspecific behavior in Fmr1−/− mice (Gonzales-Rojas et al., 2020). An interesting extension of this work would be to investigate whether fmr1−/− fish interact differently with other fmr1−/− fish compared with WT fish.
Together, our results reveal many previously unknown differences in hunting behavior in fmr1−/− fish, and the neural bases for these changes in terms of altered neural coding. It would be interesting in future work to examine how these changes in behavior and neural coding emerge over development (cf. Avitan et al., 2020). Although the link between changes in neuronal activity and behavioural changes is correlative, our results suggest that neural activity changes are likely to disrupt the execution of motor behavior (interrupted hunting and delayed social response). The changes in the developmental trajectory of fmr1−/− fish depending on the complexity of the sensory environment, with a less complex environment sometimes leading to improved outcomes, offers a new direction for future work potentially leading to novel concepts for therapeutic intervention. Overall, our work suggests new avenues for revealing alterations of neural systems in neurodevelopmental disorders.
Footnotes
This work was supported by the Simons Foundation Autism Research Initiative Grant 569051 (to G.J.G.) and the Australian National Health and Medical Research Council Leadership Grant 1196855 (to G.J.G.). Neural imaging was performed at the Queensland Brain Institute's Advanced Microscopy Facility using a Zeiss LSM 710 two-photon microscope, supported by the Australian Government through the Australian Research Council Linkage Infrastructure, Equipment and Facilities Grant LE130100078. We thank Dhairya Vayada, Matthew Levendosky, and Alisha Tromp for their help with hunting assay annotations.
The authors declare no competing financial interests.
References
- Antoine MW, Langberg T, Schnepel P, Feldman DE (2019) Increased excitation-inhibition ratio stabilizes synapse and circuit excitability in four autism mouse models. Neuron 101:648–661.e4. [DOI] [PMC free article] [PubMed] [Google Scholar]
- Arnett MT, Herman DH, McGee AW (2014) Deficits in tactile learning in a mouse model of Fragile X syndrome. PLoS One 9:e109116. 10.1371/journal.pone.0109116 [DOI] [PMC free article] [PubMed] [Google Scholar]
- Avitan L, Pujic Z, Mölter J, Poll MVD, Sun B, Teng H, Amor R, Scott EK, Goodhill GJ (2017) Spontaneous activity in the zebrafish tectum reorganizes over development and is influenced by visual experience. Curr Biol 27:2407–2419.e4. [DOI] [PubMed] [Google Scholar]
- Avitan L, Pujic Z, Mölter J, McCullough M, Zhu S, Sun B, Myhre A-E, Goodhill GJ (2020) Behavioral signatures of a developing neural code. Curr Biol 30:3352–3363.e5. 10.1016/j.cub.2020.06.040 [DOI] [PubMed] [Google Scholar]
- Avitan L, Pujic Z, Mölter J, Zhu S, Sun B, Goodhill GJ (2021) Spontaneous and evoked activity patterns diverge over development. Elife 10:e61942. 10.7554/eLife.61942 [DOI] [PMC free article] [PubMed] [Google Scholar]
- Baker EK, et al. (2019) Intellectual functioning and behavioural features associated with mosaicism in fragile x syndrome. J Neurodevelop Disord 11:41. 10.1186/s11689-019-9288-7 [DOI] [PMC free article] [PubMed] [Google Scholar]
- Baranek GT, Roberts JE, David FJ, Sideris J, Mirrett PL, Hatton DD, Bailey DB (2008) Developmental trajectories and correlates of sensory processing in young boys with fragile X syndrome. Phys Occup Ther Pediatr 28:79–98. 10.1300/j006v28n01_06 [DOI] [PubMed] [Google Scholar]
- Bassell GJ, Warren ST (2008) Fragile X syndrome: loss of local mRNA regulation alters synaptic development and function. Neuron 60:201–214. 10.1016/j.neuron.2008.10.004 [DOI] [PMC free article] [PubMed] [Google Scholar]
- Berzhanskaya J, Phillips MA, Gorin A, Lai C, Shen J, Colonnese MT (2016) Disrupted cortical state regulation in a rat model of fragile X syndrome. Cereb Cortex 27:1386–1400. [DOI] [PMC free article] [PubMed] [Google Scholar]
- Bianco IH, Engert F (2015) Visuomotor transformations underlying hunting behavior in zebrafish. Curr Biol 25:831–846. 10.1016/j.cub.2015.01.042 [DOI] [PMC free article] [PubMed] [Google Scholar]
- Bianco I, Kampff A, Engert F (2011) Prey capture behavior evoked by simple visual stimuli in larval zebrafish. Front Syst Neurosci 5:101. 10.3389/fnsys.2011.00101 [DOI] [PMC free article] [PubMed] [Google Scholar]
- Bolme DS, Beveridge JR, Draper BA, Lui YM (2010) Visual object tracking using adaptive correlation filters. 2010 IEEE Computer Society Conference on Computer Vision and Pattern Recognition, June 13–18, 2010, San Francisco, pp 2544–2550. IEEE. [Google Scholar]
- Braat S, Kooy RF (2015) The GABAA receptor as a therapeutic target for neurodevelopmental disorders. Neuron 86:1119–1130. [DOI] [PubMed] [Google Scholar]
- Buzsáki G (2010) Neural syntax: cell assemblies, synapsembles, and readers. Neuron 68:362–385. 10.1016/j.neuron.2010.09.023 [DOI] [PMC free article] [PubMed] [Google Scholar]
- Cea-Del Rio CA, Huntsman MM (2014) The contribution of inhibitory interneurons to circuit dysfunction in fragile X syndrome. Front Cell Neurosci 8:245. 10.3389/fncel.2014.00245 [DOI] [PMC free article] [PubMed] [Google Scholar]
- Cheyne JE, Zabouri N, Baddeley D, Lohmann C (2019) Spontaneous activity patterns are altered in the developing visual cortex of the fmr1 knockout mouse. Front Neural Circuits 13:57. 10.3389/fncir.2019.00057 [DOI] [PMC free article] [PubMed] [Google Scholar]
- Constantin L, Poulsen RE, Scholz LA, Favre-Bulle IA, Taylor MA, Sun B, Goodhill GJ, Vanwalleghem GC, Scott EK (2020) Altered brain-wide auditory networks in a zebrafish model of fragile X syndrome. BMC Biol 18:125. 10.1186/s12915-020-00857-6 [DOI] [PMC free article] [PubMed] [Google Scholar]
- Contractor A, Klyachko VA, Portera-Cailliau C (2015) Altered neuronal and circuit excitability in fragile X syndrome. Neuron 87:699–715. 10.1016/j.neuron.2015.06.017 [DOI] [PMC free article] [PubMed] [Google Scholar]
- den Broeder MJ, van der Linde H, Brouwer JR, Oostra BA, Willemsen R, Ketting RF (2009) Generation and characterization of FMR1 knockout zebrafish. PLoS One 4:e7910. 10.1371/journal.pone.0007910 [DOI] [PMC free article] [PubMed] [Google Scholar]
- Dreosti E, Lopes G, Kampff A, Wilson S (2015) Development of social behavior in young zebrafish. Front Neural Circuits 9:39. 10.3389/fncir.2015.00039 [DOI] [PMC free article] [PubMed] [Google Scholar]
- Engineer ND, Percaccio CR, Pandya PK, Moucha R, Rathbun DL, Kilgard MP (2004) Environmental enrichment improves response strength, threshold, selectivity, and latency of auditory cortex neurons. J Neurophysiol 92:73–82. 10.1152/jn.00059.2004 [DOI] [PubMed] [Google Scholar]
- Estes A, Zwaigenbaum L, Gu H, St. John T, Paterson S, Elison JT, Hazlett H, Botteron K, Dager SR, Schultz RT, Kostopoulos P, Evans A, Dawson G, Eliason J, Alvarez S, Piven J, network I; IBIS network (2015) Behavioral, cognitive, and adaptive development in infants with autism spectrum disorder in the first 2 years of life. J Neurodev Disord 7:24. 10.1186/s11689-015-9117-6 [DOI] [PMC free article] [PubMed] [Google Scholar]
- Ethridge LE, White SP, Mosconi MW, Wang J, Byerly MJ, Sweeney JA (2016) Reduced habituation of auditory evoked potentials indicate cortical hyper-excitability in fragile X syndrome. Transl Psychiatry 6:e787. 10.1038/tp.2016.48 [DOI] [PMC free article] [PubMed] [Google Scholar]
- Farzin F, Whitney D, Hagerman R, Rivera S (2008) Contrast detection in infants with fragile X syndrome. Vision Res 48:1471–1478. 10.1016/j.visres.2008.03.019 [DOI] [PMC free article] [PubMed] [Google Scholar]
- Farzin F, Rivera SM, Whitney D (2011) Resolution of spatial and temporal visual attention in infants with fragile X syndrome. Brain 134:3355–3368. 10.1093/brain/awr249 [DOI] [PMC free article] [PubMed] [Google Scholar]
- Felzenszwalb PF, Girshick RB, McAllester D, Ramanan D (2010) Object detection with discriminatively trained part-based models. IEEE Trans Pattern Anal Mach Intell 32:1627–1645. 10.1109/TPAMI.2009.167 [DOI] [PubMed] [Google Scholar]
- Gahtan E, Tanger P, Baier H (2005) Visual prey capture in larval zebrafish is controlled by identified reticulospinal neurons downstream of the tectum. J Neurosci 25:9294–9303. 10.1523/JNEUROSCI.2678-05.2005 [DOI] [PMC free article] [PubMed] [Google Scholar]
- Gao P, Trautmann E, Yu B, Santhanam G, Ryu S, Shenoy K, Ganguli S (2017) A theory of multineuronal dimensionality, dynamics and measurement. bioRxiv. 10.1101/214262. [DOI] [Google Scholar]
- Goel A, Cantu DA, Guilfoyle J, Chaudhari GR, Newadkar A, Todisco B, de Alba D, Kourdougli N, Schmitt LM, Pedapati E, Erickson CA, Portera-Cailliau C (2018) Impaired perceptual learning in a mouse model of fragile X syndrome is mediated by parvalbumin neuron dysfunction and is reversible. Nat Neurosci 21:1404–1411. 10.1038/s41593-018-0231-0 [DOI] [PMC free article] [PubMed] [Google Scholar]
- Gonçalves JT, Anstey JE, Golshani P, Portera-Cailliau C (2013) Circuit level defects in the developing neocortex of fragile X mice. Nat Neurosci 16:903–909. 10.1038/nn.3415 [DOI] [PMC free article] [PubMed] [Google Scholar]
- Gonzales-Rojas R, Rana AN, Mason P, Renfro C, Annaluru V, Panda S, Lee HY (2020) The mouse model of fragile x syndrome exhibits deficits in contagious itch behavior. Sci Rep 10:17679. 10.1038/s41598-020-72891-x [DOI] [PMC free article] [PubMed] [Google Scholar]
- Guy J, Ng-Cordell E, Doherty BR, Duta M, Scerif G (2020) Understanding attention, memory and social biases in fragile x syndrome: going below the surface with a multi-method approach. Res Dev Disabil 104:103693. 10.1016/j.ridd.2020.103693 [DOI] [PubMed] [Google Scholar]
- Hagerman RJ, Berry-Kravis E, Hazlett HC, Bailey DB, Moine H, Kooy RF, Tassone F, Gantois I, Sonenberg N, Mandel JL, Hagerman PJ (2017) Fragile X syndrome. Nat Rev Dis Primers 3:17065. 10.1038/nrdp.2017.65 [DOI] [PubMed] [Google Scholar]
- He CX, Cantu DA, Mantri SS, Zeiger WA, Goel A, Portera-Cailliau C (2017) Tactile defensiveness and impaired adaptation of neuronal activity in the fmr1 knock-out mouse model of autism. J Neurosci 37:6475–6487. 10.1523/JNEUROSCI.0651-17.2017 [DOI] [PMC free article] [PubMed] [Google Scholar]
- Heulens I, Suttie M, Postnov A, De Clerck N, Perrotta CS, Mattina T, Faravelli F, Forzano F, Kooy RF, Hammond P (2013) Craniofacial characteristics of Fragile X syndrome in mouse and man. Eur J Hum Genet 21:816–823. 10.1038/ejhg.2012.265 [DOI] [PMC free article] [PubMed] [Google Scholar]
- Hong MP, Eckert EM, Pedapati EV, Shaffer RC, Dominick KC, Wink LK, Sweeney JA, Erickson CA (2019) Differentiating social preference and social anxiety phenotypes in fragile X syndrome using an eye gaze analysis: a pilot study. J Neurodev Disord 11:1. 10.1186/s11689-019-9262-4 [DOI] [PMC free article] [PubMed] [Google Scholar]
- Hu J, Chen L, Yin J, Yin H, Huang Y, Tian J (2020) Hyperactivity, memory defects, and craniofacial abnormalities in zebrafish fmr1 mutant larvae. Behav Genet 50:152–160. [DOI] [PubMed] [Google Scholar]
- Hunter J, Rivero-Arias O, Angelov A, Kim E, Fotheringham I, Leal J (2014). Epidemiology of fragile X syndrome: a systematic review and meta-analysis. Am J Med Genet 164:1648–1658. 10.1002/ajmg.a.36511 [DOI] [PubMed] [Google Scholar]
- Kim L, He L, Maaswinkel H, Zhu L, Sirotkin H, Weng W (2014) Anxiety, hyperactivity and stereotypy in a zebrafish model of fragile X syndrome and autism spectrum disorder. Prog Neuropsychopharmacol Biol Psychiatry 55:40–49. 10.1016/j.pnpbp.2014.03.007 [DOI] [PubMed] [Google Scholar]
- Kita EM, Scott EK, Goodhill GJ (2015) Topographic wiring of the retinotectal connection in zebrafish. Dev Neurobiol 75:542–556. 10.1002/dneu.22256 [DOI] [PubMed] [Google Scholar]
- Kleinhans NM, Johnson LC, Richards T, Mahurin R, Greenson J, Dawson G, Aylward E (2009) Reduced neural habituation in the amygdala and social impairments in autism spectrum disorders. Am J Psychiatry 166:467–475. 10.1176/appi.ajp.2008.07101681 [DOI] [PubMed] [Google Scholar]
- Kogan CS, Bertone A, Cornish K, Boutet I, Der Kaloustian VM, Andermann E, Faubert J, Chaudhuri A (2004) Integrative cortical dysfunction and pervasive motion perception deficit in fragile X syndrome. Neurology 63:1634–1639. 10.1212/01.wnl.0000142987.44035.3b [DOI] [PubMed] [Google Scholar]
- Larsch J, Baier H (2018) Biological motion as an innate perceptual mechanism driving social affiliation. Curr Biol 28:3523–3532.e4. [DOI] [PubMed] [Google Scholar]
- Lauterborn JC, Jafari M, Babayan AH, Gall CM (2015) Environmental enrichment reveals effects of genotype on hippocampal spine morphologies in the mouse model of fragile X syndrome. Cereb Cortex 25:516–527. 10.1093/cercor/bht249 [DOI] [PMC free article] [PubMed] [Google Scholar]
- Lee E, Lee J, Kim E (2017) Excitation/inhibition imbalance in animal models of autism spectrum disorders. Biol Psychiatry 81:838–847. [DOI] [PubMed] [Google Scholar]
- Mainardi M, Landi S, Gianfranceschi L, Baldini S, De Pasquale R, Berardi N, Maffei L, Caleo M (2010) Environmental enrichment potentiates thalamocortical transmission and plasticity in the adult rat visual cortex. J Neurosci Res 88:3048–3059. 10.1002/jnr.22461 [DOI] [PubMed] [Google Scholar]
- Marco EJ, Hinkley LBN, Hill SS, Nagarajan SS (2011) Sensory processing in autism: a review of neurophysiologic findings. Pediatr Res 69:48–54. [DOI] [PMC free article] [PubMed] [Google Scholar]
- Marquez-Legorreta E, Constantin L, Piber M, Favre-Bulle IA, Taylor MA, Blevins AS, Giacomotto J, Bassett DS, Vanwalleghem GC, Scott EK (2022) Brain-wide visual habituation networks in wild type and FMR1 zebrafish. Nat Commun 13:895. 10.1038/s41467-022-28299-4 [DOI] [PMC free article] [PubMed] [Google Scholar]
- McConnell SR (2002) Interventions to facilitate social interaction for young children with autism: review of available research and recommendations for educational intervention and future research. J Autism Dev Disord 32:351–372. 10.1023/A:1020537805154 [DOI] [PubMed] [Google Scholar]
- Mearns DS, Donovan JC, Fernandes AM, Semmelhack JL, Baier H (2020) Deconstructing hunting behavior reveals a tightly coupled stimulus-response loop. Curr Biol 30:54–69.e9. 10.1016/j.cub.2019.11.022 [DOI] [PubMed] [Google Scholar]
- Meredith RM, Holmgren CD, Weidum M, Burnashev N, Mansvelder HD (2007) Increased threshold for spike-timing-dependent plasticity is caused by unreliable calcium signaling in mice lacking fragile X gene fmr1. Neuron 54:627–638. 10.1016/j.neuron.2007.04.028 [DOI] [PubMed] [Google Scholar]
- Mölter J, Avitan L, Goodhill GJ (2018) Detecting neural assemblies in calcium imaging data. BMC Biol 16:143. 10.1186/s12915-018-0606-4 [DOI] [PMC free article] [PubMed] [Google Scholar]
- Muto A, Kawakami K (2013) Prey capture in zebrafish larvae serves as a model to study cognitive functions. Front Neural Circuits 7:110. 10.3389/fncir.2013.00110 [DOI] [PMC free article] [PubMed] [Google Scholar]
- Ng MC, Yang YL, Lu KT (2013) Behavioral and synaptic circuit features in a zebrafish model of fragile X syndrome. PLoS One 8:e51456. [DOI] [PMC free article] [PubMed] [Google Scholar]
- O'Donnell WT, Warren ST (2002) A decade of molecular studies of fragile X syndrome. Annu Rev Neurosci 25:315–338. 10.1146/annurev.neuro.25.112701.142909 [DOI] [PubMed] [Google Scholar]
- Perche O, Felgerolle C, Ardourel M, Bazinet A, Pâris A, Rossignol R, Meyer-Dilhet G, Mausset-Bonnefont AL, Hébert B, Laurenceau D, Montécot-Dubourg C, Menuet A, Bizot JC, Pichon J, Ranchon-Cole I, Briault S (2018) Early retinal defects in FMR1-/y mice: toward a critical role of visual Dys-sensitivity in the fragile x syndrome phenotype? Front Cell Neurosci 12:96. 10.3389/fncel.2018.00096 [DOI] [PMC free article] [PubMed] [Google Scholar]
- Polley DB, Kvasnák E, Frostig RD (2004) Naturalistic experience transforms sensory maps in the adult cortex of caged animals. Nature 429:67–71. 10.1038/nature02469 [DOI] [PubMed] [Google Scholar]
- Puts NAJ, Wodka EL, Tommerdahl M, Mostofsky SH, Edden RAE (2014) Impaired tactile processing in children with autism spectrum disorder. J Neurophysiol 111:1803–1811. 10.1152/jn.00890.2013 [DOI] [PMC free article] [PubMed] [Google Scholar]
- Rais M, Binder DK, Razak KA, Ethell IM (2018) Sensory processing phenotypes in fragile X syndrome. ASN Neuro 10:1759091418801092. 10.1177/1759091418801092 [DOI] [PMC free article] [PubMed] [Google Scholar]
- Razak KA, Dominick KC, Erickson CA (2020) Developmental studies in fragile X syndrome. J Neurodev Disord 12:13. 10.1186/s11689-020-09310-9 [DOI] [PMC free article] [PubMed] [Google Scholar]
- Restivo L, Ferrari F, Passino E, Sgobio C, Bock J, Oostra BA, Bagni C, Ammassari-Teule M (2005) Enriched environment promotes behavioral and morphological recovery in a mouse model for the fragile X syndrome. Proc Natl Acad Sci U S A 102:11557–11562. 10.1073/pnas.0504984102 [DOI] [PMC free article] [PubMed] [Google Scholar]
- Robertson CE, Baron-Cohen S (2017) Sensory perception in autism. Nat Rev Neurosci 18:671–684. 10.1038/nrn.2017.112 [DOI] [PubMed] [Google Scholar]
- Robles E, Smith S, Baier H (2011) Characterization of genetically targeted neuron types in the zebrafish optic tectum. Front Neural Circuits 5:1. 10.3389/fncir.2011.00001 [DOI] [PMC free article] [PubMed] [Google Scholar]
- Sainsbury T, Diana G, Meyer M (2018) The organisation, dynamics and development of neural assemblies in the tectum. Program No. 553.04. 2018 Neuroscience Meeting Planner. San Diego, CA. Society for Neuroscience. [Google Scholar]
- Sale A, Maya Vetencourt JF, Medini P, Cenni MC, Baroncelli L, De Pasquale R, Maffei L (2007) Environmental enrichment in adulthood promotes amblyopia recovery through a reduction of intracortical inhibition. Nat Neurosci 10:679–681. 10.1038/nn1899 [DOI] [PubMed] [Google Scholar]
- Scerif G, Cornish K, Wilding J, Driver J, Karmiloff-Smith A (2004) Visual search in typically developing toddlers and toddlers with fragile X or Williams syndrome. Dev Sci 7:116–130. 10.1111/j.1467-7687.2004.00327.x [DOI] [PubMed] [Google Scholar]
- Schroeder P, Jones S, Young IS, Sneddon LU (2014) What do zebrafish want? Impact of social grouping, dominance and gender on preference for enrichment. Lab Anim 48:328–337. 10.1177/0023677214538239 [DOI] [PubMed] [Google Scholar]
- Shamay-Ramot A, Khermesh K, Porath HT, Barak M, Pinto Y, Wachtel C, Zilberberg A, Lerer-Goldshtein T, Efroni S, Levanon EY, Appelbaum L (2015) Fmrp interacts with adar and regulates RNA editing, synaptic density and locomotor activity in zebrafish. PLoS Genet 11:e1005702. 10.1371/journal.pgen.1005702 [DOI] [PMC free article] [PubMed] [Google Scholar]
- Simmons DR, Robertson AE, McKay LS, Toal E, McAleer P, Pollick FE (2009) Vision in autism spectrum disorders. Vision Res 49:2705–2739. [DOI] [PubMed] [Google Scholar]
- Sinclair D, Oranje B, Razak K, Siegel S, Schmid S (2017) Sensory processing in autism spectrum disorders and fragile x syndrome—from the clinic to animal models. Neurosci Biobehav Rev 76:235–253. SI:IBNS-2015. [DOI] [PMC free article] [PubMed] [Google Scholar]
- Stewart AM, Nguyen M, Wong K, Poudel MK, Kalueff AV (2014) Developing zebrafish models of autism spectrum disorder (ASD). Prog Neuropsychopharmacol Biol Psychiatry 50:27–36. [DOI] [PubMed] [Google Scholar]
- Sundin J, Morgan R, Finnøen MH, Dey A, Sarkar K, Jutfelt F (2019) On the observation of wild zebrafish (Danio rerio) in India. Zebrafish 16:546–553. 10.1089/zeb.2019.1778 [DOI] [PubMed] [Google Scholar]
- Tavassoli T, Miller LJ, Schoen SA, Nielsen DM, Baron-Cohen S (2014) Sensory over-responsivity in adults with autism spectrum conditions. Autism 18:428–432. 10.1177/1362361313477246 [DOI] [PubMed] [Google Scholar]
- Tenenbaum JB, de Silva V, Langford JC (2000) A global geometric framework for nonlinear dimensionality reduction. Science 290:2319–2323. [DOI] [PubMed] [Google Scholar]
- Tucker B, Richards RI, Lardelli M (2006) Contribution of mGluR and Fmr1 functional pathways to neurite morphogenesis, craniofacial development and fragile X syndrome. Hum Mol Genet 15:3446–3458. 10.1093/hmg/ddl422 [DOI] [PubMed] [Google Scholar]
- Wu YJ, Hsu MT, Ng MC, Amstislavskaya TG, Tikhonova MA, Yang YL, Lu KT (2017) Fragile X mental retardation-1 knockout zebrafish shows precocious development in social behavior. Zebrafish 14:438–443. 10.1089/zeb.2017.1446 [DOI] [PubMed] [Google Scholar]
- Zelditch ML, Swiderski DL, Sheets HD, Fink WL (2004) Geometric morphometrics for biologists. San Diego: Academic Press. [Google Scholar]
- Zhang Y, Bonnan A, Bony G, Ferezou I, Pietropaolo S, Ginger M, Sans N, Rossier J, Oostra B, LeMasson G, Frick A (2014) Dendritic channelopathies contribute to neocortical and sensory hyperexcitability in Fmr1/y mice. Nat Neurosci 17:1701–1709. 10.1038/nn.3864 [DOI] [PubMed] [Google Scholar]
- Zhou X, Panizzutti R, de Villers-Sidani É, Madeira C, Merzenich MM (2011) Natural restoration of critical period plasticity in the juvenile and adult primary auditory cortex. J Neurosci 31:5625–5634. 10.1523/JNEUROSCI.6470-10.2011 [DOI] [PMC free article] [PubMed] [Google Scholar]