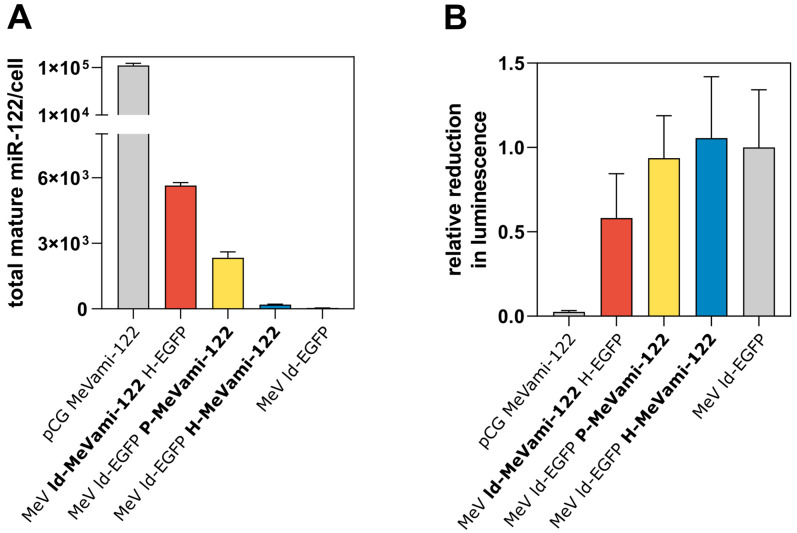
Figure 2.
Expression of MiRNA and functional target protein suppression. (A) qPCR-based absolute quantification of miR-122 in cells transfected or infected with MeVami-122-encoding vectors. Vero cells were either transfected with 0.5 μg/mL pCG MeVami-122 or infected with MeVami-122-encoding viruses at MOI 0.3 and harvested 30 h p.t./p.i. qPCR was carried out in technical triplicates. Mean values are plotted. Error bars indicate standard deviation. (B) Target protein suppression in cells transfected or infected with MeVami-122-encoding vectors. Vero cells were transfected with psiCHECK™-2-miRTS-122 and either co-transfected with pCG MeVami-122 or infected with MeVami-122-encoding viruses at MOI 0.3 (6 h p.t.). Thirty h p.t./p.i. Renilla- and firefly luciferase-mediated luminescence was measured. Relative response ratios (RRRs) were calculated using negative (mock) and positive (miR-122) controls. Mean values of biological replicates (n = 3) are plotted. Error bars indicate standard deviation. Values represent RRRs relative to the RRR of a control virus (MeV ld-EGFP).

