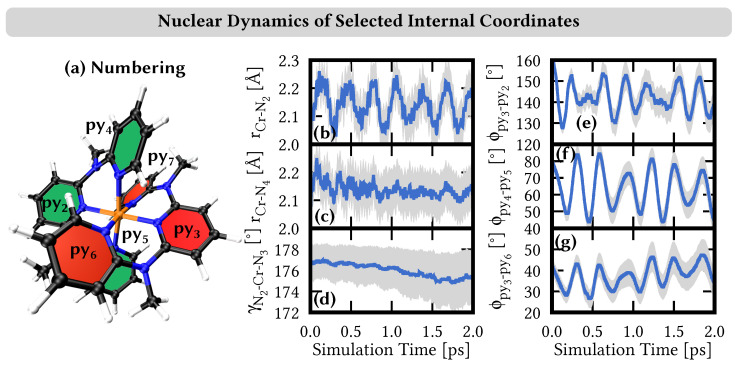
Figure 5.
(a) Numbering of pyridine rings, which also corresponds to the numbering of N atoms. (b–g) Time evolution of selected internal nuclear coordinates along the simulation. Blue line denotes the average of the coordinates of 1000 trajectories, while gray areas denote the areas of standard deviation. (b/c) Cr–N bonding distances rCr–N. (d) N–Cr–N angle . (e–g) Angle between the averaged planes through the atoms of the pyridine rings. Additional bond lengths and angles are presented in Section S4.

