Abstract
The global regulator CsrA (carbon storage regulator) of Escherichia coli is a small RNA binding protein that represses various metabolic pathways and processes that are induced in the stationary phase of growth, while it activates certain exponential phase functions. Both repression and activation by CsrA involve posttranscriptional mechanisms, in which CsrA binding to mRNA leads to decreased or increased transcript stability, respectively. CsrA also binds to a small untranslated RNA, CsrB, forming a ribonucleoprotein complex, which antagonizes CsrA activity. We have further examined the regulatory interactions of CsrA and CsrB RNA. The 5′ end of the CsrB transcript was mapped, and a csrB::cam null mutant was constructed. CsrA protein and CsrB RNA levels were estimated throughout the growth curves of wild-type and isogenic csrA, csrB, rpoS, or csrA rpoS mutant strains. CsrA levels exhibited modest or negligible effects of these mutations. The intracellular concentration of CsrA exceeded the total CsrA-binding capacity of intracellular CsrB RNA. In contrast, CsrB levels were drastically decreased (∼10-fold) in the csrA mutants. CsrB transcript stability was unaffected by csrA. The expression of a csrB-lacZ transcriptional fusion containing the region from −242 to +4 bp of the csrB gene was decreased ∼20-fold by a csrA::kanR mutation in vivo but was unaffected by CsrA protein in vitro. These results reveal a significant, though most likely indirect, role for CsrA in regulating csrB transcription. Furthermore, our findings suggest that CsrA mediates an intriguing form of autoregulation, whereby its activity, but not its levels, is modulated through effects on an RNA antagonist, CsrB.
To persist in the environment bacteria must be able to survive under poor or nonpermissive growth conditions. In Escherichia coli and related species, the transition from exponential growth into stationary-phase growth is accompanied by dramatic physiological changes, which produce cells that are more stress resistant, slower metabolizing, and better at scavenging nutrients (15, 17). To a large extent, these adaptations are brought about through changes in gene expression that are coordinated through global regulatory networks (13, 28).
Over the past several years, we have uncovered a unique global regulatory system in E. coli, Csr (for carbon storage regulator), which represses a variety of stationary-phase genes (reviewed in reference 30). The central component of this system is a 61-amino-acid RNA binding protein, CsrA. This protein inhibits glycogen biosynthesis and catabolism, gluconeogenesis, and biofilm formation, while it activates glycolysis, acetate metabolism, motility, and flagellum biosynthesis (32, 35, 43, 44, 47). Homologues of csrA exhibit a broad phylogenetic distribution in eubacteria (30) and have been found to repress stationary-phase genes of Pseudomonas fluorescens (7), as well as genes involved in plant pathogenesis in Erwinia carotovora (10) and mucosal invasion by Salmonella enterica serovar Typhimurium (1, 2).
The mechanism by which CsrA represses glycogen synthesis in E. coli has been elucidated in some detail. CsrA binds to the untranslated leader of glgCAP transcripts in the vicinity of the ribosome binding site, resulting in rapid mRNA decay (21, 22). This leads to a decrease in the intracellular levels of the glycogen biosynthetic enzymes and decreased synthesis of intracellular glycogen. Positive regulation of motility also involves a posttranscriptional mechanism. However, in this case, CsrA binds to and stabilizes the flhDC transcript. FlhD2C2 is a heterotetrameric DNA binding protein that activates the expression of genes involved in flagellum biosynthesis, motility, and chemotaxis (44). Thus, the CsrA protein is capable of posttranscriptional repression or activation, depending upon its particular RNA target.
A second component of Csr is a noncoding RNA molecule, CsrB, which binds tightly to ∼18 CsrA subunits, forming a large globular ribonucleoprotein complex (23). A highly repeated sequence element located in the loops of predicted CsrB hairpins may mediate CsrA binding. In vitro transcription-translation studies of glgCAP expression and in vivo csrB overexpression studies have indicated that CsrB RNA functions as an antagonist of CsrA, presumably by sequestering this protein (22, 23). Those studies revealed a mechanism for CsrB RNA that is thus far unique among the growing list of procaryotic regulatory RNA molecules (reviewed in reference 42).
Based on our previous studies, a model for the regulatory interactions in the Csr system was proposed, which predicts that the CsrA/CsrB ratio should at least in part determine the availability of free CsrA and, hence, its activity (23, 30). The present investigation was initiated to further evaluate this hypothesis and revealed an important new facet of the Csr system. CsrA activates the transcription of the csrB gene.
MATERIALS AND METHODS
Strains, plasmids, and phage.
The bacterial strains, plasmids, and phage used in this study are listed in Table 1.
TABLE 1.
Bacterial strains, plasmids, and phages used in this study
| Strain, plasmid, or phage | Description | Source or reference |
|---|---|---|
| Strains | ||
| DW18 | MC4100 Φ(glgA::lacZ) (λplacMu15) | 16 |
| BW3414 | ΔlacU169 rpoS(Am) | Barry Wanner |
| FDBW3414 | BW3414 Φ(flhDC′-′lacZ) | 43 |
| MG1655 | Prototrophic | Michael Cashel |
| TR1-5 MG1655a | csrA::kanR | 32 |
| RH MG1655 | rpoS::Tn10 | 44 |
| RG1-B MG1655 | csrB::cam | This study |
| CAG12079 | MG1655 (fuc3072::Tn10) | 38 |
| DH5α | supE44 ΔlacU169 (φ80lacZΔM15) hsdR17 relA1 recA1 endA1 gyrA96 thi-1 | 3 |
| DH5α λpir | DH5α λpir lysogen | Preeti Sundaram |
| DHB6521 | SM551λ InCh1 (Kanr) | 8 |
| SM551 (=DHB6501) | F− λ−λs Δlac(MS265) mel NalArsupF58 (=suIII+) | 8 |
| CF7789 | MG1655 ΔlacIZ (mluI) | Michael Cashel |
| KSB837 | CF7789 Δ(λatt-lom)::bla Φ(csrB-lacZ)1(Hyb) Ampr Kans | This study |
| KSGA18 | CF7789 Φ(glgA::lacZ) (λplacMu15) | This study |
| RG-19 BW3414 | pMEG-CSRB-CAM integrant | This study |
| Plasmids | ||
| pCSR10 | Minimal csrA in pUC19 | 32 |
| pCSRB-SF | Minimal csrB in pUC18 | 23 |
| pCSRB-CAM | csrB::cam in pUC18 | This study |
| pMEG-CSRB-CAM | csrB-knockout plasmid (csrB::cam) | This study |
| pCSRB8 | 1-kb csrB region in pUC18 | This study |
| pCBZ1 | pGE593 Φ(csrB-lacZ) | This study |
| pGE593 | Vector for lacZ transcriptional fusions; Ampr | 11 |
| pMAK705 | Source of cam marker | 14 |
| pMEG-011 | pir-dependent suicide vector | Preeti Sundaram |
| pSPT-18 | Transcription vector with SP6 and T7 promoters | Boehringer Mannheim |
| pTR151 | csrA::kanR cloned in pUC19 | 32 |
| pUC18 | Cloning vector; Ampr | 48 |
| pUC19 | Cloning vector; Ampr | 48 |
| pBR-CSRB1 | Minimal csrB in pBR322 | This study |
| Bacteriophages | ||
| P1vir | Strictly lytic P1 | Carol Gross |
| λDD628 | Contains csrB region | Fred Blattner |
| λInCh I | For genomic insertions; Kanr | 8 |
Strain designations containing the prefix TR or TR1-5, RG or RG1-B, or RH indicate that the mutant allele csrA::kanR, csrB::cam, or rpoS::Tn10, respectively, was introduced by P1vir transduction.
Media and growth conditions.
Luria-Bertani medium (25) was used without glucose for flhDC expression studies or with 0.2% glucose for routine cultures. Kornberg medium (1.1% K2HPO4, 0.85% KH2PO4, 0.6% yeast extract containing 0.5% glucose for liquid medium or 1% glucose for agar plates) was used to grow cultures for the glgA′-′lacZ translational fusion and csrB-lacZ transcriptional fusion expression assays, for RNA decay studies, and for assessment of intracellular glycogen in colonies by iodine staining (23). Medium for the selection of tetracycline-sensitive cells contained 0.5% tryptone, 0.5% yeast extract, 1% NaCl, 1% NaH2PO4 · H2O, ZnCl2 (100 μg/ml), fusaric acid (12 μg/ml), and chlorotetracycline (50 μg/ml) (24). The following antibiotics were added, as required, at the indicated concentrations: chloramphenicol, 20 μg/ml; kanamycin, 100 μg/ml; ampicillin, 100 μg/ml; tetracycline, 10 μg/ml; and rifampin, 200 μg/ml, except that ampicillin and kanamycin were used at 50 and 40 μg/ml, respectively, during the construction of the csrB-lacZ fusion. Cultures that were used for gene expression assays were grown at 37°C, with the exception of the flhDC′-′lacZ assays, which utilized cultures grown at 30°C.
Molecular biology and nucleotide sequencing.
Standard procedures were used for isolation of plasmid DNA and restriction fragments, restriction mapping, transformation and molecular cloning (23), and PCR amplification (36). Alternatively, plasmid DNA was purified using Qiagen plasmid cartridges as described by the manufacturer (Qiagen Inc., Valencia, Calif.). Dideoxynucleotide sequencing (37) was performed using the Sequenase version 2.0 kit under the conditions described by the manufacturer (U.S. Biochemical Corp., Cleveland, Ohio).
RNA preparation.
Total RNA was prepared using the Masterpure RNA purification kit (Epicentre Technologies, Madison, Wis.), quantified by UV absorbance at 260 and 280 nm, and examined for purity and rRNA integrity on formaldehyde agarose gels (36). RNA preparations were stored at −80°C in 70% ethanol.
Riboprobe synthesis.
A plasmid for the production of the csrB riboprobe, pSPT18-CsrB, was prepared by subcloning a 484-bp EcoRI-BamHI fragment from pCSRBSF into the multiple cloning site of pSPT18. The resulting plasmid was linearized with EcoRI. A digoxigenin (DIG)-labeled riboprobe was synthesized from 1 μg of linearized plasmid in a 20-μl reaction mixture, using SP6 RNA polymerase and the DIG-RNA labeling kit (SP6/T7), according to the manufacturer's instructions (Boehringer Mannheim, Indianapolis, Ind.). The synthesis reaction was carried out for 2 h at 37°C, at which time 2 μl of DNase I (RNase free) was added, incubation was continued for 15 min, and 2 μl of 0.2 M EDTA was added to terminate the reaction. The probe was stored at −80°C.
Northern blotting.
Total cellular RNA (5 μg) was separated on formaldehyde agarose (1%) gels, transferred overnight onto positively charged nylon membranes (Boehringer Mannheim) in 20× SSC (1× SSC is 0.15 M NaCl plus 0.015 M sodium citrate), and immobilized by baking at 120°C for 30 min (36). Prehybridization, hybridization to DIG-labeled riboprobes (2 μl of probe per 10 ml of prehybridization buffer), and membrane washing were conducted using the DIG Luminescent Detection kit for nucleic acids (Boehringer Mannheim), according to the manufacturer's instructions. The resulting chemiluminescent signals were detected using Kodak X-Omat-AR film and were quantified by phosphorimaging using a GS-525 phosphorimager (Bio-Rad, Hercules, Calif.) with a chemiluminescent screen. Isolated CsrB RNA (23) was used to generate a standard curve for CsrB signal quantitation. Care was taken that cellular CsrB transcript levels were quantified within the linear response range of the purified standard. Phosphorimaging data were analyzed using Molecular Analyst (version 2.1.2) software and Microsoft Excel. For RNA decay studies, strains were grown to the transition to stationary phase (A600 of 5.1 and 6.5 for the csrA wild type and mutant, respectively), rifampin (200 μg/ml [final concentration]) was added, and samples were collected at 0, 2, 4, 6, 8, and 12 min following rifampin addition. Samples (1.5 ml) were immediately centrifuged for 15 s at 15,000 × g, the spent medium was discarded, and the cells were frozen on dry ice-ethanol and stored at −80°C pending RNA isolation.
Western blotting.
Cells were treated with lysis buffer B (8 M urea, 0.1 M NaH2PO4, 10 mM Tris-HCl [pH 8.0]), gently vortexed for 30 min at room temperature, and centrifuged at 15,000 × g for 20 min, and the supernatant solution was collected. Proteins (5 μg/lane) were separated by electrophoresis on sodium dodecyl sulfate-polyacrylamide (15%) slab gels (19) and transferred by electroblotting at 4°C overnight in transfer buffer (25 mM Tris-HCl; 192 mM glycine, pH 8.3; 20% methanol) onto 0.2-μm-pore size nitrocellulose membranes (41). The resulting blots were rinsed in 1× phosphate-buffered saline, treated with blocking solution (0.3% casein containing 0.1% Tween 20), and incubated for 1 h with 5,000-fold-diluted (in blocking solution) rabbit antiserum raised against purified CsrA-CsrB complex (Research Genetics, Huntsville, Ala.). The membranes were washed twice (15 min each) with wash buffer (1× phosphate-buffered saline containing 0.3% Tween 20), incubated with sheep anti-rabbit horseradish peroxide conjugate for 1 h, and rinsed three times with wash buffer. Signal development used the CDP-Star system (Western-Star from Tropix, Bedford, Mass.) as recommended by the manufacturer. Purified recombinant CsrA protein (23) served as the standard for quantitation. Phosphorimaging and data analysis were conducted as described for Northern blotting.
Primer extension mapping.
Total RNA harvested from cultures grown in Kornberg medium to the transition to stationary phase of growth was used for mapping the 5′ end of csrB transcripts by primer extension. The primer CsrB PR.EXT was complementary to positions 225 to 248 of the previously published csrB sequence (Table 2) (23). The primer was labeled using T4 polynucleotide kinase and [γ-32P]ATP (3,000 Ci mmol−1; NEN Life Science Products Inc., Boston, Mass.), according to standard procedures (3). Approximately 15 ng of labeled primer was annealed to 10 μg of total RNA. cDNA was synthesized using 15 U of ThermoScript RT (BRL, Life Technologies, Gaithersburg, Md.) in 20-μl reaction mixtures that were incubated for 60 min at 48°C, and the reactions were terminated at 85°C for 5 min, according to the manufacturer's instructions (BRL, Life Technologies). To degrade RNA in the resulting RNA-DNA hybrids, the reaction mixtures were cooled, RNase H (2 U) was added, and the incubation continued at 37°C for 20 min. The same labeled primer was used to prepare a DNA sequence ladder, using pCSRB-8 as the template. Products were analyzed on standard sequencing gels (33).
TABLE 2.
Oligonucleotide primers used in this studya
| Primer | Sequence (5′ to 3′) |
|---|---|
| CsrB PR.EXT | CTGATGTTCACTTCGTTGTCTGACTCCCTG TCGACGAAGATAGA |
| CsrB5′-1 | GCATTTAGCCTCAAATCTTGCGG |
| CsrB3′-1 | CTCGAAGCTTCCGCAAAAAGAGCATCCAG |
| I-PCR-B-UP | CGAAGTCTTACAAGGCGCTTACAG |
| I-PCR-B-DN | ATTCCTGCTATCCTTCGCGGC |
| CAM6 | TACCTGTGACGGAAGATCACTTCG |
| CAM7 | ACGAATAGGCGGCGACAGGCGGAC |
Primers were purchased from Integrated DNA Technologies Inc., Coralville, Iowa.
Construction and characterization of a csrB null mutation.
The csrB gene was amplified from λ DD628 DNA by PCR using the primers CsrB 5′-1 and CsrB 3′-1 (Table 2). The resulting PCR product was gel purified and digested with HindIII and EcoRI, and the resulting 1,020-bp restriction fragment was subcloned into the EcoRI-HindIII sites of pUC18 to generate pCsrB8. This plasmid was linearized with MluI within the csrB gene and subjected to inverse PCR (20) using the primers I-PCR-B-UP, which begins at +1 relative to the start of transcription, and I-PCR-B-DN (Table 2), which begins at the first base immediately following the apparent Rho-independent termination sequence. The resulting PCR product was treated with T4 DNA polymerase to make it blunt ended. The chloramphenicol resistance gene (cam) was amplified from pMAK705 (14) using the phosphorylated primers CAM6 (forward) and CAM7 (reverse) (Table 2). The resulting PCR product was treated with T4 DNA polymerase and subcloned into the pCsrB8 inverse PCR product, resulting in a plasmid (pCsrB-CAM) in which cam replaced the DNA corresponding to the CsrB transcript. A 1.5-kb fragment obtained by partial HindIII-EcoRI digestion of pCsrB-CAM was gel purified, treated with T4 DNA polymerase to make it blunt ended, and subcloned into SmaI-treated pMEG-011. This involved electroporation of the ligation mixture into DH5-α λpir cells and selection of chloramphenicol-resistant colonies. The resulting plasmid, pMEG-CSRB-CAM, was isolated, characterized by restriction analysis, and electroporated into strain BW3414, in which it cannot replicate. Several Tetr and Camr integrants (single-crossover recombinants) were isolated. One of these, RG-I9 BW3414, was subjected to fusaric acid selection (24), and the resulting colonies were screened on plates containing chloramphenicol or tetracycline to identify Tets Camr double recombinants. The csrB::cam marker in the double recombinant RG1-B BW3414 was mapped to ∼63 min by P1vir transduction into CAG 12079 and was transduced into several other strains. This original csrB mutant and several secondary transductants were characterized by Southern and Northern hybridization, and their glycogen phenotypes were examined.
Southern hybridization.
Chromosomal DNA was subjected to Southern hybridization (36) following digestion with EcoRV, electrophoresis on 1% agarose gels, denaturation with NaOH, and transfer to nylon membranes. This DNA was immobilized by incubation at 120°C under vacuum for 30 min and was subsequently probed with [α-32]P randomly labeled DNA fragments generated from the 1.5-kb csrB::cam fragment of pCSRB-8 or the 0.88-kb cam gene from pMAK705. Probes were prepared using the Random Primed DNA labeling kit (U.S. Biochemicals). The membranes were washed, air dried, sealed in a heat-sealable bag (Kapak Corporation, Minneapolis, Minn.), and subjected to autoradiography for 24 h. To permit reprobing, the blot was stripped by boiling for 1 h in a 0.1% sodium dodecyl sulfate solution (36).
Construction of a chromosomal csrB-lacZ transcriptional fusion.
A 245-bp EcoRI-HincII fragment from pCSRB-8, containing the upstream regulatory region of csrB, was subcloned into the EcoRI-SmaI site of pGE593 (11). The resulting plasmid, pCBZ1, contained a csrB-lacZ transcriptional fusion. The csrB-lacZ fusion in pCBZ1 was moved into the E. coli CF7789 chromosome and stabilized there using the λInCh1 system, as previously described (8). The resulting strain, KSB837, which was chosen for subsequent studies was Ampr Kans and was no longer temperature sensitive. The presence of the csrB-lacZ transcriptional fusion was confirmed by PCR analysis, as recommended (8).
β-Galactosidase and total protein assays.
β-Galactosidase activity was assayed in 10-min reactions, as described previously (31). Total protein was measured by the bicinchoninic acid method using bovine serum albumin as the standard (39).
In vitro transcription-translation.
Effects of CsrA protein on csrB-lacZ expression were examined using S-30 extracts from a csrA mutant strain (TR1-5BW3414) and purified CsrA-CsrB complex, as previously described (23).
RESULTS
Mapping of the 5′ terminus of CsrB RNA.
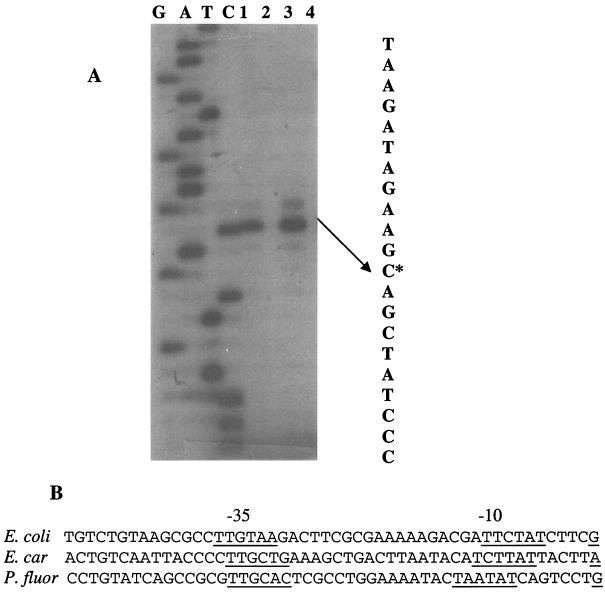
The 5′ terminus of CsrB RNA was determined by primer extension analysis. This information was sought to permit the precise construction of a csrB null mutant and to identify the csrB promoter. Total RNA was prepared and analyzed from four isogenic strains, which varied in genes that we suspected of influencing CsrB RNA levels (Fig. 1A). A single major extension product was observed from MG1655 and its rpoS (=katF) (27) derivative. This product was notably absent from both the csrA and the csrA rpoS double mutants. The 5′ end of the corresponding transcription resided at a G residue, 5 nucleotides downstream from the −10 box of an apparent ς70 promoter (Fig. 1B). Thus, the csrB transcript does not require rpoS or exhibit a ςS promoter (12), but the presence of the CsrB transcript in this analysis was dependent upon a functional csrA gene. Assuming that csrB transcription terminates precisely following the string of seven U residues of the apparent Rho-independent terminator sequence (23), this experiment indicates that CsrB is a 366-nucleotide RNA molecule.
FIG. 1.
Primer extension analysis of CsrB RNA. Reactions were conducted as described in Materials and Methods. (A) Lanes 1 through 4 show extension products from RNA isolated at the transition to stationary phase of growth from MG1655 and isogenic csrA, rpoS, or csrA rpoS mutants, respectively. The transcript initiation site is indicated by an asterisk. (B) Comparison of the apparent csrB promoter sequence with those of the homologue (rsmB) from E. carotovora (E. car.), a putative homologue from P. fluorescens (P. fluor.), and with the E.ς70 promoter consensus elements of E. coli.
Preparation and characterization of a csrB null mutant.
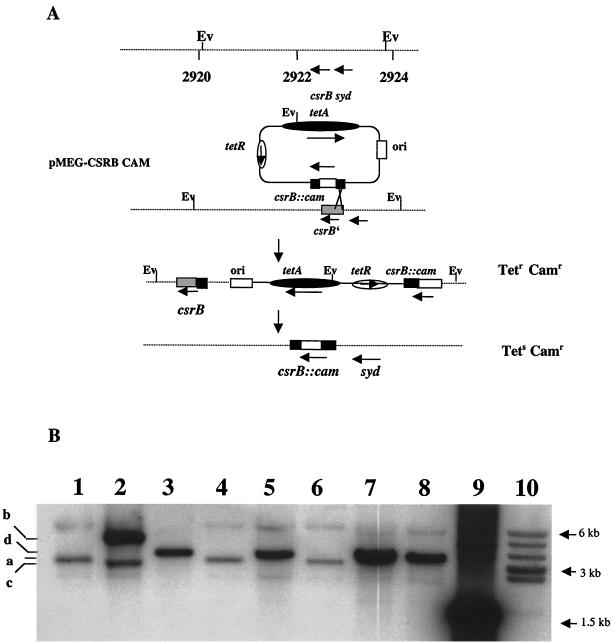
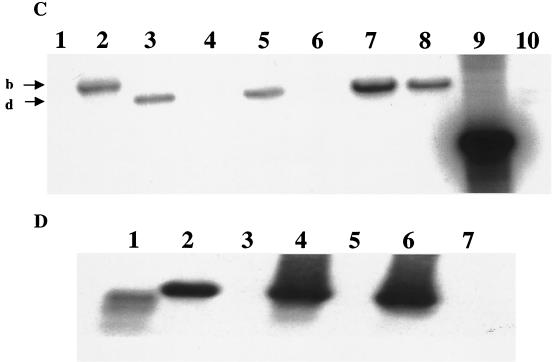
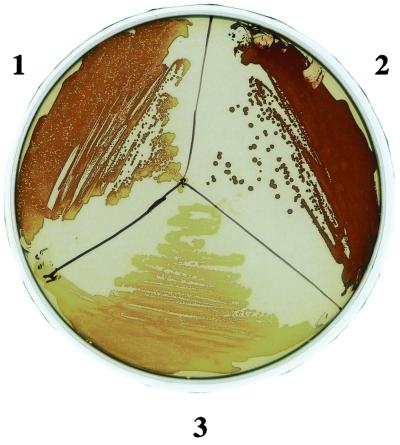
Using the above information, we replaced nucleotides +2 through +366 relative to the proposed start of transcription of the chromosomal csrB gene with the cam gene (Fig. 2A). Antibiotic resistance phenotypes and Southern hybridization of the csrB region of the parent, the intermediate plasmid integrant, and the doubly recombinant strains confirmed the replacement (Fig. 2B and C). Northern analysis also showed that CsrB RNA was not detectable in the csrB::cam strains (Fig. 2D). Previous studies had determined that multicopy expression of csrB results in the accumulation of intracellular glycogen, i.e., a phenotype similar to CsrA deficiency (23). Figure 3 shows that csrB disruption by allelic replacement results in a glycogen deficiency, i.e., a CsrA-excess phenotype (32).
FIG. 2.
Construction and characterization of a csrB null mutant. (A) Schematic representation of the strategy used for the replacement of the RNA-coding region of csrB, as described in Materials and Methods. Depicted are the chromosomal location of csrB, including the adjacent EcoRV (Ev) sites, the composition of the integration vector pMEG-CSRB-CAM, the structure of the integrant, and the final allelic replacement. Map coordinates are in kilobases (34). (B) Southern hybridization of csrB. Depicted are EcoRV-digested chromosomal DNA from the parental strain BW3414 (lane 1), the integrant RG-I9 BW3414 (lane 2), the first allelic replacement mutant RG1-B BW3414 (csrB::cam) (lane 3), MG1655 (lane 4), RG1-B MG1655 (csrB::cam) (lane 5), CAG 12079 (lane 6), RG1-B CAG12079-1 (csrB::cam) (lane 7), and RG1-B CAG 12079-2 (csrB::cam) (lane 8). Lanes 9 and 10 depict a csrB::cam-containing 1.5-kb BamHI-KpnI restriction fragment from pMEG-CSRB-CAM hybridized to the same probe and a prelabeled 1-kb DNA ladder, respectively. The identities of the hybridizing EcoRV restriction fragments from the csrB region of the parental strains (a), the integrant RGI-9 BW3414 (b and c), and the csrB::cam mutants (d) are indicated. (C) Reprobing of the chromosomal DNA. The blot shown in panel B was stripped and reprobed with a randomly labeled 0.88-kb cam marker from pMAK705. Note that DNA from parent strains fails to hybridize and that the fragments which hybridize to the cam probe are identical to fragments b and d of panel B. (D) Northern blot using a csrB riboprobe. Depicted are isolated csrB RNA (lane 1), total RNA from strains BW3414 (lane 2), RG1-B BW3414 (csrB::cam) (lane 3), MG1655 (lane 4), RG1-B MG1655 (csrB::cam) (lane 5), CAG12079 (lane 6), and RG1-B CAG12079-1 (csrB::cam) (lane 7).
FIG. 3.
Glycogen phenotypes of csrA and csrB mutants. Cultures of MG1655 (section 1), TR1-5MG1655 (csrA::kanR) (section 2), and RG1-B MG1655 (csrB::cam) (section 3) were streaked and grown overnight on Kornberg medium containing 1% glucose and stained with iodine vapor.
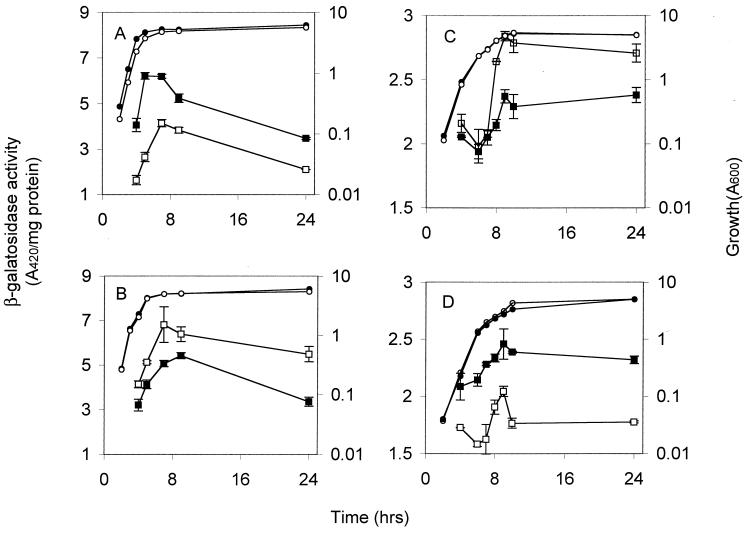
The effects of the csrB null mutation on representative genes that are repressed or activated by CsrA, i.e., chromosomal glgA′-′lacZ and flhDC′-′lacZ translational fusions, respectively, were quantitatively determined (Fig. 4). In each case, the effect of csrB disruption was opposite that of a csrA mutation (43, 47). Likewise, overexpression of csrB from the multicopy plasmid pCSRB-SF yielded opposite effects of csrB disruption in each case (Fig. 4). These experiments with the csrB null mutant provided further quantitative evidence of the antagonistic relationship of csrA and csrB that was previously proposed (23).
FIG. 4.
Effects of the csrB null mutation and csrB overexpression on the expression of chromosomally encoded glgA′-′lacZ and flhDC′-′lacZ translational fusions. β-Galactosidase activities expressed from glgA′-′lacZ in strains KSGA18 (▪) and RGKSGA18 (csrB::cam) (□) (A) and in strains KSGA18[pUC18] (▪) and KSGA18[pCsrB-SF] (□) (B) are shown. β-Galactosidase activities from flhDC′-′lacZ in strains FDBW3414 (▪) and RGFDBW3414 (csrB::cam) (□) (C) and in strains FDBW3414[pBR322] (▪) and FDBW3414[pBR-CSRB1] (□) (D) are shown. In each panel, growth (A600) of the respective strains is depicted by open or shaded circles. Error bars depict the standard deviations of triplicate reactions conducted on a single culture at each time point. This experiment was repeated in its entirety, with essentially identical results.
CsrB RNA and CsrA protein levels during growth.
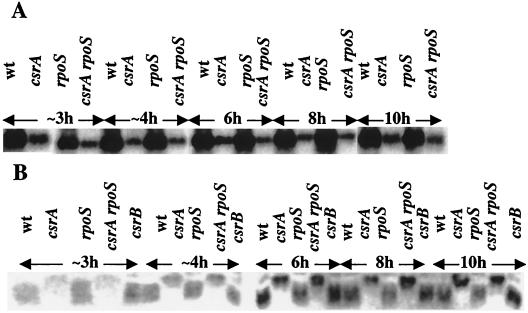
To examine potential regulatory interactions of CsrB RNA and CsrA protein, their relative levels were determined during the growth curve using Northern and Western blotting, respectively. Figure 5 depicts chemiluminescent images of the CsrB and CsrA signals from a series of strains that differed in csrA, csrB, and/or rpoS genes. The most striking observation, apparent by direct inspection of the blots, and in agreement with primer extension studies (Fig. 1), was that CsrB RNA levels were much lower in csrA and csrA rpoS mutants throughout growth (Fig. 5A). The rpoS knockout alone exhibited weak or negligible effects on CsrB RNA levels. CsrA protein levels (Fig. 5B) were not greatly affected by any of the mutations, although they showed a moderate decrease (≤2-fold) in the csrA::kanR mutants in early to mid-exponential phase. The latter result was possible to obtain because the transposon insertion leaves ∼80% of the coding region intact (32), yielding an inactive and slightly larger mutant protein that cross-reacts with CsrA antiserum.
FIG. 5.
Northern and Western analyses of CsrB RNA and CsrA protein. Strains were grown in Kornberg medium and harvested through the growth curve at the times indicated. (A) A CsrB-specific riboprobe was used to detect CsrB RNA from MG1655 and isogenic csrA, rpoS, and csrA rpoS mutants. (B) Western analysis was used to detect CsrA protein from MG1655 and csrA, rpoS, csrA rpoS, and csrB mutants. Both the Northern and Western blot results were obtained by phosphorimage analysis. Note that the ∼3- and ∼4-h samples of each strain were actually harvested when cultures had reached 0.3 and 1.0 A600, respectively.
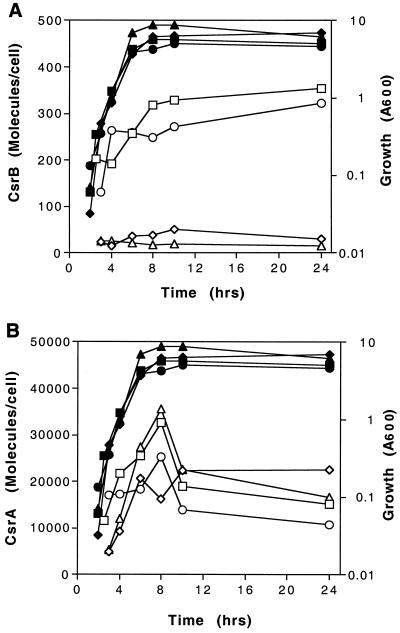
Quantitative examination of the data shown in Fig. 5, and those obtained from a second, similar experiment, revealed several reproducible trends (Fig. 6; Table 3). First, CsrB RNA levels were decreased ∼10-fold upon disruption of the csrA gene. Second, the CsrA protein exhibited modest accumulation (approximately two- to fourfold) as the cultures approached and entered the stationary phase of growth. Third, CsrA levels exhibit generally modest or negligible (≤2-fold) effects of any mutations. This suggests that RpoS, CsrB, and CsrA play either minor or negligible roles as trans-acting factors in determining the levels of the CsrA protein. Fourth, no striking variation in the CsrA/CsrB ratio was noted during the growth curves of the parent or rpoS mutant. The experiments depicted in Table 3 indicated that 16 to 32% or 14 to 35% of CsrA protein may be bound to CsrB RNA at various times in the growth curve of MG1655 or its rpoS mutant, respectively, given that ∼18 CsrA subunits occupy a single CsrB molecule (23). The remaining ∼65 to 85% of the protein should be available to interact with other RNA molecules.
FIG. 6.
Cellular concentrations of CsrB RNA (A) and CsrA protein (B) during growth. Cultures were grown in Kornberg medium containing 0.5% glucose, and CsrB RNA and CsrA protein were quantified by Northern or Western blotting, respectively, as described in Materials and Methods. The symbols represent MG1655 (□) and its isogenic mutants defective in csrA (⧫), rpoS (○), csrA rpoS (▵), and csrB (▿). Open and closed symbols represent molecules and growth (A600), respectively. The number of molecules per cell was calculated assuming 5.85 × 10⁻¹⁴ g of RNA and 1.56 × 10⁻¹³ g of total protein per cell (29) and using the molecular masses of 6,857 Da for CsrA protein and 126,845 Da for CsrB RNA.
TABLE 3.
CsrA/CsrB ratios during growtha
| Time (h) | MG1655
|
TR1-5 MG1655 (csrA::kanR)
|
RH MG1655 (rpoS::Tn10)
|
TR RH MG1655 (csrA::kanR rpoS::Tn10)
|
||||||||||
|---|---|---|---|---|---|---|---|---|---|---|---|---|---|---|
| CsrB RNA | CsrA protein | Ratio A/B | % CsrA boundb | CsrB RNA | CsrA protein | Ratio A/B | CsrB RNA | CsrA protein | Ratio A/B | % CsrA bound | CsrB RNA | CsrA protein | Ratio A/B | |
| 3 | 200 | 11,500 | 58 | 31 | 23 | 4,900 | 213 | 130 | 17,000 | 131 | 14 | 25 | 5,200 | 208 |
| 4 | 190 | 22,000 | 116 | 16 | 14 | 9,300 | 664 | 260 | 17,000 | 65 | 28 | 26 | 12,000 | 462 |
| 6 | 260 | 26,000 | 100 | 18 | 35 | 21,000 | 600 | 260 | 18,000 | 70 | 26 | 22 | 27,000 | 1,230 |
| 8 | 320 | 33,000 | 97 | 18 | 38 | 16,000 | 421 | 250 | 25,000 | 100 | 18 | 17 | 36,000 | 2,111 |
| 10 | 330 | 19,000 | 57 | 32 | 51 | 22,000 | 431 | 270 | 14,000 | 52 | 35 | 19 | 22,000 | 1,180 |
CsrA protein and CsrB RNA values are calculated as molecules per cell, assuming 1.56 × 10⁻¹³ g of total protein and 5.85 × 10⁻¹⁴ g of RNA are present per cell (29) and using molecular masses of 6,857 Da and 126,845 Da for the CsrA protein and CsrB RNA, respectively.
The calculation to determine the % CsrA bound to CsrB under a given condition assumes that CsrB molecules are fully occupied by 18 CsrA subunits (23). No such values are shown for the csrA mutant strains, because the mutant CsrA protein produced in these strains, while cross-reactive with the α-CsrA antibody, is inactive.
Stability of CsrB RNA.
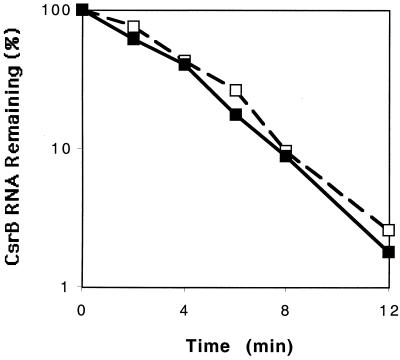
The only striking effect observed in the above experiments was the 10-fold decrease in steady-state levels of CsrB RNA in the csrA mutants. Previously, it was noted that CsrA forms a large globular ribonucleoprotein complex with CsrB RNA, which in theory could protect it against nucleolytic attack (23). Consequently, the chemical decay rate of CsrB RNA was examined by Northern analysis of RNA from rifampin-treated cultures (Fig. 7). The essentially identical stabilities of CsrB transcripts in the csrA wild-type and mutant strains (half-life, ∼2 min) indicated that increased turnover cannot account for the CsrB deficiency in csrA mutants.
FIG. 7.
Chemical decay curve of CsrB RNA. Cultures were grown to the transition to stationary phase, rifampin was added, and samples were collected at 0, 2, 4, 6, 8, and 12 min following rifampin addition. CsrB RNA was quantified by Northern hybridization and phosphorimage analysis, as described in Materials and Methods. Values for CsrB RNA in MG1655 (□) or its csrA mutant (⧫) are expressed as percentages of the value at 0 min in the respective strain. A half-life for CsrB of ∼2 min was determined in each strain. This experiment was repeated, with similar results; a half-life of ∼2 min was observed in the csrA wild-type and mutant strains.
Effect of csrA on the in vivo and in vitro expression of csrB.
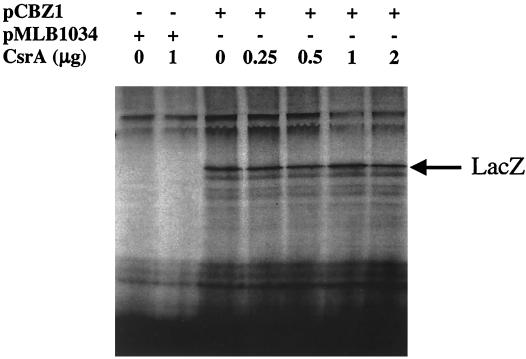
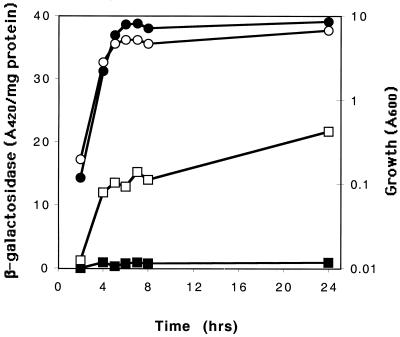
To determine whether transcription of the csrB gene is altered by csrA, a chromosomally borne csrB-lacZ transcriptional fusion containing the region from −242 to +4 bp, relative to the transcriptional start of csrB, was prepared and tested for expression in csrA wild-type and mutant strains. This fusion construct contained the distal end of syd, the complete 211 bp of the upstream flanking region of csrB, and the first 4 nucleotides of the RNA template of csrB, which does not overlap with any apparent CsrA binding sequence (23). Previous experiments had demonstrated that csrA does not affect the expression of the wild-type lacZ gene (47). Thus, the transcript originating from this fusion should have no capacity for CsrA binding, and any observed effect of csrA on this gene fusion should be attributable to transcriptional regulation of csrB. In fact, the specific β-galactosidase activity from this gene fusion was strongly dependent upon csrA and exhibited a decrease of ∼20-fold in the csrA::kanR mutant (see Fig. 9). This result could be explained by only two general possibilities. First, CsrA may regulate csrB transcription directly, e.g., by binding to csrB DNA. This was considered unlikely, since in vitro experiments had previously revealed that CsrA binds to a glgC runoff transcript, but not to double stranded DNA encompassing the same region (discussed in reference 30). The more plausible explanation was that CsrA activates csrB transcription indirectly, e.g., by posttranscriptionally regulating a transcription factor for csrB. These two possibilities were examined by monitoring the in vitro transcription-translation of pCBZ1-encoded csrB-lacZ. This plasmid contains the csrB-lacZ fusion that was crossed into the chromosome and examined above (Fig. 8). Furthermore, the expression of this gene fusion from pCBZ1 in vivo was also highly activated by csrA (data not shown). While this csrB-lacZ fusion was expressed in vitro, this expression was not stimulated by the addition of CsrA (Fig. 9). Control experiments revealed that the same CsrA protein preparation and S-30 extract were fully active in the reconstitution of glg gene repression and flhDC′-′lacZ activation (data not shown). Thus, this experiment strongly suggests that CsrA does not regulate csrB transcription by binding to csrB DNA.
FIG. 9.
In vitro transcription-translation of the csrB-lacZ transcriptional fusion of pCBZ1. Reaction mixtures (35 μl) contained 2 μg of the cloning vector, pMLB1034, or pCBZ1 plasmid DNA and were conducted in the absence or presence of CsrA protein (provided as the CsrA-CsrB complex), as indicated, in an S-30 extract prepared from TR1-5BW3414 (csrA::kanR). One microgram of CsrA protein is equivalent to 0.15 nmol of the monomer. The position of β-galactosidase (LacZ) was identified using an unlabeled protein standard.
FIG. 8.
Effects of csrA on the expression of a csrB-lacZ transcriptional fusion. Strains KSB837(csrB-lacZ) and TR1-5KSB837(csrB-lacZ csrA::kanR) were grown in Kornberg medium containing 0.5% glucose. Specific β-galactosidase activities for KSB837 and TR1-5KSB837 are shown as open and filled squares, respectively. Growth (A600) of these two strains is shown as open and filled circles, respectively. The data shown depict the averages of results from duplicate assays on a single culture at each time point. This experiment was repeated in its entirety with essentially identical results; specific β-galactosidase activity was ∼20-fold higher in the csrA wild-type strain.
DISCUSSION
The CsrA protein and CsrB RNA constitute a global regulatory system that has profound effects on physiology and carbon metabolism in E. coli. Several studies utilizing both in vivo and in vitro approaches culminated in the development of a model for Csr, in which the relative concentration of CsrB, an RNA molecule and antagonist of CsrA, was proposed to determine the availability of free CsrA protein in the cell (30). CsrA, in turn, has been shown to directly regulate gene expression posttranscriptionally by selectively binding to mRNAs and either decreasing or increasing their stability (21, 22, 43). The present investigation was initiated primarily to gain information on the CsrA/CsrB ratio that exists in the cell and its response to genetic and physiological influences.
The most striking or unexpected observation of this study was that CsrA activates csrB expression. Since CsrB RNA binds to CsrA and thus sequesters this protein in the cell, this should permit CsrA to indirectly modulate its own activity. Furthermore, a relatively short half-life was observed for CsrB RNA in the present study (∼2 min). This is similar to the half-life of a typical mRNA (reviewed in references 6 and 18), and is significantly shorter than that of a typical tRNA or various other untranslated small RNA molecules of E. coli (reviewed in reference 42). Studies of mRNA decay have revealed that the half-life of a message limits the rate at which a shift in gene expression can occur; a shorter half-life permits a more rapid response (discussed in reference 46). Similarly, the half-life of the CsrB transcript must confer the capacity to alter CsrB RNA levels rapidly, in response to factors that affect csrB transcription. Based on these observations, we envisage a homeostatic mechanism for Csr, whereby CsrA activity is modulated by its own effects on csrB expression. Given such a system, additional regulatory factors that affect csrA or csrB expression should also impact this mechanism. An advantage of such a system is that a modest reserve of CsrA activity could be made rapidly available upon demand, simply through decreased transcription of csrB. As previously discussed, the deployment of CsrB RNA, which binds to ∼18 CsrA subunits, offers a highly efficient means of modulating gene expression under conditions of limited resources (30).
Since only CsrA and its homologues had been found to regulate gene expression posttranscriptionally, through effects on RNA stability, it was somewhat surprising to find that csrB transcription is controlled by CsrA. Two distinct types of experiments support a transcriptional role for CsrA in csrB expression. First, the chemical decay rate of CsrB RNA was unaltered by csrA disruption. Since cellular levels of an RNA are determined solely by its rates of synthesis and turnover, this experiment revealed that CsrA must affect CsrB synthesis. Second, a csrB-lacZ fusion that contained the upstream region and only 4 nucleotides of the CsrB template (i.e., −243 to +4), and therefore produced a transcript that did not include a binding site for CsrA, nevertheless showed full CsrA regulation in vivo. The latter experiment further established that CsrA does not alter CsrB synthesis by an attenuation mechanism, such as that utilized by the trp RNA-binding attenuation protein of Bacillus subtilis (reviewed in reference 5), and therefore must affect transcript initiation. Furthermore, the effect of CsrA on csrB transcription apparently is mediated indirectly, because biologically active CsrA protein had no effect on the in vitro transcription-translation of the same csrB-lacZ fusion that exhibited strong activation via csrA in vivo. It should be emphasized that a novel molecular mechanism for CsrA need not be postulated to explain these observations. At the present time, our working hypothesis is that CsrA either posttranscriptionally activates the expression of a transcriptional activator or posttranscriptionally inhibits the expression of a transcriptional repressor of csrB. Either possibility seems equally likely, since CsrA has been shown to be capable of both types of activity. Nevertheless, we acknowledge that alternative explanations for these observations have not been formally eliminated. For example, CsrA could interact with a DNA-binding protein that is inactive or unavailable in the S-30 extracts, to directly regulate csrB transcription.
The present study further revealed that csrB and rpoS have modest or negligible effects on CsrA protein levels. Similarly, the levels of a mutant CsrA protein from the csrA::kanR disrupted gene were modestly lower than wild-type CsrA levels in early to mid-exponential phase. In the latter case, since a mutant gene product was examined, differences in protein stability could have influenced the outcome. Thus, it appears that the CsrA protein does not play a crucial role in regulating csrA gene expression. Previous in vivo studies in E. carotovora had indicated that the transcription of its highly conserved csrA homologue, rsmA, is partially dependent upon rpoS for expression (26). In contrast, genetic evidence indicates that csrA is not regulated by rpoS in E. coli. For example, in the present study csrB expression was observed to be independent of rpoS but highly dependent on csrA. Furthermore, previous studies had revealed that CsrA represses glgCAP expression, which likewise exhibits no effects of rpoS (16, 32). The Western analyses of the present study provide direct evidence that rpoS exhibits weak or negligible effect on CsrA levels. Nevertheless, as was observed in Erwinia, the steady-state level of the csrA message is partially dependent upon rpoS, particularly as cultures approach the transition to stationary phase (data not shown). Perhaps a compensatory mechanism may exist, whereby CsrA protein levels are maintained in E. coli under such conditions. It is presently unclear whether or not the previously observed effect of rpoS on the rsmA transcript of Erwinia results in a decrease in RsmA protein levels.
A csrB null mutant of E. coli was constructed and quantitatively examined for the first time in this study. Consistent with our model for Csr, this mutation provided further evidence that CsrB RNA can serve as an antagonist of CsrA in both repressed and activated systems. Nevertheless, the effects of csrB were modest, relative to those of csrA. This may reflect the fact that CsrB RNA levels are significantly lower than those of CsrA at any given point in the growth curve. Even considering that the CsrA-CsrB complex contains ∼18 CsrA protein subunits per CsrB RNA (23), only a relatively modest proportion (up to approximately one-third) of the CsrA protein subunits could be bound to CsrB in a wild-type strain of E. coli.
In the present study, CsrA protein accumulated approximately two- to fourfold as cultures approached the stationary phase. The ratio of CsrA to CsrB did not vary more than approximately twofold during the growth curve. However, this should not be taken to imply that CsrA levels or the CsrA/CsrB ratio remains fixed to this degree under all physiological conditions. CsrA levels were estimated to vary between 11,000 and 32,000 copies per wild-type cell in this study. Because CsrA binds to the leader of glgC mRNA, it may compete with ribosomes for binding to nascent transcripts and thereby inhibit the translation of this transcript (23). In comparison, previous studies have estimated that 45,000 or 72,000 ribosomes and 8,000 or 11,400 RNA polymerase molecules are present per cell at generation times of 30 or 24 min, respectively (reviewed in reference 9). In addition, CsrA levels are somewhat lower than those of the major nucleoid binding proteins HU and Fis (50,000 to 60,000), comparable to those of HNS (20,000 to 25,000), and greater than those of several other global regulatory proteins (4). Thus, the intracellular concentration of CsrA is sufficient to posttranscriptionally affect global gene expression patterns. The recent availability of genomic array technologies for E. coli (40, 45) will greatly facilitate further examination of the global regulatory role of CsrA. In considering such studies, it should be emphasized that CsrA homologues are known to play crucial roles in regulating bacterial virulence factors, both in animal and plant pathogens (1, 2, 10). Thus, we predict that a variety of functions of the Csr system in pathogenic as well as nonpathogenic strains of E. coli likewise may be relevant to host-microbe interactions.
ACKNOWLEDGMENTS
We gratefully acknowledge the help of Bangdong L. Wei with several aspects of this project, Gaojun Gui for preparation of pCsrB8, Thomas Weilbacher for assistance with RNA decay experiments, Preeti Sundaran and Dana Boyd for advice and materials used in the construction of the csrB mutant and for integration of lacZ fusions, respectively, and George Weinstock for providing pGE593.
This project was supported in part by grants from the National Science Foundation (MCB-9726197) and the National Institutes of Health (GM-59969).
REFERENCES
- 1.Altier C, Suyemoto M, Lawhon S D. Regulation of Salmonella enterica serovar Typhimurium invasion genes by csrA. Infect Immun. 2000;68:6790–6797. doi: 10.1128/iai.68.12.6790-6797.2000. [DOI] [PMC free article] [PubMed] [Google Scholar]
- 2.Altier C, Suyemoto M, Ruiz A I, Burnham K D, Maurer R. Characterization of two novel regulatory genes affecting Salmonella invasion gene expression. Mol Microbiol. 2000;35:635–646. doi: 10.1046/j.1365-2958.2000.01734.x. [DOI] [PubMed] [Google Scholar]
- 3.Ausubel F M, Brent R, Kingston R E, Moore D D, Seidman J G, Smith J A, Struhl K, editors. Current protocols in molecular biology. New York, N.Y: John Wiley & Sons; 1989. [Google Scholar]
- 4.Azam T A, Iwata A, Nishimura A, Ueda S, Ishihama A. Growth phase-dependent variation in protein composition of the Escherichia coli nucleoid. J Bacteriol. 1999;181:6361–6370. doi: 10.1128/jb.181.20.6361-6370.1999. [DOI] [PMC free article] [PubMed] [Google Scholar]
- 5.Babitzke P. Regulation of tryptophan biosynthesis: Trp-ing the TRAP or how Bacillus subtilis reinvented the wheel. Mol Microbiol. 1997;26:1–9. doi: 10.1046/j.1365-2958.1997.5541915.x. [DOI] [PubMed] [Google Scholar]
- 6.Belasco J. mRNA degradation in prokaryotic cells: an overview. In: Belasco J, Brawerman G, editors. Control of mRNA stability. San Diego, Calif: Academic Press; 1993. pp. 3–12. [Google Scholar]
- 7.Blumer C, Heeb S, Pessi G, Hass D. Global GacA-steered control of cyanide and exoprotease production in Pseudomonas fluorescens involves specific ribosome binding sites. Proc Natl Acad Sci USA. 1999;96:14073–14078. doi: 10.1073/pnas.96.24.14073. [DOI] [PMC free article] [PubMed] [Google Scholar]
- 8.Boyd D, Weiss S D, Chen J C, Beckwith J. Towards single copy gene expression systems making gene cloning physiologically relevant: Lambda InCh, a simple Escherichia coli plasmid-chromosome shuttle system. J Bacteriol. 2000;182:842–847. doi: 10.1128/jb.182.3.842-847.2000. [DOI] [PMC free article] [PubMed] [Google Scholar]
- 9.Bremmer H, Dennis P P. Modulation of chemical composition and other parameters of the cell by growth rate. In: Neidhardt F C, Curtiss III R, Ingraham J L, Lin E C C, Low K B, Magasanik B, Reznikoff W S, Riley M, Schaechter M, Umbarger H E, editors. Escherichia coli and Salmonella: cellular and molecular biology. 2nd ed. Washington, D.C.: ASM Press; 1996. pp. 1553–1569. [Google Scholar]
- 10.Cui Y, Chatterjee A, Liu Y, Dumenyo C K, Chatterjee A K. Identification of a global repressor gene, rsmA, of Erwinia carotovora subsp. Carotovora that controls extracellular enzymes, N-(3-oxohexanoyl)-l-homoserine lactone, and pathogenicity in soft-rotting Erwinia spp. J Bacteriol. 1995;177:5108–5115. doi: 10.1128/jb.177.17.5108-5115.1995. [DOI] [PMC free article] [PubMed] [Google Scholar]
- 11.Eraso J M, Weinstock G M. Anaerobic control of colicin E1 production. J Bacteriol. 1992;174:5101–5109. doi: 10.1128/jb.174.15.5101-5109.1992. [DOI] [PMC free article] [PubMed] [Google Scholar]
- 12.Espinosa-Urgel M, Chamizo C, Tormo A. A consensus structure for ςS-dependent promoters: microcorrespondence. Mol Microbiol. 1996;21:657–659. doi: 10.1111/j.1365-2958.1996.tb02573.x. [DOI] [PubMed] [Google Scholar]
- 13.Gottesman S. Bacterial regulation: global regulatory networks. Annu Rev Genet. 1984;18:415–441. doi: 10.1146/annurev.ge.18.120184.002215. [DOI] [PubMed] [Google Scholar]
- 14.Hamilton C M, Aldea M, Washburn B K, Babitzke P, Kushner S R. New method for generating deletions and gene replacements in Escherichia coli. J Bacteriol. 1989;171:4617–4622. doi: 10.1128/jb.171.9.4617-4622.1989. [DOI] [PMC free article] [PubMed] [Google Scholar]
- 15.Hengge-Aronis R. Regulation of gene expression during entry into stationary phase. In: Neidhardt F C, Curtiss III R, Ingraham J L, Lin E C C, Low K B, Magasanik B, Reznikoff W S, Riley M, Schaechter M, Umbarger H E, editors. Escherichia coli and Salmonella: cellular and molecular biology. 2nd ed. Washington, D.C.: ASM Press; 1996. pp. 1497–1512. [Google Scholar]
- 16.Hengge-Aronis R, Fischer D. Identification and molecular analysis of glgS, a novel growth-phase-regulated and rpoS-dependent gene involved in glycogen synthesis in Escherichia coli. Mol Microbiol. 1992;6:1877–1886. doi: 10.1111/j.1365-2958.1992.tb01360.x. [DOI] [PubMed] [Google Scholar]
- 17.Huisman G W, Siegele D A, Zambrano M M, Kolter R. Morphological and physiological changes during the stationary phase. In: Neidhardt F C, Curtiss III R, Ingraham J L, Lin E C C, Low K B, Magasanik B, Reznikoff W S, Riley M, Schaechter M, Umbarger H E, editors. Escherichia coli and Salmonella: cellular and molecular biology. 2nd ed. Washington, D.C.: ASM Press; 1996. pp. 1672–1682. [Google Scholar]
- 18.Kushner S R. mRNA decay. In: Neidhardt F C, Curtiss III R, Ingraham J L, Lin E C C, Low K B, Magasanik B, Reznikoff W S, Riley M, Schaechter M, Umbarger H E, editors. Escherichia coli and Salmonella: cellular and molecular biology. 2nd ed. Washington, D.C.: ASM Press; 1996. pp. 849–860. [Google Scholar]
- 19.Laemmli U K. Cleavage of structural proteins during the assembly of the head of bacteriophage T4. Nature. 1970;227:680–685. doi: 10.1038/227680a0. [DOI] [PubMed] [Google Scholar]
- 20.Ling M M, Robinson B H. Approaches to DNA mutagenesis: an overview. Anal Biochem. 1997;254:157–178. doi: 10.1006/abio.1997.2428. [DOI] [PubMed] [Google Scholar]
- 21.Liu M Y, Yang H, Romeo T. The product of the pleiotropic Escherichia coli gene csrA modulates glycogen biosynthesis via effects on mRNA stability. J Bacteriol. 1995;177:2663–2672. doi: 10.1128/jb.177.10.2663-2672.1995. [DOI] [PMC free article] [PubMed] [Google Scholar]
- 22.Liu M Y, Romeo T. The global regulator CsrA of Escherichia coli is a specific mRNA-binding protein. J Bacteriol. 1997;179:4639–4642. doi: 10.1128/jb.179.14.4639-4642.1997. [DOI] [PMC free article] [PubMed] [Google Scholar]
- 23.Liu M Y, Gui G, Wei B, Preston III J F, Oakford L, Yuksel U, Giedroc D P, Romeo T. The RNA molecule CsrB binds to the global regulatory protein CsrA and antagonizes its activity in Escherichia coli J. Biol Chem. 1997;272:17502–17510. doi: 10.1074/jbc.272.28.17502. [DOI] [PubMed] [Google Scholar]
- 24.Maloy S R, Nunn W D. Selection for loss of tetracycline resistance by Escherichia coli. J Bacteriol. 1981;145:1110–1112. doi: 10.1128/jb.145.2.1110-1111.1981. [DOI] [PMC free article] [PubMed] [Google Scholar]
- 25.Miller J H. Experiments in molecular genetics. Cold Spring Harbor, N.Y: Cold Spring Harbor Laboratory Press; 1972. [Google Scholar]
- 26.Mukherjee A, Cui Y, Ma W, Liu Y, Ishihama A, Eisenstark A, Chatterjee A K. RpoS (sigma-S) controls expression of rsmA, a global regulator of secondary metabolites, harpin, and extracellular proteins in Erwinia carotovora. J Bacteriol. 1998;180:3629–3634. doi: 10.1128/jb.180.14.3629-3634.1998. [DOI] [PMC free article] [PubMed] [Google Scholar]
- 27.Mulvey M R, Loewen P C. Nucleotide sequence of katF of Escherichia coli suggests KatF protein is a novel ς transcription factor. Nucleic Acids Res. 1989;17:9979–9991. doi: 10.1093/nar/17.23.9979. [DOI] [PMC free article] [PubMed] [Google Scholar]
- 28.Neidhardt F, Savageau M A. Regulation beyond the operon. In: Neidhardt F C, Curtiss III R, Ingraham J L, Lin E C C, Low K B, Magasanik B, Reznikoff W S, Riley M, Schaechter M, Umbarger H E, editors. Escherichia coli and Salmonella: cellular and molecular biology. 2nd ed. Washington, D.C.: ASM Press; 1996. pp. 1310–1324. [Google Scholar]
- 29.Neidhardt F C, Umbarger H E. Chemical composition of Escherichia coli, p 13–16. In: Neidhardt F C, Curtiss III R, Ingraham J L, Lin E C C, Low K B, Magasanik B, Reznikoff W S, Riley M, Schaechter M, Umbarger H E, editors. Escherichia coli and Salmonella: cellular and molecular biology. 2nd ed. Washington, D.C.: ASM Press; 1996. [Google Scholar]
- 30.Romeo T. Global regulation by the small RNA-binding protein CsrA and the non-coding RNA molecule CsrB. Mol Microbiol. 1998;29:1321–1330. doi: 10.1046/j.1365-2958.1998.01021.x. [DOI] [PubMed] [Google Scholar]
- 31.Romeo T, Black J, Preiss J. Genetic regulation of glycogen biosynthesis in Escherichia coli: in vivo effects of the catabolite repression and stringent response systems in glg gene expression. Curr Microbiol. 1990;21:131–137. [Google Scholar]
- 32.Romeo T, Gong M, Liu M Y, Brun-Zinkernagel A-M. Identification and molecular characterization of csrA, a pleiotropic gene from Escherichia coli that affects glycogen biosynthesis, gluconeogenesis, cell size, and surface properties. J Bacteriol. 1993;175:4744–4755. doi: 10.1128/jb.175.15.4744-4755.1993. [DOI] [PMC free article] [PubMed] [Google Scholar]
- 33.Romeo T, Preiss J. Genetic regulation of glycogen biosynthesis in Escherichia coli: in vitro effects of cyclic AMP and guanosine 5′-diphosphate 3′-diphosphate and analysis of in vivo transcripts. J Bacteriol. 1989;171:2773–2782. doi: 10.1128/jb.171.5.2773-2782.1989. [DOI] [PMC free article] [PubMed] [Google Scholar]
- 34.Rudd K E. Linkage map of Escherichia coli K-12, edition 10: the physical map. Microbiol Mol Biol Rev. 1998;62:985–1019. doi: 10.1128/mmbr.62.3.985-1019.1998. [DOI] [PMC free article] [PubMed] [Google Scholar]
- 35.Sabnis N A, Yang H, Romeo T. Pleiotropic regulation of central carbohydrate metabolism in Escherichia coli via the gene csrA. J Biol Chem. 1995;270:29096–29104. doi: 10.1074/jbc.270.49.29096. [DOI] [PubMed] [Google Scholar]
- 36.Sambrook J, Fritsch E F, Maniatis T. Molecular cloning: a laboratory manual. 2nd ed. Cold Spring Harbor, N.Y: Cold Spring Harbor Laboratory Press; 1989. [Google Scholar]
- 37.Sanger F, Nicklen S, Coulson A R. DNA sequencing with chain-terminating inhibitors. Proc Natl Acad Sci USA. 1977;74:5463–5467. doi: 10.1073/pnas.74.12.5463. [DOI] [PMC free article] [PubMed] [Google Scholar]
- 38.Singer M, Baker T A, Schnitzler G, Deischel S M, Goel M, Dove W, Jaacks K J, Grossman A D, Erickson J W, Gross C A. A collection of genetically linked alternating antibiotic resistance elements for genetic mapping of Escherichia coli. Microbiol Rev. 1989;53:1–24. doi: 10.1128/mr.53.1.1-24.1989. [DOI] [PMC free article] [PubMed] [Google Scholar]
- 39.Smith P K, Krohn R H, Hermanson G T, Mallie A K, Gartner F H, Provensano J D, Fujimoto E K, Goeke N M, Olson B J, Klenk D C. Measurement of protein using bicinchoninic acid. Anal Biochem. 1985;150:76–85. doi: 10.1016/0003-2697(85)90442-7. [DOI] [PubMed] [Google Scholar]
- 40.Tao H C, Bausch C, Richmond C, Blattner F R, Conway T. Functional genomics: expression analysis of Escherichia coli growing on minimal and rich media. J Bacteriol. 1999;181:6425–6440. doi: 10.1128/jb.181.20.6425-6440.1999. [DOI] [PMC free article] [PubMed] [Google Scholar]
- 41.Towbin H, Staehelin T, Gordon J. Electrophoretic transfer of proteins from polyacrylamide gels to nitrocellulose sheets: procedure and some applications. Proc Natl Acad Sci USA. 1979;76:4350–4354. doi: 10.1073/pnas.76.9.4350. [DOI] [PMC free article] [PubMed] [Google Scholar]
- 42.Wassarman K M, Zhang A, Storz G. Small RNAs in Escherichia coli. Trends Microbiol. 1999;7:37–45. doi: 10.1016/s0966-842x(98)01379-1. [DOI] [PubMed] [Google Scholar]
- 43.Wei B, Shin S, LaPorte D, Wolfe A J, Romeo T. Global regulatory mutations in csrA and rpoS cause severe central carbon stress in Escherichia coli in the presence of acetate. J Bacteriol. 2000;182:1632–1640. doi: 10.1128/jb.182.6.1632-1640.2000. [DOI] [PMC free article] [PubMed] [Google Scholar]
- 44.Wei B L, Brun-Zinkernagel A-M, Simecka J W, Prüβ B M, Babitzke P, Romeo T. Positive regulation of motility and flhDC expression by the RNA-binding protein CsrA of Escherichia coli. Mol Microbiol. 2001;40:245–256. doi: 10.1046/j.1365-2958.2001.02380.x. [DOI] [PubMed] [Google Scholar]
- 45.Wei Y, Lee J M, Smulski D R, LaRossa R A. Global impact of sdiA amplification revealed by comprehensive gene expression profiling of Escherichia coli. J Bacteriol. 2001;183:2265–2272. doi: 10.1128/JB.183.7.2265-2272.2001. [DOI] [PMC free article] [PubMed] [Google Scholar]
- 46.Williams D L, Sensel M, McTigue M, Binder R. Hormonal and developmental regulation of mRNA turnover. In: Belasco J, Brawerman G, editors. Control of mRNA stability. San Diego, Calif: Academic Press; 1993. pp. 161–197. [Google Scholar]
- 47.Yang H, Liu M Y, Romeo T. Coordinate genetic regulation of glycogen catabolism and biosynthesis in Escherichia coli via the CsrA gene product. J Bacteriol. 1996;178:1012–1017. doi: 10.1128/jb.178.4.1012-1017.1996. [DOI] [PMC free article] [PubMed] [Google Scholar]
- 48.Yanisch-Perron C, Vieira J, Messing J. Improved M13 phage cloning vectors and host strains: nucleotide sequences of the M13mp18 and pUC19 vectors. Gene. 1985;33:103–109. doi: 10.1016/0378-1119(85)90120-9. [DOI] [PubMed] [Google Scholar]


