Abstract
Widespread use of antibiotics has placed bacterial pathogens under intense pressure to evolve new survival mechanisms. Genomic analysis of 51,229 Mycobacterium tuberculosis (M. tuberculosis) clinical isolates has identified an essential transcriptional regulator, Rv1830, here named resR, as a frequent target of positive (adaptive) selection. resR mutants do not show canonical drug resistance or drug tolerance but instead shorten the post-antibiotic effect – meaning they enable M. tuberculosis to resume growth after drug exposure significantly faster than wildtype strains. We call this phenotype antibiotic resilience. ResR acts in a regulatory cascade with other transcription factors controlling cell growth and division, which are also under positive selection in clinical isolates of M. tuberculosis. Mutations of these genes are associated with treatment failure and the acquisition of canonical drug resistance.
Antibiotics are designed to kill bacteria by inhibiting biological processes essential for survival. Completely eliminating a population of bacteria with antibiotics is challenging even when the bacteria are nominally sensitive to the drug (1). There is a growing body of work defining the mechanisms beyond canonical resistance by which bacterial populations avoid clearance by antibiotics (2, 3). These include the formation of privileged subpopulations of drug-tolerant bacteria, as well as the acquisition of other traits that enhance bacterial survival, including variation in the cellular requirements for the target and alterations in drug penetration or efflux (2–4). We hypothesized that bacterial adaptation to antibiotics would be recorded as mutations in the genes associated with the most clinically relevant of these adaptive processes, and dissecting the targets of natural selection would reveal new mechanisms that enable bacteria to survive antibiotics in patients. Therefore, we sought to identify the evolutionary signatures of adaptation to antibiotics in M. tuberculosis, an obligate human pathogen that has remained one of the largest causes of mortality, despite facing months of antibiotic pressure in every treated patient and which, as a global population, has been under antibiotic selection since the introduction of streptomycin in 1944 (5).
Ongoing positive selection in Mtb population
When clinical M. tuberculosis isolates are sequenced, the specimen is typically not derived from a single colony but represents the bacterial population sampled from the patient. This population contains mutations arising from within-host evolution of the bacterium, which can be tracked by identifying unfixed mutations detected in deep sequencing (Fig. 1A) (6, 7). We reasoned that by looking at within-host evolution across very large numbers of clinical isolates, even in the absence of clinical metadata, we could identify genes that repeatedly acquire mutations (parallel evolution) within different patients that would mark processes under positive selection. Therefore, we assembled previously published whole-genome sequencing data from 51,229 M. tuberculosis clinical isolates (Fig. 1B) and used a mutation burden test and the ratio of nonsynonymous to synonymous mutations (dN/dS) to identify genes that are under positive selection in the M. tuberculosis population (Materials and Methods). We also identified intergenic regions (IGRs) that are highly enriched for mutations. As expected, genes and IGRs previously associated with drug resistance or tolerance are highly mutated and the genes have dN/dS ratios >1, indicative of positive selection (Fig. 1B, fig. S1). Interestingly, we also identified a second set of genes that show similar selective signals, but for which the selective pressures are unknown (Fig. 1B).
Fig. 1. Ongoing positive selection in the global Mtb population.
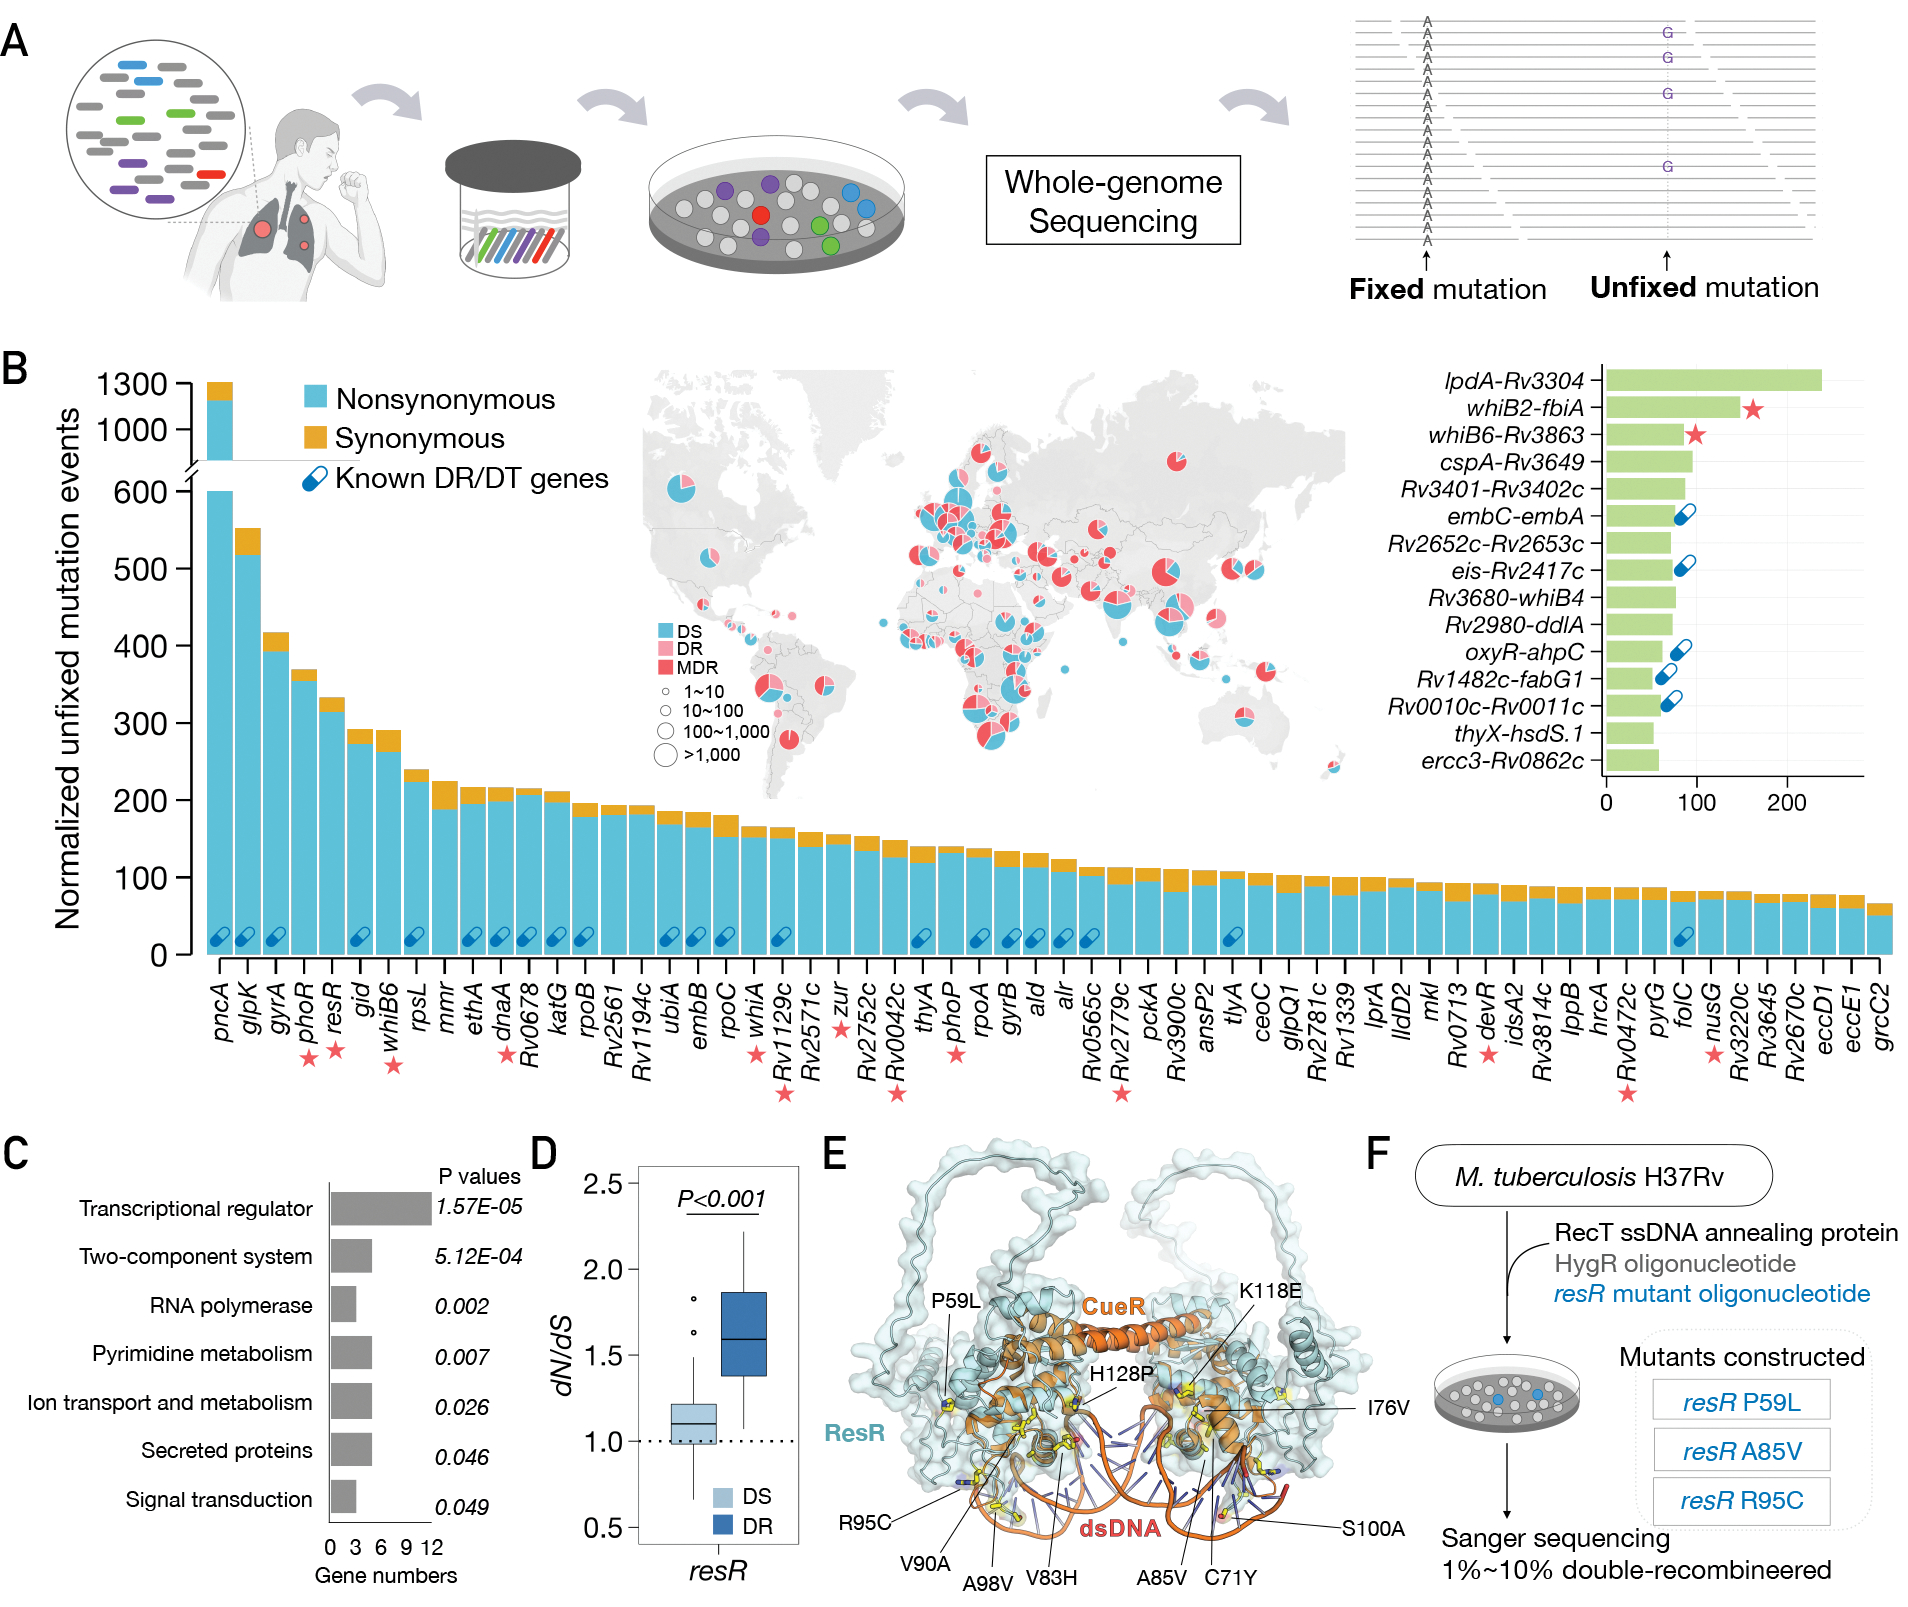
(A) Diagram of fixed and unfixed variants. (B) Genes and IGRs with signal of ongoing positive selection. Known drug-resistance (DR) or drug-tolerance (DT) genes are marked with capsule symbols. Red stars indicate transcriptional regulators. The map shows the geographic origin of the clinical Mtb isolates and their DR status; DT (drug-tolerance), MDR (multi-drug resistance). (C) Categories of genes under positive selection, with adjusted P values for enrichment. (D) dN/dS ratio of resR in DR and DS strains, P value by unpaired t test. (E) Structural model of the ResR dimer (cyan, predicted by Alphafold) aligned to MerR-family homolog CueR (orange) (49) in complex with duplex DNA with common ResR clinical mutations indicated (yellow). (F) Schematic of construction of mutations in the chromosomal copy of resR in Mtb.
Functional enrichment analysis indicated that the genes under selection are highly enriched for transcriptional regulators (12/60, P=1.57E-5, Fig. 1B, C). One of the most frequently mutated is resR (gene identifier: Rv1830), an essential gene that is predicted to be a merR-type regulator. We also found evidence of positive selection in an analysis of the fixed mutations in resR (dN/dS = 2.91); the pattern of mutation is very similar between unfixed and fixed mutations (fig. S2), suggesting that within-host selection leads to mutation fixation. Importantly, the dN/dS of resR is higher in drug-resistant strains compared with drug-sensitive strains (Fig. 1D), suggesting that resR mutations are associated with the evolution of drug resistance and is consistent with a recent study that resR mutations were associated with MDR-TB phenotype (8). Protein structural modeling indicates that most resR clinical mutations occur in the merR-type helix-turn-helix DNA binding domain with the most common mutations located at the interface between ResR and duplex DNA (Fig. 1E and fig. S2), where they could affect DNA binding affinity and the transcription of downstream genes.
resR mutants display “antibiotic resilience”
To investigate the functional consequence of resR mutations, we used oligo-mediated recombineering to make point-mutant strains by individually introducing three common clinical mutations (P59L, A85V and R95C respectively) into the chromosomal copy of resR in M. tuberculosis (H37Rv) (Fig. 1F). The resR mutations did not affect bacterial growth under standard or host-relevant carbon source conditions (fig. S3A, B). Given the association with drug resistance, which occurs through de novo chromosomal mutation in M. tuberculosis, we also assessed the effect of resR mutations on the bacterial mutation rate but did not find alterations (fig. S3C, Table S1). However, we noted that resR mutants are about 20% longer and about 5% wider than the wild-type cells (fig. S4), and have a thickened cell envelope (fig. S5), suggesting that mutations of resR have functional consequences on bacterial size control under standard growth conditions.
We next tested the effects of resR mutations on drug resistance by measuring minimum inhibitory concentration (MIC) for a panel of eight antibiotics including first-line, second-line and new anti-tuberculosis (TB) drugs (Fig. 2A). resR mutants and wild-type strains have very similar MIC profiles, with only subtle MIC shifts identified -- a small increase for isoniazid (INH, 0.01μg/mL to 0.02μg/mL) and minor decreases for rifampicin and ofloxacin (Fig. 2A, fig. S6). These MIC changes are far below the MIC for classification as drug-resistant (Fig. 2A)(9). We next assessed the effects of resR mutations on drug tolerance by performing time-kill analyses for the 8 antibiotics, using drug concentrations at 100-fold of the MICs. The resR mutants and wildtype strains show very similar time-kill dynamics although again there are subtle differences for some drugs (OFX, ETH and BDQ) at particular time points (Fig. 2B). The changes in the minimum duration of time to kill 99% of bacteria (MDK99) are less than 24 hours (Fig. 2B); previously characterized drug-tolerance mutants in M. tuberculosis prolong the MDK99 by more than 4 days (10).
Fig. 2. resR mutants showed faster recovery after drug exposure.
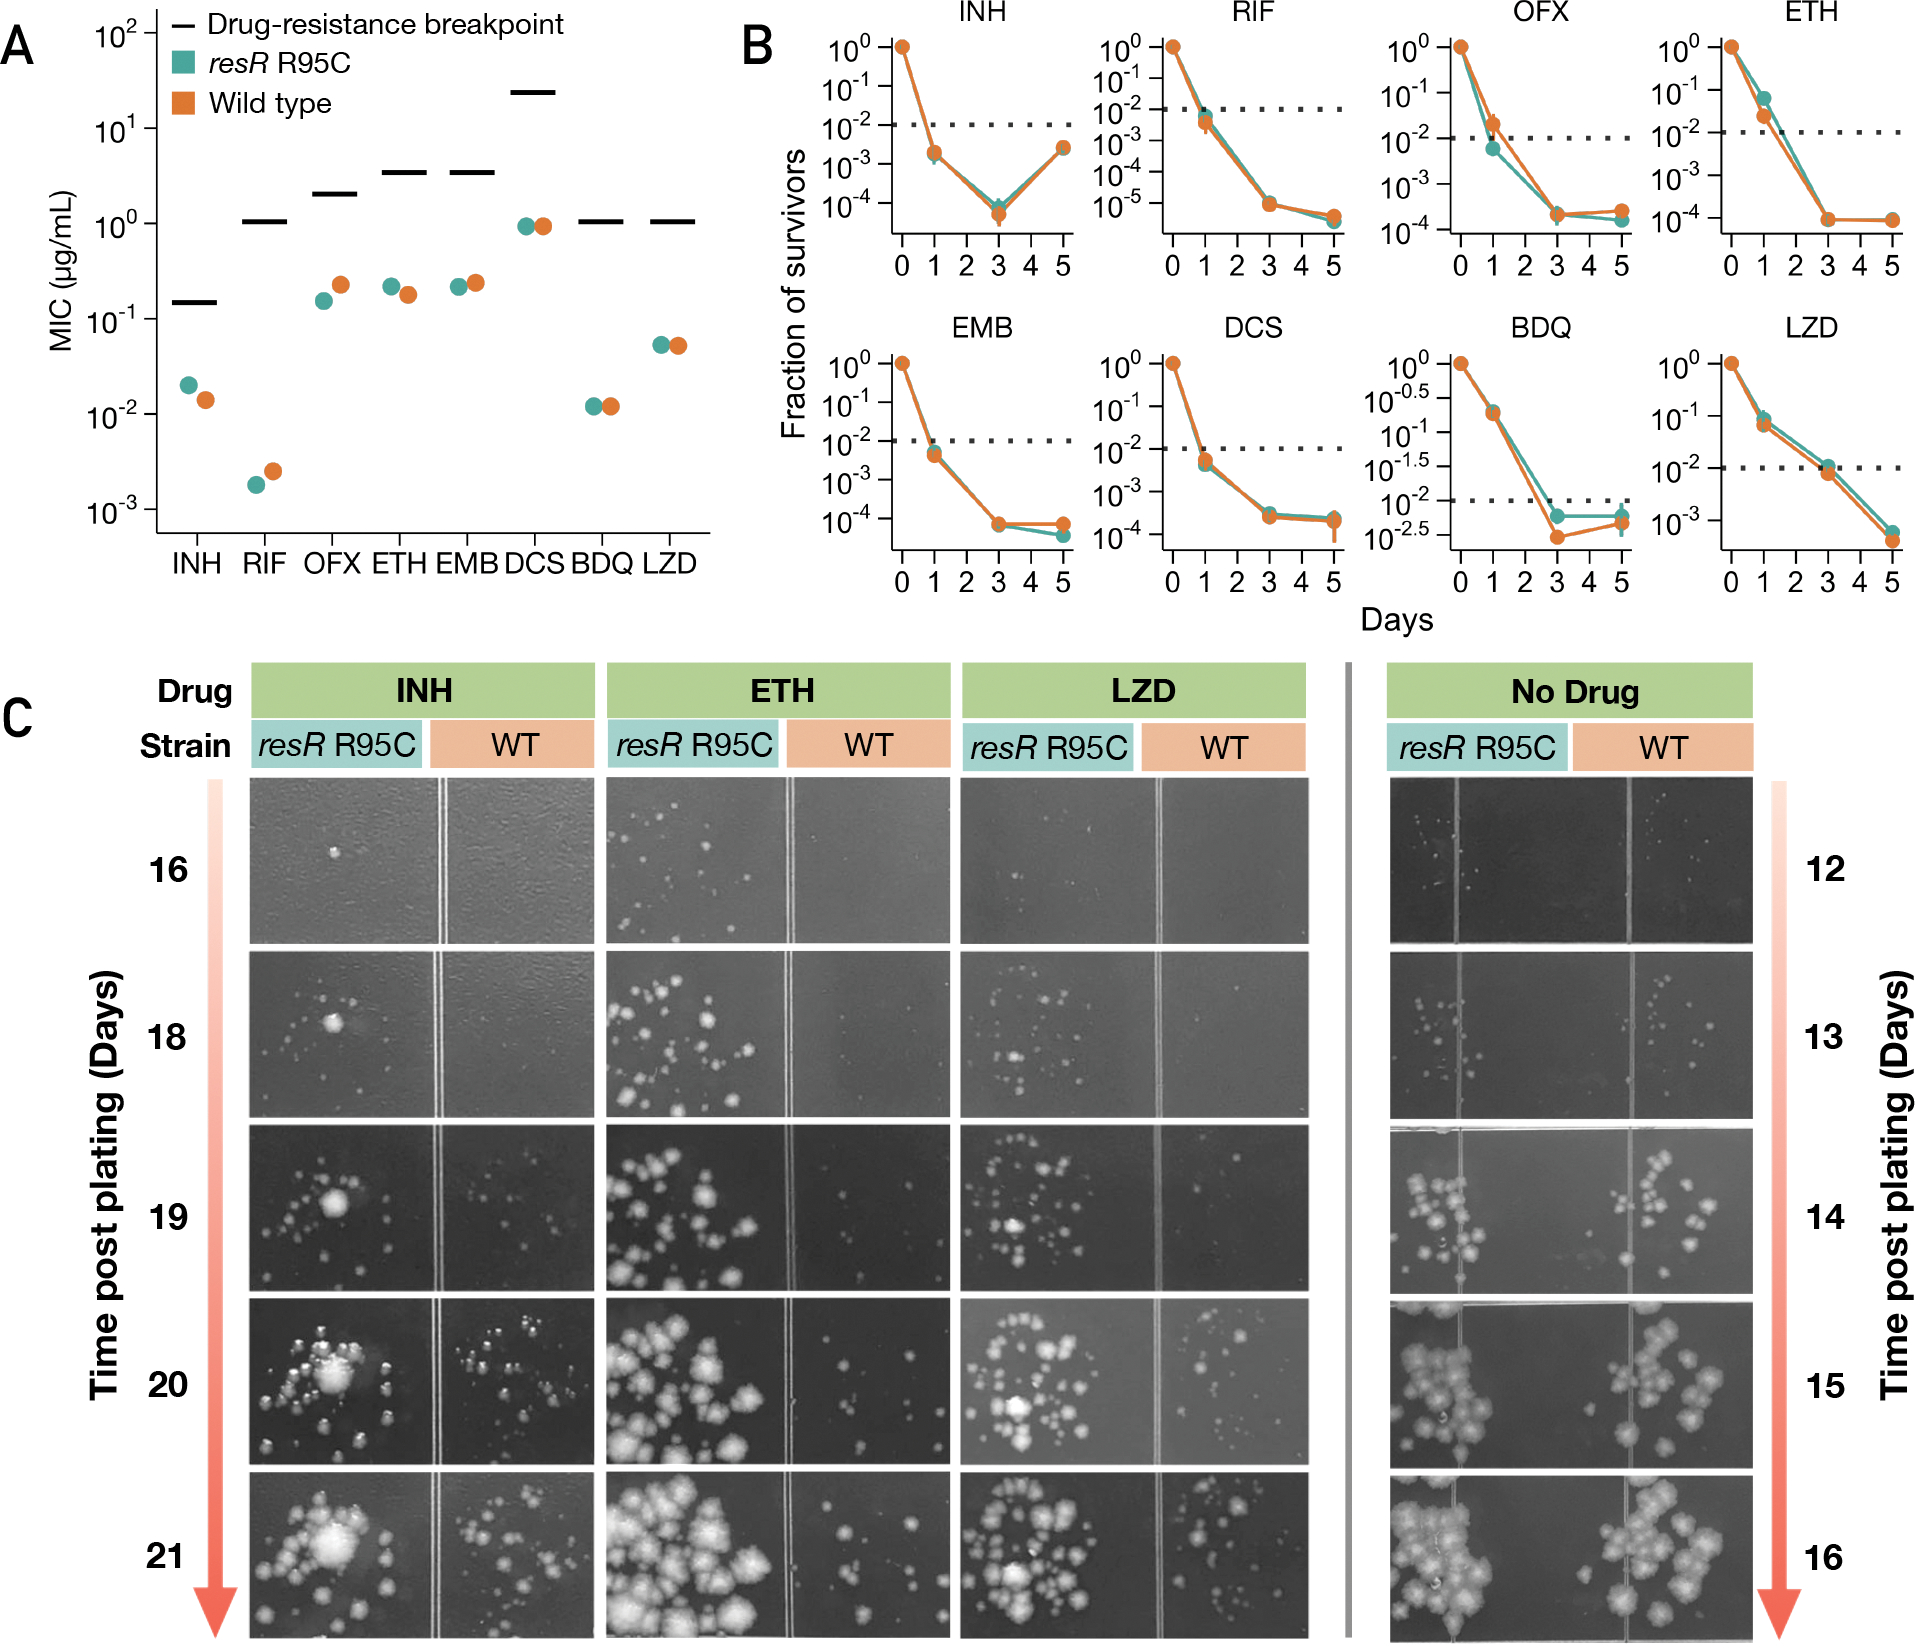
(A) MICs of resR mutants and wild type for 8 anti-TB drugs. INH: Isoniazid; RIF: Rifampicin; OFX: Ofloxacin; ETH: Ethionamide; EMB: Ethambutol; DCS: D-cycloserine; BDQ: Bedaquiline; LZD: Linezolid. Drug-resistance breakpoint is the drug concentration that defines clinical drug resistance. (B) Time-kill kinetics for 8 different drugs for resR mutant and wild-type Mtb strains. The concentration of each drug was 100-fold MIC. * symbol indicates statistical significance (P < 0.05) by unparied t test. (C) Representative images illustrating the post-antibiotic recovery dynamics of resR mutant (R95C) and wild-type (WT) Mtb strains.
In contrast to these modest changes in MIC and MDK99, in the time-kill assays, we observed a strong and unexpected drug phenotype that clearly distinguished resR mutants from the wild-type strains. After the cells were plated on drug-free media post antibiotic exposure, resR mutants formed visible colonies significantly earlier than the wild type (Fig. 2C). This early recovery phenotype of resR mutants was observed for all the 8 antibiotics tested while no difference in growth was seen in the absence of drug exposure (Fig. 2C, fig. S7). Using quantitative image analysis to track the growth of individual colonies over time (Fig. 3A, fig. S8) (11), we found that antibiotic treatment causes a 4.7~6.8 day delay in colony formation for wild-type M. tuberculosis; these delays are highly reproducible and characteristic for each drug (Fig. 3B). The resR mutants reduce the time to colony formation by 20~50% for all 8 drugs tested (Fig. 3B, C). The resR mutants also showed faster recovery when challenged by combinations of the first-line anti-TB drugs (fig. S9A, B, C). We calculated the growth dynamics of traced colonies over time and found that the expansion rate of visible colonies did not differ between WT and mutant cells (fig. S9D), suggesting that faster recovery occurred at early stages before colony appearance.
Fig. 3. Quantitative colony-size tracking indicated shortened PAE in resR mutants.
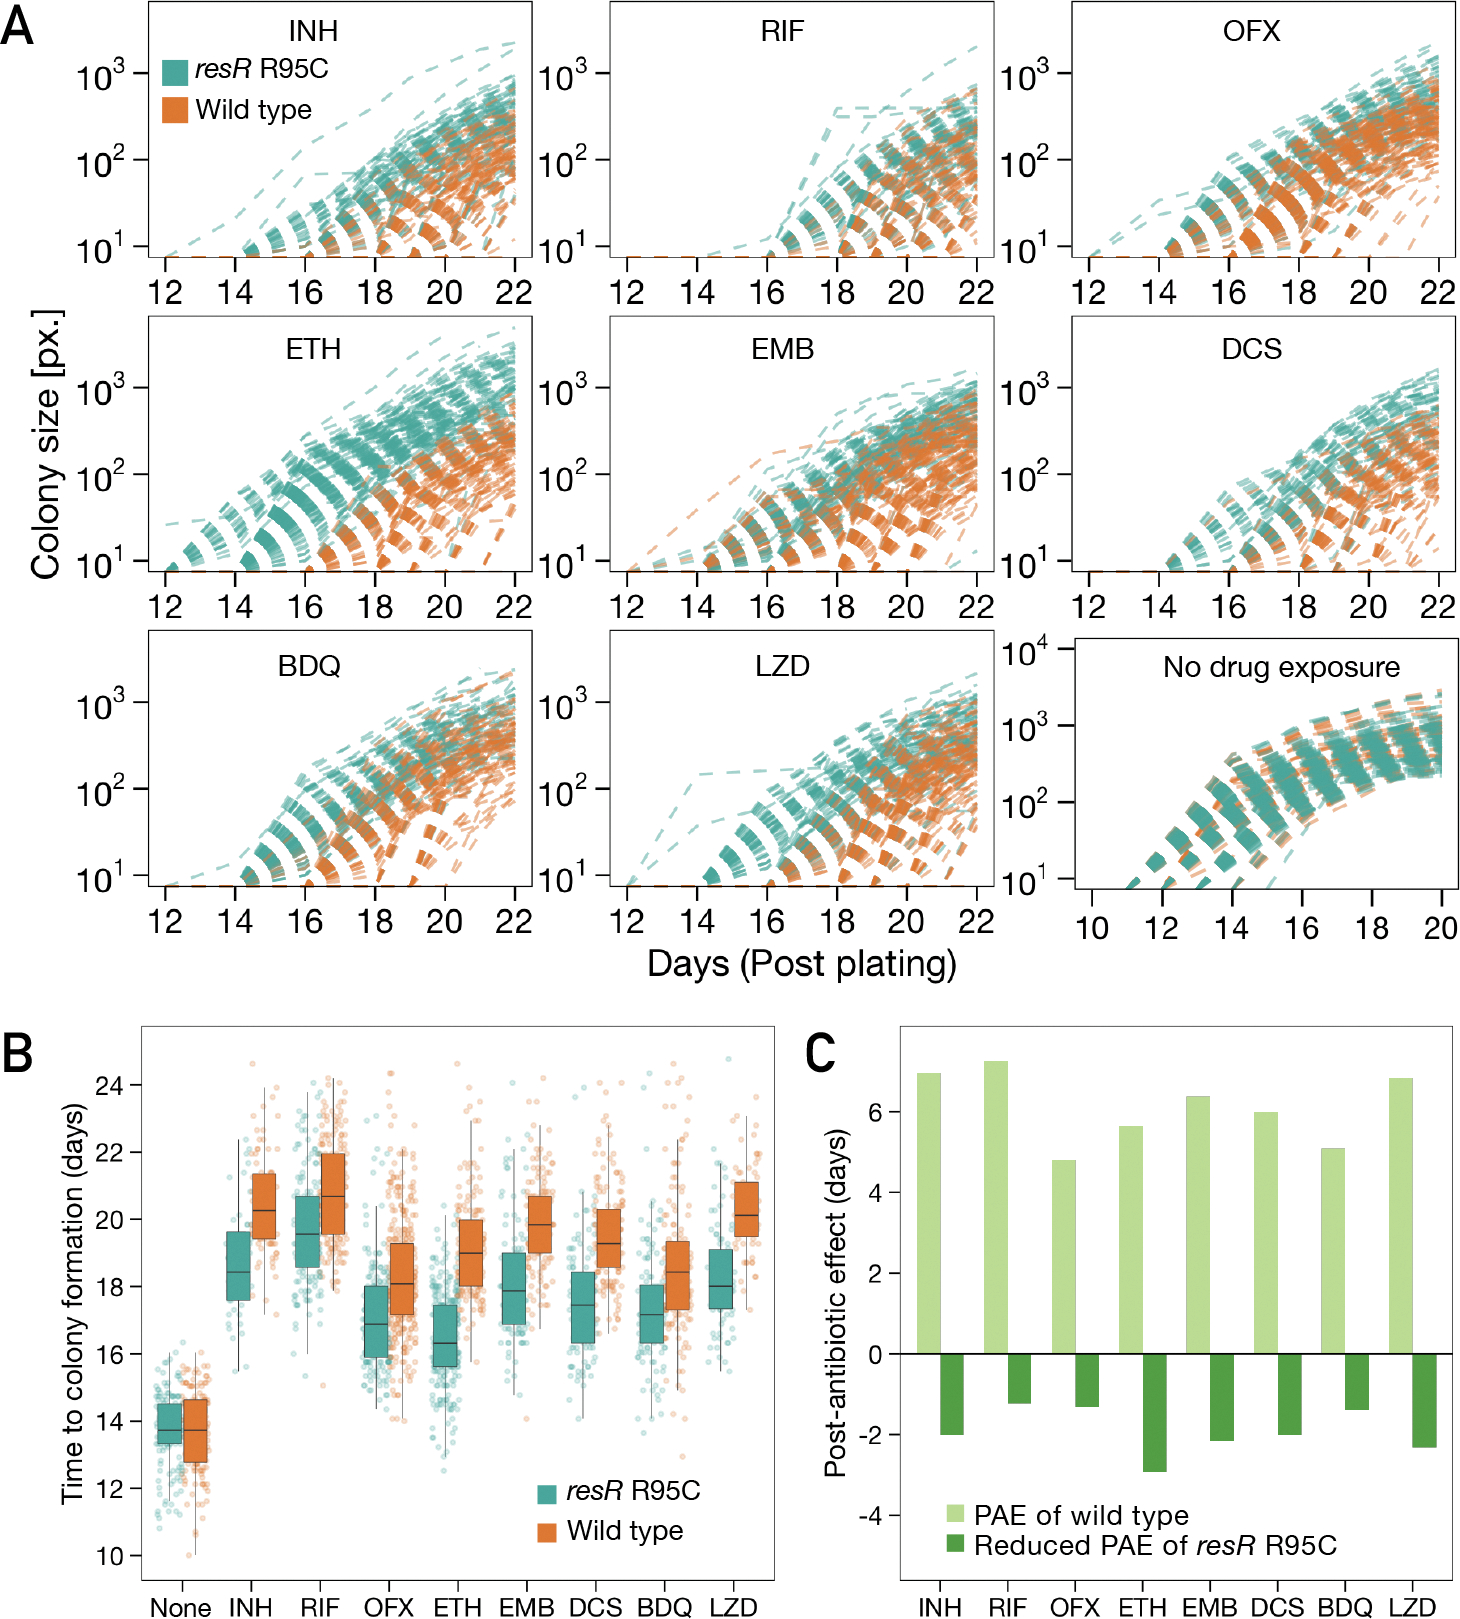
(A) Quantitative colony-size tracking in pixel unit (px.) for resR mutant and wild-type Mtb strains in the presence or absence of antibiotic exposure (24h). (B) Duration from plating to the appearance of visible colonies (Time to colony formation) for resR mutant and wild-type strains after exposure to indicated antibiotics (24h) or no drug exposure (None). P=0.7291 for no drug exposure group and P<0.0001 for all drug groups, by Mann-Whitney U test. (C) A bar plot depicting the median values of post-antibiotic delay of wild type (light green) and resR mutants (dark green).
A delay in bacterial growth after a period of antibiotic exposure is classically referred to as the post-antibiotic effect (PAE) (12). The PAE has been recognized for decades across many bacterial pathogens and is an important factor in the design of treatment regimens (12, 13). To date, the PAE remains mechanistically enigmatic with recent work favoring a detoxification model in which the cells must export residual drug before growth resumes (14). Our results suggest that M. tuberculosis has mechanisms for post-antibiotic recovery that are under genetic control and that resR mutants optimize this system, accelerating bacterial recovery after a wide variety of antibiotic insults. We term this phenotype antibiotic resilience, and name this gene (Rv1830), resR for Resilience Regulator.
Antibiotics resilience manifests as early recovery
To better understand early events in post-antibiotic recovery, we used microscopy to interrogate cell regrowth after the period of antibiotic exposure. Mycobacteria grow from their subpolar regions, which can be quantitatively defined by imaging that tracks the incorporation of fluorescently labeled D-amino acids (FDAA) into the nascent peptidoglycan near the cell poles (15, 16). We assessed regrowth of wildtype and resR mutant cells after 24 hours of INH exposure at 100-fold MIC, followed by a 10–36 hour recovery window in drug-free media (Fig. 4A, B). During the recovery period, resR mutants show significantly more new cell wall synthesis than the wildtype cells (P<0.0001 for 24 hours and 36 hours, Fig. 4B, C). Wild-type cells and resR mutants have similar FDAA incorporation in the absence of antibiotic exposure (Fig. 4B).
Fig. 4. Antibiotic resilience characterized by more rapid resumption of cell wall synthesis.
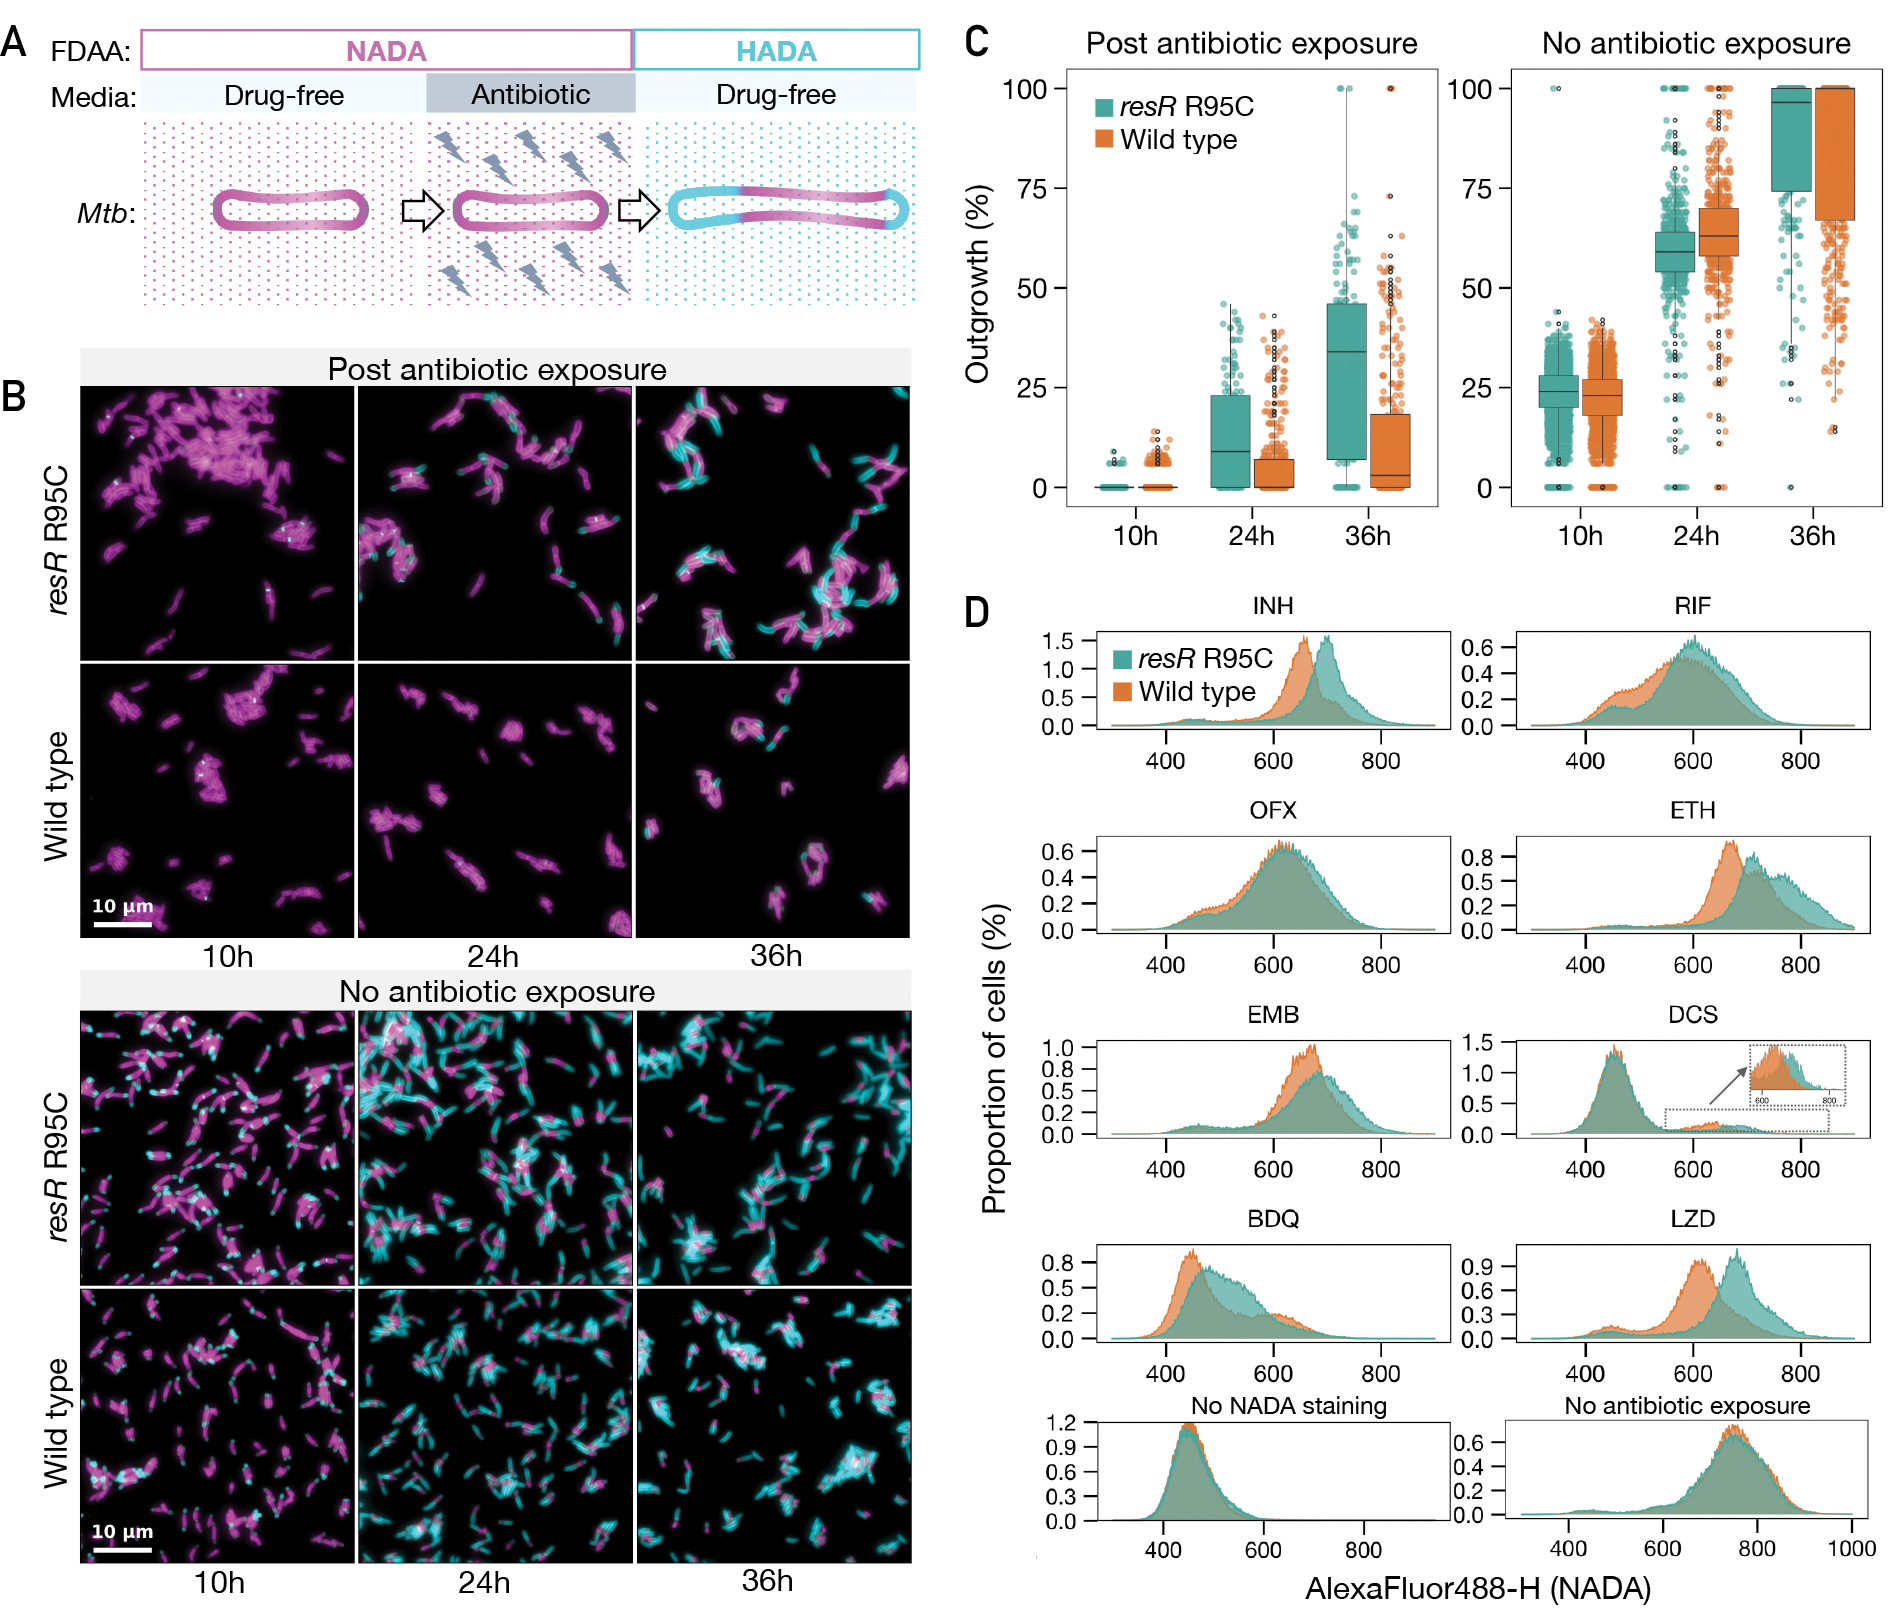
(A) A schematic diagram of pulse-chase experiment for tracking the regrowth of Mtb cells post antibiotic exposure using fluorescent d-amino acid incorporation (NADA and HADA). (B) Representative microscopy snapshots of the resR mutants and wild type during regrowth after 24 hours of INH (100-fold MIC) exposure (the upper panel) and no antibiotic exposure (the lower panel). Scale bar: 10 m. (C) Quantitative comparison of outgrowth between resR mutant and wild type in post antibiotic exposure group and no antibiotic exposure group, P<0.0001 for 24h and 36h of post antibiotic exposure group by double-sided Kolmogorov–Smirnov test. (D) Flow cytometry for NADA incorporation into Mtb cells after 24 hours recovery post antibiotic exposure or without drug exposure.
This labeling approach allowed us to use flow cytometry to assess new cell wall synthesis rapidly and quantitatively in mutant and wild-type cells across a wide range of antibiotic exposure conditions. We assessed regrowth after exposure to eight antibiotics at 100-fold MIC. resR mutants showed increased cell wall synthesis after exposure to all antibiotics tested while label incorporation was similar between resR mutants and the wild type in the absence of drug (Fig. 4D). The different resR mutants all showed a similar phenotype (fig. S9E). resR mutants also demonstrated faster recovery after up to 120 hours of INH exposure and across a range of antibiotic concentrations (fig. S10).
A regulatory pathway underlying antibiotic resilience
To delineate the regulatory targets through which ResR mediates antibiotic resilience, we used in vitro whole-genome DNA binding and deep sequencing assay (IDAP-Seq)(17) to identify the ResR binding sites across the genome. We purified ResR proteins with either an N-terminal His tag or C-terminal His tag, and performed IDAP-Seq with both versions. With both constructs, we identified four major ResR binding sites in the M. tuberculosis genome: the intergenic regions between rimJ-Rv0996, nrdH-Rv3054, whiB2-fbiA, and Rv3916c-parB (Fig. 5A). None of the genes flanking the dominant ResR binding sites has a known role in drug resistance. Surprisingly, however, our population genomic analyses found that one of them, the whiB2-fbiA intergenic region, is also one of the major targets of ongoing positive selection in clinical M. tuberculosis isolates (Fig. 1B). Indeed, the ResR binding site in the whiB2-fbiA intergenic region is the site of mutant accumulation in clinical M. tuberculosis strains (Fig. 5B) – an evolutionary pattern suggesting that natural selection has acted on both the ResR and its binding site, presumably to alter the expression of whiB2 or fbiA.
Fig. 5. ResR activates whiB2 and clinical mutations lead to upregulation of whiB2.
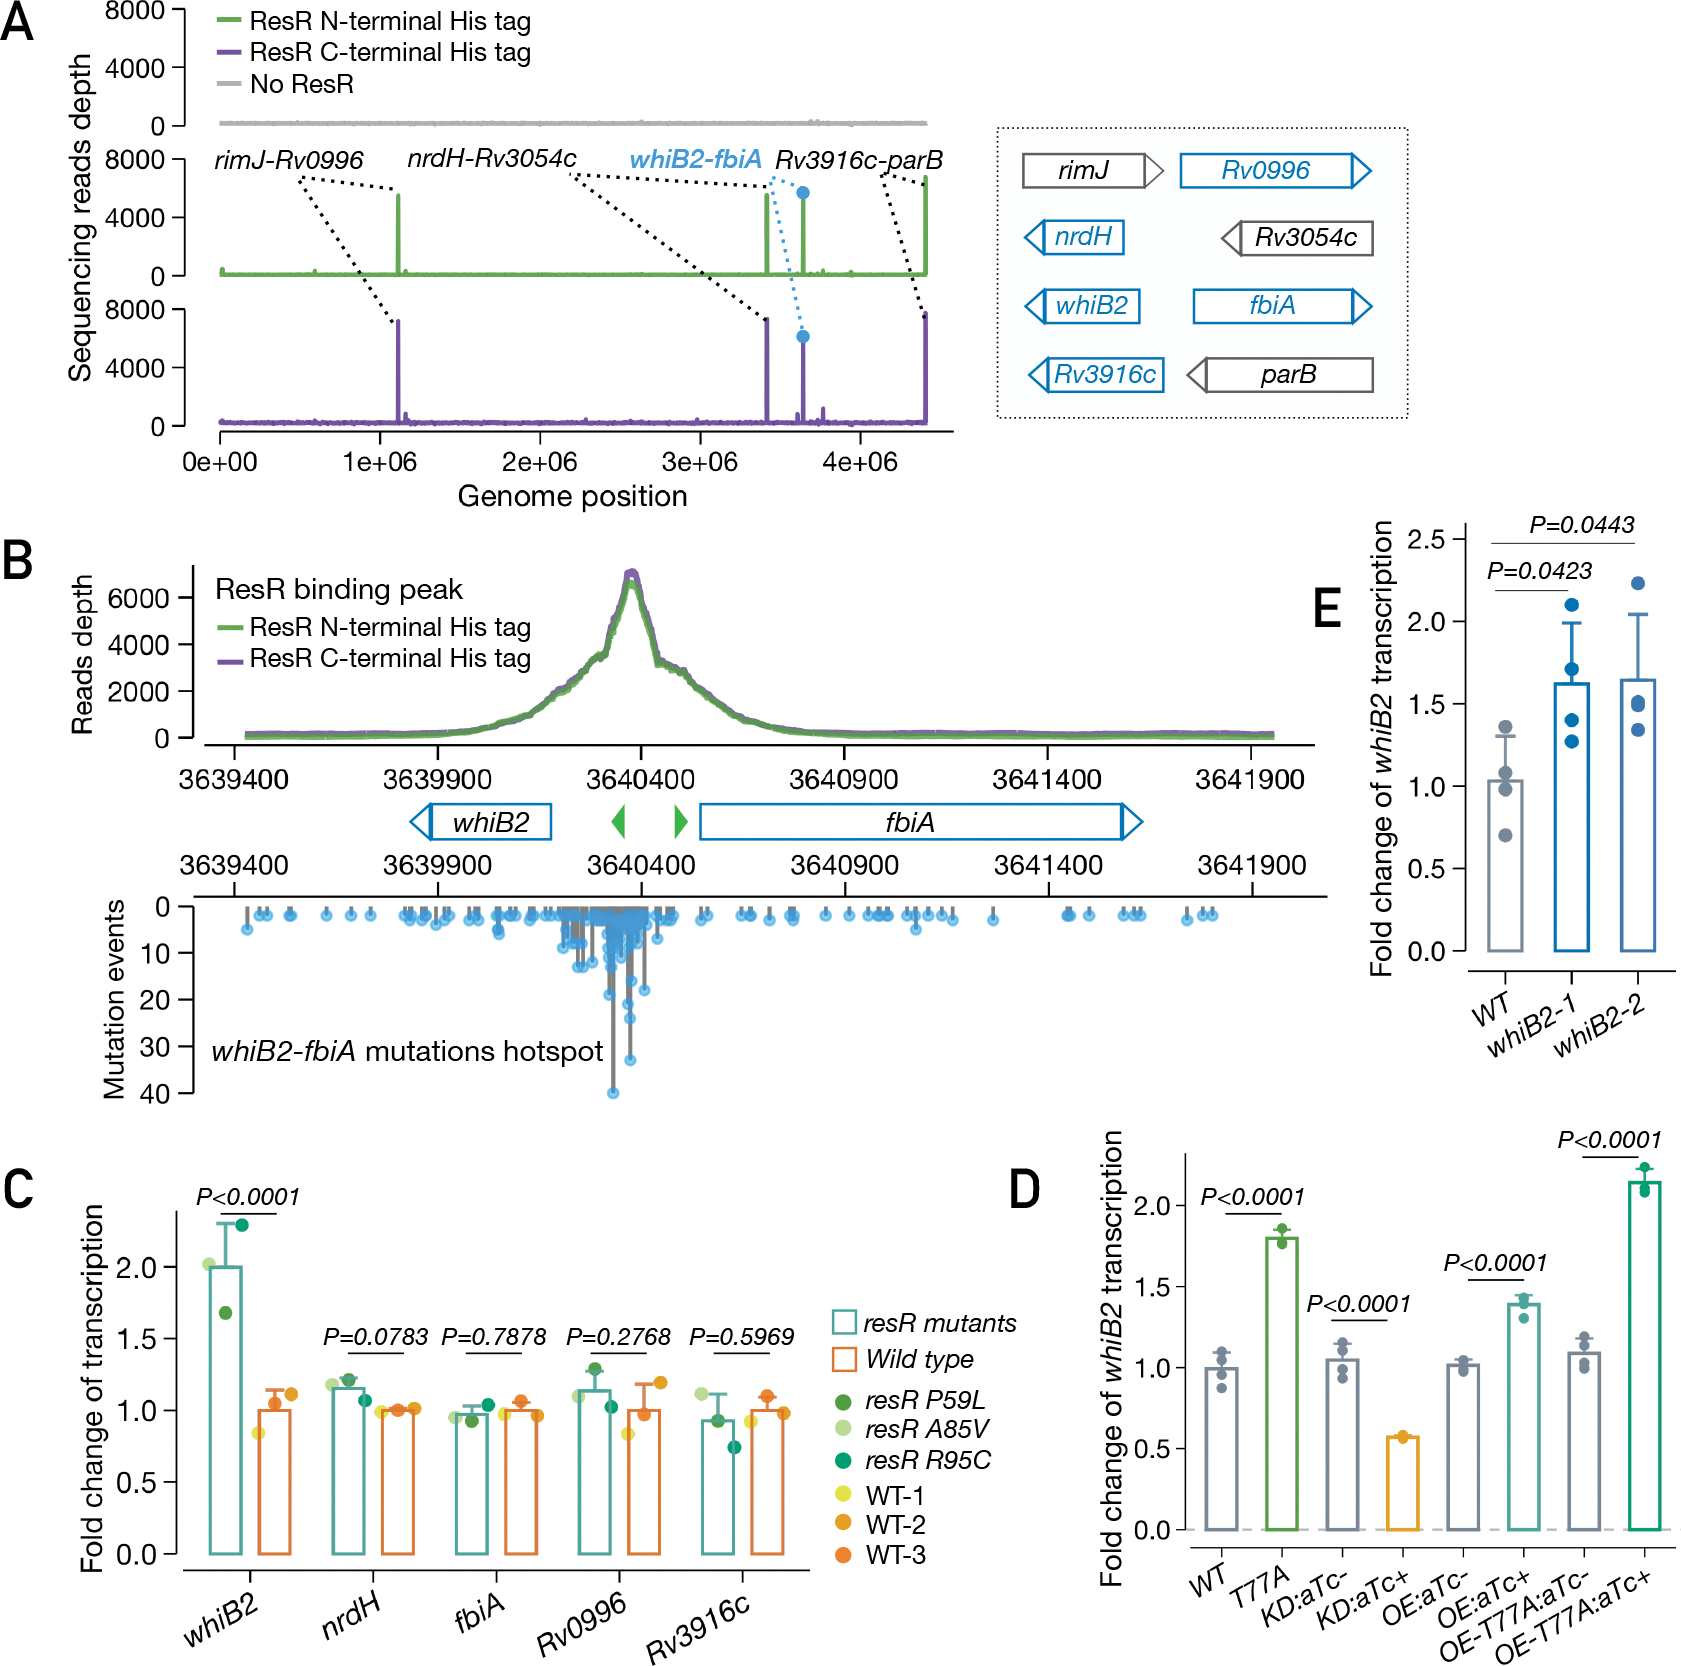
(A) IDAP-Seq identified binding sites of ResR. (B) ResR binding peaks overlaid with the mutations identified in clinical strains between whiB2-fbiA. The transcriptional start sites of whiB2 and fbiA are annotated (green arrows). (C) Ford change of transcription of putative ResR targets in resR mutants and wild-type strains, P values by the Wald test implemented in DEseq2. (D) Transcriptional changes of whiB2 in M. smegmatis strains: wild-type (WT), resR point mutant (T77A), CRISPR-i knock-down of resR (KD), merodiploid overexpression of wild-type resR (OE) or T77A mutant form (OE-T77A). The absence or presence of aTc was specified by (−) or (+), P values given by unpaired t test. (E) whiB2-fbiA mutant (3640375 C>T) exhibited upregulation of whiB2. whiB2–1 and whiB2–2 refer to the two parallel mutants, and P values given by unpaired t test.
To assess the regulatory role of ResR, we used RNA-Seq to assess gene expression changes in the three independent resR mutants as compared to isogenic wildtype M. tuberculosis. The resR mutants had around 2 fold higher levels of whiB2 transcript, but no significant alterations in the expression of the other genes adjacent to the major ResR binding sites (Fig. 5C). The changes in whiB2 expression were part of a pattern of altered transcription that also included increased expression of the iniBAC operon, previously shown to be expressed in response to cell wall targeting antibiotics (18); and other mediators/regulators of central carbon metabolism (bkdABC, clgR) and cell wall acting genes, notably pbpB(19, 20) (fig. S11A). To further define the regulatory relationship between resR and whiB2, we reconstructed several resR variants in Mycobacterium smegmatis (homolog: MSMEG_3644), including CRISPR-i knockdown, overexpression and also point-mutant strains (Fig. 5D). Transcriptional profiling of these strains suggests that ResR functions as an activator of whiB2 expression and that the clinical mutation (T77A) results in increased whiB2 transcription (Fig. 5D, fig. S11B).
WhiB2 is an essential regulator that controls cell growth division in mycobacteria; knockdown of whiB2 expression results in cell elongation and division defects, while overexpression of whiB2 in M. tuberculosis results in increased cell length (21, 22). We next sought to determine the effect of whiB2-fbiA mutation on whiB2 expression and M. tuberculosis physiology. We generated isogenic M. tuberculosis strains carrying a clinically prevalent mutation in whiB2-fbiA (3640375 C>T). The point-mutant strain had a ~1.6 fold increase in whiB2 expression (Fig. 5E, fig. S12A). Moreover, this strain also phenocopied resR mutants, with similar morphotypic changes (longer and wider cells) (fig. S12B), a small increase of INH MIC and most importantly (fig. S12C), faster recovery after antibiotic exposure (fig. S12D, E). However, the magnitude of the resilience phenotype in whiB2-fbiA mutant appeared to be smaller than that of resR mutants, suggesting that additional, as yet undefined, mechanisms might be involved.
resR, whiB2-fbiA and whiA mutants are associated with acquisition of canonical drug resistance and treatment failure
The WhiB2 regulon has been best characterized in Streptomyces (23, 24). There the WhiB2 homolog interacts with another regulator, WhiA, to initiate cell division (23, 24). Strikingly, we find that in our population genomic analysis, whiA, like resR and whiB2, is also a major target of positive selection in clinical M. tuberculosis isolates (Fig. 1B). To assess the clinical relevance of mutations in this regulatory triad, we compared the prevalence of fixed mutations of resR, whiB2-fbiA and whiA in drug-susceptible strains versus drug-resistant strains. Out of the 51,229 genomes in our database, 6.9% have mutations in these genes/IGR and mutations in these genes are each significantly enriched in drug-resistant strains (fig. S13A). We further looked at M. tuberculosis strains from high TB burden countries, India and China, where M. tuberculosis populations were not skewed by recent expansions of clonal M. tuberculosis strains and each with >1,000 sequenced isolates. Again, strains with the three genes/IGR’s mutations have increased odds ratios for drug resistance (India, OR: 1.80; 95% CI: 1.11~2.91; China, OR: 1.71; 95% CI: 1.06~2.74) (Fig. 6A, fig. S13B). Therefore, these data suggest that resR, whiB2-fbiA and whiA mutations facilitate the evolution of canonical drug resistance. Importantly, resR, whiB2-fbiA and whiA remain under positive selection in highly drug-resistant strains as assessed by within-host evolution (Fig. 6B), suggesting that even after the emergence of resistance to first-line drugs, these variants provide an advantage to the bacterium as it encounters second-line agents. Evidence of selection at every level of drug resistance further supports the model that these variants are selected by a multi-drug phenotype like antibiotic resilience. However, the shifted INH MIC is likely to contribute to their success in drug-susceptible strains and this dual benefit may be one reason that they are clinically prevalent.
Fig. 6. resR, whiB2-fbiA and whiA mutants were associated with canonical drug resistance and relapse of drug-susceptible tuberculosis.
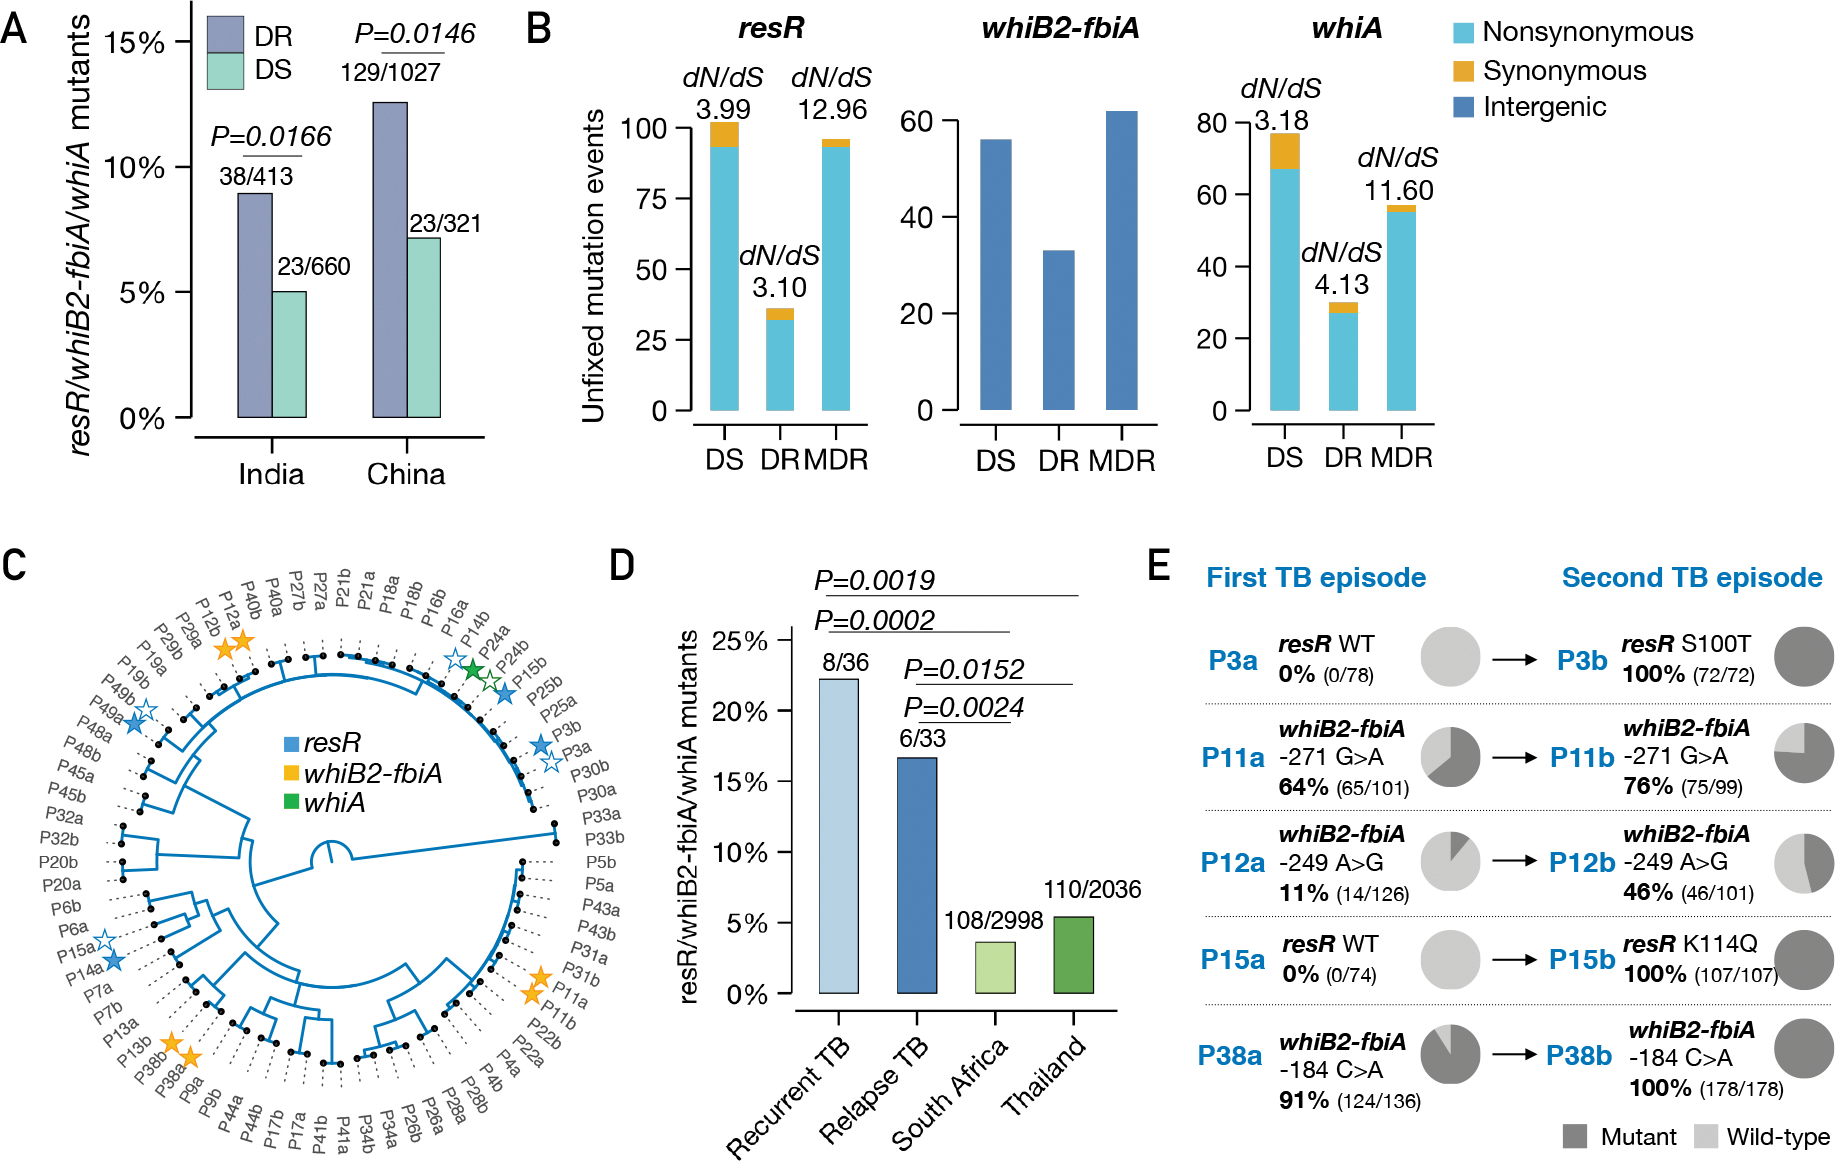
(A) The proportion of resR, whiB2-fbiA and whiA mutants in DR and DS strains sequenced from India and China, P values by Fisher’s exact test. (B) Unfixed mutations in DS, DR and MDR (resistant to RIF and INH) strains. (C) A phylogenetic tree of paired Mtb isolates from 36 recurrent TB patients. Solid stars indicate isolates in which mutations were detected while empty stars indicate absence of mutations in one of the paired isolates. (D) Percentage of isolates with mutations in resR/whiB2-fbiA/whiA. “Recurrent TB” includes 3 patients with Mtb isolates suggestive of re-infection. (E) Mutational trajectory in Mtb isolates from the first TB to second TB episodes in 5 pairs of isolates. The mutations in other three pairs: P14 (resR, D144N; 100% in P14a, 0% in P14b); P49 (resR, R95H; 8.7% in P49a, 0% in P49b); P24 (whiA, A131T; 11.6% in P24a, 0% in P24b).
Finally, while resR, whiB2-fbiA and whiA variants are more frequent in drug-resistant strains, variants in these genes are also under positive selection in drug-susceptible strains (fig. S13C) and the sites of mutation in drug-susceptible strains mimic those in drug-resistant strains (fig. S13D). Indeed, 1.5%–9.7% of drug-susceptible M. tuberculosis strains from the high TB burden countries have fixed mutations in one of these three genes/IGR (fig. S13E). We postulated that in addition to being clinically important as stepping-stone mutations for the emergence of canonical drug resistance, these variants independently contribute to treatment failure in drug-susceptible patients. To test this hypothesis, we reanalyzed data from the REMoxTB trial, a global Phase 3 clinical trial that sought to reduce the treatment duration of drug-susceptible TB (25, 26). Of the 1931 patients enrolled in the trial, paired M. tuberculosis isolates from 36 recurrent TB patients were whole-genome sequenced and the isolates remained drug-sensitive (26). We found 8/36 (22.2%) of the isolates from patients who failed treatment had resR, whiB2-fbiA or whiA mutations (Fig. 6C), a frequency significantly higher than found in the background populations of South Africa (108/2998, 3.6%) and Thailand (110/2036, 5.4%) where the trial was conducted (P=0.0024 and P=0.0152 respectively, Fisher’s exact test, Fig. 6D). Additionally, the within-host frequency of these variants increased between the initial and recurrent episodes, in three cases rising to fixation (Fig. 6E).
Taken together, we have identified a new form of altered drug susceptibility we call antibiotic resilience, which is regulated by resR. Mutations in the regulating cascade are positively selected in clinical M. tuberculosis isolates and associated with poor treatment outcomes in TB. Current clinical measures of antibiotic susceptibility focus largely on the magnitude of drug exposure – what concentration of drug the pathogen can experience and grow or at least survive (27). However, our results suggest that in the clinic, M. tuberculosis is evolving to change the temporal dynamics of its recovery after drug exposure. The temporal dynamics of drug responses are considered when developing new drugs and drug regimens but often forgotten as potential drivers of treatment outcomes that might be influenced by pathogen variation. Interestingly, in studies of E. coli experimentally evolved under intermittent drug exposure, temporal variants were the first to emerge (28). In E. coli, the mutants had delayed regrowth rather than faster regrowth, suggesting that the temporal phenotypes could vary by the pathogen, drug regimen and host factors such as drug metabolism (29–31). As current clinical diagnostics are largely blind to temporal phenotypes, selection for temporal phenotypes such as antibiotic resilience may underlie treatment failure in other drug-susceptible infections.
Supplementary Material
ACKNOWLEDGMENTS
We thank Timothy M. Walker for collecting and sharing information on the geographic origin of more than 10,000 M. tuberculosis isolates. We also thank Christopher M. Sassetti for the helpful discussions during this work.
Funding:
This work was funded by P01 AI132130 and RFA-AI-21-065 to S.M.F., P01 AI143575 to S.M.F and E.J.R., NIH/NIAID R01 AI143611-01 to B.B.A..
Footnotes
Competing interests: The authors declare no competing interests.
Data and materials availability:
All data are available in the main text or supplementary materials or deposited at GitHub with the analyzing codes (https://github.com/MtbEvolution/resR_Project) (32) and sequencing data are deposited in the Sequence Read Archive database (PRJNA820190).
REFERENCES AND NOTES
- 1.Fisher RA, Gollan B, Helaine S, Persistent bacterial infections and persister cells. Nat Rev Microbiol 15, 453–464 (2017) ( 10.1038/nrmicro.2017.42). [DOI] [PubMed] [Google Scholar]
- 2.Liu J, Gefen O, Ronin I, Bar-Meir M, Balaban NQ, Effect of tolerance on the evolution of antibiotic resistance under drug combinations. Science 367, 200–204 (2020) ( 10.1126/science.aay3041). [DOI] [PubMed] [Google Scholar]
- 3.Harms A, Maisonneuve E, Gerdes K, Mechanisms of bacterial persistence during stress and antibiotic exposure. Science 354, aaf4268 (2016) ( 10.1126/science.aaf4268). [DOI] [PubMed] [Google Scholar]
- 4.Safi H et al. , Phase variation in Mycobacterium tuberculosis glpK produces transiently heritable drug tolerance. Proceedings of the National Academy of Sciences of the United States of America 116, 19665–19674 (2019) ( 10.1073/pnas.1907631116). [DOI] [PMC free article] [PubMed] [Google Scholar]
- 5.Murray JF, Schraufnagel DE, Hopewell PC, Treatment of Tuberculosis. A Historical Perspective. Ann Am Thorac Soc 12, 1749–1759 (2015) ( 10.1513/AnnalsATS.201509-632PS). [DOI] [PubMed] [Google Scholar]
- 6.Liu Q et al. , Mycobacterium tuberculosis clinical isolates carry mutational signatures of host immune environments. Sci Adv 6, eaba4901 (2020) ( 10.1126/sciadv.aba4901). [DOI] [PMC free article] [PubMed] [Google Scholar]
- 7.Trauner A et al. , The within-host population dynamics of Mycobacterium tuberculosis vary with treatment efficacy. Genome Biol 18, 71 (2017) ( 10.1186/s13059-017-1196-0). [DOI] [PMC free article] [PubMed] [Google Scholar]
- 8.Chiner-Oms A, Lopez MG, Moreno-Molina M, Furio V, Comas I, Gene evolutionary trajectories in Mycobacterium tuberculosis reveal temporal signs of selection. Proc Natl Acad Sci U S A 119, e2113600119 (2022) ( 10.1073/pnas.2113600119). [DOI] [PMC free article] [PubMed] [Google Scholar]
- 9.O. World Health, “Technical manual for drug susceptibility testing of medicines used in the treatment of tuberculosis,” (World Health Organization, Geneva, 2018). [Google Scholar]
- 10.Hicks ND et al. , Clinically prevalent mutations in Mycobacterium tuberculosis alter propionate metabolism and mediate multidrug tolerance. Nat Microbiol 3, 1032–1042 (2018) ( 10.1038/s41564-018-0218-3). [DOI] [PMC free article] [PubMed] [Google Scholar]
- 11.Levin-Reisman I et al. , Automated imaging with ScanLag reveals previously undetectable bacterial growth phenotypes. Nat Methods 7, 737–739 (2010) ( 10.1038/nmeth.1485). [DOI] [PubMed] [Google Scholar]
- 12.Zhanel GG, Hoban DJ, Harding GK, The postantibiotic effect: a review of in vitro and in vivo data. DICP 25, 153–163 (1991) ( 10.1177/106002809102500210). [DOI] [PubMed] [Google Scholar]
- 13.Beggs WH, Jenne JW, Isoniazid uptake and growth inhibition of Mycobacterium tuberculosis in relation to time and concentration of pulsed drug exposures. Tubercle 50, 377–385 (1969) ( 10.1016/0041-3879(69)90038-5). [DOI] [PubMed] [Google Scholar]
- 14.Srimani JK, Huang S, Lopatkin AJ, You L, Drug detoxification dynamics explain the postantibiotic effect. Mol Syst Biol 13, 948 (2017) ( 10.15252/msb.20177723). [DOI] [PMC free article] [PubMed] [Google Scholar]
- 15.Kieser KJ, Rubin EJ, How sisters grow apart: mycobacterial growth and division. Nat Rev Microbiol 12, 550–562 (2014) ( 10.1038/nrmicro3299). [DOI] [PMC free article] [PubMed] [Google Scholar]
- 16.Hannebelle MTM et al. , A biphasic growth model for cell pole elongation in mycobacteria. Nat Commun 11, 452 (2020) ( 10.1038/s41467-019-14088-z). [DOI] [PMC free article] [PubMed] [Google Scholar]
- 17.Hicks ND et al. , Mutations in dnaA and a cryptic interaction site increase drug resistance in Mycobacterium tuberculosis. PLoS Pathog 16, e1009063 (2020) ( 10.1371/journal.ppat.1009063). [DOI] [PMC free article] [PubMed] [Google Scholar]
- 18.Alland D, Steyn AJ, Weisbrod T, Aldrich K, Jacobs WR Jr., Characterization of the Mycobacterium tuberculosis iniBAC promoter, a promoter that responds to cell wall biosynthesis inhibition. J Bacteriol 182, 1802–1811 (2000) ( 10.1128/JB.182.7.1802-1811.2000). [DOI] [PMC free article] [PubMed] [Google Scholar]
- 19.Betts JC, Lukey PT, Robb LC, McAdam RA, Duncan K, Evaluation of a nutrient starvation model of Mycobacterium tuberculosis persistence by gene and protein expression profiling. Mol Microbiol 43, 717–731 (2002) ( 10.1046/j.1365-2958.2002.02779.x). [DOI] [PubMed] [Google Scholar]
- 20.Kumar G, Galanis C, Batchelder HR, Townsend CA, Lamichhane G, Penicillin Binding Proteins and beta-Lactamases of Mycobacterium tuberculosis: Reexamination of the Historical Paradigm. mSphere 7, e0003922 (2022) ( 10.1128/msphere.00039-22). [DOI] [PMC free article] [PubMed] [Google Scholar]
- 21.Gomez JE, Bishai WR, whmD is an essential mycobacterial gene required for proper septation and cell division. Proc Natl Acad Sci U S A 97, 8554–8559 (2000) ( 10.1073/pnas.140225297). [DOI] [PMC free article] [PubMed] [Google Scholar]
- 22.Raghunand TR, Bishai WR, Mycobacterium smegmatis whmD and its homologue Mycobacterium tuberculosis whiB2 are functionally equivalent. Microbiology (Reading) 152, 2735–2747 (2006) ( 10.1099/mic.0.28911-0). [DOI] [PubMed] [Google Scholar]
- 23.Bush MJ, Chandra G, Bibb MJ, Findlay KC, Buttner MJ, Genome-Wide Chromatin Immunoprecipitation Sequencing Analysis Shows that WhiB Is a Transcription Factor That Cocontrols Its Regulon with WhiA To Initiate Developmental Cell Division in Streptomyces. mBio 7, e00523–00516 (2016) ( 10.1128/mBio.00523-16). [DOI] [PMC free article] [PubMed] [Google Scholar]
- 24.Bush MJ, Bibb MJ, Chandra G, Findlay KC, Buttner MJ, Genes required for aerial growth, cell division, and chromosome segregation are targets of WhiA before sporulation in Streptomyces venezuelae. mBio 4, e00684–00613 (2013) ( 10.1128/mBio.00684-13). [DOI] [PMC free article] [PubMed] [Google Scholar]
- 25.Jindani A et al. , High-dose rifapentine with moxifloxacin for pulmonary tuberculosis. The New England journal of medicine 371, 1599–1608 (2014) ( 10.1056/NEJMoa1314210). [DOI] [PMC free article] [PubMed] [Google Scholar]
- 26.Bryant JM et al. , Whole-genome sequencing to establish relapse or re-infection with Mycobacterium tuberculosis: a retrospective observational study. The Lancet. Respiratory medicine 1, 786–792 (2013) ( 10.1016/S2213-2600(13)70231-5). [DOI] [PMC free article] [PubMed] [Google Scholar]
- 27.Consortium CR et al. , Prediction of Susceptibility to First-Line Tuberculosis Drugs by DNA Sequencing. The New England journal of medicine 379, 1403–1415 (2018) ( 10.1056/NEJMoa1800474). [DOI] [PMC free article] [PubMed] [Google Scholar]
- 28.Fridman O, Goldberg A, Ronin I, Shoresh N, Balaban NQ, Optimization of lag time underlies antibiotic tolerance in evolved bacterial populations. Nature 513, 418–421 (2014) ( 10.1038/nature13469). [DOI] [PubMed] [Google Scholar]
- 29.Strydom N et al. , Tuberculosis drugs’ distribution and emergence of resistance in patient’s lung lesions: A mechanistic model and tool for regimen and dose optimization. PLoS Med 16, e1002773 (2019) ( 10.1371/journal.pmed.1002773). [DOI] [PMC free article] [PubMed] [Google Scholar]
- 30.Ordonez AA et al. , Dynamic imaging in patients with tuberculosis reveals heterogeneous drug exposures in pulmonary lesions. Nat Med 26, 529–534 (2020) ( 10.1038/s41591-020-0770-2). [DOI] [PMC free article] [PubMed] [Google Scholar]
- 31.Dheda K et al. , Drug-Penetration Gradients Associated with Acquired Drug Resistance in Patients with Tuberculosis. Am J Respir Crit Care Med 198, 1208–1219 (2018) ( 10.1164/rccm.201711-2333OC). [DOI] [PMC free article] [PubMed] [Google Scholar]
- 32.Liu Q, Zhu J, MtbEvolution/resR_Project: resR project. Zenodo, (2022) ( 10.5281/zenodo.7087866). [DOI] [Google Scholar]
- 33.Joshi N, Fass J, Sickle: A sliding-window, adaptive, quality-based trimming tool for FastQ files (Version 1.33)[Software]. (2011). [Google Scholar]
- 34.Comas I et al. , Out-of-Africa migration and Neolithic coexpansion of Mycobacterium tuberculosis with modern humans. Nature genetics 45, 1176–1182 (2013) ( 10.1038/ng.2744). [DOI] [PMC free article] [PubMed] [Google Scholar]
- 35.Langmead B, Salzberg SL, Fast gapped-read alignment with Bowtie 2. Nat Methods 9, 357–359 (2012) ( 10.1038/nmeth.1923). [DOI] [PMC free article] [PubMed] [Google Scholar]
- 36.Li H, Durbin R, Fast and accurate short read alignment with Burrows-Wheeler transform. Bioinformatics 25, 1754–1760 (2009) ( 10.1093/bioinformatics/btp324). [DOI] [PMC free article] [PubMed] [Google Scholar]
- 37.Li H et al. , The Sequence Alignment/Map format and SAMtools. Bioinformatics 25, 2078–2079 (2009) ( 10.1093/bioinformatics/btp352). [DOI] [PMC free article] [PubMed] [Google Scholar]
- 38.Marin M et al. , Benchmarking the empirical accuracy of short-read sequencing across the M. tuberculosis genome. Bioinformatics, (2022) ( 10.1093/bioinformatics/btac023). [DOI] [PMC free article] [PubMed] [Google Scholar]
- 39.Koboldt DC et al. , VarScan 2: somatic mutation and copy number alteration discovery in cancer by exome sequencing. Genome Res 22, 568–576 (2012) ( 10.1101/gr.129684.111). [DOI] [PMC free article] [PubMed] [Google Scholar]
- 40.Liu Q et al. , Within patient microevolution of Mycobacterium tuberculosis correlates with heterogeneous responses to treatment. Sci Rep 5, 17507 (2015) ( 10.1038/srep17507). [DOI] [PMC free article] [PubMed] [Google Scholar]
- 41.Coll F et al. , A robust SNP barcode for typing Mycobacterium tuberculosis complex strains. Nat Commun 5, 4812 (2014) ( 10.1038/ncomms5812). [DOI] [PMC free article] [PubMed] [Google Scholar]
- 42.Liu Q et al. , China’s tuberculosis epidemic stems from historical expansion of four strains of Mycobacterium tuberculosis. Nat Ecol Evol 2, 1982–1992 (2018) ( 10.1038/s41559-018-0680-6). [DOI] [PMC free article] [PubMed] [Google Scholar]
- 43.Walker TM et al. , The 2021 WHO catalogue of Mycobacterium tuberculosis complex mutations associated with drug resistance: A genotypic analysis. Lancet Microbe 3, e265–e273 (2022) ( 10.1016/S2666-5247(21)00301-3). [DOI] [PMC free article] [PubMed] [Google Scholar]
- 44.Jiang Q et al. , Citywide transmission of MDR-TB under China’s rapid urbanization: a retrospective population-based genomic spatial epidemiological study. Clin Infect Dis, (2019) ( 10.1093/cid/ciz790). [DOI] [PMC free article] [PubMed] [Google Scholar]
- 45.Chen X et al. , Evaluation of Whole-Genome Sequence Method to Diagnose Resistance of 13 Anti-tuberculosis Drugs and Characterize Resistance Genes in Clinical Multi-Drug Resistance Mycobacterium tuberculosis Isolates From China. Front Microbiol 10, 1741 (2019) ( 10.3389/fmicb.2019.01741). [DOI] [PMC free article] [PubMed] [Google Scholar]
- 46.Zhang H et al. , Genome sequencing of 161 Mycobacterium tuberculosis isolates from China identifies genes and intergenic regions associated with drug resistance. Nature genetics, (2013) ( 10.1038/ng.2735). [DOI] [PubMed] [Google Scholar]
- 47.Gan M, Liu Q, Yang C, Gao Q, Luo T, Deep Whole-Genome Sequencing to Detect Mixed Infection of Mycobacterium tuberculosis. PLoS One 11, e0159029 (2016) ( 10.1371/journal.pone.0159029). [DOI] [PMC free article] [PubMed] [Google Scholar]
- 48.Li WH, Unbiased estimation of the rates of synonymous and nonsynonymous substitution. J Mol Evol 36, 96–99 (1993) ( 10.1007/BF02407308). [DOI] [PubMed] [Google Scholar]
- 49.Charif D, Lobry JR, in Structural approaches to sequence evolution. (Springer, 2007), pp. 207–232. [Google Scholar]
- 50.Philips SJ et al. , TRANSCRIPTION. Allosteric transcriptional regulation via changes in the overall topology of the core promoter. Science 349, 877–881 (2015) ( 10.1126/science.aaa9809). [DOI] [PMC free article] [PubMed] [Google Scholar]
- 51.Murphy K, Papavinasasundaram K, Sassetti C. (New York, NY: Springer New York, 2015). [Google Scholar]
- 52.Rock JM et al. , Programmable transcriptional repression in mycobacteria using an orthogonal CRISPR interference platform. Nat Microbiol 2, 16274 (2017) ( 10.1038/nmicrobiol.2016.274). [DOI] [PMC free article] [PubMed] [Google Scholar]
- 53.Botella H et al. , Distinct Spatiotemporal Dynamics of Peptidoglycan Synthesis between Mycobacterium smegmatis and Mycobacterium tuberculosis. mBio 8, (2017) ( 10.1128/mBio.01183-17). [DOI] [PMC free article] [PubMed] [Google Scholar]
- 54.Zhu J et al. , Spatiotemporal localization of proteins in mycobacteria. Cell Rep 37, 110154 (2021) ( 10.1016/j.celrep.2021.110154). [DOI] [PMC free article] [PubMed] [Google Scholar]
- 55.Trapnell C et al. , Differential gene and transcript expression analysis of RNA-seq experiments with TopHat and Cufflinks. Nat Protoc 7, 562–578 (2012) ( 10.1038/nprot.2012.016). [DOI] [PMC free article] [PubMed] [Google Scholar]
- 56.Love MI, Huber W, Anders S, Moderated estimation of fold change and dispersion for RNA-seq data with DESeq2. Genome Biol 15, 550 (2014) ( 10.1186/s13059-014-0550-8). [DOI] [PMC free article] [PubMed] [Google Scholar]
- 57.Lang GI, Murray AW, Estimating the per-base-pair mutation rate in the yeast Saccharomyces cerevisiae. Genetics 178, 67–82 (2008) ( 10.1534/genetics.107.071506). [DOI] [PMC free article] [PubMed] [Google Scholar]
- 58.Rosche WA, Foster PL, Determining mutation rates in bacterial populations. Methods 20, 4–17 (2000) ( 10.1006/meth.1999.0901). [DOI] [PMC free article] [PubMed] [Google Scholar]
- 59.Stewart FM, Fluctuation tests: how reliable are the estimates of mutation rates? Genetics 137, 1139–1146 (1994) ( 10.1093/genetics/137.4.1139). [DOI] [PMC free article] [PubMed] [Google Scholar]
- 60.Tamura K, Stecher G, Kumar S, MEGA11: Molecular Evolutionary Genetics Analysis Version 11. Mol Biol Evol 38, 3022–3027 (2021) ( 10.1093/molbev/msab120). [DOI] [PMC free article] [PubMed] [Google Scholar]
- 61.Liu Q et al. , Have compensatory mutations facilitated the current epidemic of multidrug-resistant tuberculosis? Emerg Microbes Infect 7, 98 (2018) ( 10.1038/s41426-018-0101-6). [DOI] [PMC free article] [PubMed] [Google Scholar]
Associated Data
This section collects any data citations, data availability statements, or supplementary materials included in this article.
Supplementary Materials
Data Availability Statement
All data are available in the main text or supplementary materials or deposited at GitHub with the analyzing codes (https://github.com/MtbEvolution/resR_Project) (32) and sequencing data are deposited in the Sequence Read Archive database (PRJNA820190).


