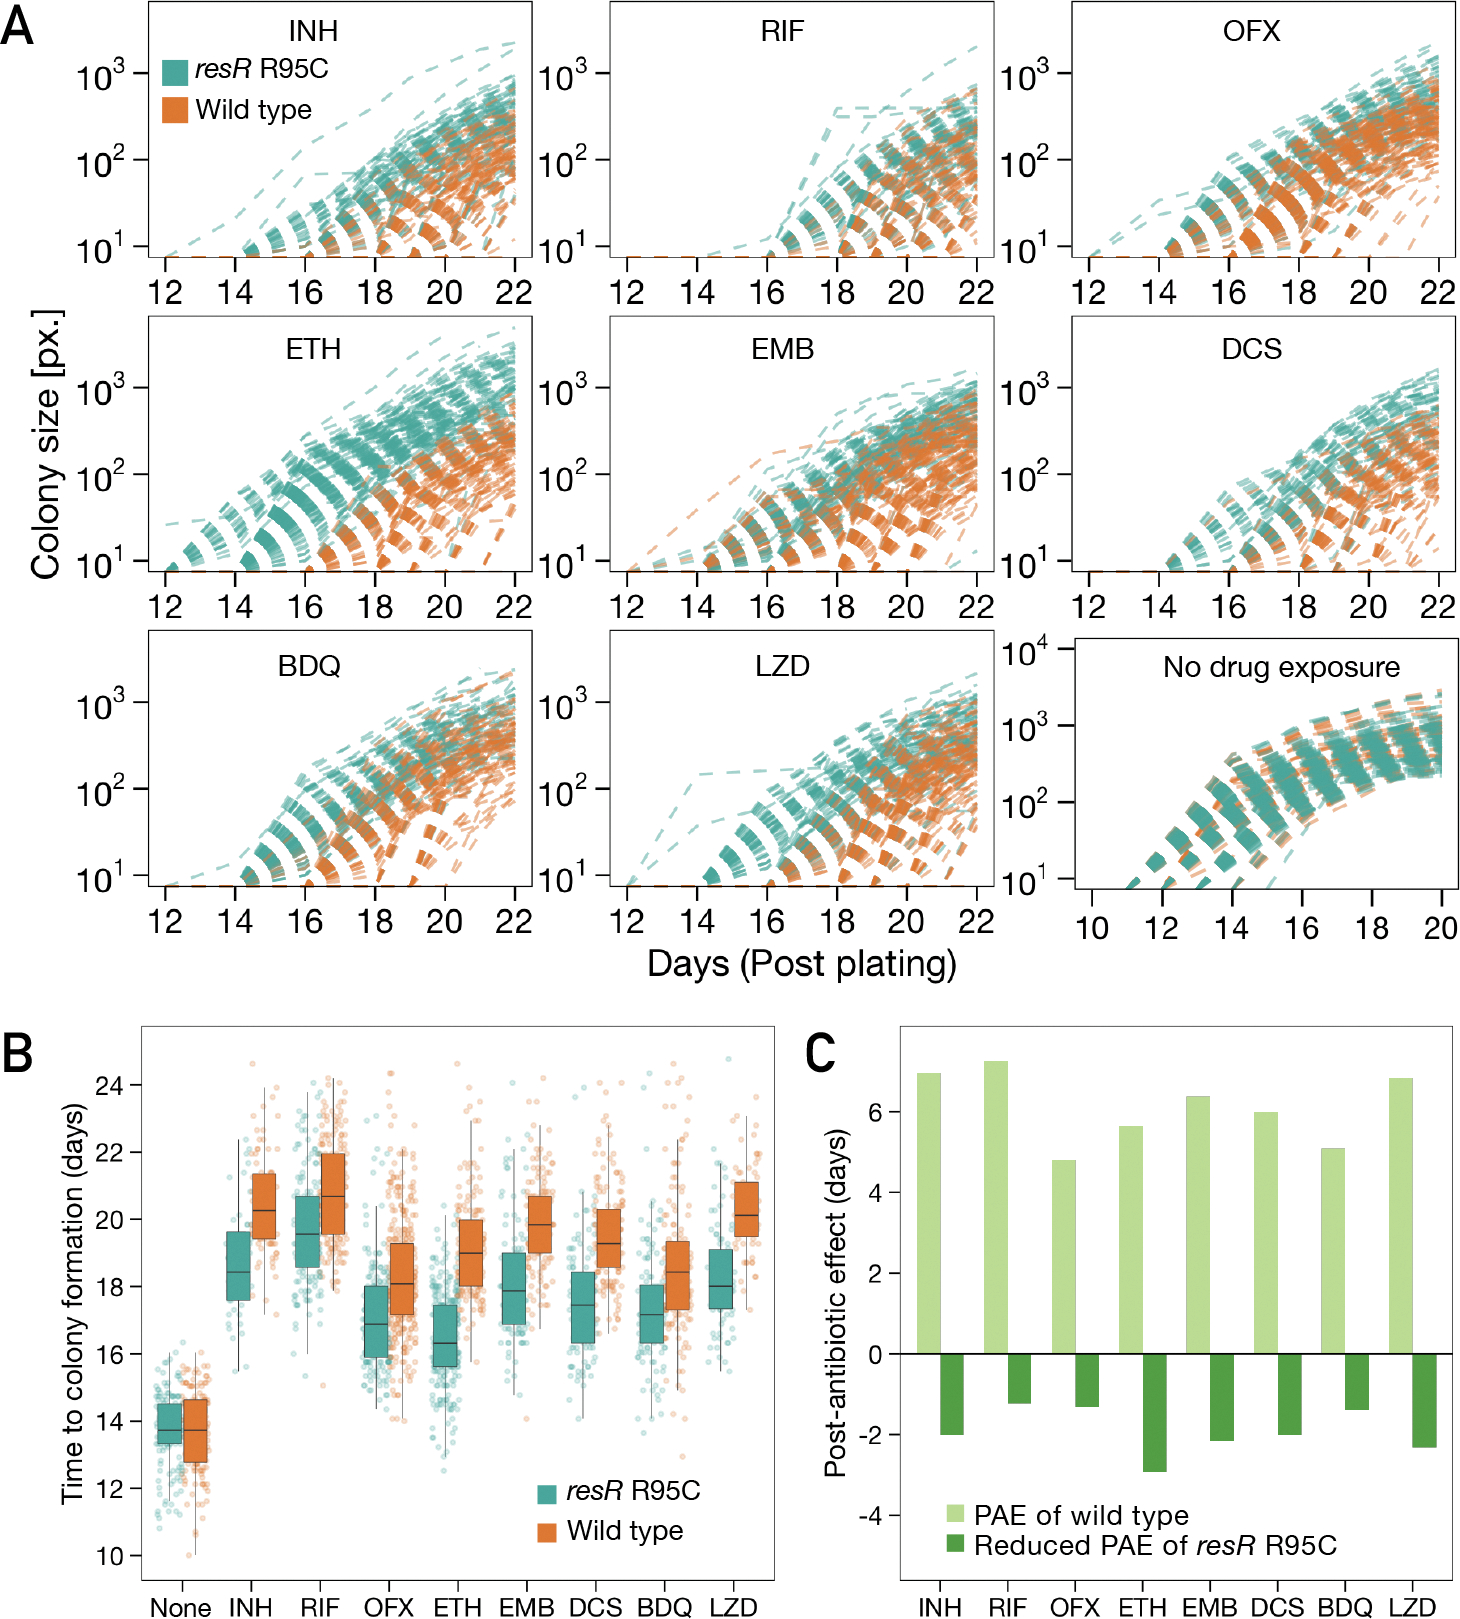
Fig. 3. Quantitative colony-size tracking indicated shortened PAE in resR mutants.

(A) Quantitative colony-size tracking in pixel unit (px.) for resR mutant and wild-type Mtb strains in the presence or absence of antibiotic exposure (24h). (B) Duration from plating to the appearance of visible colonies (Time to colony formation) for resR mutant and wild-type strains after exposure to indicated antibiotics (24h) or no drug exposure (None). P=0.7291 for no drug exposure group and P<0.0001 for all drug groups, by Mann-Whitney U test. (C) A bar plot depicting the median values of post-antibiotic delay of wild type (light green) and resR mutants (dark green).
