

Abstract
Background
Tumor size and consolidation‐to‐tumor ratio (CTR) are crucial for non–small cell lung cancer (NSCLC) prognosis. However, the optimal CTR cutoff remains unclear. Whether tumor size and CTR are independent prognostic factors for part‐solid NSCLC is under debate. Here, we aimed to evaluate the prognostic impacts of CTR and tumor size on NSCLC, especially on part‐solid NSCLC.
Methods
We reviewed 1366 clinical T1 NSCLC patients who underwent surgical treatment. Log‐rank test and Cox regression analyses were adopted for prognostic evaluation. The “surv_cutpoint” function was used to identify the optimal CTR and tumor size cutoff values.
Results
There were 416, 510, and 440 subjects with pure ground‐glass opacity (pGGO), part‐solid, and pure solid nodules. The 5‐year overall survival (disease‐free survival) for patients with pGGO, part‐solid, and pure solid nodules were 99.5% (99.5%), 97.3% (95.8%), and 90.4% (78.9%), respectively. Multivariate Cox regression analysis indicated that CTR was an independent prognostic factor for the whole patients, and the optimal CTR cutoff was 0.99. However, for part‐solid NSCLC, CTR was not independently associated with survival, even if categorized by the optimal cutoffs. The predicted optimal cutoffs of total tumor size and solid component size were 2.4 and 1.4 cm for part‐solid NSCLC. Total tumor size (HR = 6.21, 95% CI: 1.58–24.34, p = 0.009) and solid component size (HR = 2.27, 95% CI: 1.04–5.92, p = 0.045) grouped by the cutoffs were significantly associated with part‐solid NSCLC prognosis.
Conclusions
CTR was an independent prognostic factor for the whole NSCLC, but not for the part‐solid NSCLC. Tumor size was still meaningful for part‐solid NSCLC.
Keywords: consolidation‐to‐tumor ratio, ground‐glass opacity, non‐small cell lung cancer, part‐solid nodules, tumor size
CTR (consolidation‐to‐tumor ratio) was an independent prognostic factor for the whole clinical T1 NSCLC (the optimal CTR cutoff was 0.99), but not for the part‐solid NSCLC. Total tumor size and solid component size were still meaningful for the prognosis of part‐solid NSCLC.

INTRODUCTION
Lung cancer remains one of the most diagnosed and cause of death tumors worldwide. 1 With the widespread application of thin‐section computed tomography (CT), the detection rate of small‐sized non‐small cell lung cancer (NSCLC) has significantly increased. According to the radiological features on CT, pulmonary nodules can be categorized into three types: pure ground‐glass opacity (pGGO), part‐solid nodules, and pure solid nodules. Previous studies have confirmed that NSCLC patients with pure solid nodules have an inferior overall survival (OS) and disease‐free survival (DFS) than those with pGGO or part‐solid nodules. 2 , 3 , 4 , 5 , 6
Consolidation‐to‐tumor ratio (CTR) is an indicator of the proportion of solid components to the whole nodule size, which has been widely adopted as one of the screening criteria in clinical studies, especially in clinical trials sponsored by the Japanese Clinical Oncology Group (JCOG). 7 , 8 , 9 Several studies have previously analyzed the optimal cutoff value of CTR to stratify NSCLC patients with different survival. Nevertheless, to date, no consensus has been achieved. A CTR cutoff of 0.25, 0.5, 0.75, and 0.8 has been reported in previous studies. 10 , 11 , 12 , 13 , 14 Therefore, the identification of the optimal CTR cutoff to classify the prognosis of NSCLC patients is crucial and meaningful.
Compared to the pGGO nodules and pure solid nodules, part‐solid nodules are a mixture of both GGO and solid components. However, whether CTR and tumor size have substantial impacts on the prognosis of part‐solid NSCLC remain controversial. 13 , 14 , 15 Kim and colleagues observed that CTR was not an independent prognostic factor for cT1N0 lung adenocarcinoma, irrespective of whether for the whole subject or patients with part‐solid nodules. 16 Ye et al. consistently found that CTR, solid size and tumor size were not associated with the prognosis of lung adenocarcinoma patients with part‐solid nodules. 4 In contrast, Lin et al. revealed that solid component size but not the total tumor size was significant for the prognosis of lung adenocarcinoma with a GGO component. 15 Similarly, no significant survival difference existed between node‐negative adenocarcinoma patients with GGO‐dominant nodules and those with solid‐dominant nodules when the solid component size was similar. 17 Therefore, the prognostic impacts of CTR, total tumor size, and solid component size for part‐solid NSCLC patients requires deeper investigation.
The most noticeable problem concerning the previous studies was that the cutoff value of CTR was selected subjectively, not calculated objectively. In addition, some analyses were performed in mixed subjects with pGGO, part‐solid nodules, and pure solid nodules, not part‐solid specifically, which could result in different findings. 13 , 14 In addition, the status of CTR and tumor size as continuous variables or categorical variables in the multivariate analyses could also lead to variant results. In this study, we evaluated the prognostic impact of CTR and tumor size on NSCLC according to the nodule types by log‐rank test and Cox regression analyses. Meanwhile, we used the “surv_cutpoint” function to suggest the optimal CTR cutoff for the whole NSCLC patients and part‐solid NSCLC patients, respectively.
METHODS
Study subjects
We retrospectively screened pulmonary nodule patients who underwent surgical treatment between January 2009 and December 2018 in our department. Subjects who met the following criteria were initially included in this study: (1) Total tumor size ≤30 mm on thin‐section CT, (2) clinical N0M0, (3) primary NSCLC through histopathological examination, (4) single tumor nodule or the concomitant nodule < microinvasive tumor. Further, patients with (1) a history of other malignancies in the last 5 years, (2) preoperative antitumor therapy, (3) adenocarcinoma in situ, and (4) small cell lung cancer components were excluded. The Ethical Committee of the First Affiliated Hospital of Nanjing Medical University approved this study, and individual consent was waived for this retrospective study.
Radiological evaluation on thin‐section CT
To ensure accurate measurement, CT scans with contiguous thin sections (≤1.5 mm) were used. The maximum diameter of the whole tumor and the solid component in the lung window (window width, 1500 Hounsfield units; window level, −700 Hounsfield units), respectively were measured. The solid component was defined as an area of increased opacification that completely obscured the underlying vascular markings. GGO was defined as an area of a slight, homogenous increase in density that did not obscure the underlying vascular markings. When the solid component was irregular or multiple, multiple‐plane reconstruction was performed and only the single largest solid component was analyzed. CTR was defined as the ratio of the maximum size of solid component to the maximum tumor size. Doctors Gu and Cao performed the measurements separately, which were further checked by Doctor Xu. Controversies were resolved by discussion. The interobserver Kappa values were 0.83 and 0.78 for pGGO and pure solid nodules, respectively.
Patient follow‐up
Patients with invasive lung cancer were followed‐up every 6 months for the first 2 years. During this period, patients were recommended to receive a physical examination, chest CT, and abdominal ultrasonography. Two years later, patients underwent a chest CT scan and abdominal ultrasonography every year. Brain magnetic resonance imaging (MRI), bone ECT, and positron emission tomography (PET)/CT were not routinely performed and patients were advised when there was any sign of a recurrence or metastasis. OS was defined as the date of surgery to the date of death from any cause or the last follow‐up. DFS was defined as the duration from surgical date to the date of first recurrence (metastasis) or death from any cause.
Statistical analysis
In this study, comparison of continuous variables was performed using Student's t‐test or one‐way ANOVA. For categorical variables, the chi‐square χ2 test or Fisher's exact test was adopted. A log‐rank test was used to compare the survival curves between patients. The Kaplan–Meier method was adopted to assess the 5‐year OS and 5‐year DFS, and the Z‐test was employed for the survival rate comparison. Associations between various variables and the prognosis of NSCLC patients were evaluated by the univariate/multivariate Cox proportional hazards regression analyses. The optimal cutoff values of CTR and tumor size to stratify the NSCLC patients were determined by the “surv_cutpoint” function from the “survminer” package. We performed the analyses based on R (4.1.2) and GraphPad Prism 6.01. The significance level of the p‐value was set at 0.05 (two‐sided).
RESULTS
Characteristics of study subjects
In total, 1366 patients were enrolled in this study. There were 416, 510, and 440 subjects with pGGO, part‐solid, and pure solid nodules, respectively. As shown in Table 1, patients with pure solid nodules were of older age, there was a lower percentage of females, a higher smoking rate, larger tumor size, a higher lymph node metastasis, higher expression level of Ki‐67, and more solid and micropapillary components than those with pGGO or part‐solid nodules (p < 0.001). The median follow‐up time was 57 months. During the follow‐up period, 81 deaths of any causes and 131 recurrences (including deaths) were observed. The 5‐year OS and 5‐year DFS were 95.4% (94.1%–96.8%) and 91.2% (89.5%–92.9%) for the whole cohort.
TABLE 1.
Characteristics of patients in the study
| Characteristics | pGGO (n = 416) | Part‐solid (n = 510) | Pure solid (n = 440) | p‐value |
|---|---|---|---|---|
| Age (years) | 54.57 ± 11.73 | 58.72 ± 11.43 | 60.99 ± 10.05 | <0.001 |
| Gender (female %) | 291 (70.0%) | 314 (61.6%) | 209 (47.5%) | <0.001 |
| Smoking history | 44 (10.6%) | 69 (13.5%) | 119 (27.0%) | <0.001 |
| Tumor size (cm) | 1.26 ± 0.43 | 1.73 ± 0.58 | 1.94 ± 0.58 | <0.001 |
| Solid component size (cm) | 0 | 0.86 ± 0.51 | 1.94 ± 0.58 | <0.001 |
| CTR | 0 | 0.49 ± 0.21 | 1 | <0.001 |
| Location | 0.001 | |||
| RUL | 140 (33.7%) | 185 (36.3%) | 125 (28.4%) | |
| RML | 19 (4.6%) | 27 (5.3%) | 37 (8.4%) | |
| RLL | 67 (16.1%) | 83 (16.3%) | 86 (19.5%) | |
| LUL | 119 (28.6%) | 145 (28.4%) | 97 (22.0%) | |
| LLL | 71 (17.1%) | 70 (13.7%) | 95 (21.6%) | |
| Surgical procedures | <0.001 | |||
| Segmentectomy | 370 (88.9%) | 266 (52.2%) | 78 (17.7%) | |
| Wedge resection | 8 (1.9%) | 27 (5.3%) | 30 (6.8%) | |
| Lobectomy | 38 (9.1%) | 217 (42.5%) | 332 (75.5%) | |
| Pathological tumor size (cm) | 0.96 ± 0.36 | 1.32 ± 0.51 | 1.79 ± 0.71 | <0.001 |
| Histopathological types | <0.001 | |||
| MIA | 227 (54.6%) | 70 (13.7%) | 13 (3.0%) | |
| IAC | 189 (45.4%) | 439 (86.1%) | 389 (88.4%) | |
| SCC | 0 | 1 (0.2%) | 29 (6.6%) | |
| Others | 0 | 0 | 9 (2.0%) | |
| Number of lymph nodes sampling | 7.11 ± 4.21 | 10.12 ± 5.24 | 11.38 ± 5.71 | <0.001 |
| Lymph node metastasis | 0 | 11 (2.2%) | 85 (19.3%) | <0.001 |
| Ki‐67 (%) | 7.91 ± 6.87 | 10.34 ± 7.06 | 30.25 ± 24.71 | <0.001 |
| Solid components | 2 (2.4%) | 10 (2.8%) | 54(16.6%) | <0.001 |
| Micropapillary components | 0 | 11 (3.1%) | 46 (14.1%) | <0.001 |
| Differentiation degree | <0.001 | |||
| I | 36 (25.5%) | 66 (17.1%) | 8 (2.0%) | |
| II | 101 (71.6%) | 299 (77.5%) | 215 (54.8%) | |
| III | 4 (2.8%) | 21 (5.4%) | 169 (43.1%) | |
| EGFR mutation | 65 (57.5%) | 164 (79.6%) | 76 (59.8%) | <0.001 |
Note: p < 0.05 was marked in bold.
Abbreviations: CTR, consolidation‐to‐tumor ratio; IAC, invasive adenocarcinoma; LLL, left lower lobe; LUL, left upper lobe; MIA, minimally invasive adenocarcinoma; pGGO, pure ground‐glass opacity; RLL, right lower lobe;RML, right middle lobe; RUL, right upper lobe; SCC, squamous cell carcinoma.
CTR was an independent prognostic factor for clinical T1 NSCLC patients, and the optimal cutoff of CTR was 0.99
We compared the prognosis of NSCLC patients with pGGO, part‐solid, and pure solid nodules. As shown in Figure 1a,b, the pGGO group had a more favorable OS (p = 0.025) and DFS (p = 0.001) than the part‐solid arm. The pure solid group had the worst OS and DFS compared to the pGGO and part‐solid groups (p < 0.001). The 5‐year OS for patients with pGGO, part‐solid, and pure solid nodules were 99.5% (95% CI: 98.8%–100%), 97.3% (95% CI: 95.6%–99.0%), and 90.4% (87.4%–93.6%), respectively (p < 0.001). The 5‐year DFS of pure solid nodule patients was 78.9% (95% CI: 74.9%–83.2%), worse than that of part‐solid patients (95.8%, 95% CI: 93.9%–97.8%, p < 0.001), and pGGO patients (99.5%, 95% CI: 98.8%–100%, p < 0.001). The multivariate Cox regression analyses showed that CTR (as a continuous variable) was significantly associated with a poorer DFS (HR = 8.38, 95% CI: 3.24–21.66, p < 0.001) and OS (HR = 3.80, 95% CI: 1.35–10.72, p = 0.011, Table S1) after adjusting for other potential confounding factors. These results indicated that CTR was an independent factor for cT1 NSCLC prognosis.
FIGURE 1.

Prognostic comparison of non‐small cell lung cancer (NSCLC) patients with pure ground‐glass opacity (pGGO), part‐solid and pure solid nodules, and the optimal consolidation‐to‐tumor ratio (CTR) cutoff for cT1 NSCLC. Patients with pure solid nodules had a poorer (a) overall survival (OS) and (b) DFS than those with pGGO or part‐solid nodules. (c) The optimal CTR cutoff to stratify cT1 NSCLC patients was 0.99 determined by the “surv_cutpoint” function (OS). (d) Patients with pure solid nodules had an inferior prognosis than those with subsolid nodules (CTR ≤0.99, p < 0.001)
The “survminer” package was further adopted to suggest the optimal CTR cutoff to distinguish cT1 NSCLC patients with different prognoses. As shown in Figure 1c, the best CTR cutoff to stratify NSCLC prognosis was 0.99. Subjects were then divided into two groups based on the cutoff of CTR 0.99 (CTR ≤0.99 vs. CTR = 1). The pure solid group had an inferior prognosis than the subsolid group (p < 0.001, Figure 1d). That meant the GGO component, even a small percentage, was crucial for NSCLC prognosis.
CTR was not an independent prognostic factor for part‐solid NSCLC patients, even if categorized by the optimal cutoff
Whether CTR is still meaningful for NSCLC patients with part‐solid nodules remains controversial. According to Table 2, CTR (as a continuous variable) showed no significant association with the prognosis of part‐solid patients, irrespective of whether in the univariate Cox analysis or the multivariate Cox analysis (p > 0.05). Likewise, we used the “survminer” package to determine the optimal cutoff of CTR for part‐solid patients. As indicated in Figure 2a, the optimal CTR cutoff to stratify the part‐solid patients was 0.28 (OS). Notably, when patients were grouped by the cutoff of 0.28, no significant survival difference was observed (p = 0.230, Figure 2b). The predicted cutoff of CTR was 0.75 for DFS (Figure 2c). Part‐solid NSCLC patients with a CTR between 0.75 and 1.00 (open interval) had a worse DFS than those with a CTR ≤0.75 (p = 0.018, Figure 2d). However, was this cutoff an independent prognostic factor for part‐solid NSCLC patients? Table S2 showed that the 0.75 < CTR <1.00 group were of older age (p = 0.027), had a larger solid component size, larger pathological tumor size, and a higher lymph node metastasis rate (p < 0.001) than the 0 < CTR ≤0.75 group. Strikingly, multivariate Cox regression analysis indicated that CTR was still not an independent factor for the DFS of NSCLC with part‐solid nodules (HR = 1.80, 95% CI: 0.64–5.06, p = 0.264). Given the wide usage of CTR values of 0.25 and 0.5 in previous studies, we further compared the prognosis of part‐solid NSCLC patients grouped by CTR of 0.25 and 0.5, respectively. As expected, no significant survival difference existed between patients divided by CTR of 0.25 or 0.5 (Figure S1, p > 0.05). All these findings indicated that CTR was not an independent prognostic factor for part‐solid NSCLC patients, even if grouped by the optimal cutoff.
TABLE 2.
Univariate and multivariate Cox regression analysis for prognosis of part‐solid NSCLC patients
| Characteristics | DFS | OS | ||||
|---|---|---|---|---|---|---|
| Univariate HR (95% CI) | Multivariate HR (95% CI) | p‐value | Univariate HR(95% CI) | Multivariate HR (95% CI) | p‐value | |
| Age | 1.06 (1.02–1.11) | 1.05 (1.01–1.1) | 0.027 | 1.04 (0.99–1.09) | 1.06 (1.00–1.12) | 0.042 |
| Gender (female) | 0.46 (0.20–1.07) | 0.55 (0.20–1.5) | 0.243 | 0.43 (0.16–1.2) | 0.44 (0.13–1.52) | 0.192 |
| Smoking | 2.34 (0.92–6.00) | 1.47 (0.48–4.54) | 0.503 | 2.62 (0.91–7.56) | 1.18 (0.29–4.76) | 0.811 |
| Tumor size (cont. var.) | 2.87 (1.33–6.23) | 1.67 (0.67–4.14) | 0.268 | 1.74 (0.71–4.31) | 0.89 (0.29–2.76) | 0.845 |
| Solid component size | 2.61 (1.32–5.16) | 0.31 (0.01–13.26) | 0.541 | 1.10 (0.45–2.68) | 0.41 (0.15–6.22) | 0.291 |
| CTR (cont. var.) | 5.36 (0.76–37.87) | 2.46 (0.27–22.00) | 0.421 | 0.98 (0.10–9.82) | 0.21 (0.01–3.23) | 0.266 |
| 0.75 < CTR <1 vs. 0 < CTR≤0.75 | 2.81 (1.14–6.90) | 1.80 (0.64–5.06) | 0.264 | 1.28 (0.36–4.50) | 0.63 (0.14–2.89) | 0.549 |
| Surgical procedures | 0.979 | 0.966 | ||||
| Lobectomy | 1.00 | 1.00 | / | 1.00 | 1.00 | / |
| Segmentectomy | 0.60 (0.24–1.47) | 0.97 (0.36–2.58) | 0.946 | 0.87 (0.31–2.41) | 1.16 (0.37–3.63) | 0.795 |
| Wedge resection | 1.36 (0.30–6.10) | 1.15 (0.24–5.56) | 0.861 | 1.10 (0.14–8.79) | 1.13 (0.13–9.93) | 0.910 |
| Histopathological type | ||||||
| MIA vs. IAC | 0.32 (0.04–2.37) | 0.75 (0.09–6.34) | 0.789 | 0.49 (0.06–3.69) | 0.59 (0.07–5.21) | 0.635 |
| N1‐2 vs. N0 | 6.06 (1.71–21.50) | 5.09 (1.17–22.12) | 0.033 | 5.96 (1.60–22.18) | 7.24 (1.43–36.64) | 0.017 |
Note: p < 0.05 was marked in bold; The analyses were performed with tumor size, solid component size, and CTR as continuous and categorial variables, respectively.
Abbreviations: CTR, consolidation‐to‐tumor ratio; HR, hazard ratio; IAC, invasive adenocarcinoma; MIA, minimally invasive adenocarcinoma; NSCLC, non‐small cell lung cancer.
FIGURE 2.

The optimal consolidation‐to‐tumor ratio (CTR) cutoff for part‐solid non‐small cell lung cancer (NSCLC) patients. (a) The “surv_cutpoint” function indicated that the best CTR cutoff was 0.28 for the overall survival (OS) of part‐solid NSCLC patients. (b) No significant OS difference was observed between patients with a CTR between 0.28 and 1 and those with a CTR ≤0.28 (p = 0.230). (c) The optimal CTR cutoff was 0.75 for the disease‐free survival (DFS) of NSCLC patients with part‐solid nodules. (d) NSCLC patients with CTR of 0.75–1 (open interval) had a worse prognosis than those with CTR ≤0.75 (p = 0.018)
Total tumor size and solid component size were associated with the prognosis of NSCLC patients with part‐solid nodules
Tumor size is a vital factor for the prognosis of NSCLC patients. However, it is still under debate whether tumor size has independent impacts on the prognosis of cT1 part‐solid NSCLC patients. As shown in Table 2 in our study, when tumor size was seen as a continuous variable, it was not associated with part‐solid NSCLC prognosis in multivariate Cox regression analysis. To illustrate whether tumor size had a substantial effect on the prognosis of part‐solid NSCLC patients, the “surminer” package was further adopted. As a result, a cutoff of 2.40 cm was determined (Figure 3a). As grouped by the cutoff, patients with a larger tumor (>2.40 cm) had an inferior prognosis than those with a smaller tumor (≤2.40 cm, p < 0.001, Figure 3b). Multivariate Cox regression analysis indicated that tumor size (as a categorial variable) was an independent prognostic factor for part‐solid NSCLC patients (HR = 6.21, 95% CI: 1.58–24.34, p = 0.009, Table 3). Solid component size in part‐solid nodules was reported independently associated with the survival of NSCLC patients. Therefore, we further explored the optimal cutoff of solid component size. A cutoff of 1.4 cm was identified (Figure 3c). Patients with solid component size larger than 1.4 cm had a poorer prognosis than those with solid component size ≤1.40 cm (p = 0.002, Figure 3d). In the multivariate Cox regression analysis, solid component size (grouped by the cutoff of 1.4 cm) showed a significant association with part‐solid NSCLC prognosis when age, total tumor size, lymph node status, and other factors were adjusted (HR = 2.27, 95% CI: 1.04–5.92, p = 0.045, Table 3), suggesting that solid component size also had an independent prognostic impact for part‐solid NSCLC.
FIGURE 3.
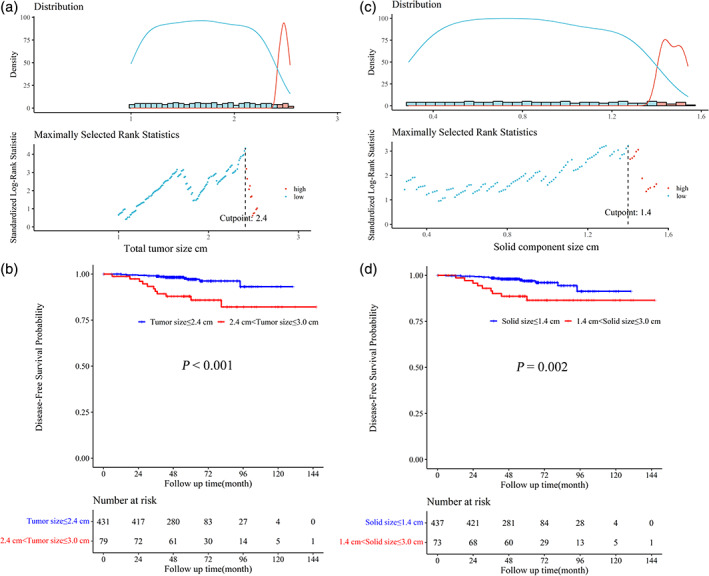
The optimal total tumor size and solid component size cutoff values for part‐solid non‐small cell lung cancer (NSCLC) patients. (a) The optimal tumor size cutoff was 2.4 cm for part‐solid NSCLC patients. (b) The prognosis of patients with a larger tumor size (2.4–3.0 cm) was significantly poorer than that of subjects with tumor size ≤2.4 cm (p < 0.001). (c) The identified optimal solid component size cutoff was 1.4 cm for part‐solid NSCLC patients. (d) NSCLC patients with larger solid component size (1.4–3.0 cm) had an inferior prognosis than those with solid component size ≤1.4 cm (p = 0.002)
TABLE 3.
Univariate and multivariate Cox regression analysis for DFS of part‐solid NSCLC patients (optimal cutoff)
| Characteristics | DFS: Total tumor size cutoff 2.4 cm | Characteristics | DFS: Solid component size cutoff 1.4 cm | ||||
|---|---|---|---|---|---|---|---|
| Univariate HR (95% CI) | Multivariate HR (95% CI) | p‐value | Univariate HR (95% CI) | Multivariate HR (95% CI) | p‐value | ||
| Age | 1.06 (1.02–1.11) | 1.05 (1.01–1.10) | 0.018 | Age | 1.06 (1.02–1.11) | 1.05 (1.01–1.1) | 0.025 |
| Gender (female) | 0.46 (0.20–1.07) | 0.46 (0.17–1.28) | 0.135 | Gender (Female) | 0.46 (0.20–1.07) | 0.56 (0.21–1.54) | 0.265 |
| Smoking | 2.34 (0.92–6.00) | 1.42 (0.45–4.45) | 0.551 | Smoking | 2.34 (0.92–6.00) | 1.48 (0.48–4.58) | 0.492 |
| CTR (cont. var.) | 5.36 (0.76–37.87) | 32.39 (0.42–51.93) | 0.117 | CTR (cont. var.) | 5.36 (0.76–37.87) | 1.48 (0.08–27.1) | 0.792 |
| Total tumor size | Total tumor size | 2.87 (1.33–6.23) | 1.42 (0.47–4.26) | 0.535 | |||
| ≤2.40 cm | 1.00 | 1.00 | / | Solid component size | |||
| 2.40 ~ 3.0 cm | 5.05 (2.17–11.74) | 6.21 (1.58–24.34) | 0.009 | ≤1.40 cm | 1.00 | 1.00 | / |
| Solid component size | 2.61 (1.32–5.16) | 0.29 (0.05–1.83) | 0.186 | 1.40 ~ 3.0 cm | 3.51 (1.48–8.29) | 2.27 (1.04–5.92) | 0.045 |
| Surgical procedures | 0.995 | Surgical procedures | 0.993 | ||||
| Segmentectomy | 1.00 | 1.00 | / | Segmentectomy | 1.00 | 1.00 | / |
| Wedge resection | 2.27 (0.48–10.71) | 0.92 (0.18–4.81) | 0.922 | Wedge resection | 2.27 (0.48–10.71) | 1.11 (0.21–5.82) | 0.905 |
| Lobectomy | 1.67 (0.68–4.09) | 0.98 (0.37–2.62) | 0.969 | Lobectomy | 1.67 (0.68–4.09) | 1.03 (0.39–2.76) | 0.950 |
| MIA vs. IAC | 0.32 (0.04–2.37) | 0.68 (0.08–5.64) | 0.720 | MIA vs. IAC | 0.32 (0.04–2.37) | 0.69 (0.08–6.00) | 0.739 |
| N1‐2 vs. N0 | 6.06 (1.71–21.5) | 3.72 (1.04–14.97) | 0.038 | N1‐2 vs. N0 | 6.06 (1.71–21.5) | 3.53 (1.06–14.54) | 0.036 |
Note: p < 0.05 was marked in bold.
Abbreviations: CTR, consolidation‐to‐tumor ratio; DFS, disease‐free survival; IAC, invasive adenocarcinoma; MIA, minimally invasive adenocarcinoma; NSCLC, non‐small cell lung cancer.
DISCUSSION
The prognostic impacts of CTR, total tumor size, and solid component size on NSCLC have drawn many researchers' concerns. However, no consensus has been reached. In the current study, through systematic analyses, we found that CTR was not an independent prognostic factor for part‐solid NSCLC, while total tumor size and solid component size were associated with the survival of part‐solid NSCLC patients.
Consistent with previous studies, the present study showed that NSCLC patients with pure solid nodules had the worst prognosis, while those with pure GGO nodules had the most favorable prognosis. 2 , 4 , 6 Multivariable Cox regression analysis indicated that CTR was an independent prognostic factor for the entire NSCLC patients. Thus, which was the optimal prognostic cutoff of CTR for cT1 NSCLC patients? As we know, several CTR cutoffs have been reported and adopted previously, including 0.25, 0.5, 0.75, and 0.8. 11 , 12 , 13 , 14 , 18 However, all these cutoffs were determined subjectively, not calculated statistically. In the current study, we identified the optimal CTR cutoff by using the “surv_cutpoint” function. As a result, a CTR cutoff of 0.99 was determined. That meant the presence of even a small proportion of GGO components had the most important effects on the prognosis of NSCLC patients. Limited studies have emphasized the prognostic importance of the GGO component. 3 , 19 , 20 For example, Watanabe et al. compared the prognosis of patients with pure solid nodules and those with nearly pure solid nodules (0.75 ≤ CTR <1.0). They found that the pure solid group had a worse prognosis. 20 A similar result was observed by Kamigaichi and colleagues. 3 Taken together, the presence or absence of the GGO component is fundamental for the prognosis of cT1 NSCLC.
Part‐solid NSCLC showed distinct clinicopathological characteristics and prognosis with the pGGO and pure solid nodules. Therefore, the impacts of CTR and tumor size on the survival of part‐solid NSCLC could be different. Previous studies reported that CTR was not associated with the prognosis of NSCLC with part‐solid nodules. 4 , 19 , 21 Consistently, we did not observe a significant association between CTR (as a continuous variable) and the prognosis of NSCLC patients with part‐solid nodules. For the first time, we analyzed the optimal CTR cutoff for part‐solid NSCLC. When OS was the endpoint, the optimal CTR cutoff was 0.28. However, no significant survival difference existed when patients were grouped according to this cutoff. This analysis was further performed with DFS as the endpoint, and a CTR cutoff of 0.75 was determined. Patients with a CTR >0.75 had a poorer DFS than those with a CTR ≤0.75. In the univariate Cox regression analysis, CTR grouped by 0.75 was significantly associated with part‐solid NSCLC prognosis. However, no significant association existed after adjusting for other potential confounding factors, suggesting that this cutoff was not an independent prognostic factor for part‐solid NSCLC. Given that CTR cutoffs of 0.25 and 0.5 are widely used, we further compared the prognosis of patients divided by these two cutoffs. As expected, no significant survival difference was found, irrespective of the cutoff of 0.5 or 0.25. All these findings suggest that CTR has no independent prognostic significance for part‐solid NSCLC.
Some investigators found that neither maximum tumor size nor solid component size was a prognostic factor for part‐solid NSCLC. 4 , 21 , 22 In contrast, Lin et al. demonstrated that solid component size had a prognostic impact on part‐solid lung adenocarcinoma. 15 Similarly, Mimae et al. and Han et al. reported that solid component size influenced the prognosis of GGO‐mixed T1N0 lung adenocarcinoma. 17 , 23 In this study, we determined 1.4 cm as the optimal cutoff of solid component size according to the “surv_cutpoint” function. The prognosis of patients with solid component size ≤1.4 cm was better than that of patients with solid component size >1.4 cm. The multivariate analysis also indicated that solid component size (categorized by this cutoff) was significantly associated with part‐solid NSCLC prognosis after adjusting for other confounding factors. These results suggested that solid component size had substantial impacts on the prognosis of part‐solid NSCLC patients. Many previous studies have indicated that the total tumor size had no independent prognostic significance for part‐solid nodules. 4 , 15 , 19 , 21 Likewise, we did not observe a significant association between total tumor size (as a continuous variable) and NSCLC survival based on multivariable Cox regression analysis. Further, we identified 2.4 cm as the optimal cutoff of the whole tumor size for cT1 part‐solid NSCLC. Patients with maximum tumor size >2.4 cm had an inferior prognosis than those with total tumor size ≤2.4 cm. The multivariate Cox regression analysis showed that total tumor size categorized by the optimal cutoff was significantly associated with the prognosis of part‐solid NSCLC with adjustment for other variables. Because of the excellent survival of cT1 NSCLC patients with part‐solid nodules, the impact of tumor size could be weakened, which might account for the insignificant findings in previous studies. The eighth edition of the TNM classification system recommends the largest solid component size for staging for part‐solid adenocarcinoma since the solid component size shows a better discrimination ability than the total tumor size. 24 However, it does not mean that the whole tumor size is not associated with part‐solid NSCLC prognosis. This staging system also emphasizes that the total tumor size should be recorded. 24 Consistent with our findings, Kim et al. found that the total tumor size was a significant prognostic factor for cT1b adenocarcinoma patients and could further stratify the prognosis of cT1b part‐solid adenocarcinoma. 25
Although solid component size is a better discriminator than total tumor size, the current TNM staging system also has some limitations. First, many studies (including the present study) have shown that nodule type is a fundamental prognostic factor for cT1N0M0 NSCLC. As many researchers have suggested, the next edition of TNM staging should be more precise in considering the types of nodule: pure GGO, part‐solid, or pure solid nodules. 19 , 22 Second, this staging system uses the solid component size to represent the invasive size. However, the invasive size is not identical to the solid component size. Stroma, alveolar collapse, fibrosis, inflammatory cells, and pathological mucus could also appear as solid components. 26 , 27 Third, this staging system is unsuitable for mucinous adenocarcinoma and other histological subtypes of NSCLC. 24 Fourth, which CT window setting should be used for measuring the solid component is still under debate. In addition, in several studies, measuring the solid component size for atypical nodules was difficult, especially for GGO with scattered consolidations, with GGO mimicking organizing pneumonia. 28 , 29 In addition, the current guidelines for NSCLC treatment are based on the largest tumor diameter. More studies are warranted to construct a new system based on the eighth TNM staging. 30 Our findings suggested that despite the weakened impact, the total tumor size was still meaningful for the prognosis of NSCLC patients with part‐solid nodules. The total tumor size might continue to play important roles in the diagnosis, treatment, and staging of early‐stage NSCLC.
In general, this study had two prominent advantages. First, it had a large sample size with a median follow‐up time of 57 months. Many studies have a limited sample size and a short follow‐up time, which could result in false negative results. Second, we performed a systemic analysis. In addition to the log‐rank test, univariate and multivariate Cox regression analysis, the “surv_cutpoint” function was further adopted to determine the optimal CTR and tumor size cutoff values. However, this study also had some limitations. It was a single center retrospective study and the identified cutoff values remain to be validated in other independent cohorts. In addition, patients with part‐solid cT1N0M0 NSCLC had an excellent prognosis. Therefore, the number of dead or cases of recurrence was limited, which might influence the cutoff values of CTR and tumor size. Further studies are therefore warranted to validate our findings.
In conclusion, the presence of a GGO component was crucial for the prognosis of cT1 NSCLC. CTR was not an independent prognostic factor for cT1 part‐solid NSCLC, while total tumor size and solid component size were associated with the prognosis of part‐solid NSCLC patients.
AUTHOR CONTRIBUTIONS
Zhihua Li: Conceptualization, Writing‐original draft, Methodology, Formal analysis; Wenzheng Xu: Data curation, Methodology, Formal analysis, Resources, Software; Tianhao Gu: Data curation, Writing‐original draft, Investigation, Resources; Xinceng Cao: Writing‐original draft, Data curation, Methodology; Weibing Wu: Supervision, Resources, Funding acquisition; Liang Chen: Conceptualization, Writing‐original draft, Project administration, Resources, Funding acquisition.
CONFLICT OF INTEREST
The authors have no conflicts of interest to declare.
Supporting information
Table S1. Univariate and multivariate Cox regression analysis for prognosis of clinical T1 NSCLC patients.
Table S2. Characteristics comparison of NSCLC patients with 0 < CTR≤0.75 vs. 0.75 < CTR <1.
Figure S1. Prognostic comparison of part‐solid NSCLC patients grouped by the CTR cutoff of 0.25 and 0.5.
ACKNOWLEDGMENTS
We thank the study participants and research staff for their contributions and commitment to this study. This work was supported by the National Natural Science Foundation of China (81972175 & 82203296), the Key Project of Jiangsu Commission of Health (ZD2022055), and the specific cohort A for lung cancer of Nanjing Medical University (NMUC2019005A).
Li Z, Xu W, Gu T, Cao X, Wu W, Chen L. Tumor size, but not consolidation‐to‐tumor ratio, is an independent prognostic factor for part‐solid clinical T1 non‐small cell lung cancer. Thorac Cancer. 2023;14(6):602–611. 10.1111/1759-7714.14788
Zhihua Li and Wenzheng Xu contributed equally to this article.
Funding information Key Project of Jiangsu Commission of Health, Grant/Award Number: ZD2022055; National Natural Science Foundation of China, Grant/Award Numbers: 81972175, 82203296; the specific cohort A for lung cancer of Nanjing Medical University, Grant/Award Number: NMUC2019005A
Contributor Information
Weibing Wu, Email: wuweibing95@126.com.
Liang Chen, Email: clbright0909@njmu.edu.cn.
REFERENCES
- 1. Bray F, Ferlay J, Soerjomataram I, Siegel RL, Torre LA, Jemal A. Global cancer statistics 2018: GLOBOCAN estimates of incidence and mortality worldwide for 36 cancers in 185 countries. CA Cancer J Clin. 2018;68(6):394–424. [DOI] [PubMed] [Google Scholar]
- 2. Hattori A, Suzuki K, Takamochi K, Wakabayashi M, Aokage K, Saji H, et al. Prognostic impact of a ground‐glass opacity component in clinical stage IA non‐small cell lung cancer. J Thorac Cardiovasc Surg. 2021;161(4):1469–80. [DOI] [PubMed] [Google Scholar]
- 3. Kamigaichi A, Tsutani Y, Mimae T, Miyata Y, Shimada Y, Ito H, et al. The prognostic impact of the ground‐glass opacity component in nearly pure‐solid stage IA non‐small‐cell lung cancer. Eur J Cardiothorac Surg. 2022;62(3):ezac166. [DOI] [PubMed] [Google Scholar]
- 4. Ye T, Deng L, Wang S, Xiang J, Zhang Y, Hu H, et al. Lung adenocarcinomas manifesting as radiological part‐solid nodules define a special clinical subtype. J Thorac Oncol. 2019;14(4):617–27. [DOI] [PubMed] [Google Scholar]
- 5. Mao R, She Y, Zhu E, Chen D, Dai C, Wu C, et al. A proposal for restaging of invasive lung adenocarcinoma manifesting as pure ground glass opacity. Ann Thorac Surg. 2019;107(5):1523–31. [DOI] [PubMed] [Google Scholar]
- 6. Wang C, Wu Y, Li J, Ren P, Gou Y, Shao J, et al. Distinct clinicopathologic factors and prognosis based on the presence of ground‐glass opacity components in patients with resected stage I non‐small cell lung cancer. Ann Transl Med. 2020;8(18):1133. [DOI] [PMC free article] [PubMed] [Google Scholar]
- 7. Asamura H, Hishida T, Suzuki K, Koike T, Nakamura K, Kusumoto M, et al. Radiographically determined noninvasive adenocarcinoma of the lung: survival outcomes of Japan clinical oncology group 0201. J Thorac Cardiovasc Surg. 2013;146(1):24–30. [DOI] [PubMed] [Google Scholar]
- 8. Suzuki K, Watanabe SI, Wakabayashi M, Saji H, Aokage K, Moriya Y, et al. A single‐arm study of sublobar resection for ground‐glass opacity dominant peripheral lung cancer. J Thorac Cardiovasc Surg. 2022;163(1):289–301 e2. [DOI] [PubMed] [Google Scholar]
- 9. Aokage K, Saji H, Suzuki K, Mizutani T, Katayama H, Shibata T, et al. A non‐randomized confirmatory trial of segmentectomy for clinical T1N0 lung cancer with dominant ground glass opacity based on thin‐section computed tomography (JCOG1211). Gen Thorac Cardiovasc Surg. 2017;65(5):267–72. [DOI] [PubMed] [Google Scholar]
- 10. Aokage K, Yoshida J, Ishii G, Matsumura Y, Haruki T, Hishida T, et al. Identification of early t1b lung adenocarcinoma based on thin‐section computed tomography findings. J Thorac Oncol. 2013;8(10):1289–94. [DOI] [PubMed] [Google Scholar]
- 11. Yip R, Li K, Liu L, Xu D, Tam K, Yankelevitz DF, et al. Controversies on lung cancers manifesting as part‐solid nodules. Eur Radiol. 2018;28(2):747–59. [DOI] [PMC free article] [PubMed] [Google Scholar]
- 12. Huang TW, Lin KH, Huang HK, Chen YI, Ko KH, Chang CK, et al. The role of the ground‐glass opacity ratio in resected lung adenocarcinoma. Eur J Cardiothorac Surg. 2018;54(2):229–34. [DOI] [PubMed] [Google Scholar]
- 13. Yoon DW, Kim CH, Hwang S, Choi YL, Cho JH, Kim HK, et al. Reappraising the clinical usability of consolidation‐to‐tumor ratio on CT in clinical stage IA lung cancer. Insights Imaging. 2022;13(1):103. [DOI] [PMC free article] [PubMed] [Google Scholar]
- 14. Xi J, Yin J, Liang J, Zhan C, Jiang W, Lin Z, et al. Prognostic impact of radiological consolidation tumor ratio in clinical stage IA pulmonary ground glass opacities. Front Oncol. 2021;11:616149. [DOI] [PMC free article] [PubMed] [Google Scholar]
- 15. Lin B, Wang R, Chen L, Gu Z, Ji C, Fang W. Should resection extent be decided by total lesion size or solid component size in ground glass opacity‐containing lung adenocarcinomas? Transl Lung Cancer Res. 2021;10(6):2487–99. [DOI] [PMC free article] [PubMed] [Google Scholar]
- 16. Kim H, Goo JM, Kim YT, Park CM. Consolidation‐to‐tumor ratio and tumor disappearance ratio are not independent prognostic factors for the patients with resected lung adenocarcinomas. Lung Cancer. 2019;137:123–8. [DOI] [PubMed] [Google Scholar]
- 17. Han SJ, Jeon JH, Jung W, Seong YW, Cho S, Kim K, et al. Do ground‐glass opacity‐dominant features have prognostic significance in node‐negative adenocarcinomas with invasive components of similar sizes? Eur J Cardiothorac Surg. 2020;57(6):1189–94. [DOI] [PubMed] [Google Scholar]
- 18. Su H, Dai C, Xie H, Ren Y, She Y, Kadeer X, et al. Risk factors of recurrence in patients with clinical stage IA adenocarcinoma presented as ground‐glass nodule. Clin Lung Cancer. 2018;19(5):e609–e17. [DOI] [PubMed] [Google Scholar]
- 19. Hattori A, Matsunaga T, Takamochi K, Oh S, Suzuki K. Importance of ground glass opacity component in clinical stage IA radiologic invasive lung cancer. Ann Thorac Surg. 2017;104(1):313–20. [DOI] [PubMed] [Google Scholar]
- 20. Watanabe Y, Hattori A, Nojiri S, Matsunaga T, Takamochi K, Oh S, et al. Clinical impact of a small component of ground‐glass opacity in solid‐dominant clinical stage IA non‐small cell lung cancer. J Thorac Cardiovasc Surg. 2022;163(3):791–801 e4. [DOI] [PubMed] [Google Scholar]
- 21. Hattori A, Matsunaga T, Takamochi K, Oh S, Suzuki K. Neither maximum tumor size nor solid component size is prognostic in part‐solid lung cancer: impact of tumor size should Be applied exclusively to solid lung cancer. Ann Thorac Surg. 2016;102(2):407–15. [DOI] [PubMed] [Google Scholar]
- 22. Deng J, Zhao M, Wang T, She Y, Wu J, Haoran E, et al. A modified T categorization for part‐solid lesions in Chinese patients with clinical stage I non‐small cell lung cancer. Lung Cancer. 2020;145:33–9. [DOI] [PubMed] [Google Scholar]
- 23. Mimae T, Tsutani Y, Miyata Y, Imai K, Ito H, Nakayama H, et al. Solid tumor size of 2 cm divides outcomes of patients with mixed ground glass opacity lung tumors. Ann Thorac Surg. 2020;109(5):1530–6. [DOI] [PubMed] [Google Scholar]
- 24. Travis WD, Asamura H, Bankier AA, Beasley MB, Detterbeck F, Flieder DB, et al. The IASLC lung cancer staging project: proposals for coding T categories for subsolid nodules and assessment of tumor size in part‐solid tumors in the forthcoming eighth edition of the TNM classification of lung cancer. J Thorac Oncol. 2016;11(8):1204–23. [DOI] [PubMed] [Google Scholar]
- 25. Kim H, Goo JM, Suh YJ, Park CM, Kim YT. Implication of total tumor size on the prognosis of patients with clinical stage IA lung adenocarcinomas appearing as part‐solid nodules: does only the solid portion size matter? Eur Radiol. 2019;29(3):1586–94. [DOI] [PubMed] [Google Scholar]
- 26. Yanagawa M, Kusumoto M, Johkoh T, Noguchi M, Minami Y, Sakai F, et al. Radiologic‐pathologic correlation of solid portions on thin‐section CT images in lung adenocarcinoma: a multicenter study. Clin Lung Cancer. 2018;19(3):e303–e12. [DOI] [PubMed] [Google Scholar]
- 27. Kameda K, Eguchi T, Lu S, Qu Y, Tan KS, Kadota K, et al. Implications of the eighth edition of the TNM proposal: invasive versus Total tumor size for the T descriptor in pathologic stage I‐IIA lung adenocarcinoma. J Thorac Oncol. 2018;13(12):1919–29. [DOI] [PMC free article] [PubMed] [Google Scholar]
- 28. Fukui M, Takamochi K, Ouchi T, Koike Y, Yaguchi T, Matsunaga T, et al. Evaluation of solid portions in non‐small cell lung cancer‐the solid part is not always measurable for clinical T factor. Jpn J Clin Oncol. 2021;51(1):114–9. [DOI] [PubMed] [Google Scholar]
- 29. Ahn H, Lee KW, Lee KH, Kim J, Kim K, Chung JH, et al. Effect of computed tomography window settings and reconstruction plane on 8th edition T‐stage classification in patients with lung adenocarcinoma manifesting as a subsolid nodule. Eur J Radiol. 2018;98:130–5. [DOI] [PubMed] [Google Scholar]
- 30. Lin PMF, Hsin MK. New T1 classification. Gen Thorac Cardiovasc Surg. 2020;68(7):665–71. [DOI] [PubMed] [Google Scholar]
Associated Data
This section collects any data citations, data availability statements, or supplementary materials included in this article.
Supplementary Materials
Table S1. Univariate and multivariate Cox regression analysis for prognosis of clinical T1 NSCLC patients.
Table S2. Characteristics comparison of NSCLC patients with 0 < CTR≤0.75 vs. 0.75 < CTR <1.
Figure S1. Prognostic comparison of part‐solid NSCLC patients grouped by the CTR cutoff of 0.25 and 0.5.