

Abstract
The study aimed to develop a clinical diagnosis system to identify patients in the GD risk group and reduce unnecessary oral glucose tolerance test (OGTT) applications for pregnant women who are not in the GD risk group using deep learning algorithms. With this aim, a prospective study was designed and the data was taken from 489 patients between the years 2019 and 2021, and informed consent was obtained. The clinical decision support system for the diagnosis of GD was developed using the generated dataset with deep learning algorithms and Bayesian optimization. As a result, a novel successful decision support model was developed using RNN-LSTM with Bayesian optimization that gave 95% sensitivity and 99% specificity on the dataset for the diagnosis of patients in the GD risk group by obtaining 98% AUC (95% CI (0.95–1.00) and p < 0.001). Thus, with the clinical diagnosis system developed to assist physicians, it is planned to save both cost and time, and reduce possible adverse effects by preventing unnecessary OGTT for patients who are not in the GD risk group.
Graphical Abstract
Supplementary Information
The online version contains supplementary material available at 10.1007/s11517-023-02800-7.
Keywords: Gestational diabetes (GD), Clinical decision support system, Deep learning, Bayesian optimization, SVM, Random forest
Introduction
Gestational diabetes (GD) is a disease characterized by carbohydrate intolerance that develops under the influence of placental hormones during pregnancy. Recent evidence has demonstrated the importance of appropriate identification and management of all pregnancies with GD. However, there is no consensus on which pregnant women will be screened to identify these patients. It is suggested by some international and national authorities [1, 2] that the diagnosis of GD will increase a lot with the new criteria, and this may cause economic and emotional problems. For this reason, different approaches have been developed by WHO (World Health Organization) and some other authorities. Currently, the oral glucose tolerance test (OGTT) is the most guidelines-recommended method of diagnosis for GD.
Many risk factors for GD have been identified. Commonly accepted ones are maternal age, increased BMI, ethnicity, family history of type 2 diabetes, and a history of GD in a previous pregnancy. Additional risk factors can be listed as giving birth to a macrosomic baby in a previous pregnancy, poor pregnancy outcomes, glucosuria, polyhydramnios or a pre-developmental fetus according to the week of gestation, polycystic ovary syndrome, and cardiovascular disease history. Due to its negative effects on maternal and perinatal mortality and morbidity and its increasing frequency, a clear consensus has not yet been reached on the selective (only in the risk-bearing pregnant group) or universal (all pregnant women) screening of GD, which is one of the current issues in studies conducted in Perinatology and Neonatology. In the single or double-step oral glucose tolerance test methods used in screening and diagnosis between 24 and 28 weeks, data on the ideal threshold value to improve pregnancy outcomes are still insufficient. In the Cochrane review conducted in 2015, it was shown that no specific screening test is optimal [3].
The universality of the group to be screened brings unnecessary test load, and because the standardization of the screening threshold and the relationship between the values and pregnancy outcomes are not clear in selected group screening, GD is diagnosed more than necessary [4].
Although it is estimated to occur in 6–9% of pregnant women, its incidence varies between 1 and 22% depending on the population examined and the diagnostic methods used [5]. In addition, it is estimated that 70% of these women will develop type 2 diabetes in an average of 22–28 years after pregnancy [6, 7].
In the study [8], published in the Nature journal in 2017 and mentioned to be the first in the literature for GD prediction based on machine learning methods, the accuracy of positive samples was obtained as 62.16% in 438 data. In another study, the data of 650 patients diagnosed with diabetes were divided into three clusters GD, type 1 diabetes, and type 2 diabetes based on 14 parameters using the K-means algorithm [9]. Artzi et al. [10] used a machine learning approach to predict GD, based on retrospective data from 588,622 pregnant women in Israel (AUC = 0.80), and in another study [11], the predicted value of fasting blood glucose for the next year was obtained with an accuracy of (AUC = 0.82), with the developed model using the retrospective EHR of 1000 patients obtained from a hospital in China. Wu et al. [12] developed a GD prediction model using 1st-trimester patient records with machine learning methods (AUC = 0.70–0.77) as training and test sets of 16,819 and 14,992 respectively, while a mobile application [13] was developed for the diagnosis of GD using traditional machine learning algorithms on the data of 12,304 pregnant women in another study.
Especially in recent years, it has been seen that the studies on the diagnosis of GD developed with machine learning have gained popularity. However, the biggest limitations of these studies have been reported as the use of retrospective data and low sensitivity values. With this aim, the study was designed prospectively and the dataset has been collected between the 2019 and 2021 years, about 75% of which was used for development, and the remainder was used for validation of the model. Therefore, the present study aimed to prevent unnecessary OGTT (gold standard test for GD diagnosis) for patients who are not in the risk group by identifying the patients in the GD risk group.
Within the scope of the study, the glossary of some professional terms and their explanations are given in the supplementary file as Table S1.
Materials and methods
Data analysis
The study was supported by The Scientific and Technological Research Council of Turkey (TUBITAK), and necessary ethics committee approval was taken. In the study, the parameters were determined by three specialist physicians based on the literature. Data were collected prospectively by three specialist physicians for each patient who had not been diagnosed with diabetes before, in line with patient consent forms. The criteria for the patients included in the study are listed below:
Inclusion criteria:
Women
Being pregnant
Volunteering
Exclusion criteria:
Previous diagnosis of diabetes
The end of the 1st trimester at the first examination
Before the adoption of the IADPSG (The International Association of the Diabetes and Pregnancy Study Groups) [14] criteria in Turkey, the diagnosis of GD was performed in two stages for a while by TEMD (Turkish Society of Endocrinology and Metabolism) [15]; in pregnant women OGTT with 50 g of glucose before and with 1 h PG (plasma glucose) above 140 mg/dl; then 75 g of glucose was recommended. It is recommended that pregnant women who have at least two of the FPG (fasting plasma glucose) ≥ 95 mg/dl or 1-st PG ≥ 180 mg/dl or 2-st PG ≥ 155 mg/dl in this test should be considered GD [2]. Considering the financial burden of universal screening and the emotional stress it gives to the patient, physicians think that determining the risk of developing GD during pregnancy based on individual risk factors and performing a screening test for high-risk patients will increase the quality of health care [1, 16].
GD diagnostic test: 75 g OGTT values, 8–14 h fasting, and 75 g oral glucose tolerance test were requested after three days of restricted diet and physical activity.
The presence of a single abnormal value in the OGTT results was considered sufficient to diagnose gestational diabetes. Fasting blood sugar of 92 mg/dl and above after 75 g sugar loading, 180 mg/dl and above in the 1st hour, and 153 mg/dl and above in the 2nd hour were considered abnormal. In this way, patients with and without a diagnosis of GD were determined [2, 17] which was the outcome of the prediction model.
The ethical approval was given in Fig. A1 in the Appendix.
In the study, the summary of the follow-up diagram for the participants is given in Fig. 1.
Fig. 1.

The summary of the follow-up diagram for the participants
The data were collected prospectively from the patients who came to the clinic, and informed consent was obtained between January 2019 and March 2021 from Karadeniz Technical University Medical Faculty Farabi Hospital (Trabzon city), Recep Tayyip Erdoğan University Medical Faculty Rize Hospital (Rize city), and Ordu University Medical Faculty Ordu Hospital (Ordu city), in Turkey. The dataset has 489 patient records which were taken in two steps, i.e., 1st and 2nd trimesters, despite the difficulties of the COVID-19 pandemic conditions. Three hundred fifty-nine patients out of a total of 489 were used for development, whereas 130 patients have been used for validation of the model. Furthermore, resampling and cross-validation methods were also used and all the results were analyzed and compared.
Our dataset has 489 patient records and 73 variables and the measures have been taken at 1st and 2nd-trimester visits of the patients. The study size was over the average which was sufficient for prediction models using machine learning methods based on the literature.
In the preprocessing step, missing data imputation was implemented for limited missing values in the dataset. With this aim, k-nearest neighbor (KNN) and logistic regression methods were used for continuous and categorical variables, respectively. KNN is a popular method [18, 19] for missing data imputation which uses the similarity between data to infer the missing data for continuous data.
The logistic regression models are effective imputation models that take the two-way associations between variables well and perform quite well on each variable, so they are often used [20, 21]. In the proposed study, multinomial and proportional odds logistic imputation models were used for nominal and ordinal variables, respectively.
Prediction models for diagnosis of GD
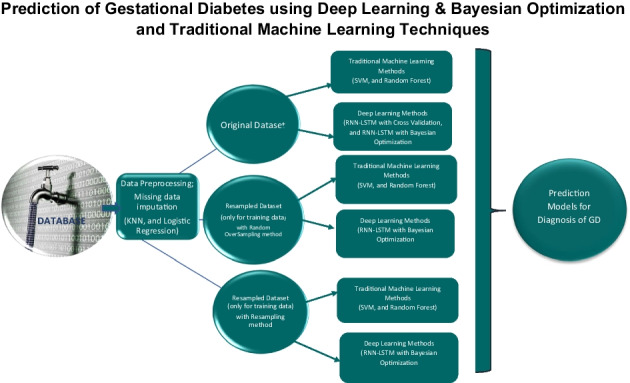
The collected dataset has 489 patients, 71 of whom have GD and the remaining 418 do not have GD diagnosis, which points to an imbalanced dataset. In this context, different decision models for the diagnosis of GD were developed using different approaches to increase performance as shown in Table 1 and all the obtained results were evaluated and compared. The schema about the process steps is given in Fig. 2.
Table 1.
The explanations of the different approaches used in the development of models
| Original data | Bootstrap | Traditional machine learning | Deep learning | K-Fold cross validation | Weighted K-fold cross validation | |
|---|---|---|---|---|---|---|
| Scenario 1 | Yes | - | SVM, random forest | - | - | - |
| Scenario 2 | Yes | - | - | RNN-LSTM | 5-Fold cross-validation | - |
| Scenario 3 | Yes | - | - | RNN-LSTM | - | Weighted fivefold cross-validation |
| Scenario 4 | Yes | Random over sampling | SVM, random forest | - | - | - |
| Scenario 5 | Yes | Resampling | SVM, random forest | - | - | - |
| Scenario 6 | Yes | Random over sampling | - | RNN-LSTM and BO | - | - |
| Scenario 7 | Yes | Resampling | - | RNN-LSTM and BO | - | - |
| Scenario 8 | Yes | - | - | RNN-LSTM and BO | - | - |
Fig. 2.

The schema of the study
For the original dataset, 5 models were developed; in 2 of them, SVM and random forest algorithms were used as traditional machine learning methods, while in the remaining 3 of them, recurrent neural network — long short-term memory (RNN — LSTM), fivefold cross-validation with RNN-LSTM, and weighted fivefold cross-validation with RNN-LSTM algorithms were used as deep learning methods.
Cross-validation (CV) is one of the most popular techniques in machine learning to estimate the risk which gives an unbiased estimate of the risk for a limited number of samples [22]. Weighted CV (WCV) assigns smaller weights to outliers not to emphasize their effect of them on the CV score that has been studied in statistics [23]. It provides a much better estimation than CV, which gives an almost unbiased risk estimate even under the covariate shift.
As seen in Table 1, models were developed for the decision support system using many approaches to improve performance and make a comprehensive evaluation. Respectively in scenarios 1, 2, and 3, the original dataset was used with traditional machine learning (SVM, random forest), deep learning (RNN-LSTM) and fivefold cross-validation icon, and deep learning (RNN-LSTM) and weighted fivefold cross-validation. In scenarios 4, 5, 6, and 7, resampled dataset obtained by bootstrapping methods (random oversampling, resampling) was used for training, and validation and original test data were used with traditional machine learning methods (SVM, random forest), deep learning (RNN-LSTM), and Bayesian optimization. Finally, for scenario 8, the original dataset was used with deep learning (RNN-LSTM) and Bayesian optimization.
For scenarios 2 and 3, hyperparameter tuning was implemented and many models were developed to obtain the best model, while BO was used to obtain the best models for scenarios 6, 7, and 8. In addition to these, to observe the underfitting and overfitting problems, AUC_ROC, accuracy, and loss graphs were analyzed for all developed models.
In summary, we developed many models for all approaches and compared the results using statistical metrics such as sensitivity, specificity, AUC (area under curve), and F1-score. All details about these are given in Sect. 3. The models have been developed using the train set and for validation, a test set was used to evaluate the performance of the models by comparing the model prediction results with the actual results of the test set obtained by OGTT.
| 1 |
| 2 |
| 3 |
| 4 |
In these models, binary cross-entropy was used for the computation of loss given in the formula below.
| 5 |
where is the i-th scalar value in the model output, is the corresponding target value, and the output size is the number of scalar values in the model output.
All the methods and computations were implemented using an open-source Python programming language which was an interpreted, interactive, object-oriented language that can be used for a wide variety of applications.
Results
The descriptive statistics for continuous and categorical variables are given in Tables 2 and 3, respectively. Furthermore, the list of all variables, box plot graphs for continuous variables, and histogram graphs for the categorical variables of the dataset are given in the supplementary file as Table.S2, Fig.S1, and Fig.S2, respectively.
Table 2.
The descriptive statistics for continuous variables
| Variable | Count | Mean | std | min | 25% | 50% | 75% | max |
|---|---|---|---|---|---|---|---|---|
| Age | 489 | 29.54 | 5.79 | 18 | 25 | 29 | 33 | 44 |
| Pregest_weight | 489 | 67.09 | 13.18 | 39 | 58 | 65 | 75 | 109 |
| Pregest_height | 489 | 161.28 | 5.87 | 144 | 158 | 161 | 165 | 182 |
| Pregest_bmi | 489 | 26.04 | 5 | 15.42 | 22.67 | 25.39 | 29.10 | 44.79 |
| Gravida | 489 | 2.31 | 1.30 | 0 | 1 | 2 | 3 | 8 |
| 1st_trimester_pregnancy_week | 489 | 12.13 | 0 | 6 | 11 | 12 | 13 | 16 |
| 1st_trimester _weight | 489 | 68.40 | 12.89 | 41 | 59 | 67.10 | 77 | 112 |
| 1st_trimester _waist circumference | 489 | 86.98 | 11.80 | 59 | 78 | 87 | 95 | 127 |
| 1st_trimester _hip_circumference | 489 | 103.57 | 13.77 | 11 | 96 | 105 | 110.50 | 133 |
| 1st_trimester _arm_fat_thickness | 489 | 7.13 | 5.34 | 0 | 5 | 7 | 8 | 110 |
| 1st_trimester_arm_circumference | 489 | 28.82 | 9.84 | 7 | 25 | 28 | 30.40 | 123 |
| 1st_trimester_neck_circumference | 489 | 34.89 | 8.87 | 11 | 32 | 34 | 36 | 118 |
| 1st_trimester_physical_activity_time | 489 | 234 | 222.99 | 0 | 90 | 140 | 315 | 1260 |
| 1st_trimester _CRL | 489 | 46.03 | 65.44 | 0 | 13 | 49 | 63.30 | 811 |
| 1st_trimester _NT | 489 | 1.46 | 3.39 | 0 | 0 | 1.10 | 1.39 | 51 |
| 1st_trimester _PAPPA | 489 | 8.55 | 63.22 | 0 | 1.77 | 2.38 | 3.34 | 1130 |
| 1st_trimester _FbHCG | 489 | 43.41 | 66.24 | 0 | 25 | 29.80 | 45.70 | 1130 |
| 1st_trimester _HDL | 489 | 65.32 | 12.62 | 37 | 55.80 | 64.20 | 73.90 | 109 |
| 1st_trimester _TG | 489 | 127.79 | 66.06 | 1.80 | 88 | 116 | 152 | 790 |
| 1st_trimester_HgA1c | 489 | 8.04 | 34.95 | 4.19 | 5 | 5.20 | 5.40 | 512 |
| 1st_trimester_fasting_bloog_sugar | 489 | 87.35 | 14.07 | 5.30 | 80 | 85 | 91 | 207 |
| 1st _trimester_fasting_insulin | 489 | 14.85 | 19.74 | 2 | 5.80 | 8.40 | 14.41 | 171.40 |
| 2nd _trimester_pregnancy_week | 489 | 25.47 | 1.38 | 23 | 24 | 25 | 26 | 30 |
| 2nd _trimester _weight | 489 | 74.51 | 13.01 | 47 | 65 | 73 | 82 | 118 |
| 2nd_trimester_waist_circumference | 489 | 95.04 | 11.82 | 66 | 86 | 94 | 102 | 134 |
| 2nd _trimester_hip_circumference | 489 | 108.01 | 12.77 | 4.80 | 100 | 108 | 114 | 162 |
| 2nd _trimester_arm_fat_thickness | 489 | 7.52 | 3.47 | 0 | 6 | 6.50 | 10 | 31 |
| 2nd _trimester_arm_circumference | 489 | 30.40 | 8.25 | 10 | 27 | 29.50 | 33 | 115 |
| 2nd _trimester_neck_circumference | 489 | 36.61 | 10.32 | 8.54 | 33 | 36 | 40 | 210 |
| 2nd _trimester_physical_activity_time | 489 | 172.56 | 143.84 | 0 | 60 | 140 | 210 | 630 |
| 2nd_trimester_biparietal_diameter | 489 | 48.05 | 17.54 | 23 | 27 | 58 | 62 | 75 |
| 2nd_trimester_head_circumference | 489 | 160.43 | 95.61 | 22 | 27 | 219 | 236 | 275 |
| 2nd_trimester_abdominal_circumference | 489 | 136.30 | 87.21 | 23 | 27 | 183.34 | 213 | 258 |
| 2nd_trimester_femurHeight | 489 | 38.19 | 9.85 | 20 | 26.50 | 42.50 | 46 | 56 |
| 2nd_trimester_amniotic_fluid_amount | 489 | 121.29 | 16.67 | 80 | 110 | 120 | 135 | 155 |
| 2nd_trimester_servical_length | 489 | 37.76 | 4.03 | 16 | 36 | 40 | 40 | 46 |
| 2nd_trimester_fetal_estimated_weight | 489 | 879.22 | 239.85 | 520 | 735 | 833 | 980 | 1700 |
| 2nd_trimester_HDL | 489 | 74.85 | 16.5 | 45 | 65 | 72.60 | 81 | 182 |
| 2nd_trimester_TG | 489 | 201.22 | 62.52 | 67 | 157 | 195 | 247 | 461 |
| 2nd_trimester_HgA1c | 489 | 5.20 | 0 | 3.70 | 4.90 | 5.10 | 5.40 | 8.40 |
| 2nd_trimester_fasting_blood_sugar | 489 | 83.47 | 9.05 | 54 | 77 | 83 | 89 | 115 |
| 2nd_trimester_fasting_insulin | 489 | 11.25 | 13.37 | 2 | 6.80 | 8.97 | 12.65 | 158 |
| Fasting_blood_sugar | 489 | 82.86 | 12.54 | 58 | 76 | 81 | 87 | 207 |
Table 3.
The descriptive statistics for categorical variables
| Variable | Count | Unique | Top | freq |
|---|---|---|---|---|
| Pregest_fasting_glucose | 489 | 2 | 0 | 475 |
| Pregest_OGTT | 489 | 2 | 0 | 485 |
| Pregest_ Hypertension | 489 | 2 | 0 | 472 |
| AkantosisNigrikans_finding | 489 | 2 | 0 | 478 |
| Smoking | 489 | 3 | 0 | 358 |
| Education_level | 489 | 4 | 1 | 189 |
| Income_level | 489 | 4 | 1 | 259 |
| PCOS_history | 489 | 2 | 0 | 447 |
| Other_endocrine_illness | 489 | 2 | 0 | 403 |
| Pregnancy_method | 489 | 4 | 0 | 475 |
| Used_medications | 489 | 2 | 1 | 248 |
| Family_diabetes | 489 | 2 | 0 | 284 |
| Family_diabetes_1stdegree | 489 | 2 | 0 | 317 |
| Family_diabetes_2nddegree | 489 | 2 | 0 | 436 |
| Family_diabetes_3rddegree | 489 | 2 | 0 | 475 |
| Family_HT | 489 | 2 | 1 | 259 |
| Family_HT_1stdegree | 489 | 2 | 1 | 277 |
| Family_HT_2nddegree | 489 | 2 | 0 | 458 |
| Family_HT_3rddegree | 489 | 2 | 0 | 473 |
| Family_CVD | 489 | 2 | 0 | 326 |
| Family_CVD_1stdegree | 489 | 2 | 0 | 359 |
| Family_CVD_2nddegree | 489 | 2 | 0 | 450 |
| Family_CVD_3rddegree | 489 | 2 | 0 | 475 |
| Pregnancy_history | 489 | 2 | 1 | 403 |
| 1st_trimester_hypertension_history | 489 | 2 | 0 | 481 |
| 1st_trimester_glucosuria_urinalysis | 489 | 2 | 0 | 487 |
| 2nd_trimester_hypertension_history | 489 | 2 | 0 | 488 |
| 2nd _trimester_glucosuria_urinalysis | 489 | 2 | 0 | 484 |
| 2nd_trimester_fetal_gender | 489 | 2 | 1 | 372 |
| 2nd_trimester_placental_place | 489 | 5 | 0 | 402 |
| OGTT_GD_diagnosis | 489 | 2 | 0 | 419 |
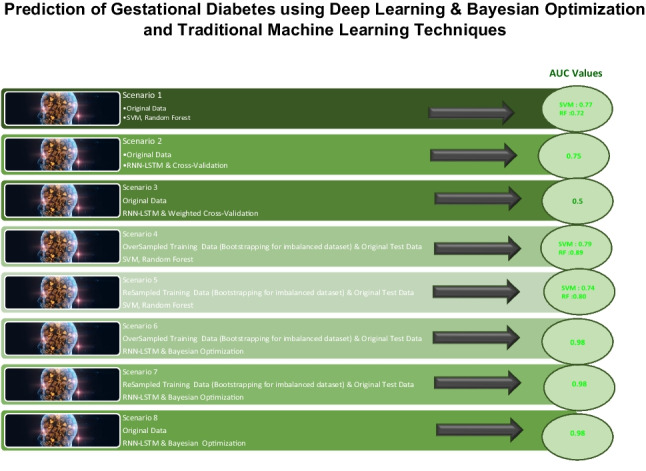
In this section, we represent the results and the comparison of the different models developed using different approaches mentioned in Sect. 2. The performance results of the best model of each scenario (defined in Table 1) are given in Table 4.
Table 4.
The performance results of the best model of each scenario
| Models | Train&Test Set Distribution | Performance Metrics | ||||
|---|---|---|---|---|---|---|
| Sensitivity | Specificity | AUC (95% CI) p-value |
Accuracy | F1-score | ||
|
Scenario 1 SVM Random Forest |
Train: 359 (42 GD; 317 Not GD) Test: 130 (29 GD; 101 Not GD) |
0.62 0.45 |
0.91 1 |
0.77 (0.69-0.85)* 0.72 (0.63-0.81)* |
0.85 0.88 |
0.64 0.62 |
| Scenario 2 |
Train: 359 (42 GD; 317 Not GD) Test: 130 (29 GD; 101 Not GD) |
0.35 | 0.97 | 0.75 (0.67-0.84)* | 0.88 | 0.44 |
|
Scenario 3 (Underfitting problem occurs) |
Train: 359 (42 GD; 317 Not GD) Test: 130 (29 GD; 101 Not GD) |
0 | 1 | 0.50 (0.40-0.60)* | 0.88 | 0.83 |
|
Scenario 4 SVM Random Forest |
Train: 634 (317 GD; 317 Not GD) Test: 130 (29 GD; 101 Not GD) |
0.69 0.79 |
0.89 0.99 |
0.79 (0.71-0.87)* 0.89 (0.83-0.55)* |
0.84 0.94 |
0.66 0.86 |
|
Scenario 5 SVM Random Forest |
Train: 634 (317 GD; 317 Not GD) Test: 130 (29 GD; 101 Not GD) |
0.62 0.69 |
0.89 0.92 |
0.74 (0.65-0.83)* 0.80 (0.72-0.88)* |
0.80 0.86 |
0.59 0.70 |
| Scenario 6 |
Train: 634 (317 GD; 317 Not GD) Test: 130 (29 GD; 101 Not GD) |
0.97 | 0.98 | 0.98 (0.95-1.00)* | 0.98 | 0.97 |
| Scenario 7 |
Train: 634 (317 GD; 317 Not GD) Test: 130 (29 GD; 101 Not GD) |
0.97 | 0.98 | 0.98 (0.95-1.00)* | 0.98 | 0.97 |
| Scenario 8 |
Train: 359 (42 GD; 317 Not GD) Test: 130 (29 GD; 101 Not GD) |
0.95 | 0.99 | 0.98 (0.95-1.00)* | 0.98 | 0.97 |
*: p-value < 0.001
As seen in Table 4, the best performance results were obtained for the prediction models of scenarios 6, 7, and 8 for the diagnosis of GD, where RNN_LSTM was used with BO. These three prediction models are all very successful and can be used for the diagnosis of GD at the end of the 2nd-trimester visit of the patient without using OGTT to assist the physicians. However, scenario 8 was proposed as the best model that has the highest specificity to define the patients who were not in the risk group for preventing unnecessary OGTT for patients.
For scenario 7, the loss curve and AUC_ROC graphs are given in Fig. 3.
Fig. 3.

(Left) loss function, (right) AUC_ROC graphs of the proposed model for diagnosis of GD
Discussion
Many studies mentioned that one of the most useful ways to handle class imbalanced dataset is bagging, which is called bootstrap sampling, providing that training each base classifier in an independent manner and the specific imbalance problems do not affect all the base classifiers [24]. Bootstrap is a statistical random resampling method with replacement, and the use of bootstrap methods has increased with the development of computers since the 1990s, due to the need for intensive computer calculations [25]. In the research by Özdemir et al. [26], in the simulation study carried out, three different bootstrap repetition numbers, B = 600, B = 1000, and B = 2000 for sample size n = 20, were tried, and type 1 error values of the results were compared. It was seen that the number of 600 repetitions fell within the range (0.045, 0.055) determined by Bradley [27], and 600 repetitions were suggested in terms of the shortness of the procedure. In the second part of the study, real datasets were used. As a result of these, 600 or 2000 repetitions could be recommended according to the pruning percentage. Therefore, we also developed diagnosis models using bootstrap methods for our imbalanced dataset with traditional machine learning methods (SVM, random forest) and RNN-LSTM as a deep learning method in the proposed study.
Deep learning methods can automatically learn multiple levels of representations from raw input data without presenting domain knowledge or manually coded rules contrary to the traditional machine learning methods. RNN is one of the most popular methods of deep learning that can map from the entire history of previous input data to each output which is useful for sequential data. It is very suitable for sequential health data taken at different visit times, using the sequential data for each patient and predicting the output from the relationships between the clinical data for each time point [28, 29]. Long short-term memory (LSTM) is an enhanced variant of RNN consisting of connected subnetworks as memory blocks for dealing with the long-term dependency problem, which is also called the vanishing or gradient problem.
Hyperparameter optimization has a primary role in training a deep neural network and developing a model. With this aim, we used Bayesian optimization (BO), which can automatically optimize the hyperparameters of the prediction models to develop the best models. BO method can learn and select the best hyperparameter sets based on their distributions defining the fitness scores in the previous iterations that require fewer function evaluations than other classical optimization methods [30, 31].
In this section, we discuss and compare the results of the models for the scenarios. The best performance results were obtained using deep learning and Bayesian optimization methods. For the original dataset, the best model was developed as defined in scenario 8 using RNN-LSTM with Bayesian optimization, giving 95% sensitivity and 99% specificity.
Within the scope of traditional machine learning methods, the best model belongs to the model of scenario 5 using the random forest method with 69% sensitivity and 92% specificity, which is given in Table 4. Using bootstrap resampling methods for the balanced train data, the best models have approximately 97% sensitivity, 98% specificity, and 98% AUC values for scenarios 6 and 7 using RNN-LSTM with Bayesian optimization shown in Table 4.
Similar studies used machine learning methods for the diagnosis of GD in the literature reported that despite the big sample size, the main limitation of the developed prediction models was being based on retrospective electronic medical data having inherent biases, where obtained AUC values were 0.80, 0.82, and 0.70–0.77 respectively [10–12]. Furthermore, another study [13] developed for the diagnosis of GD mentioned that deep learning algorithms were very popular, especially for large datasets, but 9 traditional machine learning algorithms were used. As a result of this, although high selectivity values were also obtained, very low (36–43%) sensitivity values were obtained.
Thus, we can say that deep learning and Bayesian optimization make a significant contribution to increasing performance results. The proposed study stands out as a novel study to overcome the restrictions, which have been reported as retrospective data and low sensitivity in the literature for diagnosis of GD, creating the dataset prospectively and using deep learning algorithms, and has obtained very satisfactory results.
In addition to these, on the prospectively collected data unprecedented in the literature, a very comprehensive study including many ML approaches in developing a model for the diagnosis of GD is presented.
Conclusion
This study performed a comparative analysis of machine learning and deep learning-based algorithms using prospective data for the prediction of GD. Eight scenarios were presented and compared based on SVM, RF, and RNN-LSTM methods on original and resampled datasets. The results showed that the most effective prediction model for GD was developed using RNN-LSTM with Bayesian optimization which gave 95% sensitivity and 99% specificity on the dataset that has the highest specificity to define the patients who were not in the risk group for preventing unnecessary OGTT for patients.
The developed model can be used to diagnose whether pregnant who can have GD risk or not at the end of the 2nd-trimester visit without using OGTT to avoid unnecessary OGTT. For a future study, the proposed prediction model can be used as a prototype in the clinic to increase the validation sample size and be tested on more patients and as a result, the model can be updated if required.
Electronic supplementary material
Below is the link to the electronic supplementary material.
Biographies
Burçin Kurt
is an assistant professor at Karadeniz Technical University in Turkey. Her research activity lies in the field of medical image processing, clinical decision support systems, deep learning, machine learning, and artificial intelligence applications in medicine. She took part in many projects as an executive and researcher; such as a decision support system for the diagnosis of breast cancer which was her Ph.D. thesis and supported by the Ministry of Industry Thesis Project, a clinical decision support model for the diagnosis of gestational diabetes (as an executive), tumor development modeling after treatment in non-small cell lung cancer (as a researcher), and machine learning-based gene discovery and drug repositioning (as a researcher) which were supported by The Scientific and Technological Research Council of Turkey (TÜBİTAK). 
Beril Gürlek
Gynecology and Obstetrics Specialist, Associate Professor continued her academic career as a faculty member in the Department of Obstetrics and Gynecology at Recep Tayyip Erdogan University Faculty of Medicine between 2016–2021 and also served as the head of the Department of Obstetrics and Gynecology at Recep Tayyip Erdogan University and the Clinical Chief. She has scientific studies and book authorship published in many international and national journals. As of May 2021, she left the university to practice her profession in her private clinic and is still working in her practice.
Seda Keskin
is an associate professor at Ordu University Faculty of Medicine, Department of Gynecology and Obstetrics. She has done many publications and research in the field. 
Sinem Özdemir
is a research assistant at the department of Biostatistics and Medical Informatics, Karadeniz Technical University. She is a Ph.D. student in Bioinformatics, at Karadeniz Technical University. Her Master’s degree in Computer Engineering from Karadeniz Technical University. Her Bachelor’s degree in Mathematical Engineering from Yıldız Technical University. Her research areas are machine learning, deep learning, and pattern recognition. 
Özlem Karadeniz
is a Ph.D. student at the department of Biostatistics and Medical Informatics, Karadeniz Technical University. Her Bachelor’s degree in Computer Engineering from Karadeniz Technical University. Her research interests include decision support systems, machine learning, and deep learning.

İlknur Buçan Kırkbir
received her Bachelor’s degree in Nursing from Karadeniz Technical University, Master’s and Ph.D. degrees in Biostatistics and Medical Informatics, from Karadeniz Technical University. Her research interests include health sciences, biostatistics, data analysis, clinical decision support systems, and machine learning. 
Tuğba Kurt
is a statistician at the Karadeniz Technical University, Farabi Hospital. She is also a Ph.D. student in the department of biostatistics and medical informatics at Karadeniz Technical University, Turkey. Furthermore, she did her master’s degree (Acute Appendicitis Hybrid Decision Support System) in Biostatistics and Medical Informatics, at Karadeniz Technical University. Her research interests are statistics, biostatistics, data analysis, machine learning, and other statistical learning techniques. Her doctorate thesis is about Developing a Cumulative Conception Forecast Model with AI Approach. 
Serbülent Ünsal
is a research assistant at the Department of Biostatistics and Medical Informatics, Karadeniz Technical University, Turkey. He is a Ph.D. candidate at Middle East Technical University, Turkey in Medical Informatics. His research interests include the application and development of cutting-edge AI/ML methods in biomedical&biomolecular data, AI-aided antibody design, immunoinformatics, and translational bioinformatics. 
Cavit Kart
is currently a professor of Gynecology and Obstetrics in the School of Medicine at Karadeniz Technical University. His research areas include medicine, health sciences, surgery medicine sciences, obstetrics, and gynecology. He has published many publications in his field and has been involved in research projects. 
Neslihan Baki
is a Ph.D. student in Biostatistics and Medical Informatics at Karadeniz Technical University. She Works at the Ministry of Health in Turkey. Her research areas include data analysis, decision support systems, and EEG Digital Signal Processing.
Kemal Turhan
is a professor at the Department of Biostatistics and Medical Informatics, Karadeniz Technical University, Turkey. He received his Ph.D. and Master's degree from Karadeniz Technical University and his Bachelor's degree at Hacettepe University, Turkey. He has various publications on Medical Informatics and Biostatistics. 
Appendix
Figure 4
Fig. 4.

Ethical approval
Funding
This study was funded and supported as a project by the Scientific and Technological Research Council of Turkey (TUBITAK) ARDEB 1001 program with project no 118S300.
Declarations
Ethical approval
The authors confirm that the study was approved by the appropriate institutional ethics committee (Karadeniz Technical University Faculty of Medicine Scientific Research Ethics Committee) and certify that the study was performed by the ethical standards as laid down in the 1964 Declaration of Helsinki and its later amendments or comparable ethical standards.
Informed consent
The authors confirm that informed consent was obtained from all individual participants included in the study.
Conflict of interest
The authors declare no competing interests.
Footnotes
Publisher's note
Springer Nature remains neutral with regard to jurisdictional claims in published maps and institutional affiliations.
References
- 1.American Diabetes Association 2 Classification and diagnosis of diabetes. Diabetes Care. 2018;38(1):8–S6. doi: 10.2337/dc15-S005. [DOI] [Google Scholar]
- 2.Türkiye Endokrinoloji ve Metabolizma Derneği. Diabetes Mellitus ve Komplikasyonlarının Tanı,Tedavi ve İzlem Kılavuzu (2017) Ankara, Miki Matbaacılık San. ve Tic. Ltd. Şti.
- 3.Farrar D, Duley L, Dowswell T, Lawlor DA (2017) Different strategies for diagnosing gestational diabetes to improve maternal and infant health. Cochrane Database Syst Rev 8(8):CD007122. 10.1002/14651858.CD007122.pub4 [DOI] [PMC free article] [PubMed]
- 4.Vandorsten JP, Dodson WC, Espeland MA, Grobman WA, Guise JM, Mercer BM. NIH consensus development conference: diagnosing gestational diabetes mellitus. NIH Consens State Sci Statements. 2013;29(1):1–31. [PubMed] [Google Scholar]
- 5.DeSisto CL, Kim SY, Sharma AJ. Prevalence estimates of gestational diabetes mellitus in the United States, Pregnancy Risk Assessment Monitoring System (PRAMS) 2007–2010. Prev Chronic Dis. 2014;11:1–9. doi: 10.5888/pcd11.130415. [DOI] [PMC free article] [PubMed] [Google Scholar]
- 6.Kim C, Newton KM, Knopp RH. Gestational diabetes and the ıncidence of type 2 diabetes: a systematic review. Diabetes Care. 2002;25(10):1862–1868. doi: 10.2337/diacare.25.10.1862. [DOI] [PubMed] [Google Scholar]
- 7.Rosenstein MG, Cheng YW, Snowden JM, Nicholson JM, Doss AE, Caughey AB. The risk of stillbirth and ınfant death stratified by gestational age in women with gestational diabetes. Am J Obstet Gynecol. 2012;206(4):309.e1–309.e7. doi: 10.1016/j.ajog.2012.01.014. [DOI] [PMC free article] [PubMed] [Google Scholar]
- 8.Qiu H, Yu HY, Wang LY, et al. Electronic health record driven prediction for gestational diabetes mellitus in early pregnancy. Sci Rep. 2017;7(1):16417. doi: 10.1038/s41598-017-16665-y. [DOI] [PMC free article] [PubMed] [Google Scholar]
- 9.Nagarajan S, Chandrasekaran RM. Design and ımplementation of expert clinical system for diagnosing diabetes using data mining techniques. Indian J Sci Technol. 2015;8(8):771–776. doi: 10.17485/ijst/2015/v8i8/69272. [DOI] [Google Scholar]
- 10.Artzi NS, Shilo S, Hadar E, et al. Prediction of gestational diabetes based on nationwide electronic health records. Nat Med. 2020;26:71–76. doi: 10.1038/s41591-019-0724-8. [DOI] [PubMed] [Google Scholar]
- 11.Liu Y, Zhaoxiang Yu, Sun H. Prediction method of gestational diabetes based on electronic medical record data. J Healthcare Eng. 2021;2021:1–10. doi: 10.1155/2021/6672072. [DOI] [PMC free article] [PubMed] [Google Scholar] [Retracted]
- 12.Wu YT, Zhang CJ, Mol BW, Kawai A, Li C, Chen L, Huang HF. Early prediction of gestational diabetes mellitus in the Chinese population via advanced machine learning. J Clin Endocrinol Metab. 2021;106(3):e1191–e1205. doi: 10.1210/clinem/dgaa899. [DOI] [PMC free article] [PubMed] [Google Scholar]
- 13.Shen J, Chen J, Zheng Z, Zheng J, Liu Z, Song J, Wong SY, Wang X, Huang M, Fang P, Jiang B, Tsang W, He Z, Liu T, Akinwunmi B, Wang CC, Zhang CJP, Huang J, Ming W. An ınnovative artificial ıntelligence-based app for the diagnosis of gestational diabetes mellitus (GDM-AI): development study. J Med Internet Res. 2020;22(9):e21573. doi: 10.2196/21573. [DOI] [PMC free article] [PubMed] [Google Scholar]
- 14.International Association of the Diabetes and Pregnancy Study Groups Consensus Panel International Association of Diabetes and Pregnancy Study Groups Recommendations on the Diagnosis and Classification of Hyperglycemia in Pregnancy. Diabetes Care. 2010;33(3):676–682. doi: 10.2337/dc09-1848. [DOI] [PMC free article] [PubMed] [Google Scholar]
- 15.Türkiye Endokrinoloji ve Metabolizma Derneği. Diabetes Mellitus ve Komplikasyonlarının Tanı, Tedavi ve İzlem Kılavuzu (2020) Ankara, Miki Matbaacılık San. ve Tic. Ltd. Şti. https://file.temd.org.tr/Uploads/publications/guides/documents/20200625154506-2020tbl_kilavuz86bf012d90.pdf. Accessed 18 Apr 2021
- 16.Farrar D, Simmonds M, Bryant M, Lawlor DA, Dunne F, Tuffnell D, Sheldon TA. Risk factor screening to ıdentify women requiring oral glucose tolerance testing to diagnose gestational diabetes: a systematic review and meta-analysis and analysis of two pregnancy cohorts. PLoS ONE. 2017;12(4):1–7. doi: 10.1371/journal.pone.0175288. [DOI] [PMC free article] [PubMed] [Google Scholar]
- 17.Liu Z, Ao D, Yang H, Wang Y. Gestational weight gain and risk of gestational diabetes mellitus among Chinese women. Chin Med J. 2014;127(7):1255–1260. doi: 10.3760/cma.j.issn.03666999.20132772. [DOI] [PubMed] [Google Scholar]
- 18.Ma ZF, Tian HP, Liu ZC, Zhang ZW. A new incomplete pattern belief classification method with multiple estimations based on KNN. Applied Soft Computing. 2020;90:106175. doi: 10.1016/j.asoc.2020.106175. [DOI] [Google Scholar]
- 19.Liao SG, Lin Y, Kang DD, Chandra D, Bon J, Kaminski N, Tseng GC. Missing value imputation in high-dimensional phenomic data: imputable or not, and how? BMC Bioinformatics. 2014;15(1):1–12. doi: 10.1186/s12859-014-0346-6. [DOI] [PMC free article] [PubMed] [Google Scholar]
- 20.Audigier V, Husson F, Josse J. MIMCA: multiple imputation for categorical variables with multiple correspondence analysis. Stat Comput. 2017;27:501–518. doi: 10.1007/s11222-016-9635-4. [DOI] [Google Scholar]
- 21.Enders CK. Multiple imputation as a flexible tool for missing data handling in clinical research. Behav Res Ther. 2017;98:4–18. doi: 10.1016/j.brat.2016.11.008. [DOI] [PubMed] [Google Scholar]
- 22.Sugiyama M, Blankertz B, Krauledat M, Dornhege G, Müller KR (2006) Importance-weighted cross-validation for covariate shift. IDAGM'06: Proceedings of the 28th conference on Pattern Recognition, Berlin, Germany, pp 54–363. 10.1007/11861898_36
- 23.Ronchetti E, Field C, Blanchard W (1997) Robust linear model selection by cross-validation. Journal of the American Statistical Association 92:439, 1017–1023. 10.1080/01621459.1997.10474057 [DOI]
- 24.Chen Z, Duan J, Kang L, Qiu G. A Hybrid data-level ensemble to enable learning from highly ımbalanced dataset. Information Sciences. 2021;554:157–176. doi: 10.1016/j.ins.2020.12.023. [DOI] [Google Scholar]
- 25.Efron B, Tibshirani R. An Introduction to the Bootstrap. London: Chapman and Hall CRC Press; 1993. [Google Scholar]
- 26.Özdemir AF, Navruz G. Bootstrap-t ve Yüzdelik Bootstrap Yöntemlerinde Tekrar Sayısı, Budama Yüzdesi ve Dağılımın Sonuçlara Etkisi. Nevşehir Bilim ve Teknoloji Dergisi. 2016;5(2):74–85. doi: 10.17100/nevbiltek.284732. [DOI] [Google Scholar]
- 27.Bradley JV. Robustness? Br J Math Stat Psychol. 1978;31(2):144–152. doi: 10.1111/j.2044-8317.1978.tb00581.x. [DOI] [Google Scholar]
- 28.Reddy BK, Delen D. Predicting hospital readmission for lupus patients: an RNN-LSTM-based deep-learning methodology. Comput Biol Med. 2018;101:199–209. doi: 10.1016/j.compbiomed.2018.08.029. [DOI] [PubMed] [Google Scholar]
- 29.Ljubic B, Roychoudhury S, Cao XH, Pavlovski M, Obradovic S, Nair R, Glass L, Obradovic Z. Influence of medical domain knowledge on deep learning for Alzheimer's disease prediction. Comput Methods Programs Biomed. 2020;197:1–7. doi: 10.1016/j.cmpb.2020.105765. [DOI] [PMC free article] [PubMed] [Google Scholar]
- 30.Nguyen HP, Liu J, Zio E. A Long-term prediction approach based on long short-term memory neural networks with automatic parameter optimization by tree-structured Parzen estimator and applied to time-series data of NPP steam generators. Appl Soft Comput. 2020;89:1–15. doi: 10.1016/j.asoc.2020.106116. [DOI] [Google Scholar]
- 31.Cabrera D, Guamán A, Zhang S, Cerrada M, Sánchez RV, Cevallos J, LongJ Li C. Bayesian approach and time series dimensionality reduction to LSTM-based model-building for fault diagnosis of a reciprocating compressor. Neurocomputing. 2020;380(7):51–66. doi: 10.1016/j.neucom.2019.11.006. [DOI] [Google Scholar]
Associated Data
This section collects any data citations, data availability statements, or supplementary materials included in this article.