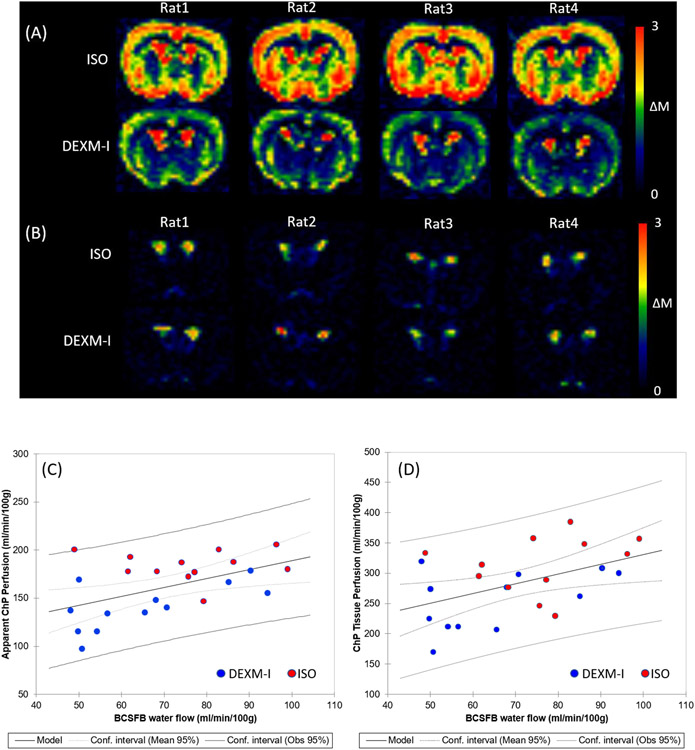
Figure 6.
(A) Perfusion weighted images (ΔMTE=23ms) summed over all PLDs are shown in 4 rats undergoing ISO or DEXM-I anesthesia. (B) BCSFB weighted images (ΔMTE=150ms) summed over all PLDs are shown in 4 rats undergoing ISO or DEXM-I anesthesia. (C) Apparent choroid plexus blood perfusion and (D) choroid plexus tissue blood perfusion are plotted as a function of BCSFB water flow. Red and blue dots represent 12 rats undergoing ISO and DEXM-I anesthesia, respectively. Solid and dotted lines represent the linear regression lines and confidence intervals, respectively.

