

Abstract
Bayesian phylogeographic inference is a powerful tool in molecular epidemiological studies, which enables reconstruction of the origin and subsequent geographic spread of pathogens. Such inference is, however, potentially affected by geographic sampling bias. Here, we investigated the impact of sampling bias on the spatiotemporal reconstruction of viral epidemics using Bayesian discrete phylogeographic models and explored different operational strategies to mitigate this impact. We considered the continuous-time Markov chain (CTMC) model and two structured coalescent approximations (Bayesian structured coalescent approximation [BASTA] and marginal approximation of the structured coalescent [MASCOT]). For each approach, we compared the estimated and simulated spatiotemporal histories in biased and unbiased conditions based on the simulated epidemics of rabies virus (RABV) in dogs in Morocco. While the reconstructed spatiotemporal histories were impacted by sampling bias for the three approaches, BASTA and MASCOT reconstructions were also biased when employing unbiased samples. Increasing the number of analyzed genomes led to more robust estimates at low sampling bias for the CTMC model. Alternative sampling strategies that maximize the spatiotemporal coverage greatly improved the inference at intermediate sampling bias for the CTMC model, and to a lesser extent, for BASTA and MASCOT. In contrast, allowing for time-varying population sizes in MASCOT resulted in robust inference. We further applied these approaches to two empirical datasets: a RABV dataset from the Philippines and a SARS-CoV-2 dataset describing its early spread across the world. In conclusion, sampling biases are ubiquitous in phylogeographic analyses but may be accommodated by increasing the sample size, balancing spatial and temporal composition in the samples, and informing structured coalescent models with reliable case count data.
Keywords: phylogeography, Bayesian phylogeographic inference, pathogen spread, sampling bias, Markov chain monte carlo, CTMC, BASTA, MASCOT
Introduction
Over the past decade, Bayesian discrete phylogeographic inference has greatly benefited viral epidemiological studies in unraveling the origin and subsequent spread of viral epidemics (Faria et al. 2019; Lemey et al. 2020; Lu et al. 2021), the spatial processes driving the viral spread (Müller et al. 2021), and environmental or human-related factors associated with the viral spread (Lemey et al. 2014; Dudas et al. 2017; He et al. 2022). BEAST is a popular Bayesian phylodynamics software package commonly used in the analysis of time-stamped viral molecular sequences. It offers different discrete phylogeography approaches: a popular and computationally efficient discrete phylogeographic inference approach that makes use of continuous-time Markov chain (CTMC) modeling (Lemey et al. 2009), also known as the discrete trait analysis (DTA), and the structured coalescent model under its exact and approximated forms (Vaughan et al. 2014; De Maio et al. 2015; Müller, Rasmussen, and Stadler 2018). The CTMC models migration among discrete locations in the same way as nucleotide substitutions are modeled. In other words, geographical locations are modeled as a neutral trait that evolves on top of the tree from the root to the tips. As such, CTMC modeling does not explicitly model the branching process that gave rise to the tree. In contrast, the structured coalescent model—which is an extension of the coalescent model to a structured population—is a tree-generating model that explicitly models how lineages coalesce within and migrate among subpopulations from the present to the past. Two computationally efficient approximations of the structured coalescent model are available in BEAST2: Bayesian structured coalescent approximation (BASTA) (De Maio et al. 2015) and marginal approximation of the structured coalescent (MASCOT) (Müller, Rasmussen, and Stadler 2018). Currently, they both assume constant prevalence through time for each deme/population, while the CTMC approach does not (Lemey et al. 2009).
Bayesian discrete phylogeography approaches are complementary to mathematical modeling and epidemiological studies and are particularly informative when epidemiological data are scarce. In such contexts, viral genetic sequences are expected to compensate for the lack of epidemiological data. However, genetic samples may constitute a biased snapshot of the underlying viral spread, especially when isolated through passive surveillance systems. The impact of such sampling bias on discrete phylogeographic inference has been discussed and examined ever since. Indeed, CTMC estimates were suspected to be biased toward the most sampled location (Lemey et al. 2009) and, later, sampling heterogeneity was shown to inform the posterior, and more specifically the migration parameters, which is not the case for BASTA (De Maio et al. 2015). In BASTA, sampling evenness is not informative as such and the estimated migration rates are more correlated with the true values under simulated biased and unbiased conditions compared to CTMC (De Maio et al. 2015). As a result, BASTA has been argued to be more robust to sampling bias (De Maio et al. 2015). Nevertheless, the structured coalescent model is known to be sensitive to unsampled locations, known as ghost demes (Beerli 2004; Ewing and Rodrigo 2006; De Maio et al. 2015). In parallel, several studies tested alternative strategies to mitigate the potential effects of sampling bias, mostly focusing on CTMC as it was shown to be potentially less robust to sampling bias compared to the structured coalescent model (De Maio et al. 2015). Downsampling that was tested early on but was limited to large datasets (Lemey et al. 2014; Yang et al. 2019) rapidly became a prerequisite in any SARS-CoV-2 data analysis study due to the large number of available sequences and the high sampling heterogeneity between countries (Hodcroft et al. 2021). However, Magee and Scotch (2018) showed that inference accuracy rapidly plateaus when using up to 25–50 per cent of the sequence data available (Magee and Scotch 2018). Other studies aimed at improving inference accuracy by integrating additional reliable epidemiological data. For example, the CTMC was extended to incorporate information on recent migration events using individual travel records (Lemey et al. 2020; Hong et al. 2021). More recently, a simulation study focused on quantifying the impact of sampling bias on the reconstructed location of internal nodes, on the reconstruction of migration events that lead to large local spread as well as on the estimation of migration rates in a maximum likelihood framework (Liu et al. 2022). The authors showed that inference accuracy actually depends on multiple factors: the underlying migration rate, the magnitude of sampling bias, and the magnitude of traveler sampling. Importantly, they observed a lower relative accuracy with biased samples and when samples over-represent travelers. Concerning the structured coalescent model, Müller, Dudas, and Stadler (2019) informed the deme population sizes with reliable case count data from the 2014 Ebola epidemic in Sierra Leone using MASCOT. This allows modeling time-varying population sizes instead of assuming constant population sizes over time. Sampling bias is also a concern in continuous phylogeography analyses in which other mitigation approaches were tested. Among recent efforts to mitigate sampling bias, we here mention the study by Dellicour et al. (2021b) in which they analyzed representative subsamples of SARS-CoV-2 genomic records from New York City based on hospitalizations rather than case counts to avoid potential bias from the testing strategy, the study by Kalkauskas et al. (2021) in which the authors incorporated sequence-free (or ‘ghost’) samples from unsampled areas, and the study by Guindon and De Maio (2021) where the authors accounted for preferential sampling using a doubly intractable model.
Although numerous studies tested strategies to deal with sampling bias, the impact of sampling bias on discrete phylogeographic reconstructions remains insufficiently characterized. Here, we compare the performance of the different phylogeographic methods using viral epidemics simulated under a stochastic metapopulation model, based on RABV epidemics in dogs in Morocco. We investigated the impact of sampling bias on the spatiotemporal reconstruction of these viral epidemics using the CTMC model, BASTA, and MASCOT, with the latter two assuming populations to remain constant over time. Next, we explored different approaches to mitigate sampling bias, maximizing the spatial and/or temporal coverage of the sample and informing the deme sizes under MASCOT with the true (time-varying) case count data per location. The latter is to test to what degree biases originating from assuming constant population sizes over time can be mitigated by allowing them to vary over time. Finally, we applied the three algorithms to two empirical datasets: a dataset of RABV sequences isolated in the Philippines between 2004 and 2010 and a global dataset of SARS-CoV-2 genomes associated with the early spread of the pandemic.
Results
Simulation framework
We simulated RABV epidemics across three or seven locations using a stochastic metapopulation model (Fig. 1A), whose connectivity matrix is parameterized using human population mobility that we estimated by fitting the radiation model of Simini et al. (2012) with the human population density data from WorldPop (Fig. 1B). As each location is associated with a specific deme/population, we refer to the two simulation frameworks as the three demes framework and the seven demes framework for the remainder of the text. We simulated fifty epidemics that started with the introduction of a single case and led to at least 60,000 cases over a 20- to 30-year period (Fig. 1C). On top of the transmission chains, we simulated viral genomes for each case and then subsampled, starting one year after the introduction of the index case, either 150 or 500 sequences in a biased or unbiased fashion (Fig. 1D). We then performed Bayesian discrete phylogeographic analysis on the location-annotated and time-stamped sequence alignments before comparing the true and reconstructed evolutionary and migration histories for each discrete phylogeographic approach. BASTA unfortunately proved impractical to infer such histories from large samples of 500 sequences in the seven demes framework as a result of extremely high calculation times. The results for the seven demes framework are presented in the main text, while those for the three demes framework are available in the Supplementary Data. Of note, we removed 26 per cent of the MASCOT chains on the large samples of 500 sequences in the seven demes framework due to convergence issues. Importantly, the vast majority of samples in the three demes framework contain at least one sequence of each deme, which is not the case for the seven demes framework for which sampling bias often led to unsampled locations (which we also refer to as ‘ghost’ demes).
Figure 1.

RABV epidemic simulation framework. We simulated realistic epidemics by emulating the scenario of RABV spread in dog populations in Morocco. (A) Metapopulation model of rabies spread in dogs. In each geographical location j, the dog population was divided into three compartments: susceptible, exposed but not infectious, and infectious individuals. Individuals were born at a rate of  and died from natural causes at a rate of
  . The rate of infection corresponds to the per-capita force of infection
  that aggregates the force of infection from infectors in location
  and all the other locations. Individuals became infectious at a rate od
  . We identified all infected individuals and simulated their infector, incubation period, infectious period, and date of death. (B) Connectivity among the seven arbitrary Moroccan regions estimated by the radiation model and estimated dog population size per region. Curvature indicates the flux direction. (C) Example for one simulation of the prevalence (first row) and cumulative number (second row) of rabid cases per month and location. (D) Graphical illustration of the potential impact of sampling bias on the reconstruction of the phylogenetic relationships among viral samples over an epidemic, assuming no intra-host evolution.
Robust estimation of the phylogeny and genetic parameters with respect to sampling bias
While the focus of our simulation study is on reconstructing the spatial spread, we first assess the potential impact of sampling bias on estimating the phylogeny itself, as well as the evolutionary parameters (Supplementary Figs. S1–4). The phylogeny of the simulated pathogen is not impacted by sampling bias when using the CTMC model, BASTA, and MASCOT (Supplementary Figs. S1–3), as well as the estimation of the average evolutionary rate (Supplementary Fig. S4) although it is slightly underestimated notably in the large samples of 500 sequences.
Spatiotemporal history reconstruction under (un)biased conditions
As the inferred spatiotemporal histories of lineages cannot be compared in a uniquely simple way among the different approaches, we used four types of summary statistics: (1) the total migration counts—corresponding to Markov jumps in the case of CTMC and their equivalent for BASTA and MASCOT—that account for multiple migration events along the tree branches (Fig. 2 and Supplementary Fig. S5), (2) the lineage migration counts (Supplementary Fig. S6), (3) the lineage introduction dates into the sampled locations (Fig. 3), and (4) the location inferred at the root of the tree (Fig. 4). Using these four statistics, we evaluated the performance of the phylogeographic models using five metrics: (1) the correlation between true and estimated values using Kendall’s tau coefficient, (2) the proportion of estimated parameters for which the true value is in the 95 per cent highest posterior density (HPD) interval that we refer to as the calibration, (3) the mean relative bias (MRB) that measures the accuracy of median estimates, (4) the mean relative 95 per cent HPD width that measures estimate precision, and (5) the weighted interval score (WIS). Kendall’s tau coefficient is a correlation statistic that measures the ordinal association between the simulated and estimated values that can be interpreted in the same way as Pearson’s correlation coefficient. The WIS is a generalization of the absolute error accounting for estimation uncertainty (Bracher et al. 2021). Small WIS values indicate accurate and precise estimation. The WIS is widely used to evaluate epidemic forecasts and favors estimates that are slightly biased but with a narrow confidence interval compared to estimates without bias but with very large uncertainty (Bracher et al. 2021).
Figure 2.

Impact and mitigation of spatial sampling bias on the estimation of the total migration counts. (A–E) Impact of the increasing levels of spatial sampling bias on the MRB, the correlation, the calibration, the mean relative 95 per cent HPD width, and the WIS between the simulated and the estimated total migration counts. Uniform samples are representative of the simulated spatiotemporal dynamics of the virus. Samples 2.5, 5, 10, 20, and 50 samples biased toward Regions 3 and 4. Samples 2.5 and 5 correspond to low levels of bias, Samples 10 and 20 to intermediate levels of bias, and Sample 50 to high levels of bias. (F–J) Mitigation of the impact of spatial sampling bias on the MRB, the correlation, the calibration, the mean relative 95 per cent HPD width, and the WIS between the simulated and estimated total migration counts by using alternative sampling strategies. In the left and right columns, samples are drawn from biobanks with an underlying bias of ten and twenty, respectively. Overall, the algorithms correctly estimate the total migration counts when the correlation and the calibration are high (close to 1 and 100, respectively) and when the mean relative 95 per cent HPD width, the MRB, and the WIS are close to zero. Finally, the MRB and the mean relative 95 per cent HPD width are not defined when the true value is null. We removed 612 out of 3,600 and 380 out of 3,600 simulated migration events in the small and large samples, respectively, due to null true values.
Figure 3.

Impact and mitigation of spatial sampling bias on the estimation of the lineage introduction dates. (A–D) Impact of the increasing levels of spatial sampling bias on the MRB, the correlation, the calibration, and the mean relative 95 per cent HPD width between the simulated and the estimated introduction dates. (E–H) Mitigation of the impact of spatial sampling bias on the MRB, the correlation, the calibration, and the mean relative 95 per cent HPD width between the simulated and estimated introduction dates by using alternative sampling strategies. In the left and right columns, samples are drawn from biobanks with an underlying bias of ten and twenty, respectively.
Figure 4.

Impact and mitigation of spatial sampling bias on the estimation of the root location. (A) The posterior probability of estimating the true root state for increasing levels of spatial sampling bias. (B and C) Mitigation of the effects of spatial sampling bias using alternative sampling strategies under a surveillance bias of 10 and 20, respectively. Each dot corresponds to the median root state posterior probability in one simulation (n = 50 per sampling protocol and sample size).
First, we assess the reconstruction of the spatial process in the absence of sampling bias. In the unbiased/representative (uniform) scenario, CTMC correctly estimates the four types of parameters. Indeed, the MRB and the WIS are close to zero, and the correlation between the true and estimated parameter values is high (from 0.63 to 0.93 depending on the parameter, Fig. 2A,B,E). BASTA and MASCOT show no correlation for the total migration counts on uniform samples and higher MRB and WIS compared to CTMC (Fig. 2A,B,E), indicating biased median estimates and higher uncertainty around median estimates. The correlation under BASTA and MASCOT is >0.5 when we consider the lineage migration counts under both demes frameworks, suggesting that the two algorithms only partly recover the global migration process in the absence of sampling bias (Supplementary Figs. S6 and S11). Overall, CTMC outperforms BASTA and MASCOT when the sampling is representative of the true underlying transmission process, as BASTA and MASCOT only recover the location of the ancestral nodes and not individual migration events.
Second, we evaluate how phylogeographic algorithms perform at increasing levels of sampling bias. While CTMC satisfyingly estimates the total migration counts in the absence of sampling bias, the correlation and the calibration drop rapidly with increasing levels of sampling bias, and the mean relative 95 per cent HPD width tends to decrease, suggesting that bias strongly impacts CTMC estimates (Fig. 2B–D). Nevertheless, the WIS and the MRB remain smaller than those of BASTA and MASCOT, even at high levels of bias. Consequently, CTMC leads to median estimates that are closer to the true values but with 95 per cent HPDs that are too narrow. The CTMC leads to a biased picture of the geographical process with some transition events that are drastically under- or overestimated (Supplementary Fig. S5). BASTA and MASCOT less accurately estimate the total migration counts with high MRB and WIS. They are also less confident with an average 95 per cent HPD width that is ten to thirty times higher compared with the CTMC. This uncertainty is exacerbated in large samples analyzed with MASCOT in the seven demes framework, for which almost 30 per cent (87 out of 300) of the chains have low effective sample size (ESS) values often due to the bimodal structured coalescent posterior density. Additionally, BASTA and MASCOT partly recover the global migration process (lineage migration counts) even at high levels of bias since correlation and calibration are not impacted by sampling bias (Supplementary Fig. S6). When we consider transmission dynamics among three demes, BASTA and MASCOT yield higher correlation levels than in the seven demes scenario (Supplementary Figs. S9–11), but overall, the CTMC offers better performance compared to BASTA and MASCOT.
When it comes to the estimation of lineage introduction dates, BASTA outcompetes the CTMC model and MASCOT under the three demes framework (Supplementary Fig. S12A–D) but not under the seven demes framework (Fig. 3A–D). In the three demes framework, the uncertainty around the median estimate remains high for BASTA and MASCOT and the correlation and the calibration are barely affected by bias for BASTA, contrary to the CTMC model and MASCOT. In the seven demes framework, correlation is low for both BASTA and MASCOT but not affected by bias. CTMC performs poorly at increasing levels of spatial sampling bias with a moderate (seven demes) to sharp (three demes) decrease in correlation and calibration. It also tends to estimate more ancient lineage introduction dates compared to BASTA and MASCOT in both frameworks. Of note, increasing the sample size from 150 to 500 sequences improves the correlation for CTMC at low and intermediate levels of bias (Conditions 2.5, 5, and 10 in Fig. 3B and Supplementary Fig. S12B).
Finally, we analyze the impact of sampling bias on root location estimation (Figs. 4A and Supplementary Fig. S13A). Of note, the posterior probability of the true root location is very heterogeneous among the fifty simulated epidemics when there is no or little sampling bias, notably for BASTA and MASCOT. Root location reconstruction by CTMC is affected by sampling bias, notably in the three demes framework (Supplementary Fig. S13A), which is in agreement with previous findings (De Maio et al. 2015). BASTA and MASCOT perform less well compared to CTMC, at any level of bias; however, sampling bias moderately worsens their estimates. They also perform relatively better in the three demes framework.
Sample balancing mitigates the impact of sampling bias
We tested alternative sampling strategies in order to mitigate the impact of sampling bias. Large and biased samples of 5,000 sequences were generated, and then discrete phylogeographic analyses were performed on subsamples of 150 or 500 sequences, which aimed at reproducing real-life situations. For example, researchers may have access to numerous viral specimens from biobanks but cannot analyze all of them due to computational limitations, potential underlying biased sampling that may lead to spurious results, or financial limitations.
Similar to the analyses on systematically biased samples, the estimation of the total migration counts (Fig. 2F–J), lineage migration counts (Supplementary Fig. S6F–J), lineage introduction dates (Fig. 3E–H), and root location posterior probabilities (Fig. 4B–C) is strongly impacted in biased subsamples (uniform surv.) for the three algorithms. By maximizing the spatial (region) or the spatiotemporal coverage (region + year), the correlation and the calibration for the total migration counts increased substantially for the CTMC even when the underlying sampling bias was high (weight = 20, i.e. sequences from oversampled regions are twenty times more likely to be sampled). For BASTA and MASCOT, the maximization of the spatial/spatiotemporal coverage does not improve the correlation, but it reduces the MRB and the mean relative 95 per cent HPD width, which indicates more precise and more accurate median estimates (Fig. 2F–I). Still, performance remains lower for CTMC. In the three demes framework, we obtain even stronger improvements in terms of correlation and decreased MRB for BASTA and MASCOT (Supplementary Fig. S9). Overall, subsampling strategies that maximize the spatial or spatiotemporal coverage considerably improve the inference of the geographical spread by the CTMC and improve inference under BASTA and MASCOT to a lesser extent.
True incidence data as a predictor of the time-varying deme sizes mitigate sampling bias in MASCOT
Due to the lack of statistical power (data not shown), we have forced all deme sizes to be equal in BASTA and MASCOT and to be constant over time, with the latter being currently the default assumption of both structured coalescent models. This hypothesis is potentially impactful, given that deme sizes are directly related to the migration history in the structured coalescent model (De Maio et al. 2015; Müller, Rasmussen, and Stadler 2018). To relax this assumption and allow for time-varying effective population sizes, we next use the monthly incidence data from our simulations as a predictor of the deme sizes over time in the generalized linear model (GLM) extension of MASCOT and denote the resulting model as MASCOT-GLM. This approach is not available for BASTA.
Here, we are interested in the impact of the parameterization of deme sizes on the sensitivity to sampling bias. We thus apply MASCOT-GLM on sampling conditions where we test the impact of spatial sampling bias, i.e. subsamples from the systematic surveillance analysis and the ‘uni surv.’ subsamples in the surveillance bias analysis. By accommodating time variation of deme sizes, the correlation, the mean relative 95 per cent HPD width, the MRB, and the WIS are markedly improved with MASCOT-GLM compared to BASTA and MASCOT for the total migration counts (Fig. 2), lineage migration counts (Supplementary Fig. S6), and lineage introduction dates (Fig. 3) even at high levels of sampling bias under the systematically biased conditions (Scenarios 5, 10, 20, and 50) and in the biased subsamples (uniform surv.). In addition to the strong correlation between simulated and estimated values, the uncertainty around the true value and the bias (MRB and WIS) are low compared to BASTA and MASCOT with constant population sizes.
Analysis of the spread of RABV in the Philippines
As a case study to compare the performance of the three algorithms, we analyze the spread of RABV in dog populations among six Philippine islands using 233 sequences of the RABV glycoprotein gene isolated between 2004 and 2010 (Saito et al. 2013; Tohma et al. 2014). Discrete phylogeography is particularly adapted here to model transmission in animal populations across an archipelago. In this dataset, sampling is highly heterogeneous across the different islands: Luzon represents up to 65 per cent of the total dataset, while Oriental Mindoro is represented by a single sequence (Supplementary Fig. S14). This heterogeneity is very unlikely to be representative of the underlying transmission but rather due to the case under-reporting outside Luzon.
Previous studies on RABV in the Philippines suggested that although the circulating lineages likely circulate independently in the main islands (Saito et al. 2013; Tohma et al. 2014), inter-island transmission events can lead to sustained circulation in previously rabies-free islands (Tohma et al. 2016). Here, the CTMC model also predicts a highly spatially structured phylogeny with few migration events among islands. It reconstructs four island-specific clades located in Catanduanes, Luzon, Mindanao, and Negros Oriental with high node and location posterior support (Fig. 5A). BASTA and MASCOT also predict the Catanduanes, Mindanao, and Negros Oriental clades with high node and location posterior support (Fig. 5B,C). However, the migration history of the Luzon clade is more uncertain with potential intense migrations between Luzon and Oriental Mindoro islands, the most and least sampled islands, respectively. As shown in the simulations, CTMC might be overconfident compared to BASTA and MASCOT, but the uncertainty of the two approximations of the structured coalescent model might be related to the pseudo-ghost demes, i.e. locations for which very few sequences are available. As we do not have information regarding the number of cases over time, we could not apply MASCOT-GLM to this dataset.
Figure 5.
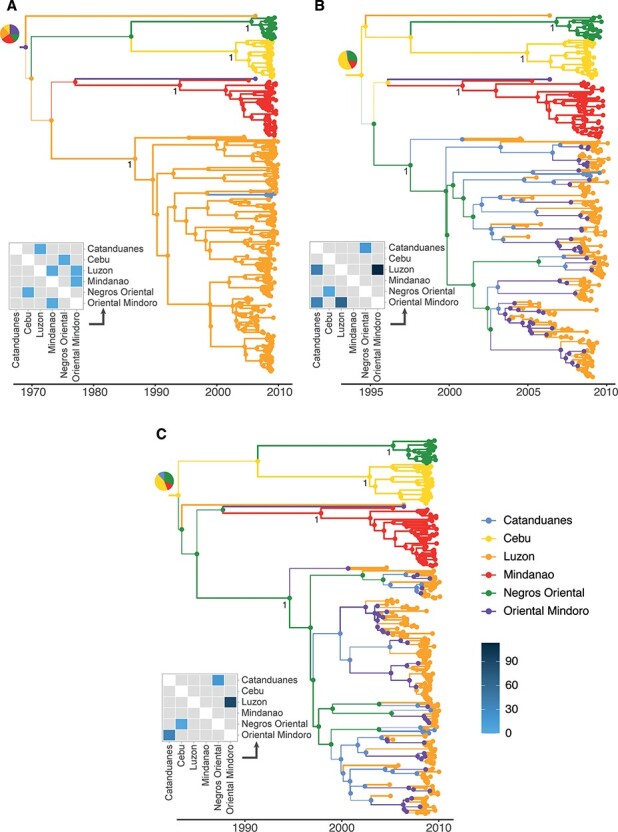
MCC trees and median total migration counts estimated on the rabies dataset. (A–C) MCC trees and a median number of total migration counts estimated on the rabies dataset by the CTMC model, BASTA, and MASCOT, respectively. Branch width is proportional to the maximal ancestral location probability estimated by the algorithms, and branches are colored by the maximal ancestral location. Posterior support of the Negros Oriental, Catanduanes, Mindanao, and Luzon Island lineages is reported. Pie charts displayed at root nodes represent the posterior probability distribution of the root location. Median estimates of the total migration counts are reported as heatmaps. Gray tiles correspond to transitions associated with a migration rate that is not statistically supported, i.e. with a BF lower than 3.
Analysis of the early spread of SARS-CoV-2 across the world
While there is typically no or scarce reliable data on the number of new cases in wild and domestic animal populations, such estimates are generally widely available for pathogens infecting the human population, as is the case for SARS-CoV-2, dengue virus, HIV, and West Nile virus (Gill et al. 2016; Dellicour et al. 2020). Here, we compare the phylogeographic reconstructions of the four algorithms tested earlier on a dataset of SARS-CoV-2 genomic sequences from the early stage of the pandemic (Lemey et al. 2020). MASCOT-GLM is informed using the seven-day moving average of case count data either from Our World in Data (Mathieu et al. 2020) or from the WHO (World Health Organization (WHO) 2023). MASCOT-GLM is then referred to as MASCOT-World In Data (WID) and MASCOT-WHO, respectively (Supplementary Fig. S15). In the original study, the initial wave of SARS-CoV-2 infections was investigated using a novel travel history-aware extension of the CTMC model, which we here refer to as the CTMC-TRAVEL.
Due to the low number of mutations accumulated in the SARS-CoV-2 genome at the start of the pandemic, the posterior support of internal nodes for each algorithm is low and the tree topology is very uncertain (Morel et al. 2021). Besides, we do not intend to reconstruct the origins of SARS-CoV-2, which, in any case, cannot be addressed solely with phylogeographic analyses (Pipes et al. 2021). That is why our comparison focuses on the posterior support of four clades originally identified by Lemey and colleagues (2020): Clades A, A.1, B.1, and B.4. Clades A.1, B.1, and B.4 are recovered with high posterior support by all algorithms, whereas Clade A is reconstructed with a satisfying posterior support only by CTMC (Supplementary Fig. S16–21). In general, CTMC and MASCOT-WHO reconstructions are closer to the original one compared to the other algorithms, notably in terms of tree topology (Supplementary Figs. S16 and S21) and of total migration counts (Fig. 6). As previously shown, BASTA and MASCOT lead to more uncertain ancestral migration histories with the extreme case of BASTA for which the posterior evolutionary rate and the structured coalescent density are bimodal. The first mode of BASTA infers a tree topology and a migration history that are similar to the CTMC model and CTMC-TRAVEL (Supplementary Fig. S17). For example, the reconstructed location of the most recent common ancestor of lineage B.4 is China for CTMC-TRAVEL, the CTMC model, and the first mode of BASTA, whereas it is located in Oceania for MASCOT and the second mode of BASTA (Supplementary Table S1). For the latter two reconstructions, most of the ancestral branches were not inferred to occur in China and, similar to the RABV dataset, they predict the least sampled locations (Africa and Oceania) to play a major role in the transmission process.
Figure 6.

Posterior distributions of the total migration counts estimated on the SARS-CoV-2 data. Source locations are displayed in rows and destination locations in columns. For CTMC, BASTA, and MASCOT, posterior distributions of the total migration counts with a BF < 3 are not depicted but marked as non-significant. We identify bimodal marginal posterior distributions with an asterisk, and we report for each posterior distribution the median and 95 per cent HPD. We normalize the width of the violin plots so that the cumulative density is equal to one.
When we incorporate incidence data into MASCOT-GLM, reconstructions differ strongly between the Our World in Data and WHO datasets. While MASCOT-WID reconstruction is uncertain with multimodal total migration counts (Fig. 6) and does not reflect the original spread from China (Supplementary Fig. S20), the MASCOT-WHO estimated migration counts that are close to the estimates of CTMC-TRAVEL (Fig. 6), and its maximum clade credibility (MCC) tree is in agreement with the origin of the pandemic (Supplementary Fig. S21). Importantly, the two datasets differ strongly in how well early cases are covered (Supplementary Fig. S15), with the WHO dataset being more representative of the incidence over time. Overall and as also suggested by our simulations, although the structured coalescent model, in principle, allows us to mitigate sampling biases, it can itself be highly biased when wrong population dynamics are assumed.
Discussion
Sampling bias is a key challenge in phylodynamic inference (Frost et al. 2015), as in discrete phylogeography. In its early developments, the evaluation of the impact of sampling bias on Bayesian discrete phylogeography models was restricted by the availability of whole genomes (Lemey et al. 2009). The SARS-CoV-2 pandemic has led to a paradigm shift as genomic surveillance became part of routine surveillance systems around the world (Hodcroft et al. 2021). Here, we evaluated the impact of sampling bias on discrete phylogeography inference using simulated and real data to provide insightful knowledge on how sampling bias affects such inference and how it could be mitigated.
Inference performance in the absence of sampling bias
In our simulation study, tree topologies match the corresponding simulated transmission chains for all approaches. In addition, CTMC leads to high correlation between the simulated and estimated spatiotemporal parameters as well as low relative and absolute error in the absence of sampling bias. Overall, CTMC reconstructs the spatiotemporal histories well and its estimates are more accurate in large samples. BASTA and MASCOT do not correctly infer the spatiotemporal parameters in the seven demes framework, but the correlation between simulated and estimated total migration counts is slightly improved in the three demes framework while remaining lower than CTMC. This could result from three different causes. First, we assumed that all deme sizes are equal and constant over time in BASTA and MASCOT, the former to avoid over-parameterization and the latter being the only available assumption in current implementations. Such a parameterization is more appropriate in the case of endemic circulation with limited time-varying dynamics such as local extinctions. However, large variations in time and local extinctions occur in our simulations meaning that we had to assume incorrect population dynamics in BASTA and MASCOT. This is confirmed by the better performance of MASCOT-GLM in uniform samples that accommodates for the true population dynamics. Second, we would expect BASTA and MASCOT to perform better on ‘even’ samples that contain approximately as many sequences of each sampled location (De Maio et al. 2015). In our simulation study, uniform sampling does not imply an even representation of sampled locations. Indeed, locations where the virus has not circulated much are less represented. Such an effect is more pronounced in the seven demes framework than the three demes framework, and we effectively observe poorer performances of BASTA and MASCOT in the seven demes framework. Finally, the structured coalescent model is known to be sensitive to ghost demes, i.e. unsampled locations (Beerli 2004; Ewing and Rodrigo 2006; De Maio et al. 2015). As we considered the sampling process to be naive of the number of affected locations, locations where the virus has not circulated much may remain unsampled. This is true for the seven demes framework only for which we observe poorer performance of BASTA and MASCOT compared to the three demes framework. However, the impact of ghost deme inclusion and potential misspecification on the estimation of the migration patterns remains unclear. While two studies showed that accounting for ghost demes in the structured coalescent model improves the inference of deme size (Beerli 2004; Ewing and Rodrigo 2006), Ewing and Rodrigo (2006) also showed that adding just a few sequences from the ghost deme leads to the overestimation of the migration rate.
Inference performance under sampling bias
We show that the CTMC model, BASTA, and MASCOT are impacted by spatial sampling bias in different ways. CTMC performance is dramatically impaired with increasing levels of sampling bias. This is directly linked to the geographical sampling frequencies that inform the likelihood of the CTMC model (De Maio et al. 2015). It also tends to be overconfident, and this overconfidence worsens with stronger sampling bias as previously shown (De Maio et al. 2015). However, the impact of sampling bias can be mitigated by either using large samples at low levels of sampling bias or controlling for sampling bias by balancing sample composition (region and region + year subsamples) at intermediate levels of sampling bias. These results were well-replicated in a simpler framework of transmission among three locations, which rules out the confounding effect of the simulation complexity and unsampled locations on our results (see Section 2 of the Supplementary Data).
BASTA and MASCOT do not accurately estimate the total migration counts nor the lineage introduction dates under biased and unbiased conditions. Nevertheless, the overall migration process evaluated by the lineage migration counts is relatively well captured with a correlation around 0.5 that is not impacted by sampling bias contrary to CTMC in both the three demes and seven demes scenarios. We show that the approximations of the structured coalescent model are generally less confident than the CTMC, which is in agreement with a previous study (De Maio et al. 2015), and their uncertainty around median estimates increases with sampling bias. We also show that sample composition impacts the inference of BASTA and MASCOT in the three demes framework since correlation levels are strongly improved and bias and uncertainty are reduced for all spatiotemporal parameters in ‘even’ samples (region and region + year), despite the underlying surveillance bias. Still, BASTA and MASCOT estimates display lower correlation with the simulated values, higher uncertainty, and higher relative and absolute bias compared to CTMC. In the seven demes framework, the results are less clear, which may be due to the presence of ghost demes. Interestingly, BASTA seems to outperform CTMC and MASCOT in the inference of the lineage introduction dates in the three demes framework. This result was, however, not replicated in the seven demes framework.
While structured coalescent methods potentially allow mitigating sampling biases as previously shown (De Maio et al. 2015), assuming incorrect population dynamics very likely introduces biases. Structured coalescent models currently assume constant population sizes in all demes and often require the additional assumption of equal population sizes to reach convergence and attain proper mixing. When the true underlying population dynamics are complex with large differences among populations, the models cannot estimate the population sizes with low uncertainty and compensate for this issue in the estimation of the migration rates, so ultimately in the migration history. We addressed this issue by modeling population dynamics more accurately using a GLM approach. Indeed, using incidence data to inform population dynamics in MASCOT counteracts the impact of sampling bias even at high levels. This result also underlines the fact that sampling frequencies do not inform the structured coalescent model when population dynamics are known (De Maio et al. 2015). It also shows that the inclusion of ghost demes is not necessary when the true population dynamics are incorporated into the model. Overall, our results showcase the importance of considering the assumptions of population dynamics on the ancestral state reconstruction in structured coalescent model approximations.
Analysis of empirical RABV and SARS-CoV-2 datasets
We further compare the approaches on real datasets of RABV and SARS-CoV-2. As dog case counts were not available for RABV, we compare only CTMC, BASTA, and MASCOT. CTMC predicts a highly spatially structured migration process, whereas BASTA and MASCOT predict a non-parsimonious scenario. We observe similar results for the SARS-CoV-2 dataset. As we have set equal deme sizes in BASTA and MASCOT, but a single tip is sampled for Oriental Mindoro in the RABV dataset and for Africa in the SARS-CoV-2 dataset, BASTA and MASCOT compensate for location under-representation by estimating high backward-in-time migration rates to the under-represented location (Oriental Mindoro and Africa). Our results are in line with those given in previous studies reporting strong differences between the CTMC model and the structured coalescent model on real datasets (De Maio et al. 2015; Dudas et al. 2018). However, there is also evidence in the literature of a good agreement between the two types of models (Faria et al. 2017; Brynildsrud et al. 2018; Yang et al. 2019; Mavian et al. 2020). Such similarities can result from sample composition (at least ten sequences per location in Yang et al. (2019)), the parameters used for comparison (probability of clade ancestral location in Faria et al. (2017)), prior information (information on the root location in Brynildsrud et al. (2018)), or the underlying transmission dynamics. Besides, these studies focused on the overall migration process that corresponds to the lineage migration counts in our simulation study, and we showed that the overall migration process is roughly estimated at any level of bias. In brief, we show on real datasets that singletons may be inferred as drivers of the migration process in an unparsimonious way by structured coalescent model approximations. This result supplements a previous study on the impact of the inclusion of few ghost deme sequences on the inference of migration rates (Ewing and Rodrigo 2006); however, their impact remains unclear and deserves close consideration.
Interestingly, the posterior density of the structured coalescent model in BASTA is bimodal for the SARS-CoV-2 dataset. Its major mode corresponds to a migration history close to CTMC-TRAVEL and our expectations of SARS-COV-2 spread at the start of the pandemic, whereas the minor mode corresponds to the non-parsimonious scenario. Such bimodality was not observed for MASCOT in the SARS-CoV-2 analysis. This difference in estimation is not unexpected since the two structured coalescent model approximations are different. However, it is not clear which characteristics of the two algorithms would lead to different behaviors. Another possibility relies on the choice of operators that determine how well the two approximations explore the parameter and tree space in which case MASCOT should lead to a bimodal posterior density in the long run.
Practical implications for the analysis of empirical datasets
Computation time is an important consideration in real-life situations. The CTMC model is a fast algorithm that can handle many sequences while facing little convergence issues, which made it the predominant approach. For example, CTMC and its extensions have been extensively used during the SARS-CoV-2 pandemic (Candido et al. 2020; Lemey et al. 2020; Alteri et al. 2021; Butera et al. 2021; Dellicour et al. 2021a, 2021b; Kaleta et al. 2022; Perez et al. 2022). In general, researchers analyzed large datasets whose composition reflected case counts (Candido et al. 2020; Lemey et al. 2020) or the number of hospitalizations per geographical location (Dellicour et al. 2021b). In our simulations, we did not test sampling strategies based on case counts, but we showed that even though the pool of available sequences is not representative of the underlying transmission process, CTMC inference should be little impacted when using even subsamples of the available sequences. Besides, sampling strategies based on case counts require the availability of unbiased case count data in all studied locations.
With BASTA and MASCOT, computational time can become rapidly cumbersome and even impractical when the number of sequences and locations increases. In parallel, these approaches estimate migration parameters with high uncertainty and can lead to bimodal structured coalescent posterior densities with a major mode and a minor mode, as observed for MASCOT on large samples of 500 sequences in the seven demes framework and for BASTA on the SARS-CoV-2 dataset. Repeating these problematic analyses with different starting values did not redeem these issues. Other studies have reported similar issues (Richardson et al. 2018). However, these problematic inferences can potentially be overcome by informing structured coalescent models with additional covariate data on viral population size dynamics. Indeed, as a result of adding such data, MASCOT-GLM not only outperformed the other approaches at estimating spatiotemporal parameters but also displayed improved mixing as expected with GLM approaches, which improves the computational burden. However, such improvements depend on the availability and informativeness of the case count data used, notably on the early viral population size dynamics. This is illustrated in our analysis of the SARS-CoV-2 data for which the addition of WHO data led to improved chain mixing and past migration inference compared to the data from Our World in Data, knowing that the dynamics are rather similar in the two datasets, but they go back to 4 January, 2020, for the WHO data and to 23 January, 2020, for the data from Our World in Data.
Limitations
We acknowledge several limitations of our study. First, BASTA and MASCOT are expected to perform better on even samples, a condition that we did not directly test. In the representative (uniform) samples, location frequencies inform CTMC, and thus, it would be expected to be favored over BASTA and MASCOT. Still, we show that MASCOT and BASTA perform better on even (region and region + year) samples in the three demes framework even if they are derived from biased large biobanks. This result suggests that BASTA and MASCOT perform better on even samples with no ghost demes. Second, our subsampling procedure in the simulation analysis could leave some locations unsampled, which can be considered as an extreme case of sampling bias. While this happened in only a few highly biased samples in the three demes framework, it is very common in the seven demes framework even in the absence of sampling bias. To determine whether the poor performance of MASCOT and BASTA in the absence of bias in the seven demes framework compared to the three demes framework is due to ghost demes or is simply due to the higher number of locations would require additional extensive analyses, which exceed the goals of this study. Additionally, we cannot rule out that the effects of sampling bias we observe are due to unsampled locations/unspecified ghost demes rather than unrepresentative sampling. We did not include unsampled locations as ghost demes under such conditions. However, this is unlikely to improve the migration rate estimation (Ewing and Rodrigo 2006). Third, the impact of sampling bias certainly depends on the underlying overall migration rate as shown by Liu et al. (2022), an impact that we did not investigate here.
Another limitation concerns the incorporation of epidemiological data in phylogeographic models. Here, deme sizes in MASCOT-GLM are informed by case count data, but this kind of data may not be readily available (Grubaugh et al. 2019) and is known to be often biased due to varying testing effort and strategy, as well as differential testing behaviors by age (Buckee, Noor, and Sattenspiel 2021). It is difficult to predict how MASCOT-GLM would perform if parameterized with biased case counts, a case that we did not address in our simulations. The comparison between the WHO and WID cases data, however, suggests that biased coverage of the true case load could bias such inference. If case count data are not reliable, one could use hospitalization data instead (Dellicour et al. 2021b). Furthermore, a similar approach is available under the CTMC framework, but we did not test it here. This framework consists in modeling the migration process with CTMC and the overall population dynamics with the GLM extension (Gill et al. 2016) of the skygrid coalescent model (Gill et al. 2013). In this extension, case count over all locations could be used as a predictor of the viral population size over time. Yet, such an approach assumes a panmictic population and remains rare.
It is difficult to generalize our results in regard to the number of demes. Our choice of the number of locations was influenced by the RABV scenario in Morocco. While a scenario with three demes was doable, the one with seven demes turned out to be difficult to analyze, notably due to computational burden (Supplementary Tables S4–S6). More research and development are needed for datasets with a large number of locations (>15), and it currently seems unlikely that such analyses are possible at all with BASTA and MASCOT.
Finally, our simulation study focuses on a specific epidemiological context, the spread of RABV in dogs, for which we obtained relatively limited numbers of migration events in each phylogeny. We cannot rule out that the impact of sampling bias would be different for other viruses, but examining such scenarios would require performing additional studies.
Perspectives
In conclusion, sampling bias can be tackled at different levels of data generation and analysis in phylogeographic analyses: sample constitution, inference model choice, and data integration (e.g. through an integrated GLM). Other studies also assess the impact of sampling bias in post hoc analyses (Chaillon et al. 2020; Vrancken et al. 2020) or explicitly model sampling patterns (Guindon and De Maio 2021). Although the exploration of the impact of sampling bias has increased over the recent years and more robust methodologies have been developed, many aspects remain unclear, among which is the impact of unsampled locations, biased epidemiological data incorporation, or the relative performances on even versus representative samples. Whenever possible, we would advise to opt for an even sampling strategy across geographical locations, compare the inferences of the different approaches, or compare the inferences over multiple subsamples when analyzing real datasets. These considerations are all the more important in a world of ever-growing genome sequence generation and concern not only human viral diseases but also zoonoses and epizooties.
Methods
Simulation study
Simulation of viral transmission chains using a metapopulation model
In order to address the impact of spatial sampling bias on discrete phylogeographic inference, we performed a detailed simulation study. Sampling bias concerns all diseases, but it is even more challenging to address in the context of zoonotic diseases for which most of the transmission process is unobserved. We grounded our study in the context of dog rabies in North Africa where transmission processes are relatively well-documented. It was notably shown that rabies transmission relies on human movement over long distances. We simulated rabies epidemics in dog populations according to realistic scenarios using a stochastic, discrete time, and spatially explicit model implemented in R using the Rcpp package (Eddelbuettel and Balamuta 2018). We divided the Moroccan dog population into three or seven subpopulations corresponding to arbitrary regions (see the Parametrization of the Between-Region Mobility Matrix section; Supplementary Fig. S23). We divided each subpopulation into three compartments: susceptible, exposed, and infectious individuals (Fig. 1A). At each discrete time step, we drew newborns and dead individuals in the susceptible compartment from Poisson distributions with respective means of the birth rate  and the death rate
  . We defined the force of infection
  , i.e. the per-capita rate of infection of susceptible individuals in region
  on day
  , as
, as
 |
where  is the transmission rate of rabies scaled by
  , i.e. the human population size in region
  ,
,  is the per-capita mobility rate of individuals moving from region
  to region
  ,
,  is the number of infectious individuals in region
  on day
  , and
, and  is a scale factor (see later in this paragraph for more information). Exhaustive dog census data were not available, and it is well known that human-mediated movement plays a major role in the spread of rabies in North Africa (Talbi et al. 2010; Dellicour et al. 2017); thus, we assumed that dog populations were proportional to human populations (Supplementary Table S2). We scaled the rabies transmission rate by population size to ensure that the force of infection is density-independent as previously documented on rabies (Morters et al. 2013). We used the scale factor
  to monitor the proportion of inter-region infections. Its value was arbitrarily chosen so that 1 per cent of infection events occurred among regions, and the basic reproduction ratio is approximately equal to 1.05 within and between regions. At each time step, we drew the number of newly exposed individuals in each region from Poisson distributions with a mean specified by the number of susceptible individuals in region
  on day
  (
( ) multiplied by the force of infection in region
  on day
  (
( ). Once an individual
  entered the exposed compartment, it was uniquely identified. The location of its infector was drawn from a multinomial distribution with the following probabilities:
 |
Once the location of the infector was drawn, the ID of the infector was randomly sampled from the set of infectors present in the location. All infectious individuals in each region had the same probability of infection. The incubation period of exposed individuals was drawn from a gamma distribution with shape 2 and a rate of 11.055 (Hampson et al. 2009), and its infectious period was drawn from a discretized gamma distribution adapted from Hampson et al. (2009) so that it could not exceed 15 days (World Health Organization (WHO) 2018). Finally, the life span was drawn from an exponential distribution with rate  . If natural death occurred before the end of the incubation or infectious periods, the individual was removed prematurely. Otherwise, the individual went through the exposed and infectious compartment before dying from rabies (Supplementary Table S2).
We initiated all simulations with the introduction of a single index case in Region 1 (Supplementary Fig. S23). According to Darkaoui et al. (2017), there are on average 400 confirmed animal cases per year in Morocco, which is certainly an underestimation (Broban et al. 2018). We assumed a 20 per cent reporting rate of dog cases in Morocco (Taylor et al. 2017) and thus retained epidemics with at least 60,000 cases over a 20- to 30-year period (Fig. 1C). We analyzed the results for fifty simulations.
Parameterization of the between-region mobility matrix
To avoid computational difficulties and over-parameterization of the different discrete phylogeographic models, we aggregated the fifteen official Moroccan regions retrieved from the GADM dataset (https://www.gadm.org) into three or seven locations (in two simulated scenarios, respectively) that are based on human demographics and ecological features (Supplementary Fig. S23). Dog mobility was defined across locations by fitting a radiation model with a raster of human population distribution (WorldPop (2022)) using the R package movement (Golding, Schofield, and Kraemer 2015). In the radiation model, commuting is determined by the job-seeking behavior modeled as an absorption and radiation process (Simini et al. 2012). The average commuting flux  from location
  to location
  with populations
  and
and  , respectively, is
 |
where  is the total population in the circle of radius
  centered at
  (excluding the source and destination population).
We used a model of human mobility as it has been shown that humans play a major role in dog rabies spread and maintenance in North Africa, especially across long distances R package version 1.3.6 (Talbi et al. 2010; Dellicour et al. 2017). We preferred the radiation model over the gravity model for two reasons: the radiation model has been shown to outcompete the gravity model at local and large scales (Simini et al. 2012), and it presents the advantage of having no free parameter(s). In our study, we inferred the average daily number of commuters among raster cells of 20 km with more than 1,000 inhabitants per kilometer square. The size of the cells corresponds approximately to the municipality level, and the density threshold corresponds to the urban density in Morocco. The number of commuters was then aggregated at the location level.
Evolutionary model of RABV genomes associated with cases
Simulation studies that analyze the accuracy of phylogeographical techniques often use the inference model as the simulation model (De Maio et al. 2015; Müller, Rasmussen, and Stadler 2017; Kalkauskas et al. 2021). Here, we took an epidemiological perspective by simulating rabies epidemics using a metapopulation model and by inferring the spatiotemporal history of rabies from RABV sequences and not from phylogenetic trees. After simulating rabies epidemics as described earlier, RABV genomes associated with each case were simulated according to the HKY model (Hasegawa, Kishino, and Yano 1985). We simulated in R sequence evolution forward-in-time along the transmission chains, which were used in the same way as a phylogeny. We opted for a simple evolutionary process in which selection, gene partition, and site heterogeneity were not considered. Parameter values are listed in Supplementary Table S2. The genome of the index case is a real canine rabies genome of 13-kb length isolated in Morocco in 2013 (GenBank Accession Number KF155001.1) (Marston et al. 2013).
Sampling schemes of viral sequences
The aim of the study is to determine the impact of sampling bias on phylogeographic inference and how alternative sampling schemes may mitigate the effects of such sampling bias. To address the former issue, we sampled either uniformly (uniform) or with a sampling bias favoring viral sequences from highly populated locations (Regions 3 and 4). In the latter scenario, sequences from Regions 1, 2, 5, 6, and 7 had a weight equal to one, whereas Regions 3 and 4 had a weight equal to 2.5, 5, 10, 20, and/or 50. To mitigate the potential effects of sampling bias, we tested a different set-up reproducing a surveillance system. In this set-up, a biobank of 5,000 sequences was drawn from each epidemic with a weight of one for Regions 1, 2, 5, 6, and 7 and a weight of 10 or 20 for Regions 3 and 4. Subsets of sequences were sampled from the biobank uniformly (uniform surv.), by maximizing the spatial coverage (maximum per region), or by maximizing the spatiotemporal coverage (maximum per region and per year). For all sampling schemes, a large sample of 500 sequences and a nested sample of 150 sequences were drawn over the entire epidemic except for the first year, as we assumed that the spread of the virus would remain undetected at the start of the epidemic as observed in other settings (Townsend et al. 2013).
Discrete phylogeographic analysis in BEAST
Generation of BEAST XML files and phylogeography inference set-up.
Tailored XML template files for the BASTA and MASCOT structured coalescent models, as well as for the DTA (CTMC) model, were edited using the lxml Python package to add sequence alignments along with their metadata. Bayesian phylogeographic analyses were performed using BEAST v1.10.5 (Suchard et al. 2018) for the CTMC model (Lemey et al. 2009) and BEAST v2.6.4 (Bouckaert et al. 2019: 5) for MASCOT v2.2.1 (Müller, Rasmussen, and Stadler 2018) and BASTA v3.0.1 (De Maio et al. 2015), making use of the BEAGLE library v3.1.1 (Ayres et al. 2012). We assumed an HKY substitution model with a strict molecular clock. When the sampling scheme resulted in a deme not being sampled, the discrete phylogeography algorithm was parameterized with the sampled demes only, i.e. no ghost demes were accounted for. Population dynamics in the CTMC model followed a constant population size prior. We chose this prior since the model of population dynamics is not expected to impact migration history inference, and the constant population size model is often chosen for the analysis of endemic diseases. For the BASTA and MASCOT structured coalescent models, all demes were set to have an equal size due to numerical issues, leading to a computational time of over 70 hours per million iterations (data not shown). For both models, asymmetric migration matrixes were inferred and Bayesian stochastic search variable selection was used to avoid over-parametrization. The detailed list of prior distributions is available in Supplementary Table S3 for each inference framework.
If deme sizes are set to be equal in the structured coalescent model, but the actual population dynamics vary through time, the model tends to explain population dynamics by migration dynamics. In our simulations, the incidence changed dramatically over time and location (Fig. 1C), and thus, the inference by the structured coalescent model is expected to improve when accounting for time-varying population dynamics. To test this hypothesis, we used monthly incidence data from our simulations as a predictor of the deme sizes by using a GLM in MASCOT (Müller, Dudas, and Stadler 2019). We tested this alternative parameterization (MASCOT-GLM) under the following conditions: uniform, biased-2.5, biased-5, biased-10, biased-20, biased-50, uniform surv. 10, and uniform surv. 20.
These different BEAST analyses were run for at least 20 and 40 million steps and sampled every 2,000 and 4,000 steps for small and large alignments, respectively. In total, 8,800 XML files were run for this study, for a total of an estimated 1,500 hours of computation on multicore CPUs across different computing infrastructures (Supplementary Table S4).
Analysis of phylogeographic inference output.
For each BEAST analysis, adequate mixing was assessed based on the ESS values of the continuous parameters. We calculated ESS values using a Python function adapted from Tracer v1.7.2 (Rambaut et al. 2018). When at least one continuous parameter had an ESS value below 200, chains were resumed to reach at most 120 million iterations. Analyses that exhibited ESS values lower than 200 at this point were discarded (Supplementary Tables S5 and S6). Due to the higher computational burden of BASTA, the ESS cut-off was reduced to 100. We discarded a 10 per cent burn-in in the selected chains. The combined posterior tree distributions were summarized into MCC trees using TreeAnnotator for BASTA and the CTMC, and the Python library DendroPy (Sukumaran and Holder 2010) for MASCOT and MASCOT-GLM (Supplementary Materials Section 6b). Summary statistics, ESS values, Bayes factors (BFs) on migration rates (Lemey et al. 2009), root state probabilities, dates of lineage introduction, and lineage migration counts were calculated in Python before plotting the results in R using the ggplot2 package R package version 1.3.6 (Wickham 2016: 2). For more information on the calculation of the migration summary statistics, see Section 6c in the Supplementary Data.
Performance analysis.
To assess the accuracy of the phylogenetic reconstruction, the total divergence time in calendar time units was computed for every pair of sampled tips on both the MCC tree and the simulated transmission chain, and these outcomes were subsequently compared using the Pearson correlation coefficient. In addition, we evaluated the impact of sampling bias and alternative sampling strategies on the estimation of the total migration counts, lineage migration counts, and dates of first lineage introduction into each sampled location using five metrics. We denote  as the true value of the parameter,
  as the parameter posterior distribution,
  as the median estimate,
  as the 95 per cent HPD,
  as the number of prediction intervals included in the calculation of the WIS,
  as the observed outcome by forecast
  ,
,  as the predictive median on the
  prediction interval,
  as the interval score on the
  prediction interval, and
  as its weight.
Kendall’s tau correlation: a rank correlation measure that is less sensitive to outliers compared to Pearson’s correlation coefficient
 |
Calibration
 |
MRB
 |
Mean relative 95 per cent HPD width
 |
WIS: a generalization of the absolute error accounting for estimation uncertainty. We present the formula of the WIS and refer to the original article for further details, notably on the interval score (Bracher et al. 2021).
 |
The MRB and the mean relative 95 per cent HPD width are defined when the true value is not zero. However, the total migration counts and the lineage migration counts for some pairs of locations can be null in our simulations, whereas the algorithms infer a non-null median. These cases were not considered in the calculation of the MRB and the mean relative 95 per cent HPD width. We reported their numbers in the caption of the corresponding figures.
Data analysis
RABV expansion in the Philippines
We extended our comparative analysis of the CTMC model, BASTA, and MASCOT by analyzing a set of RABV genetic sequences using the three approaches. In total, 233 sequences corresponding to the RABV glycoprotein gene were sampled in the Philippines from 2004 to 2010 (Saito et al. 2013). In the original discrete phylogeographic analysis, the authors studied viral spread across eleven out of the seventeen Philippines regions and showed that the genetic diversity was highly spatially structured, notably at the island level (Tohma et al. 2014). Here, we evaluated the spread across the six sampled islands (Luzon, Catanduanes, Oriental Mindoro, Cebu, Negros Oriental, and Mindanao) to compare the reconstructions on a highly structured dataset and limit the number of demes that considerably slow down BASTA and MASCOT. We assumed an HKY nucleotide substitution model with an among-site rate heterogeneity modeled by a discretized gamma distribution (Yang 1994), and an uncorrelated relaxed molecular clock with an underlying lognormal distribution (Drummond et al. 2006). For the CTMC, we assumed a constant size coalescent model for the viral demographics as in the original analysis. For MASCOT and BASTA, current implementations assume a constant population size model for the viral demographics within demes. A detailed description of the priors is reported in Supplementary Table S7. For each algorithm, we combined three post-burn-in independent chains of 50 million iterations each.
The early dynamics of SARS-CoV-2 worldwide spread
Tracking viral disease spread in animal populations faces many challenges, and to our knowledge, no reliable incidence data are available for zoonoses such as rabies. In this context, MASCOT-GLM cannot readily be used. We analyzed the early worldwide spread of SARS-CoV-2 to compare the inferences of the CTMC, BASTA, MASCOT, and MASCOT-GLM. Lemey et al. (2020) analyzed this dataset to characterize SARS-CoV-2 spread across forty-four location states by incorporating individual travel histories of sampled individuals to help correct for sampling bias and unsampled locations. By using the carefully obtained results of Lemey et al. (2020) as a reference, we can evaluate how the four algorithms are impacted by sampling bias.
The dataset comprises 282 SARS-CoV-2 genomic sequences sampled in the five continents from 24 December, 2019, to 4 March, 2020. We assumed an HKY nucleotide substitution model with a proportion of invariant sites, an among-site rate heterogeneity modeled by a discretized gamma distribution, and a strict molecular clock. For the CTMC, we assumed an exponential growth model for the viral demographics. MASCOT and BASTA assume a constant size model for the viral demes demographics. Contrary to the original study, we analyzed migration among six discrete locations: Africa, the USA, Asia, China, Europe, and Oceania. For MASCOT-GLM, we used the daily number of confirmed cases at the continent level from Our World in Data (Mathieu et al. 2020) or from the World Health Organization (WHO 2023) as a predictor of the deme sizes. The former is referred to as MASCOT-WID, and the latter as MASCOT-WHO. We smoothed the number of new confirmed cases using a seven-day moving average. A detailed description of the priors is reported in Supplementary Table S8. We combined three post-burn-in independent chains of 50 or 100 million iterations for each inference.
Supplementary Material
Acknowledgements
We would like to thank Dr Alessio Andronico for his help in the implementation of the rabies simulation model in Rcpp.
Contributor Information
Maylis Layan, Mathematical Modelling of Infectious Diseases Unit, Institut Pasteur, Université Paris Cité, UMR2000, CNRS, 25-28 rue du Docteur Roux, Paris 75014, France; Collège Doctoral, Sorbonne Université, 21, rue de l’école de médecine, Paris 75006, France.
Nicola F Müller, Vaccine and Infectious Disease Division, Fred Hutchinson Cancer Research Center, 1100 Fairview Ave N, Seattle, WA 98109, USA.
Simon Dellicour, Spatial Epidemiology Lab (SpELL), Université Libre de Bruxelles CP 264/03, Avenue F. Roosevelt 50, Brussels 1050, Belgium; Department of Microbiology, Immunology and Transplantation, Rega Institute, KU Leuven, Herestraat 49, Leuven 3000, Belgium.
Nicola De Maio, European Molecular Biology Laboratory, European Bioinformatics Institute (EMBL-EBI), Wellcome Genome Campus, Hinxton, Cambridgeshire CB10 1SA, UK.
Hervé Bourhy, Lyssavirus Epidemiology and Neuropathology Unit, Institut Pasteur, Université Paris Cité, 25-28 rue du Docteur Roux, Paris 75014, France; WHO Collaborating Centre for Reference and Research on Rabies, Institut Pasteur, Université Paris Cité, 28 rue du Docteur Roux, Paris 75724, France.
Simon Cauchemez, Mathematical Modelling of Infectious Diseases Unit, Institut Pasteur, Université Paris Cité, UMR2000, CNRS, 25-28 rue du Docteur Roux, Paris 75014, France.
Guy Baele, Department of Microbiology, Immunology and Transplantation, Rega Institute, KU Leuven, Herestraat 49, Leuven 3000, Belgium.
Data availability
All scripts used to simulate epidemics and perform the analyses presented in this article are available at https://github.com/mlayan/Sampling_bias, including examples of output files. Output files that are not in the GitHub repository are available upon reasonable request to the authors.
Supplementary data
Supplementary data are available at Virus Evolution online.
Funding
SD acknowledges the support from the Fonds National de la Recherche Scientifique (F.R.S.-FNRS, Belgium; Grant Number F.4515.22) and from the European Union Horizon 2020 project MOOD (Grant Agreement Number 874850). SD and GB acknowledge the support from the Research Foundation—Flanders (Fonds voor Wetenschappelijk Onderzoek—Vlaanderen, FWO, Belgium; Grant Number G098321N). GB also acknowledges the support from the Internal Funds KU Leuven (Grant Number C14/18/094) and the Research Foundation—Flanders (Fonds voor Wetenschappelijk Onderzoek—Vlaanderen, FWO, Belgium; G0E1420N). SC acknowledges the financial support from the Laboratoire d’Excellence Integrative Biology of Emerging Infectious Diseases program (Grant Number ANR-10-LABX-62-IBEID) and the INCEPTION project (Grant Number PIA/ANR-16-CONV-0005).
Conflict of interest:
None declared.
References
- Alteri C. et al. (2021) ‘Genomic Epidemiology of SARS-CoV-2 Reveals Multiple Lineages and Early Spread of SARS-CoV-2 Infections in Lombardy, Italy’, Nature Communications, 12: 434. [DOI] [PMC free article] [PubMed] [Google Scholar]
- Ayres D. L. et al. (2012) ‘BEAGLE: An Application Programming Interface and High-Performance Computing Library for Statistical Phylogenetics’, Systematic Biology, 61: 170–3. [DOI] [PMC free article] [PubMed] [Google Scholar]
- Beerli P. (2004) ‘Effect of Unsampled Populations on the Estimation of Population Sizes and Migration Rates between Sampled Populations’, Molecular Ecology, 13: 827–36. [DOI] [PubMed] [Google Scholar]
- Bouckaert R. et al. (2019) ‘BEAST 2.5: An Advanced Software Platform for Bayesian Evolutionary analysis.Pertea M, Editor’, PLoS Computational Biology, 15: e1006650. [DOI] [PMC free article] [PubMed] [Google Scholar]
- Bracher J. et al. (2021) ‘Evaluating Epidemic Forecasts in an Interval format.’, PLoS Computational Biology, 17: e1008618. [DOI] [PMC free article] [PubMed] [Google Scholar]
- Broban A. et al. (2018) ‘Bolstering Human Rabies Surveillance in Africa Is Crucial to Eliminating Canine-Mediated Rabies’, PLoS Neglected Tropical Diseases, 12: e0006367. [DOI] [PMC free article] [PubMed] [Google Scholar]
- Brynildsrud O. B. et al. (2018) ‘Global Expansion of Mycobacterium tuberculosis Lineage 4 Shaped by Colonial Migration and Local Adaptation’, Science Advances, 4: 5869–86. [DOI] [PMC free article] [PubMed] [Google Scholar]
- Buckee C., Noor A., and Sattenspiel L. (2021) ‘Thinking Clearly about Social Aspects of Infectious Disease Transmission’, Nature, 595: 205–13. [DOI] [PubMed] [Google Scholar]
- Butera Y. et al. (2021) ‘Genomic Sequencing of SARS-CoV-2 in Rwanda Reveals the Importance of Incoming Travelers on Lineage Diversity’, Nature Communications, 12: 5705. [DOI] [PMC free article] [PubMed] [Google Scholar]
- Candido D. S. et al. (2020) ‘Evolution and Epidemic Spread of SARS-CoV-2 in Brazil’, Science, 369: 1255–60. [DOI] [PMC free article] [PubMed] [Google Scholar]
- Chaillon A. et al. (2020) ‘HIV Persists Throughout Deep Tissues with Repopulation from Multiple Anatomical Sources’, Journal of Clinical Investigation, 130: 1699–712. [DOI] [PMC free article] [PubMed] [Google Scholar]
- Darkaoui S. et al. (2017) ‘A Century Spent Combating Rabies in Morocco (1911–2015): How Much Longer?’, Frontiers in Veterinary Science, 4: 1–16. [DOI] [PMC free article] [PubMed] [Google Scholar]
- Dellicour S. et al. (2017) ‘Using Viral Gene Sequences to Compare and Explain the Heterogeneous Spatial Dynamics of Virus Epidemics’, Molecular Biology and Evolution, 34: 2563–71. [DOI] [PubMed] [Google Scholar]
- Dellicour S. et al. (2020) ‘Epidemiological Hypothesis Testing Using a Phylogeographic and Phylodynamic Framework’, Nature Communications, 11: 5620. [DOI] [PMC free article] [PubMed] [Google Scholar]
- Dellicour S. et al. (2021a) ‘A Phylodynamic Workflow to Rapidly Gain Insights into the Dispersal History and Dynamics of SARS-CoV-2 Lineages’, Molecular Biology and Evolution, 38: 1608–13. [DOI] [PMC free article] [PubMed] [Google Scholar]
- Dellicour S. et al. (2021b) ‘Dispersal Dynamics of SARS-CoV-2 Lineages during the First Epidemic Wave in New York City’, PLoS Pathogens, 17: e1009571. [DOI] [PMC free article] [PubMed] [Google Scholar]
- De Maio N. et al. (2015) ‘New Routes to Phylogeography: A Bayesian Structured Coalescent Approximation’, PLoS Genetics, 11: e1005421. [DOI] [PMC free article] [PubMed] [Google Scholar]
- Drummond A. J. et al. (2006) ‘Relaxed Phylogenetics and Dating with Confidence’, PLoS Biology, 4: 699–710. [DOI] [PMC free article] [PubMed] [Google Scholar]
- Dudas G. et al. (2017) ‘Virus Genomes Reveal Factors that Spread and Sustained the Ebola Epidemic’, Nature, 544: 309–15. [DOI] [PMC free article] [PubMed] [Google Scholar]
- Dudas G. et al. (2018) ‘MERS-CoV Spillover at the Camel-human Interface’, eLife, 7: 1–22. [DOI] [PMC free article] [PubMed] [Google Scholar]
- Eddelbuettel D., and Balamuta J. J. (2018) ‘Extending R with C++: A Brief Introduction to Rcpp’, The American Statistician, 72: 28–36. [Google Scholar]
- Ewing G., and Rodrigo A. (2006) ‘Estimating Population Parameters Using the Structured Serial Coalescent with Bayesian MCMC Inference When Some Demes Are Hidden’, Evolutionary Bioinformatics, 2: 227–35. [PMC free article] [PubMed] [Google Scholar]
- Faria N. R. et al. (2017) ‘Establishment and Cryptic Transmission of Zika Virus in Brazil and the Americas’, Nature, 546: 406–10. [DOI] [PMC free article] [PubMed] [Google Scholar]
- Faria N. R. et al. (2019) ‘Distinct Rates and Patterns of Spread of the Major HIV-1 Subtypes in Central and East Africa’, PLoS Pathogens, 15: e1007976. [DOI] [PMC free article] [PubMed] [Google Scholar]
- Frost S. D. W. et al. (2015) ‘Eight Challenges in Phylodynamic Inference’, Epidemics, 10: 88–92. [DOI] [PMC free article] [PubMed] [Google Scholar]
- Gill M. S. et al. (2013) ‘Improving Bayesian Population Dynamics Inference: A Coalescent-Based Model for Multiple Loci’, Molecular Biology and Evolution, 30: 713–24. [DOI] [PMC free article] [PubMed] [Google Scholar]
- Gill M. S. et al. (2016) ‘Understanding past Population Dynamics: Bayesian Coalescent-Based Modeling with Covariates’, Systematic Biology, 65: 1041–56. [DOI] [PMC free article] [PubMed] [Google Scholar]
- Golding N., Schofield A., and Kraemer M. U. G. (2015) ‘Movement: Functions for the Analysis of Movement Data in Disease Modelling and Mapping’, R Package Version 02 <https://github.com/SEEG-Oxford/movement> accessed 21 Dec 2022. [Google Scholar]
- Grubaugh N. D. et al. (2019) ‘Travel Surveillance and Genomics Uncover a Hidden Zika Outbreak during the Waning Epidemic’, Cell, 178: 1057–71. [DOI] [PMC free article] [PubMed] [Google Scholar]
- Guindon S., and De Maio N. (2021) ‘Accounting for Spatial Sampling Patterns in Bayesian Phylogeography’, Proceedings of the National Academy of Sciences, 118: e2105273118. [DOI] [PMC free article] [PubMed] [Google Scholar]
- Hampson K. et al. (2009) ‘Transmission Dynamics and Prospects for the Elimination of Canine Rabies’, PLoS Biology, 7: e1000053. [DOI] [PMC free article] [PubMed] [Google Scholar]
- Hasegawa M., Kishino H., and Yano T. (1985) ‘Dating of the Human-Ape Splitting by a Molecular Clock of Mitochondrial DNA’, Journal of Molecular Evolution, 22: 160–74. [DOI] [PubMed] [Google Scholar]
- He W.-T. et al. (2022) ‘Phylogeography Reveals Association between Swine Trade and the Spread of Porcine Epidemic Diarrhea Virus in China and across the World’, Molecular Biology and Evolution, 39: msab364. [DOI] [PMC free article] [PubMed] [Google Scholar]
- Hodcroft E. B. et al. (2021) ‘Want to Track Pandemic Variants Faster? Fix the Bioinformatics Bottleneck’, Nature, 591: 30–3. [DOI] [PubMed] [Google Scholar]
- Hong S. L. et al. (2021) ‘Bayesian Phylogeographic Analysis Incorporating Predictors and Individual Travel Histories in BEAST’, Current Protocols, 1: 1–16. [DOI] [PMC free article] [PubMed] [Google Scholar]
- Kaleta T. et al. (2022) ‘Antibody Escape and Global Spread of SARS-CoV-2 Lineage A.27’, Nature Communications, 13: 1152. [DOI] [PMC free article] [PubMed] [Google Scholar]
- Kalkauskas A. et al. (2021) ‘Sampling Bias and Model Choice in Continuous Phylogeography: Getting Lost on a Random walk’, PLOS Computational Biology, 17: e1008561. [DOI] [PMC free article] [PubMed] [Google Scholar]
- Lemey P. et al. (2020) ‘Accommodating Individual Travel History and Unsampled Diversity in Bayesian Phylogeographic Inference of SARS-CoV-2’, Nature Communications, 11: 5110. [DOI] [PMC free article] [PubMed] [Google Scholar]
- Lemey P. et al. (2014) ‘Unifying Viral Genetics and Human Transportation Data to Predict the Global Transmission Dynamics of Human Influenza H3N2’, PLoS Pathogens, 10: e1003932. [DOI] [PMC free article] [PubMed] [Google Scholar]
- Lemey P. et al. (2009) ‘Bayesian Phylogeography Finds Its Roots’, PLoS Computational Biology, 5: e1000520. [DOI] [PMC free article] [PubMed] [Google Scholar]
- Liu P. et al. (2022) ‘The Impact of Sampling Bias on Viral Phylogeographic Reconstruction’, PLoS Global Public Health, 2: e0000577. [DOI] [PMC free article] [PubMed] [Google Scholar]
- Lu L. et al. (2021) ‘Adaptation, Spread and Transmission of SARS-CoV-2 in Farmed Minks and Associated Humans in the Netherlands’, Nature Communications, 12: 6802. [DOI] [PMC free article] [PubMed] [Google Scholar]
- Magee D., and Scotch M. (2018) ‘The Effects of Random Taxa Sampling Schemes in Bayesian Virus Phylogeography’, Infection, Genetics and Evolution, 64: 225–30. [DOI] [PMC free article] [PubMed] [Google Scholar]
- Marston D. A. et al. (2013) ‘Next Generation Sequencing of Viral RNA Genomes’, BMC Genomics, 14: 444. [DOI] [PMC free article] [PubMed] [Google Scholar]
- Mathieu E. et al. (2020) Coronavirus Pandemic (COVID-19). OurWorldInData.org <https://ourworldindata.org/coronavirus>.
- Mavian C. et al. (2020) ‘Toxigenic Vibrio Cholerae Evolution and Establishment of Reservoirs in Aquatic Ecosystems’, Proceedings of the National Academy of Sciences, 117: 7897–904. [DOI] [PMC free article] [PubMed] [Google Scholar]
- Morel B. et al. (2021) ‘Phylogenetic Analysis of SARS-CoV-2 Data Is Difficult’, Molecular Biology and Evolution, 38: 1777–91. [DOI] [PMC free article] [PubMed] [Google Scholar]
- Morters M. K. et al. (2013) ‘Evidence‐Based Control of Canine Rabies: A Critical Review of Population Density Reduction’, Journal of Animal Ecology, 82: 6–14. [DOI] [PMC free article] [PubMed] [Google Scholar]
- Müller N. F. et al. (2021) ‘Viral Genomes Reveal Patterns of the SARS-CoV-2 Outbreak in Washington State’, Science Translational Medicine, 13: 202. [DOI] [PMC free article] [PubMed] [Google Scholar]
- Müller N. F., Dudas G., and Stadler T. (2019) ‘Inferring Time-Dependent Migration and Coalescence Patterns from Genetic Sequence and Predictor Data in Structured Populations’, Virus Evolution, 5: 1–10. [DOI] [PMC free article] [PubMed] [Google Scholar]
- Müller N. F., Rasmussen D. A., and Stadler T. (2017) ‘The Structured Coalescent and Its Approximations’, Molecular Biology and Evolution, 34: 2970–81. [DOI] [PMC free article] [PubMed] [Google Scholar]
- Müller N. F., Rasmussen D., and Stadler T. (2018) ‘MASCOT: Parameter and State Inference under the Marginal Structured Coalescent Approximation’, Bioinformatics, 34: 3843–8. [DOI] [PMC free article] [PubMed] [Google Scholar]
- Perez L. J. et al. (2022) ‘The Early SARS-CoV-2 Epidemic in Senegal Was Driven by the Local Emergence of B.1.416 and the Introduction of B.1.1.420 from Europe’, Virus Evolution, 8: 1–12. [DOI] [PMC free article] [PubMed] [Google Scholar]
- Pipes L. et al. (2021) ‘Assessing Uncertainty in the Rooting of the SARS-CoV-2 Phylogeny’, Molecular Biology and Evolution, 38: 1537–43. [DOI] [PMC free article] [PubMed] [Google Scholar]
- Rambaut A. et al. (2018) ‘Posterior Summarization in Bayesian Phylogenetics Using Tracer 1.7’, Systematic Biology, 67: 901–4. [DOI] [PMC free article] [PubMed] [Google Scholar]
- Richardson E. J. et al. (2018) ‘Gene Exchange Drives the Ecological Success of a Multi-host Bacterial Pathogen’, Nature Ecology & Evolution, 2: 1468–78. [DOI] [PMC free article] [PubMed] [Google Scholar]
- Saito M. et al. (2013) ‘Genetic Diversity and Geographic Distribution of Genetically Distinct Rabies Viruses in the Philippines’, PLoS Neglected Tropical Diseases, 7: e2144. [DOI] [PMC free article] [PubMed] [Google Scholar]
- Simini F. et al. (2012) ‘A Universal Model for Mobility and Migration Patterns’, Nature, 484: 96–100. [DOI] [PubMed] [Google Scholar]
- Suchard M. A. et al. (2018) ‘Bayesian Phylogenetic and Phylodynamic Data Integration Using BEAST 1.10’, Virus Evolution, 4: 1–5. [DOI] [PMC free article] [PubMed] [Google Scholar]
- Sukumaran J., and Holder M. T. (2010) ‘DendroPy: A Python Library for Phylogenetic Computing’, Bioinformatics, 26: 1569–71. [DOI] [PubMed] [Google Scholar]
- Talbi C. et al. (2010) ‘Phylodynamics and Human-Mediated Dispersal of a Zoonotic Virus.Emerman M, Editor’, PLoS Pathogens, 6: e1001166. [DOI] [PMC free article] [PubMed] [Google Scholar]
- Taylor L. H. et al. (2017) ‘Difficulties in Estimating the Human Burden of Canine Rabies’, Acta Tropica, 165: 133–40. [DOI] [PMC free article] [PubMed] [Google Scholar]
- Tohma K. et al. (2014) ‘Phylogeographic Analysis of Rabies Viruses in the Philippines’, Infection, Genetics and Evolution, 23: 86–94. [DOI] [PubMed] [Google Scholar]
- Tohma K. et al. (2016) ‘Molecular and Mathematical Modeling Analyses of Inter-Island Transmission of Rabies into a Previously Rabies-Free Island in the Philippines’, Infection, Genetics and Evolution, 38: 22–8. [DOI] [PubMed] [Google Scholar]
- Townsend S. E. et al. (2013) ‘Designing Programs for Eliminating Canine Rabies from Islands: Bali, Indonesia as a Case Study’, PLoS Neglected Tropical Diseases, 7: e2372. [DOI] [PMC free article] [PubMed] [Google Scholar]
- Vaughan T. G. et al. (2014) ‘Efficient Bayesian Inference under the Structured Coalescent’, Bioinformatics, 30: 2272–9. [DOI] [PMC free article] [PubMed] [Google Scholar]
- Vrancken B. et al. (2020) ‘Comparative Circulation Dynamics of the Five Main HIV Types in China’, Journal of Virology, 94: 683–703. [DOI] [PMC free article] [PubMed] [Google Scholar]
- Wickham H. (2016) Ggplot2: Elegant Graphics for Data Analysis (Springer, New York; ) <https://ggplot2.tidyverse.org> accessed 21 Dec 2022. [Google Scholar]
- World Health Organization (WHO) (2018) WHO Expert Consultation on Rabies, Third Report. Geneva: WHO. <https://apps.who.int/iris/handle/10665/272364>. [Google Scholar]
- ——— (2023) Covid-19 Cases and Deaths by Continent <https://portal.who.int/report/eios-covid19-counts/#display=Continents&nrow=2&ncol=3&arr=row&pg=1&labels=view_countries&sort=cur_case_who;desc&filter=&sidebar=−1&fv=> accessed 21 Dec 2022.
- WorldPop (2022) WorldPop Project <http://worldpop.org.uk/> accessed 21 Dec 2022.
- Yang J. et al. (2019) ‘Bayesian Phylodynamics of Avian Influenza A Virus H9N2 in Asia with Time-dependent Predictors of migration’, PLoS Computational Biology, 15: e1007189. [DOI] [PMC free article] [PubMed] [Google Scholar]
- Yang Z. (1994) ‘Maximum Likelihood Phylogenetic Estimation from DNA Sequences with Variable Rates Over Sites: Approximate Methods’, Journal of Molecular Evolution, 39: 306–14. [DOI] [PubMed] [Google Scholar]
Associated Data
This section collects any data citations, data availability statements, or supplementary materials included in this article.
Supplementary Materials
Data Availability Statement
All scripts used to simulate epidemics and perform the analyses presented in this article are available at https://github.com/mlayan/Sampling_bias, including examples of output files. Output files that are not in the GitHub repository are available upon reasonable request to the authors.