

Abstract
Small cell lung cancer (SCLC) is notorious for its early and frequent metastases, which contribute to it as a recalcitrant malignancy. To understand the molecular mechanisms underlying SCLC metastasis, we generated SCLC mouse models with orthotopically transplanted genome-edited lung organoids and performed multiomics analyses. We found that a deficiency of KMT2C, a histone H3 lysine 4 methyltransferase frequently mutated in extensive-stage SCLC, promoted multiple-organ metastases in mice. Metastatic and KMT2C-deficient SCLC displayed both histone and DNA hypomethylation. Mechanistically, KMT2C directly regulated the expression of DNMT3A, a de novo DNA methyltransferase, through histone methylation. Forced DNMT3A expression restrained metastasis of KMT2C-deficient SCLC through repressing metastasis-promoting MEIS/HOX genes. Further, S-(5′-adenosyl)-l-methionine, the common cofactor of histone and DNA methyltransferases, inhibited SCLC metastasis. Thus, our study revealed a concerted epigenetic reprogramming of KMT2C- and DNMT3A-mediated histone and DNA hypomethylation underlying SCLC metastasis, which suggested a potential epigenetic therapeutic vulnerability.
Metastasis is a hallmark of cancer and the leading cause of cancer-related death. It has been proposed that only a small portion of primary tumor cells can complete a series of steps for metastasis1. Once tumor cells become metastatic, they can keep this capacity stable, which suggests that cell-intrinsic alterations, including genetic and epigenetic dysregulation, might underlie the transition. However, there is mounting evidence showing that there are few metastasis-specific mutations compared to corresponding primary tumors2–4. Paradoxically, metastatic tumor cells display distinct gene signatures5,6. The most parsimonious explanation might be that tumor cells gain epigenetic ‘drivers’ during metastatic progress, which reprogram the genome for the expression regulation of metastasis-associated genes4,7. However, these putative epigenetic metastasis drivers remain elusive.
Small cell lung cancer (SCLC), a lethal lung malignancy with distinct neuroendocrine (NE)-like features, is exceptional8,9. Arguably, SCLC is the most metastatic human cancer, and more than 70% of individuals with SCLC have metastases at diagnosis8. The early and massive metastasis together with invariable chemotherapy treatment relapse makes SCLC a recalcitrant malignancy with a median survival of just 7 months10. It has been reported that neuronal lineage marker genes ASCL1 and NEUROD1 are required for metastasis of some SCLCs11,12. A breakthrough in the study of SCLC metastasis was discovering that amplification and/or overexpression of NFIB, a transcription factor, promoted SCLC metastasis in mice13,14. NFIB creates global chromatin accessibility and promotes the expression of metastasis-promoting neuronal genes. However, following studies showed that NFIB is only upregulated in some SCLC metastases, and there must be NFIB-independent mechanisms for other SCLC metastases, which needs further study15.
The early and massive metastases make surgery unfavorable for individuals with SCLC, which leads to limited clinical samples for research and enhances the importance of animal models recapitulating these pathological features16,17. Here, we report organoid-mediated, primary, orthotopic and driver-defined SCLC mouse models, which faithfully represent the early and massive metastases observed in individuals with SCLC. Through multiomics assays and functional studies of this model, we uncovered a KMT2C-loss-initiated epigenetic reprogramming involving both histone and DNA hypomethylation underlying SCLC metastasis, which suggests a potentially targetable susceptibility of this malignancy.
Results
Primary SCLC models with genome-edited lung organoids.
To mimic the pathology of human SCLC, especially its massive distal metastases, we created a strategy to generate primary, orthotopic and driver-defined SCLC in mice with genome-edited lung organoids (Fig. 1a). Briefly, organoids were cultured from lung tissues of adult C57B/L6 mice, with Cas9 and single guide RNAs (sgRNAs) introduced to disrupt genes associated with human SCLC (Extended Data Fig. 1a,b). Once orthotopically transplanted into the lungs of congenic recipients, the sgTrp53; sgRb1; Myc; Cas9 (PRM) lung organoids formed a lesion in the lung, which was monitored by luciferase live imaging and micro-computed tomography (micro-CT; Fig. 1b,c). Biopsy showed a single lesion with specific green fluorescent protein (GFP) expression, which indicated that the tumor was derived from the transplanted organoids, at the injection site (Fig. 1d). These single primary tumors, which are in contrast to the numerous lesions in the traditional genetically engineered mouse lung cancer models, precisely recapitulate human disease, which generally develops from a single or limited number of primary lesions. The lesions were mostly composed of tumor cells with small size, scant cytoplasm, granular nuclear chromatin and frequent mitosis, suggesting that these tumors were SCLC (Fig. 1e). These tumor cells were positive for TTF1 and multiple SCLC diagnostic markers, such as ASCL1, SYP, and CHGA, and KI67 (Fig. 1f,g and Extended Data Fig. 1c). However, they were NEUROD1 negative, suggesting that PRM tumors were the classic ASCL1+ NE SCLC18.
Fig. 1 |. Generating primary and orthotopic SCLC with metastases with genome-edited lung organoids in mice.
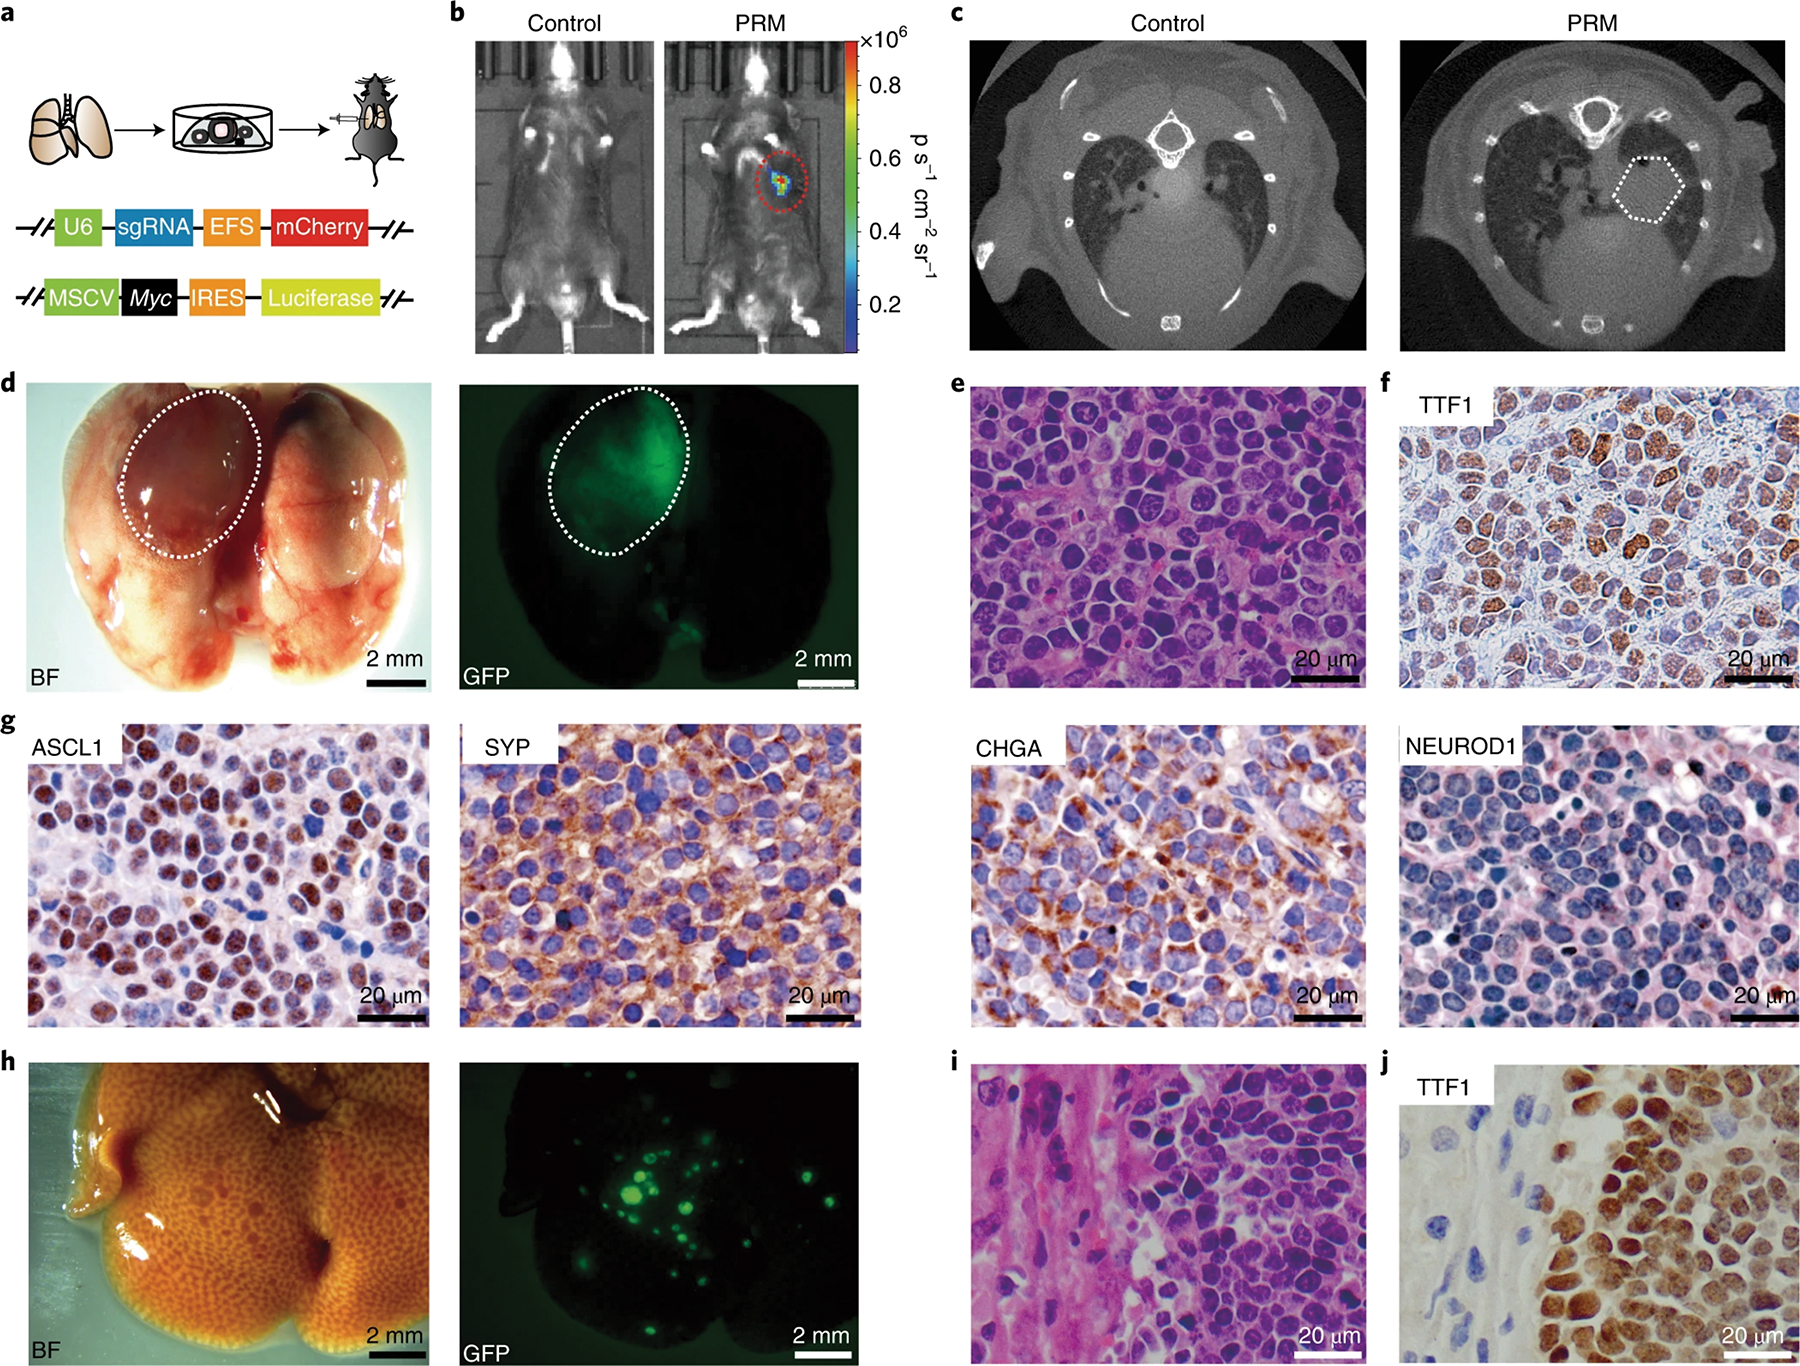
a, Top, schematic of the organoid-based strategy for generating primary and orthotopic SCLC in immunocompetent mice. Bottom, schematic of the constructs for expressing sgRNAs and Myc; MSCV, murine stem cell virus; IReS, internal ribosome entry site. b, Representative bioluminescent images of mice transplanted with PRM organoids at 3 months after transplantation. c, Representative micro-CT images of PRM-recipient mice. d, Left, representative brightfield (BF) image of the lungs of a PRM recipient. The lesion on the left lung is indicated, and a representative fluorescent image of the lungs of the PRM recipient is shown on the right; (n = 4 mice). e, Representative hematoxylin and eosin (H&e) staining of a lung section from a PRM mouse (n = 4 mice). f, Representative staining of TTF1 in a lung section from a PRM mouse (n = 4 mice). g, Representative IHC staining of ASCL1, SYP, CHGA and NeUROD1 in lung sections of PRM mice (n = 4 mice). h, Representative brightfield (left) and fluorescent (right) images showing metastatic lesions in the liver of a PRM mouse (n = 4 mice). i, Representative H&e staining of the liver (n = 4 mice). j, Representative TTF1 staining of the liver (n = 4 mice).
Massive distal metastasis is a key feature of human SCLC, which significantly affects clinical treatments of this disease8. In all mice with PRM tumors, numerous metastatic lesions were observed in the liver and lymph nodes, the most common sites of SCLC metastasis in humans (Fig. 1h and Extended Data Fig. 1d). Histological analysis revealed SCLC features of metastatic lesions (Fig. 1i,j and Extended Data Fig. 1e,f). Immunohistochemical (IHC) staining showed that metastatic tumors in both liver and lymph nodes were positive for diagnostic markers, indicating that these metastases maintained the pathology of primary tumors as classic NE type of SCLC (Extended Data Fig. 1g,h).
Single-cell RNA sequencing (scRNA-seq) reveals metastasis trajectory.
Given previous reports suggesting a role of global chromatin accessibility in SCLC metastasis13,14, we performed assay for transposase accessible chromatin with high-throughput sequencing (ATAC-seq) of SCLC cells from the primary lesion and liver metastases in the same mice. The results showed that chromatin openness is reduced in metastatic tumor cells, which suggests that there may a distinct mechanism underlying SCLC metastasis (Extended Data Fig. 2a–c and Supplementary Table 1).
To explore the molecular reprogramming underlying metastasis, scRNA-seq was used to assess the primary tumor and metastasis sites (liver) of the same mouse. The cell populations were recognized by expression of conventional marker genes (Fig. 2a, Extended Data Fig. 2d and Supplementary Table 2). While some tumor cells from the lung overlapped with those from the liver, some were specific to the primary tumor, which suggested that not all primary tumor cells had the same metastatic capacity (Fig. 2b). While many SCLC markers, such as Chga, Ddc and Ncam1, were ubiquitously expressed, Ascl1 was highly expressed in all metastatic cells and in a subset of primary-specific populations, and, by contrast, Neurod1 was mostly expressed in primary-specific SCLC cells (Fig. 2c and Extended Data Fig. 2e). Indeed, Neurod1+ SCLC cells were completely absent in metastatic cells (Extended Data Fig. 2f), which suggested that Ascl1+ primary cells might be more metastatic and the cell of origin of multiple metastases.
Fig. 2 |. A metastasis trajectory of SCLC revealed by single-cell transcriptome analyses.

a, Open t-distributed stochastic neighbor embedding (openTSNe) map of scRNA-seq analyses of SCLC from the lung and liver of the same PRM mouse; 7,925 cells and 3,513 cells were captured from the primary site and metastatic lesion (liver) of the same mouse, respectively. b, OpenTSNe plot showing the organ origins from PRM (lung) and PRM metastasis (PRM-Met; liver). c, OpenTSNe map showing expression levels of Ascl1 and Neurod1 in primary SCLC cells and metastatic SCLC cells. d, URD map showing the metastasis trajectory of Ascl1+ SCLC cells. e, URD map showing the CCLE metastasis score projected on the metastasis trajectory. f, Dynamically expressed gene modules on the metastasis trajectory. g, Alluvial plot showing the composition variation of three molecular subtypes defined by the dynamically expressed gene modules in limited-stage (LS) and extensive-stage (eS) SCLC in the Simpson cohort.
To reveal the potential cellular and molecular transitions during metastasis, a metastasis trajectory was constructed based on the URD map for Ascl1+ SCLC cells (Fig. 2d). The trajectory started from the primary tumor-specific cells to metastatic cells. Along the trajectory, the metastatic score, derived from the gene expression signatures of individuals with SCLC with metastases compared to those without metastases, was progressively increased, suggesting that the metastasis trajectory in mice might reflect a metastasis route in humans (Fig. 2e and Supplementary Table 3)19. A similar pattern was also observed in a metastatic score derived from circulating tumor cell (CTC)-derived xenografts (CDXs) of individuals with SCLC (Extended Data Fig. 2g and Supplementary Table 4)20. Gene signatures of Ascl1+ SCLC from the metastatic population were associated with inferior outcomes in individuals with SCLC (Extended Data Fig. 2h and Supplementary Table 5). Dynamically expressed genes along the metastasis trajectory were identified and divided into three modules named modules 1–3, which represented the signatures for SCLC at different stages along the trajectory (Fig. 2f, Extended Data Fig. 2i and Supplementary Tables 6 and 7). Significantly more individuals with SCLC with limited disease expressed module 1 genes than those with extensive disease, while, by contrast, significantly more individuals with extensive disease expressed module 3 genes (Fig. 2g and Supplementary Table 8). Individuals with SCLC with high expression of module 1 genes had a better prognosis than those with lower expression (Extended Data Fig. 2j). These data suggest that our metastasis trajectory represents the molecular properties of SCLC metastasis in humans.
KMT2C deficiency is associated with SCLC metastasis.
Given the global chromosome remodeling and gene regulation along the metastasis trajectory of SCLC (Extended Data Fig. 2a–c), we reasoned that some epigenetic regulatory genes might play significant roles during the process. Among the primary-specific module 1 genes were nine epigenetic regulatory genes, and all of them were frequently mutated in human SCLC; KMT2C (10%) was the top one, followed by NCOR2, DNMT3A and KDM5B (Extended Data Fig. 3a and Supplementary Table 9). Gene set enrichment analysis showed that multiple histone and DNA methylation pathways were significantly negatively enriched in metastatic SCLC cells (Extended Data Fig. 3b and Supplementary Table 10). In The Cancer Genome Atlas (TCGA) cohorts, KMT2C mutations were detected in 7% of primary SCLC samples but were detected in 27% of metastatic samples, and, consistently, 17% of the Cancer Cell Line Encyclopedia (CCLE) SCLC cell lines derived from metastases contained mutations in KMT2C, while none derived from primary tumors had KMT2C mutations (Fig. 3a)19,21. Further, expression levels of Kmt2c in metastatic cells were significantly lower than those in primary cells in both mice and humans (Fig. 3b). ATAC-seq showed that the Kmt2c locus was closed in metastatic cells, which is associated with reduced expression levels, compared to in primary tumors (Fig. 3c and Supplementary Table 1). Expression levels of KMT2C were significantly negatively correlated with the metastatic gene signature in SCLC (Fig. 3d), and low KMT2C expression was associated with poor prognosis in individuals with SCLC (Extended Data Fig. 3c).
Fig. 3 |. KMT2C deficiency is associated with SCLC metastasis and gives rise to a premalignant population in lung organoids.
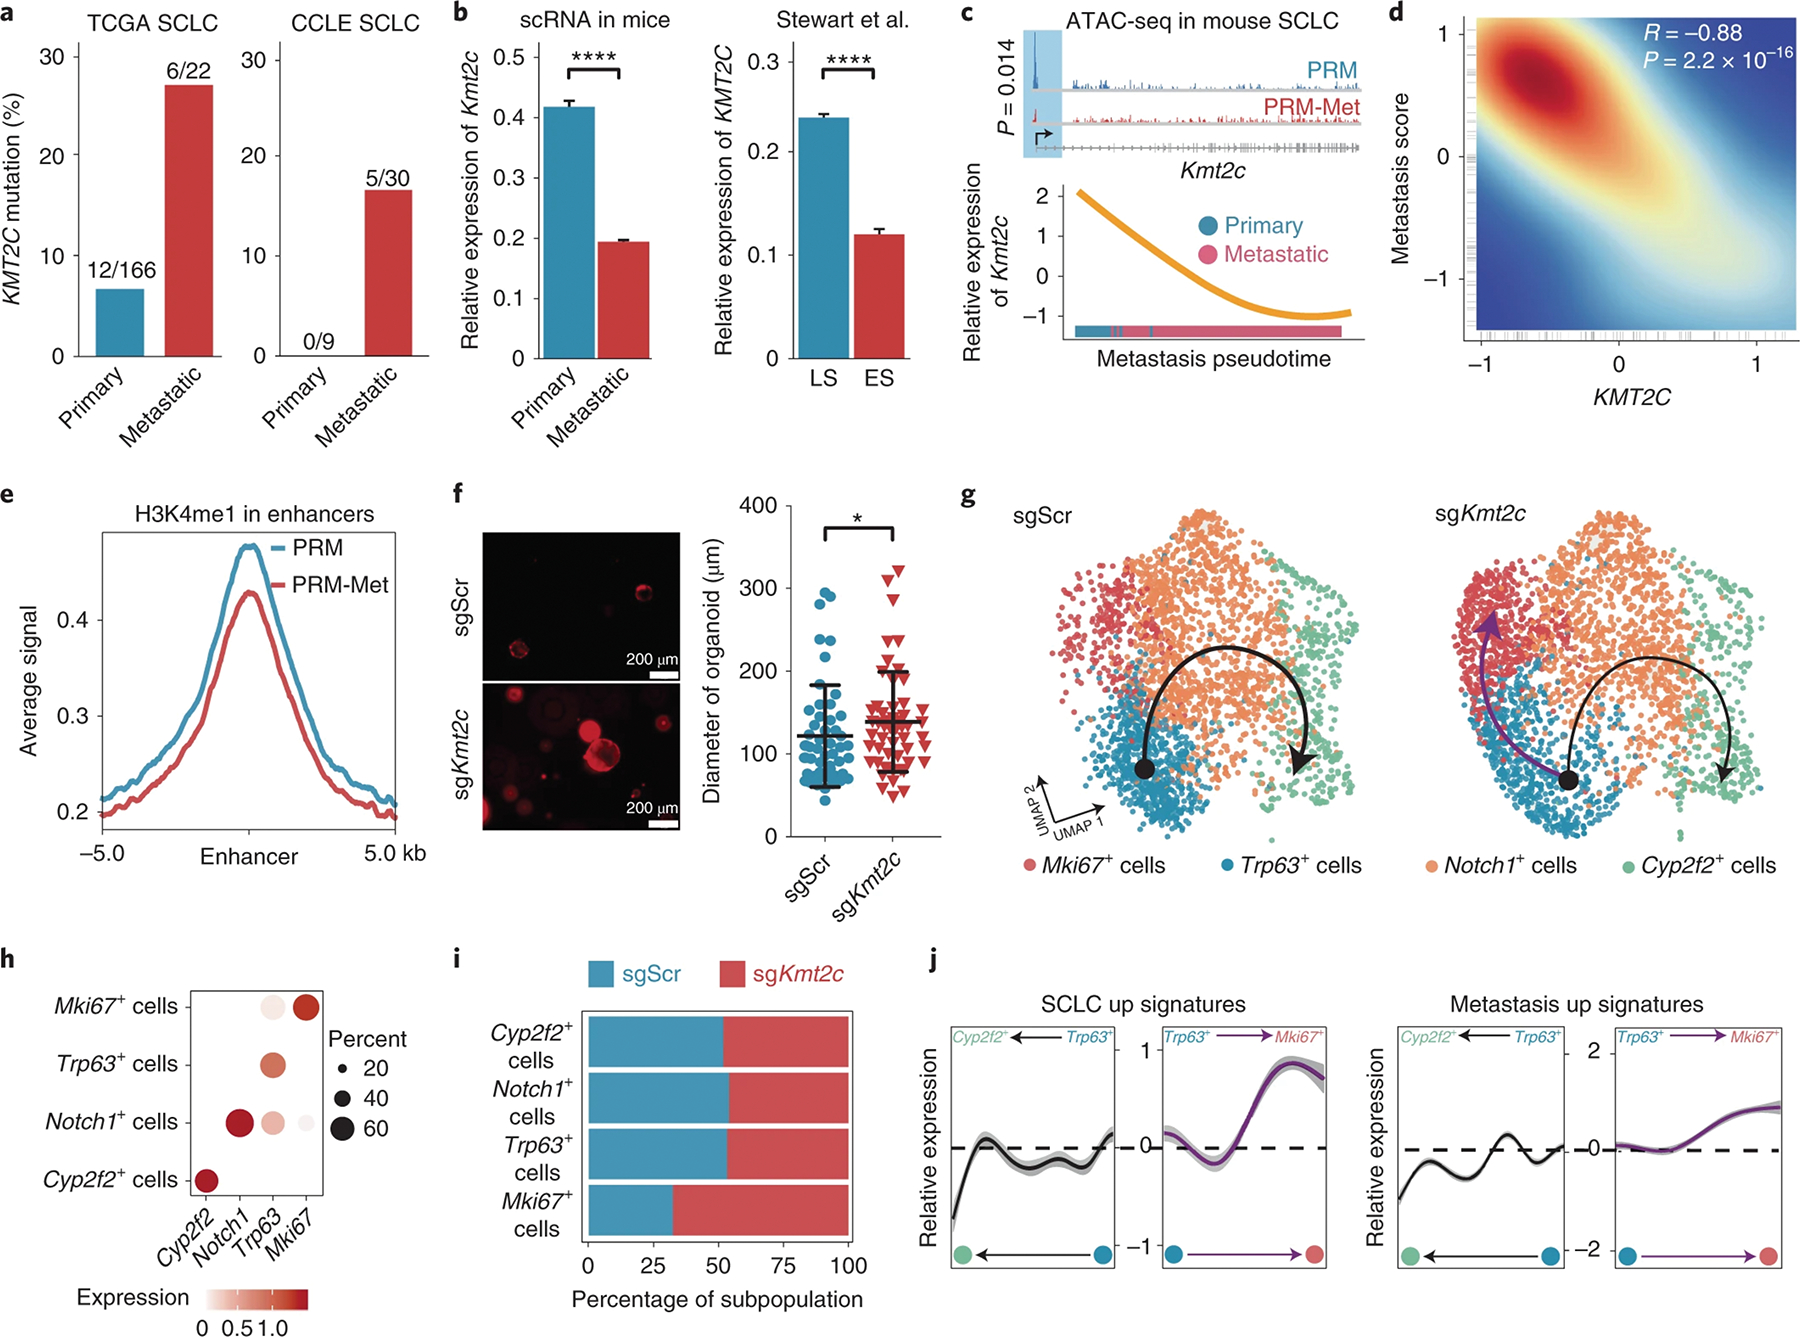
a, Bar graph showing the mutation frequencies of KMT2C in primary and metastatic SCLC from TCGA (left) and CCLE cohorts (right). b, Bar graph showing the relative expression levels of Kmt2c in mouse primary and metastatic (left) and human LS and eS (right) SCLC cells20. Data are shown as mean ± s.e.; n = 2,365, primary; n = 13,798, metastatic; n = 10,000, LS SCLC; n = 2,000, eS SCLC. Significance was assessed by Wilcoxon signed-rank test. c, Top, Integrative Genomics Viewer (IGV) plot showing the distributions of ATAC-seq peaks in the Kmt2c locus in PRM and PRM-Met SCLC cells. Bottom, dynamics of relative expression levels of Kmt2c on metastasis trajectory. d, Scatter plot showing the correlation between the relative expression levels of KMT2C and the SCLC metastasis score in individuals with SCLC. e, Levels of H3K4me1 bound at enhancers in PRM and PRM-Met tumor cells, as measured by CUT&Tag analyses; kb, kilobases. f, Left, representative fluorescence images of sgScr and sgKmt2c lung organoid growth. Right, diameters of the lung organoids with sgScr or sgKmt2c. Data are shown as mean ± s.d.; n = 50, sgScr; n = 52, sgKmt2c. Significance was assessed by two-sided Student’s t-test. g, Uniform manifold approximation and projection (UMAP) plots showing populations and trajectories in the lung organoids with sgScr or sgKmt2c. The 2,794 cells and 2,794 cells were captured from the sgScr sample (n = 1) and sgKmt2c sample (n = 1), respectively. h, Dot plot showing the marker genes of each population. i, Stacked graph showing the percentages of cell populations in sgScr and sgKmt2c organoids. j, The dynamic expression levels of SCLC up (left) and metastasis up (right) gene signatures on the development (black line) and malignant differentiation (purple line) trajectories are shown; *P < 0.05, ****P < 0.0001.
KMT2C encodes a histone 3 lysine 4 (H3K4) mono- and dimethyltransferase. Western blotting showed that both H3K4me1 and H3K4me2 levels were reduced in metastatic SCLC cells (Extended Data Fig. 3d). Consistently, IHC staining confirmed the downregulation of KMT2C expression and the reduced levels of H3K4me1 and H3K4me2 in metastases compared to in primary tumors (Extended Data Fig. 3e). Further, cleavage under targets and tagmentation (CUT&Tag) analyses demonstrated that the global H3K4me1 level of the enhancer regions in the metastatic tumor cells was reduced compared to that observed in primary SCLC cells, which was consistent with the global decrease of chromosome accessibility (Fig. 3e, Extended Data Figs. 2a–c and 3f,g and Supplementary Table 11). Thus, these data suggest that KMT2C deficiency and its related epigenetic reprogramming are associated with SCLC metastasis.
KMT2C loss gives rise to a premalignant population ex vivo.
To investigate the potential functions of KMT2C in SCLC, we transduced sgRNAs targeting Kmt2c into lung organoids with Cas9. Kmt2c disruption was confirmed by T7 endonuclease (T7E) assay (Extended Data Fig. 3h). KMT2C loss significantly promoted the growth of lung organoids (Fig. 3f). In control scramble (sgScr) lung organoids, there were three types of epithelial cells, including Trp63+ stem cells, Notch1+ progenitor cells and Cyp2f2+ differentiated cells (Fig. 3g,h and Supplementary Table 12). A differentiation trajectory could be drawn from the Trp63+ stem cells to the Notch1+ progenitor cells and ended at the Cyp2f2+ differentiated cells. However, in KMT2C-deficient lung organoids, the differentiation trajectory was diminished, while the trajectory to the Mki67+ population was enhanced (Fig. 3g–i). Along the differentiation trajectory, differentiation markers, such as Notch1 and Cyp2f2, were upregulated (Extended Data Fig. 3i). Instead, the expression of SCLC signature genes from humans progressively increased along the MKI67 trajectory and decreased along the differentiation trajectory (Extended Data Fig. 3i and Supplementary Table 13). The SCLC and metastasis signatures from individuals with SCLC were progressively upregulated along the MKI67 trajectory and downregulated along the differentiation trajectory (Fig. 3j). These analyses suggest that KMT2C loss by itself would lead to a prometastatic status in lung organoids.
KMT2C restrains SCLC tumorigenesis and metastasis in mice.
To test the potential roles of KMT2C in SCLC in vivo, Kmt2c was repressed by either short hairpin RNA (shRNA) or CRISPR/Cas9, as we reported previously22, together with Trp53 and Rb1 sgRNAs and Myc overexpression in primary lung organoids (PRMK). PRMK organoids with either shKmt2c or sgKmt2c displayed significantly increased size and number compared to PRM organoids (Fig. 4a,b). PRM and PRMK premalignant organoids were transplanted into the left lungs of C57B/L6 mice. Luciferase live imaging revealed that there was significantly stronger luciferase signaling in the chests of recipient mice with either shKmt2c or sgKmt2c organoids than in the chests of control PRM mice (Fig. 4c,d). All sgKmt2c organoid recipient mice died of SCLC with a significantly shorter latency (69 d) than control PRM recipients (126 d). Similarly, all recipients of shKmt2c organoids developed SCLC and had significantly shorter latency (93 d; Fig. 4e). All KMT2C-deficient tumors resembled the pathology of human SCLC, with strong staining of TTF1 (Extended Data Fig. 4a). PRMK tumors were also positive for ASCL1, CHGA and SYP but negative for NEUROD1, indicating that they are of the classic NE type of SCLC (Extended Data Fig. 4b). These data demonstrate that Kmt2c is a bona fide tumor suppressor in SCLC.
Fig. 4 |. KMT2C deficiency promotes tumorigenesis and metastasis of SCLC.

a, Diameter quantification of premalignant PRM (n = 69), PRMK-shRNA (n = 64) and PRMK-sgRNA (n = 115) lung organoids. Data are shown as mean ± s.d. Significance was calculated by two-sided Student’s t-test. b, Number of premalignant PRM (n = 8), PRMK-shRNA (n = 6) and PRMK-sgRNA (n = 9) lung organoids. Data are shown as mean ± s.d. Significance was calculated by two-sided Student’s t-test. c, Representative bioluminescent images of mice transplanted with PRM, PRMK-shRNA or PRMK-sgRNA organoids at 3 months after transplantation. d, Luciferase fluorescence signal intensity of PRM (n = 6), PRMK-shRNA (n = 3) and PRMK-sgRNA (n = 5) mice. Data are shown as mean ± s.e.m. Significance was calculated by two-sided Student’s t-test. e, Kaplan–Meier survival curves of mice transplanted with PRM (n = 8), PRMK-shRNA (n = 7) and PRMK-sgRNA (n = 9) organoids. All curves were analyzed by log-rank test. f, Representative brightfield and fluorescence images of the lungs (top) and livers (bottom) of PRM, PRMK-shRNA and PRMK-sgRNA mice. g, Representative images of H&e staining of the livers of PRM (n = 4) and PRMK (n = 4) mice. h, Statistical graphs showing the lesion diameters (left) and number of metastases (right) in the livers of PRM and PRMK mice. Data are shown as mean ± s.d.; left: n = 66 PRM and n = 116 PRMK; right: n = 3). Significance was calculated by two-sided Student’s t-test. i, Numbers of metastatic lesions in the kidneys of PRM and PRMK mice (left) and percentages of PRM or PRMK mice with indicated numbers of organs with metastases (right). Data are shown as mean ± s.d.; left, n = 3. Significance was calculated by two-sided Student’s t-test. j, Representative flow cytometry plots showing the CD45−mCherry+ CTCs in the peripheral blood of PRM and PRMK mice. k, Percentage of CTCs in the peripheral blood of PRM and PRMK mice. P1 represents the CD45− and mCherry+ CTC. Data are shown as mean ± s.e.m.; n = 3. Significance was calculated by two-sided Student’s t-test. l, Average number of axon-like protrusions per organoid. Data are shown as mean ± s.d.; n = 49. Significance was calculated by two-sided Student’s t-test. m, Representative images showing the morphology of the PRM (n = 4), PRMK-shRNA (n = 4) and PRMK-sgRNA (n = 4) SCLC organoids; *P < 0.05, **P < 0.01, ***P < 0.001, ****P < 0.0001.
Pathological analyses showed that there were massive metastases in multiple organs of the PRMK mice (Fig. 4f,g and Extended Data Fig. 4b). Increased metastases were also observed in other organs, including lymph nodes and kidneys, in the PRMK mice (Fig. 4h,i and Extended Data Fig. 4c,d). CTCs have been suggested to play roles during SCLC metastasis and could be used as diagnostic markers20,23. In both the PRM and PRMK mice, we identified CTCs as CD45−mCherry+ cells in the peripheral blood, which had specifically high expression of SCLC markers, such as Ascl1, Ncam1, Chga and Syp (Extended Data Fig. 4e,f). Frequencies of CTCs were significantly higher in PRMK mice than in PRM mice (Fig. 4j,k). Recently, it has been reported that human SCLC cells could grow axon-like protrusions in vitro, which had been proposed to promote metastasis24. Consistent with the previous observation in two-dimensional cultured cell lines, we observed significantly more such axon-like protrusions in the three-dimensional cultured PRMK SCLC organoids than in the PRM organoids (Fig. 4l,m). Taken together, these data strongly suggest that KMT2C deficiency promotes SCLC metastasis in mice.
Epigenetic reprogramming associated with metastasis.
As an H3K4 mono- and dimethyltransferase, KMT2C loss reduced the total levels of H3K4me1 and H3K4me2 in SCLC, which was confirmed by both IHC staining and western blotting and was consistent with the disruption of Kmt2c in PRMK tumors revealed by RNA-seq (Extended Data Fig. 5a–c). Consistently, CUT&Tag sequencing showed that there was a global H3K4me1 decrease, including in the enhancer and transcription start site (TSS) regions, in the PRMK SCLC cells compared to in PRM cells (Fig. 5a, Extended Data Fig. 6a,b and Supplementary Table 14); 93% of the genes with reduced H3K4me1 levels in the PRM metastatic SCLC cells also displayed significantly reduced levels of H3Kme1 in PRMK cells (Fig. 5b). We also observed that H3K4me2 levels across the genome, mostly at the TSS regions, were also downregulated by KMT2C loss (Fig. 5a, Extended Data Fig. 6c,d and Supplementary Table 15). There were no significant changes in H3K4me3 levels in PRM and PRMK cells (Fig. 5a, Extended Data Fig. 6e,f and Supplementary Table 16). However, global chromatin accessibility was reduced in PRMK tumor cells compared to in PRM cells (Fig. 5a, Extended Data Fig. 6g,h and Supplementary Table 17). It was intriguing that overall chromatin accessibility close by KMT2C loss resembled that in metastatic SCLC, and genes with less chromatin accessibility in PRMK tumors were significantly overlapped with those in PRM metastases (Fig. 5c). These data indicate that there was significant epigenetic rewiring by KMT2C loss, which precisely resembled that in metastatic SCLC.
Fig. 5 |. epigenetic reprogramming in Kmt2c-mutant SCLC.

a, Levels of KMT2C bound at the center of peaks, levels of H3K4me1 bound at the enhancer and levels of H3K4me2, H3K4me3 and ATAC bound at the TSS in PRM and PRMK tumor cells, as measured by CUT&Tag analyses. b, Venn diagram showing overlapping of the H3K4me1 downregulated genes in PRM metastatic cells compared to in PRM primary cells and the H3K4me1 downregulated genes in PRMK cells compared to in PRM primary cells. The P value was calculated by a hypergeometric test. c, Venn diagram showing overlapping of the chromatin closed genes in PRM metastatic cells compared to in PRM primary cells and the chromatin close genes in PRMK cells compared to in PRM primary cells. The P value was calculated by a hypergeometric test. d, Levels of KMT2C bound at the center in PRM, PRM-Met and PRMK tumor cells, as measured by the CUT&Tag analyses. e, Venn diagram showing overlapping of H3K4me1 downregulated genes and KMT2C downregulated genes in PRMK cells compared to in PRM SCLC cells. The P value was calculated by a hypergeometric test. f, Venn diagram showing overlapping of the common genes with reduced H3K4me1 levels in both PRM-Met and PRMK cells and the KMT2C downregulated genes in PRMK compared to PRM SCLC cells. The P value was calculated by a hypergeometric test. g, Venn diagram showing overlapping of the common genes with closed chromatin accessibility in both PRM-Met and PRMK cells and the KMT2C downregulated genes in PRMK compared to PRM SCLC cells. The P value was calculated by a hypergeometric test.
To test how much KMT2C would directly contribute to these epigenetic abnormalities in SCLC metastases, we performed CUT&Tag sequencing of KMT2C in the PRM, PRMK and PRM metastatic SCLC cells. KMT2C is specially bound on the promoter regions and distal intergenic and other regions on the genome (Extended Data Fig. 6i,j and Supplementary Tables 18 and 19). The binding of KMT2C across the genome in PRM metastatic cells was dramatically reduced, which was recapitulated by KMT2C loss (Fig. 5d and Extended Data Fig. 6i). About half of the genes with reduced H3K4me1 levels in PRMK SCLC were directly bound by KMT2C (Fig. 5e). Similarly, those with reduced H3K4me2 were also directly bound by KMT2C (Extended Data Fig. 7a). Further, we found that 56.9% of the common genes with reduced H3K4me1 levels in PRM metastases and PRMK tumors were directly bound by KMT2C (Fig. 5f). Similarly, 52.2% of those with close chromatin accessibility in both the PRM metastases and PRMK tumors were also bound by KMT2C (Fig. 5g). These results strongly suggest that KMT2C directly contributes to the epigenetic reprogramming underlying SCLC metastases.
The resulting transcriptional consequences of KMT2C loss in SCLC cells were revealed by RNA-seq (Extended Data Fig. 7b and Supplementary Table 20). Genes with reduced levels of chromatin accessibility and H3K4me1 were significantly overlapped with those with downregulated expression levels in PRMK cells (Extended Data Fig. 7c,d). Some downregulated genes by Kmt2c repression were also frequently mutated in individuals with SCLC (Extended Data Fig. 7d). However, genes with increased H3K4me1 and chromatin accessibility in metastatic SCLC cells were significantly overlapped with those with upregulated levels of H3K4me1 and chromatin accessibility by KMT2C loss (Extended Data Fig. 7e,f); these genes were also upregulated in PRMK tumors compared to in PRM cells (Extended Data Fig. 7g). Of note, the gene signature of KMT2C-deficient SCLC cells was significantly positively enriched in human metastatic SCLC cells (Extended Data Fig. 7h). Thus, KMT2C-loss-induced epigenetic reprogramming could simultaneously down- and upregulate gene expression associated with SCLC metastases. However, there is a remaining paradox of how the loss of KMT2C, an H3K4 methyltransferase for gene activation, would increase the expression of these metastasis-related genes in SCLC.
KMT2C loss gives rise to global DNA hypomethylation.
We noticed that DNMT3A was a module 1 gene and was frequently mutated in human SCLC (Extended Data Fig. 3a). It was also among the 106 genes with significantly lower H3K4me1 levels, less chromatin accessibility and lower expression in metastatic SCLC cells than in primary tumor cells (Extended Data Fig. 8a). KMT2C directly bound on multiple regions of the Dnmt3a locus, and KMT2C loss reduced binding and H3K4me1 and H3K4me2 levels. These H3K4me1 and H3K4me2 binding sites were overlapped with those of KMT2C binding (Fig. 6a). Similar decreases of KMT2C binding and H3K4me1 level at the same regions were also observed in PRM metastatic tumor cells (Fig. 6a). Accordingly, Dnmt3a was progressively downregulated along the metastasis trajectory (Fig. 6b). Consistently, the expression of Dnmt3a was significantly repressed by Kmt2c disruption in lung organoids and in human SCLC with metastasis compared to those without metastasis (Fig. 6c). In three independent SCLC cohorts, expression of DNMT3A was significantly positively correlated with those of KMT2C (Extended Data Fig. 8b), and downregulation of DNMT3A was associated with poor prognosis of individuals with SCLC (Extended Data Fig. 8c). These data suggest that KMT2C might directly regulate the expression of DNMT3A through histone methylation and chromatin remodeling to repress SCLC metastasis.
Fig. 6 |. DNA hypomethylation mediates the functions of KMT2C deficiency in SCLC metastasis.

a, IGV plots showing H3K4me1, H3K4me2, H3K4me3 and KMT2C binding density on Dnmt3a in PRM, PRM-Met and PRMK cells. The significant variation regions are labeled. b, Dynamics of relative expression levels of Dnmt3a on metastasis trajectory. c, Relative expression levels of Dnmt3a in murine sgScr and sgKmt2c lung organoids (left; n = 2,794 cells sgScr and n = 2,794 cells sgKmt2c) and human primary and metastatic SCLC cells (right; n = 10,000 cells primary and n = 2,000 cells metastatic). Data are shown as mean ± s.e.m. The box bounds the interquartile range divided by the median, with the whiskers extending to a maximum of 1.5 times the interquartile range beyond the box. The P value was calculated by Wilcoxon signed-rank test. d, Dot blotting of DNA 5-methylcytosine (5mC) in PRM and PRMK SCLC cells (left). The statistics of DNA 5mC levels in SCLC cells is shown on the right. Data are shown as mean ± s.e.m.; n = 6. Significance was calculated by two-sided Student’s t-test. e, Density plot showing methylation levels at CpG sites in PRM and PRMK SCLC cells. f, Density plot showing methylation levels of CpG sites in PRM and PRM-Met SCLC cells. g, Pie chart showing the concordant percentage of upregulated genes with reduced 5mC levels in PRMK cells compared to in PRM cells. h, Numbers of organoids (left) and percentages of organoids (right) with axon-like protrusions with empty vector or Dnmt3a overexpression. Data are shown as mean ± s.d.; left, n = 4; right, n = 7. Significance was calculated by two-sided Student’s t-test. i, Representative bioluminescence images of mice with PRMK-vector or PRMK-Dnmt3a SCLC at days 7 and 14 after transplantation. j, Numbers of metastatic lesions in the livers of vector and Dnmt3a mice. Data are shown as mean ± s.d.; n = 3. Significance was calculated by two-sided Student’s t-test. k, Representative flow cytometry plots showing CD45−mCherry+ CTCs in mice with PRMK-vector SCLC or PRMK-Dnmt3a SCLC. l, Percentages of CTCs in the peripheral blood of mice with PRMK-vector or PRMK-Dnmt3a SCLC. Data are shown as mean ± s.d.; n = 4 mice. Significance was calculated by two-sided Student’s t-test; *P< 0.05, **P < 0.01, ***P < 0.001, ****P < 0.0001.
DNMT3A encodes a de novo DNA methyltransferase, and its loss can lead to global DNA hypomethylation, which is associated with gene activation25,26. Dot blotting showed that the total level of DNA methylation, indicated by 5mC staining, was dramatically reduced in PRMK SCLC compared to in PRM tumors (Fig. 6d). Whole-genome bisulfite sequencing (WGBS) analyses confirmed the reduction of global DNA methylation levels by KMT2C loss in SCLC (Extended Data Fig. 9a). CpG methylation levels, especially those around CpG islands, were reduced in PRMK tumors compared to in PRM tumors (Fig. 6e and Extended Data Fig. 9b). Similar global and CpG DNA hypomethylation was also observed in PRM metastases (Fig. 6f and Extended Data Fig. 9c). In human metastatic SCLC, CpG methylation was reduced compared to in those without metastasis (Extended Data Fig. 9d). Additionally, individuals with SCLC with KMT2C mutations also displayed reduced CpG methylation levels compared to those without KMT2C mutations (Extended Data Fig. 9e). These data strongly suggest that KMT2C deficiency gives rise to DNA hypomethylation in metastatic SCLC in both mouse models and humans.
Consistent with global DNA hypomethylation, differentially methylated region (DMR) analyses showed that there were significantly more hypo-DMRs than hyper-DMRs in PRMK tumors compared to in PRM tumors (Extended Data Fig. 9f and Supplementary Table 21). Similarly, there were more hypomethylated differentially methylated sites in individuals with SCLC with KMT2C mutations (Extended Data Fig. 9g and Supplementary Table 22), and 85% of the hypomethylated DMRs were in promoter regions, while only 49% of the hypermethylated DMRs were in promoter regions (Extended Data Fig. 9h). Noticeably, 86.4% of the upregulated genes in PRMK cells displayed DNA hypomethylation, suggesting that DNA hypomethylation is a major mechanism for these upregulated genes for SCLC metastases (Fig. 6g). Genes with DNA hypomethylation were significantly overlapped with those with increased chromatin accessibility and had higher expression levels in PRMK cells than in PRM cells (Extended Data Fig. 9i and Supplementary Table 23). These data suggest that DNMT3A deficiency might mediate activation of prometastatic genes in PRMK SCLC.
KMT2C–DNMT3A–MEIS/HOX axis in SCLC metastasis.
DNMT3A has been shown to be a tumor suppressor in leukemia and non-small cell lung cancer, but its potential function in SCLC, especially metastases, was unknown27,28. Dnmt3a overexpression led to a significantly reduced number of PRMK tumor organoids and reduced the formation of axon-like protrusions in PRMK SCLC organoids (Fig. 6h). Fluorescence imaging indicated that forced expression of Dnmt3a reduced the growth of PRMK tumors in mice (Fig. 6i). The number of liver metastasis loci in PRMK-Dnmt3a mice was significantly less than that observed in PRMK mice (Fig. 6j). CTC frequencies in the peripheral blood of SCLC mice were also significantly reduced by Dnmt3a overexpression (Fig. 6k,l and Supplementary Table 24). These results indicate that DNMT3A deficiency is a critical mediator of KMT2C loss in SCLC metastasis.
Dnmt3a overexpression increased the level of DNA methylation in PRMK SCLC cells (Extended Data Fig. 9j). Meis2 was among the common genes with significantly reduced DNA methylation in mouse and human SCLC metastases and tumors with KMT2C loss (Fig. 7a,b) and was one of the top upregulated genes in KMT2C-deficient SCLC with increased chromatin accessibility (Extended Data Fig. 7b,g). MEIS2 is a master regulator and common cotranscription factor of Hox genes, and the promoter regions of multiple Hox genes, including Hoxb5 and Hoxb7, were significantly less methylated in PRMK tumors than in PRM tumors (Fig. 7c) and their expression was significantly upregulated in PRMK tumors compared to in PRM tumors (Fig. 7d). While Dnmt3a disruption in PRM SCLC organoids significantly upregulated the expression levels of Meis2 and multiple Hoxb genes, Dnmt3a overexpression partially reduced expression levels in PRMK tumor organoids (Fig. 7e,f).
Fig. 7 |. Meis/Hox genes are downstream of the KMT2C–DNMT3A epigenetic reprogramming for SCLC metastasis.

a, Venn diagram showing overlapping of the hypomethylated genes in PRM-Met compared to PRM, PRMK compared to PRM and CCLE KMT2C mutant compared to CCLE KMT2C wild type. P values were calculated by a hypergeometric test. b, IGV plots showing the 5mC densities and RNA-seq peaks of the Meis2 gene bodies. c, IGV plots showing the 5mC densities and RNA-seq peaks of the Hoxb5 and Hoxb7 gene bodies. d, Relative expression levels of Meis2, Hoxb2, Hoxb3, Hoxb4, Hoxb5 and Hoxb7 in PRM and PRMK tumor organoids, as measured by real-time quantitative PCR (RT–qPCR). Data are shown as mean ± s.d.; n = 3 mice. Significance was calculated by two-sided Student’s t-test. e, Relative expression levels of Meis2, Hoxb2, Hoxb3, Hoxb5, Hoxb7 and Hoxb9 in PRM tumor organoids with sgScr and sgDnmt3a, as measured by RT–qPCR; n = 3 mice. f, Relative expression of Meis2, Hoxb5 and Hoxb7 in PRMK organoids with vector or Dnmt3a overexpression, as measured by RT–qPCR. Data are shown as mean ± s.d.; n = 3 organoids. Significance was calculated by two-sided Student’s t-test. g, Percentages of the sgScr and sgMeis2 PRMK SCLC organoids with axon-like protrusions (left) and the number of total sgScr and sgMeis2 PRMK organoids (right). Data are shown as mean ± s.d.; n = 4. Significance was calculated by two-sided Student’s t-test. h, Luciferase fluorescence signal intensities of mice with sgScr or sgMeis2 PRMK SCLC. Data are shown as mean ± s.e.m.; n = 4 mice. Significance was calculated by two-sided Student’s t-test. i, Percentages of sgScr and sgMeis2 PRMK mice with the indicated number of metastases. j, Gene set enrichment analysis showing negative enrichment of the epithelial–mesenchymal transition gene signature in sgMeis2 PRMK cells compared to those with sgScr; *P < 0.05, **P < 0.01, ***P < 0.001; NeS, normalized enrichment score; FDR, false discovery rate.
To test the functional roles of Meis/Hox genes in SCLC, we disrupted Meis2 by CRISPR/Cas9 in PRMK SCLC organoids. Meis2 loss significantly reduced the number of tumor organoids and number of axon-like protrusions in the PRMK organoids compared to scramble sgRNA (Fig. 7g). sgMeis2 PRMK SCLC grew significantly slower than sgScr PRMK SCLC (Fig. 7h). While all mice with the sgScr PRMK tumor had SCLC metastasis in lymph nodes, liver and other organs, less than half of the mice with the sgMeis2 PRMK tumor had metastasis, which only happened in the lymph nodes (Fig. 7i). Meis2 loss downregulated the epithelial–mesenchymal transition gene signature and other genes involved in cell migration in PRMK SCLC cells (Fig. 7j and Supplementary Table 25). Taken together, these data indicate that Meis2/Hox genes are important mediators for KMT2C–DNMT3A loss to drive SCLC metastasis.
S-Adenosyl methionine (SAM) treatment for SCLC.
Given the critical roles of the concerted histone methylation and DNA methylation, likely driven by KMT2C and DNMT3A deficiencies, in SCLC metastasis, we looked for treatments that could rescue these epigenetic abnormalities. Thanks to the heterozygous mutations or transcriptional repression of KMT2C and DNMT3A in most SCLC, we proposed that SAM, the common substrate of histone and DNA methyltransferases, might be a proof-of-concept inhibitor for SCLC metastasis. SAM treatment significantly increased DNA 5mC levels and the levels of H3K4me1 and H3K4me2 in PRMK SCLC cells (Extended Data Fig. 10a,b). Growth of PRMK tumor organoids was significantly inhibited by SAM treatment in a dose-dependent manner (Fig. 8a), and SAM treatment significantly reduced the formation of axon-like protrusions in these organoids (Fig. 8b,c).
Fig. 8 |. SAM treatment reversed both H3K4 and DNA hypomethylation in KMT2C-deficient SCLC and restrained metastasis.

a, Growth curves of PRMK organoids treated with vehicle or SAM at the indicated concentrations over time. Data are shown as mean ± s.d.; n = 3 experiments. Significance was calculated by two-sided Student’s t-test. b, Percentages of PRMK SCLC organoids with axon-like protrusions after treatment with vehicle or 0.02 mM SAM. Data are shown as mean ± s.d.; n = 6 experiments. Significance was calculated by two-sided Student’s t-test. c, Representative brightfield images of PRMK SCLC organoids treated with vehicle (n = 5) or SAM (n = 5). d, Relative luciferase fluorescence signal intensities (SAM versus vehicle) of three pairs of SCLC mice at day 0 (D0) and day 7 (D7) after SAM or vehicle treatments. The box bounds the interquartile range divided by the median. e, Percentages of CTCs in SCLC treated with vehicle or SAM. Data are shown as mean ± s.d.; n = 4 mice. Significance was calculated by two-sided Student’s t-test. f, Representative fluorescence images of liver tissue from mice with PRMK SCLC treated with vehicle (left) or SAM (right); n = 3 mice. g, Number of metastatic liver lesions in the livers of three pairs of PRMK SCLC mice treated with vehicle or SAM at the end of treatments. h, Representative H&e staining of liver sections of PRMK SCLC mice treated with vehicle or SAM. i, Growth curves of SCLC organoids from two individuals treated with vehicle and SAM at the indicated concentrations over time. Data are shown as mean ± s.d.; three independent repeats were performed. Significance was calculated by two-sided Student’s t-test. j, Left, Venn diagram showing overlapping of the upregulated genes in SAM-treated PRMK SCLC cells compared to those treated with vehicle and H3K4me1 downregulated genes in PRMK cells compared to PRM cells. Right, Venn diagram showing overlapping of the downregulated genes in SAM-treated PRMK SCLC cells compared to those treated with vehicle and hypomethylated genes in PRMK cells compared to PRM cells. The P values were calculated by a hypergeometric test. k, Working model for KMT2C in SCLC tumorigenesis and metastasis; *P < 0.05, **P < 0.01, ***P < 0.001, ****P < 0.0001.
Oral administration of SAM restrained the growth of PRMK SCLC in mice, as indicated by reduced fluorescence intensity (Fig. 8d). There were fewer CTCs in the peripheral blood of mice treated with SAM than in the blood of mice treated with vehicle (Fig. 8e and Extended Data Fig. 10c). The numbers of liver metastatic nodules in SAM-treated mice with PRMK SCLC were significantly reduced compared to those observed in vehicle-treated mice, as indicated by GFP+ lesions and verified by histological analyses (Fig. 8f–h). Growth of both organoids from two individuals with SCLC was also significantly repressed by SAM in a dose-dependent pattern (Fig. 8i). RNA-seq analyses showed that SAM treatment could not only repress pathways related to tumor metastases but also enhance multiple histone and DNA methylation pathways. Genes upregulated by SAM treatment were significantly overlapped with those with reduced histone and DNA hypomethylation in PRMK tumors (Fig. 8j and Supplementary Table 26). These results suggest that SAM treatment could repress SCLC by rescuing histone and DNA epigenetic abnormalities (Extended Data Fig. 10d and Supplementary Table 27).
In summary, our study reveals the critical roles of KMT2C in SCLC metastasis. We find that KMT2C loss leads to concordant histone and DNA hypomethylation, which simultaneously represses antimetastasis genes and activates prometastasis genes, including MEIS2 and HOX genes, respectively, and thus suggests susceptibilities for this disease (Fig. 8k).
Discussion
Despite metastasis being the leading cause of death for individuals with cancer, so far, there have been very few driver mutations identified for metastasis4. With our models, we find that KMT2C deficiency is a major driver for SCLC metastasis. KMT2C is frequently mutated in many human cancers29. Previously, we have reported that its haploinsufficiency promotes leukemogenesis through repressing differentiation-related genes22. However, its role in solid cancers remains unknown. In this study, we demonstrate that KMT2C is a bona fide tumor suppressor gene (TSG) in SCLC. The functional roles of KMT2C in metastasis were validated with multiple ex vivo and in vivo models. Our work not only validates KMT2C as a TSG in SCLC but also reveals KMT2C as a driver for metastasis. Several other KMT2C-related epigenetic regulators, such as KMT2D and KDM6A, are also frequently mutated in SCLC. KMT2C shares the same COMPASS-like complex and has been shown to be a TSG in non-small cell lung cancer30. Whether these genes have similar functions in the tumorigenesis and metastasis of SCLC needs further study. Additionally, it would be interesting to test whether KMT2C and its related genes play significant roles in metastases of other cancers.
KMT2C is an H3K4 methyltransferase and is associated with gene activation31; therefore, it is expected that downregulation of the majority of downstream genes of KMT2C in acute myeloid leukemia with KMT2C loss is observed22. However, in SCLC, we find that KMT2C deficiency not only represses the expression of metastasis-associated TSGs but also upregulates metastasis-promoting genes, such as MEIS2 and several HOXB genes. MEIS/HOX genes are overexpressed in human SCLC, and overexpression occurs in the metastasis of various types of cancer32,33. We show that DNA hypomethylation, mediated by downregulation of DNMT3A, a direct target of KMT2C, underlies activation of these prometastatic genes. Our study provides an example of how an epigenetic regulator coordinates the expression of genes with opposite functions (here pro- and antimetastasis) through concerted epigenetic reprogramming. Consistently, it has been shown that epigenetic reprogramming, but not genetic mutations, is associated with metastasis4,7. FOXA1-mediated enhancer activation can drive the progression and metastasis of pancreatic cancer34. These data strongly suggest that epigenetic reprogramming might be a major driver of cancer metastasis and potential other hallmarks35.
The unexpected link between KMT2C loss-initiated histone and DNA hypomethylation and metastasis might have broad implications. A global increase of chromatin accessibility driven by NFIB can explain metastasis in some individuals with SCLC13,14. Here, an opposite chromatin status associated with decreased H3K4 methylation suggests a potential molecular mechanism for SCLC metastasis, which is consistent with the emerging concept that SCLC is a highly heterogeneous disease15,36,37. The paradoxical epigenetic patterns in NFIB- and KMT2C-loss-driven SCLC reflect the complexity of epigenetic ‘drivers’ for metastasis in human cancers38,39. The putative inter- and intraheterogeneity of metastases remains unexplored and might become a challenge for potential treatment.
Our findings demonstrating prometastatic histone and DNA hypomethylation could provide treatment options for SCLC. Epigenetic drugs, such as 5-azacytidine, histone deacetylase inhibitors and EZH2 inhibitors, have been approved for cancer treatment. SAM is an approved clinical drug for liver cirrhosis, depressive disorder, osteoarthritis and other syndromes. Treatment with SAM, the common cofactor for many methyltransferases, can enhance both H3K4 and DNA methylation, potentially through KMT2C (in those without homozygous loss), DNMT3A and others, and thus impairs the metastatic capacity of SCLC. This kill-two-birds-with-one-stone strategy might be a promising therapy for this recalcitrant malignancy. It has been reported that EZH2 overexpression underlies SCLC chemoresistance40. EZH2 is responsible for H3K27 methylation, which can be antagonized by KDM6A, an H3K27 demethylase and a component of the COMPASS-like complex with KMT2C. Inhibition of LSD1, an H3K4 and H3K9 demethylase, can repress SCLC with DNA hypomethylation41,42. These data are consistent with our observation that KMT2C deficiency promotes histone and DNA hypomethylation-associated malignancy. It would be interesting to test whether KMT2C is also involved in chemotherapy treatment response and, on the other hand, whether EZH2 and LSD1 inhibitors would restrain metastasis of SCLC.
Methods
This study complied with all relevant ethical regulations and was approved by the Ethics Committee on Biomedical Research, West China Hospital of Sichuan University. Written informed consent was provided by all participants.
Mice.
Mice were kept in the specific pathogen-free animal facility in Sichuan University with autoclaved food, bedding and water. Animals were housed at room temperature (23 ± 2 °C) at a humidity of 30–70% on a 12-h light/12-h dark cycle (6:00–18:00). All mouse experiments were performed in compliance with the Guide for the Care and Use of Laboratory Animals of Sichuan University and were approved by the Animal Care and Use Committee of Sichuan University. C57BL/6 (Jackson Laboratories, 000664) and CAG-Cas9-EGFP mice (Jackson Laboratories, 026179) (male, 8–10 weeks old and ~20 g weight) were used. Mice were monitored for tumorigenesis by bioluminescent imaging and micro-CT scans. In our mouse experiments, the tumor volumes did not exceed the maximal permitted tumor volume of 1,000 mm3.
Cell culture.
HEK 293T cells (CRL-1573) were from ATCC and were cultured at 37 °C with 5% CO2 in DMEM supplemented with 10% (vol/vol) fetal bovine serum and penicillin (100 U ml−1)/streptomycin (0.1 mg ml−1). The HEK 293T cell line was routinely tested for mycoplasma by PCR. Experiments were performed within 4 weeks after fresh viable cells were thawed.
Lung organoid culture.
Mouse lungs were removed, flushed, cut into 5-mm3 pieces and incubated with digestion buffer containing 1.0 mg ml−1 collagenase I (Gibco, 17100–017) and 0.5 mg ml−1 collagenase IV (Gibco, 17104–019) in DMEM/F12 (Gibco, C11330500BT) in gentleMACS C tubes (Miltenyi Biotec, 130-096-334). After dissociation by the gentleMACS dissociator, samples were filtered through 70-μm filters, collected by centrifugation and resuspended in ice-cold Matrigel (BD, 354230) at a ratio of 1:20 (vol:vol). The basic culture medium for mouse lung organoids was slightly modified from a previous report43, where DMEM/F12 was supplemented with penicillin/streptomycin (Gibco, 15140–122), 2 mM GlutaMAX (Peprotech, 35050–061), 1× B27 (Gibco, A3582801), 1× N2 (Gibco, 17502048), 10 nM gastrin I (Peprotech, 1003377), 1 mM N-acetylcysteine (Sigma, A9165) and 10 mM nicotinamide (Sigma, N0636). The following growth factors were used: 50 ng ml−1 mouse recombinant epidermal growth factor (Peprotech, AF-100-15-1000), 100 ng ml−1 mouse recombinant noggin (Peprotech, 120-10C-250), 500 ng ml−1 mouse recombinant FGF10 (Peprotech, 100-26-1000), 125 ng ml−1 R-spondin-1 (Peprotech, 120-38-1000), 10% Wnt-3A conditioned medium and 500 nM A83–01 (Peprotech, 9094360). The medium was changed every 3 d. Organoids were passaged by mechanical dissociation in TrypLE (Gibco, 12605–028) every 5–7 d.
Organoid genome editing.
sgKmt2c was the same as was used in our previous report22. sgRNAs (Supplementary Table 28) were designed with the CRISPR Design Tool (http://crispr.mit.edu/) and cloned into the lentiviral vector V2TC, which bicistronically expresses sgRNA and mCherry. After organoid dissociation with TrypLE, cells were mixed with lentivirus and centrifuged for 1 h at 787g and incubated for 1.5 h at 37 °C. Cells were resuspended in ice-cold Matrigel. To validate targeted mutations, genomic DNA was isolated from infected organoids, and the T7E1 (Vazyme, EN303–01) assay was performed with the PCR product for each sgRNA.
Organoid orthotopic transplantation.
Organoid fragments were prepared through digestion in TrypLE at 37 °C followed by mechanical disassociation, centrifugation and resuspension in 30% Matrigel. After induction of anesthesia, the left thorax of the recipient mice was shaved and sterilized. A 0.5-cm flank incision was made to expose the intercostal muscle. Then, 300,000 cells in a 0.075-ml volume were injected into the left lobe of the lung within 10 s.
Micro-CT and bioluminescent imaging.
Mice were scanned for 340 s under isoflurane anesthesia using a small animal Quantum FX Micro-CT (PerkinElmer) at 45-mm resolution and 90 kV with a 160-mA current. Images were acquired and analyzed with PerkinElmer Quantum FX software. For bioluminescent imaging, mice were given 150 mg kg−1 d-luciferin potassium salt (Biovision, 7903–10PK) intraperitoneally and imaged on the IVIS Spectrum In Vivo Imaging system (PerkinElmer).
In vitro and in vivo treatment.
SAM (Sigma, A7007) was added at the indicated concentrations into three replicate wells with tumor organoids. Organoids were counted at 48, 72, 96 and 120 h after treatment. For in vivo treatment, approximately 2 × 10⁶ PRMK cells were injected into the left lungs of 8-week-old C57BL/6 mice. Mice were monitored for tumor burden by bioluminescence. SAM treatment was initiated at 12 d after transplantation. Mice were treated with 100 mg kg−1 every day for 14 d with SAM or vehicle by gavage. Mice were killed and analyzed once moribund or at the indicated time points.
Whole-mount immunostaining and IHC staining.
Isolated tumor tissues were immediately fixed with 4% paraformaldehyde overnight. Paraffin-embedded tissues were cut at 4 μm and stained for IHC. Organoids were fixed by adding 300 μl of 4% paraformaldehyde per well and incubating overnight for whole-mount immunostaining. Primary antibodies were applied at 1:50–1:500 dilutions in 2% goat serum and incubated overnight at 4 °C. A two-step detection kit (ZSGB-BIO, PV-9001 and PV-9002) was used for IHC and hematoxylin for nuclear staining. For whole-mount immunostaining, fluorescence-conjugated secondary antibodies were used.
Western blotting.
Histone methylation western blotting was done with acid extracts from organoids. The following antibodies were used: H3K4me1 (Abcam, ab8895, 1:2,000), H3K4me2 (Abcam, ab7766, 1:2,000), H3K4me3 (Abcam, ab8580, 1:1,000), H3K9me3 (Abcam, ab8898, 1:2,000), H3K27me3 (Cell Signaling, 9733S, 1:1,000), H3K27ac (Abcam, ab4729, 1:2,000), H3K36me3 (Cell Signaling, 4909S, 1:1,000), KMT2C (Abcam, 71200, 1:400) and H3 (Hangzhou HuaAn Biotechnology, EM30605, 1:3,000).
RNA extraction and RT–qPCR.
Total RNA was extracted with TRIzol (Applied Biosystems, 15596026) following the manufacturer’s instructions. M-MLV reverse transcriptase (Invitrogen, 28025013) was used for reverse transcription according to the manufacturer’s protocol. RT–qPCR was performed using Powerup SYBR Green master mix (Applied Biosystems, A25741) in QuantStudio 3 (Applied Biosystems). The relative expression of genes was calculated using the 2−ΔΔCt method. Gene expression was normalized to that of Actb or Hprt. RT–qPCR was performed on each sample in triplicate. Primer sequences were used to amplify mouse Meis2, Hoxb2, Hoxb3, Hoxb4, Hoxb5, Hoxb7, Hoxb9, Ascl1, Ncam1, Syp and Chga are listed in Supplementary Table 29.
Flow cytometry.
Peripheral blood was obtained from retro-orbital puncture, and red blood cells were lysed by ACK lysis buffer. CD45 (BioLegend, 109820, 1:200) staining was performed at 4 °C for 30 min. Flow cytometry analysis was performed on Fortessa machines (BD Bioscience), and data were analyzed with FlowJo.
DNA 5mC dot blotting assay.
Dot blotting was performed as described in ref. 44. Briefly, purified genomic DNA was quantified on a NanoDrop and denatured by 0.1 M NaOH. Serial-diluted DNA was spotted on a nitrocellulose membrane. 5mC antibody (Active Motif, 39649, 1:3,000) was used.
RNA-seq analyses.
RNA-seq libraries were constructed using an Illumina stranded mRNA sample preparation kit (NEB, E7770) according to the manufacturer’s protocol and were sequenced on an Illumina NovaSeq 6000 sequencing machine with 150-base pair (bp) paired-end reads. The RNA-seq reads were aligned to the mouse reference genome (GRCm38) by STAR_2.6.0a. Transcript abundance was normalized and measured by transcripts per kilobase million. DESeq2 (v.1.26.0, RRID:SCR_000154) was used to identify differentially expressed genes. Genes with an absolute fold change greater than 0.5 and a P value of <0.05 were counted as differentially expressed genes. Pheatmap (v.1.0.12, RRID:SCR_016418) was used to display heat maps of the expression levels of differentially expressed genes, which were normalized by z score.
WGBS analyses.
WGBS libraries were prepared with an EZ DNA Methylation-Gold kit (Zymo Research, D5005) and VAHTS Universal DNA library prep kit (Vazyme, ND607). Sequencing was performed on an Illumina NovaSeq instrument, and reads were aligned to mm10 by BS-Seeker2 (v.2.1.8) with Bowtie 2 aligner. To remove PCR duplicates, MarkDuplicates, implemented in GATK (v.4.1.3), was used with -REMOVE_DUPLICATES = true. Bismark (v.0.22.3) was used for methylated site calling. Differentially methylated site analysis and annotation were performed by the R package methylKit (v.1.12.0). The program metilene (v.0.2.7) was used to identify DMRs based on analyzing the raw methylation ratios at all CpGs. ViewBS (v.0.1.9) was used to draw the methylation levels over regions. IGV (v.2.7.0) was used to visualize the methylation levels.
ATAC-seq analyses.
Library preparation was performed as previously described45. The library was sequenced on an Illumina NovaSeq 6000 sequencing machine with 150-bp paired-end reads. NGmerge (v.0.3) was used to remove the adapters from the raw data. Bowtie2 (v.2.2.1) was used to align reads to the mm10 genome, and Samtools (v.1.8) was used to generate the .bam files. MarkDuplicates, implemented in GATK (v.4.1.3), was used with -REMOVE_DUPLICATES = true to remove the PCR duplicates. Bigwig files were generated by bamCoverage with bins per million normalizing to remove library size effects. For optimizing peak calling in ATAC-seq data, HMMRATAC (v.1.2.5) was used as the peak detector to call peak regions in each sample. Heat maps and average profiles of ATAC-seq peaks were generated with Deeptools (v.3.5.1, RRID:SCR_016366). ChIPseeker (v.1.22.1) was used to annotate the regions in each peak, and global TSS distribution was annotated by using TxDb.Mmusculus.UCSC.mm10.knownGene as the reference genome in R (v.3.6.1). FeatureCounts (RRID:SCR_012919) was used to quantify the count levels in each peak region. The DESeq2 (v.1.26.0, RRID:SCR_000154) pipeline was used to detect the significantly differentially expressed peaks, with a P value of <0.05 and |log2 fold change| of >0.5.
CUT&Tag analyses.
The CUT&Tag assay was performed using a NovoNGS CUT&Tag 2.0 High-Sensitivity kit (Novoprotein Scientific, N259-YH01-01A). Sequencing was performed on an Illumina NovaSeq 6000 with 150-bp paired-end reads, and reads were mapped to mm10 with Bowtie 2 (v.2.3.4.2) with the following options: –local –very-sensitive –no-mixed –no-discordant –phred33 -I 10 -X 700. MarkDuplicates, implemented in GATK (v.4.1.3), was used with -REMOVE_DUPLICATES = true to remove the PCR duplicates. SEACR (v.1.3) was used for peak calling. Differential histone modification analysis (H3K4me1, H3K4me2 and H3K4me3) was performed by diffReps (v.1.55.6, RRID:SCR_010873), and differential histone modification analysis (KMT2C) was performed with DESeq2 (RRID:SCR_000154). The R package ChIPseeker (v.1.22.1) was used to annotate peak regions. Bigwig files were generated from .bam files with Deeptools (v.3.5.1, RRID:SCR_016366) with bins per million normalization. IGV was used for peak visualization. Visualization of the average profile of CUT&Tag peaks was performed with Deeptools (v.3.5.1, RRID:SCR_016366). The following antibodies were used for CUT&Tag: H3K4me1 (Abcam, ab8895, 1:50), H3K4me2 (Abcam, ab7766, 1:50), H3K4me3 (Abcam, ab8580, 1:50) and KMT2C (Abcam, 71200, 1:50).
scRNA-seq analyses.
Libraries were prepared using Chromium Single Cell 3′ Reagent kits v.2 according to the manufacturer’s protocol (10x Genomics) and were sequenced using an Illumina NovaSeq 6000 platform. Exogenous sequences (the constructs for expressing sgRNAs and Myc) were added to the reference genome to distinguish tumor and non-tumor cells. CellRanger (v.2.1.1) was used to align clean reads with mm10. The Seurat (v.3.2.0) pipeline was applied to the analysis to visualize the scRNA-seq data. Genes expressed in less than three cells were not considered, and cells that had mitochondrial ratios lower than 10% and that expressed at least 200 but not more than 6,000 genes were retained for analysis.
All data sets were merged by the Seurat function ‘merge’, and 4,000 variable genes identified by ‘vst’ mode were used to calculate the principal components analysis. t-SNE, UMAP and PHATE were used to reduce dimensions by considering 30 principal components. Slingshot (v.1.4.0) was used to construct the development tree and calculate the pseudotime. Dynamically expressed genes were identified by the VGAM function with a full model of ‘~sm.ns(Pseudotime)’, and q values higher than 10 × 10−50 were filtered. Dynamically expressed gene modules were identified by calculating the distance of gene–gene Pearson correlation coefficient in Monocle2 packages (v.2.14.0). Expression patterns were visualized with the pheatmap (v.1.0.12, RRID:SCR_016418) package, and enrichGO, implemented in clusterProfiler (v.3.14.3, RRID:SCR_016884), was used to enrich the Gene Ontology biological process in each module.
Gene signature calculation.
The CCLE SCLC metastasis signature was calculated from the CCLE SCLC database with relative expression levels of >0.5 and P < 0.05 by t-test. The CDX SCLC metastasis signature was calculated from the human CTC scRNA-seq data20 with relative expression levels of >0.1 and P < 0.05 by Wilcoxon rank-sum test. The murine SCLC metastasis signature was defined by the Seurat function FindAllMarkers with default parameters. Genes specifically upregulated in metastatic cells with adjusted P values of <0.05 and pct.2 < 0.6 were included (pct.2 is a FindAllMarkers parameter and means the percentage of cells where the gene is detected in the second group).
Statistics and reproducibility.
RT–qPCR, organoid diameter and number assays, tumor measurements, metastasis diameter and number assays, CTC assays, 5mC quantification and in vitro treatment were analyzed for statistical significance using two-sided unpaired parametric Student’s t-tests (Prism 8.0, GraphPad software). Statistical significance was denoted as *P < 0.05, **P < 0.01, ***P < 0.001 and ****P < 0.0001. The data distribution was assumed to be normal, but this was not formally tested. The numbers of independent experiments, samples or events are indicated in the figure legends. For in vivo treatment experiments, the treatment and vehicle groups were randomized according to their tumor burden before treatment. For in vitro treatment experiments, all samples were randomly assigned to vehicle or treatment groups. Tumor measurements were performed blindly. Measurements of organoid shapes and the number of metastases were analyzed blindly. For other in vivo and in vitro experiments, researchers were not blinded while performing the experiments. No statistical methods were used to predetermine sample sizes, but our sample sizes are similar to those reported in previous publications46. No data were excluded from the study.
The statistical power of the expression levels on scRNA-seq data was calculated by a Wilcoxon rank-sum test. All the error bars of omics bar plots represent s.e.m. All statistical powers of Venn plots were calculated by a hypergeometric test. All statistical powers of Kaplan–Meier survival curves were calculated by log-rank test. All quantification and visualization of omics data were performed on R v.3.6.
Extended Data
Extended Data Fig. 1 |. Generating primary and orthotopic SCLC with metastases with genome edited lung organoids in mice.

(a) Representative bright-field and fluorescent images of lung organoids transduced with V2TC-sgRNAs and Myc. Three independent repeats. Scale bar, 200 μm. (b) T7 endonuclease 1 (T7e1) assays on Rb1 or Trp53 using infected lung organoid. Cleaved bands were pointed by arrowheads. Three independent repeats. (c) Representative IHC staining of KI67 of lung sections of the PRM mice (n = 4 mice). Scale bar, 20 μm. (d) Representative bright-field and fluorescent images showing metastatic lesions in the lymph nodes of the PRM mice (n = 4 mice). Scale bar, 2 mm. (e) Representative H&e staining of the lymph nodes (n = 4 mice). Scale bar, 20 μm. (f) Representative TTF1 staining of the lymph nodes (n = 4 mice). Scale bar, 20 μm. (g) Representative pictures showing staining of ASCL1, CHGA, SYP and NeUROD1 of liver sections of the PRM mice (n = 4 mice). Scale bar, 40 μm. (h) Representative pictures showing staining of ASCL1, CHGA, SYP and NeUROD1 of the PRM mice’s lymph node (n = 4 mice). Scale bar, 40 μm.
Extended Data Fig. 2 |. Single-cell transcriptome analyses of primary and metastatic SCLC cells.

(a) The ATAC-Seq plot showing signals at the TSS of the PRM and PRM-Met SCLC cells. (b) The bar graph showing the numbers of differential chromatin accessible peaks in the PRM and PRM-Met tumor cells. (c) Genome-wide distribution of chromatin open peaks (left) and close peaks (right) in PRM-Met compared to PRM, measured by ATAC-seq analyses. (d) The dot plot showing the marker genes of each cell type. (e) The openTSNe maps showing the expression distributions of Chga, Ddc and Ncam1. (f) The Alluvial plot showing the composition variation of cell populations in PRM and PRM-Met. (g) The URD map showing the CDX metastasis score projected on the metastasis trajectory. (h) The Kaplan-Meier survival curves of SCLC patients with low and high mouse metastatic scores. p-value was calculated by log-rank test (n = 61, low; n = 16, high). (i) The dynamically expressed genes and enriched gene signatures on the metastasis trajectory. (j) The Kaplan-Meier survival curves of SCLC patients with low and high Module I gene signatures. p-value was calculated by log-rank test (n = 7, low; n = 70, high).
Extended Data Fig. 3 |. KMT2C deficiency in SCLC metastases and its function in lung organoids.

(a) The Venn plot showing the mutation frequency of epigenetic regulatory genes in Module I. (b) The Ridge plot showing gene ontology enrichment in the Ascl1 + primary SCLC cells, analyzed by GSeA. (c) The Kaplan-Meier survival curves of SCLC patients with low and high expressions of KMT2C. Calculated by log-rank test. (n = 42, low; n = 35, high) (d) Representative western blotting pictures of H3K4me1 and H3K4me2 in the PRM and PRM-Met SCLC cells. Three independent repeats. (e) Representative staining of KMT2C, H3K4me1and H3K4me2 of the PRM primary (n = 3) (left) and PRM-Met (n = 3) liver sections (right). Scale bar, 40 μm. (f) The levels of H3K4me1 bound at the enhancers in the PRM and PRM-Met tumor cells, measured by the CUT&Tag analyses. (g) Genome-wide distribution of the H3K4me1 up-regulated genes (top) and down-regulated genes (bottom) in PRM-Met compared to PRM, measured by CUT&Tag analyses. (h) T7 endonuclease 1 (T7e1) assays showing the mutations of Kmt2c in the premalignant PRM organoids. Three independent repeats. Cleaved bands were pointed by arrowheads. (i) Dynamics of relative expression levels of Cyp2f2, Notch1 and Mki67 on the normal development (black line) and malignant transformation (purple line) trajectories.
Extended Data Fig. 4 |. Pathological analysis of the metastases in the PrM and PrMK mice.

(a) Representative H&e (left) and TTF1 staining (right) of the lung sections of the PRMK mice (n = 4 mice). Scale bar, 200 μm. (b) Representative staining of ASCL1, CHGA, NeUROD1 and SYP of the lung (top) and liver (bottom) sections of the PRMK mice (n = 4 mice). Scale bar, 20 μm. (c) Representative images of the lymph nodes (left) and kidney (right) of the PRM (n = 4) (top) and PRMK (n = 4) (bottom) mice. Scale bar, 2 mm. (d) Representative H&e (top) and TTF1 staining (bottom) of the PRM (n = 4) and PRMK (n = 4) mice’s lymph nodes (left) and kidney (right) sections. Scale bar, 200 μm. (e) The −ΔΔCT value of SCLC marker genes Ascl1, Ncam1, Chga and Syp in the CTC of PRM mice, measured by RT-qPCR (n = 3 technical replicates). (f) The −ΔΔCT value of SCLC marker genes Ascl1, Ncam1, Chga and Syp in the CTC of PRMK mice, measured by RT-qPCR (n = 3 technical replicates).
Extended Data Fig. 5 |. The histone methylation in the PrM and PrMK SCLC.

(a) Representative staining of KMT2C, H3K4me1 and H3K4me2 of the lung sections of PRM (n = 3 mice) (top) and PRMK (n = 3 mice) (bottom). Scale bar, 40 μm. (b) Representative western blotting pictures showing the H3k4me1, H3k4me2, H3K4me3, H3K9me3, H3K27me3, H3K27ac and H3K36me3 levels in the PRM and PRMK SCLC cells. Three independent repeats. (c) The IGV plots showing the mutations and expression levels of Kmt2c in the PRM and PRMK SCLC.
Extended Data Fig. 6 |. The epigenetic reprogramming in SCLC with Kmt2c loss.

(a) The levels of H3K4me1 bound at the enhancer (left) and TSS (right) in the PRM and PRMK SCLC cells, measured by CUT&Tag analyses. (b) Genome-wide distribution of the H3K4me1 up-regulated genes (left) and down-regulated genes (right) in PRMK compared to PRM, measured by CUT&Tag analyses. (c) The levels of H3K4me2 bound at the TSS in the PRM and PRMK SCLC cells, measured by CUT&Tag analyses. (d) Genome-wide distribution of the H3K4me2 up-regulated genes (left) and down-regulated genes (right) in PRMK compared to PRM, measured by CUT&Tag analyses. (e) The levels of H3K4me3 bound at the TSS in the PRM and PRMK SCLC cells, measured by CUT&Tag analyses. (f) Genome-wide distribution of the H3K4me3 up-regulated genes (left) and down-regulated genes (right) in PRMK compared to PRM, measured by CUT&Tag analyses. (g) The levels of ATAC bound at the TSS in the PRM and PRMK SCLC cells, measured by CUT&Tag analyses. (h) Genome-wide distribution of the ATAC open genes (top) and close genes (bottom) in PRMK compared to PRM. (i) The levels of KMT2C bound at the peaks of gene body in the PRM, PRM-Met and PRMK tumor cells, measured by the CUT& Tag analyses. (j) Genome-wide distribution of the KMT2C binding peaks in PRM, measured by CUT&Tag analyses.
Extended Data Fig. 7 |. The effect of epigenetic reprogramming on gene expressions in SCLC with Kmt2c loss.

(a) The Venn diagram showing overlapping of the H3K4me2 down-regulated genes and the KMT2C down-regulated genes in PRMK compared to the PRM SCLC cells. p-value was calculated by a hypergeometric test. (b) Heatmap showing the differential expressed genes in the PRM and PRMK organoids. (c) The Venn diagram showing overlapping of the chromatin close genes and those downregulated in the PRMK cells compared to the PRM cells. p-value was calculated by a hypergeometric test. (d) The Venn diagram showing overlapping of the down-regulated genes and those with reduced H3K4me1 in the PRMK compared to the PRM cells. p-value was calculated by a hypergeometric test. (e) The Venn diagram showing overlapping of the H3K4me1 up-regulated genes in the PRM metastasis cells compared to the PRM primary cells and the H3K4me1 up-regulated genes in the PRMK cells compared to the PRM primary. p-value was calculated by a hypergeometric test. (f) The Venn diagram showing overlapping of the chromatin open genes in the PRM metastasis cells compared to the PRM primary cells and the chromatin open genes in the PRMK cells compared to the PRM primary. p-value was calculated by a hypergeometric test. (g) The Venn diagram showing overlapping of the chromatin open genes and those upregulated in the PRMK cells compared to the PRM cells. p-value was calculated by a hypergeometric test. (h) GSeA showing positive enrichment of the PRMK up-regulated gene set in the metastasis SCLC, compared to primary tumor cells in the CCLE cohort.
Extended Data Fig. 8 |. Identifying DNMT3A as a downstream target of KMT2C in SCLC.

(a) The Venn diagram showing overlapping of the down-regulated genes in RNA expression, chromatin accessibility, H3K4me1 in PRM-Met compared to PRM. p-value was calculated by a hypergeometric test. (b) The scatter plot showing the correlation between the relative expression levels of KMT2C and DNMT3A in multiple SCLC cohorts. (c) The Kaplan-Meier survival curves of SCLC patients with high or low expressions of DNMT3A. (n = 55, low; n = 22, high).
Extended Data Fig. 9 |. KMT2C loss gave rise to DNA hypomethylation in SCLC.

(a) The density plot showing all C sites’ methylation levels in the genome of the PRM and PRMK SCLC cells. (b) The 5mC levels of the CpG regions in the PRM and PRMK cells. (c) The density plot showing all C sites’ methylation levels in the genome of the PRM and PRM-Met SCLC cells. (d) The density plot showing the methylation levels of the CpG regions in the CCLE primary and metastasis SCLC cells. (e) The density plot showing the methylation levels of the CpG regions in the CCLE SCLC cells with or without KMT2C mutations. (f) The scatter plot showing the differentially methylated regions (DMRs) in the PRM and PRMK SCLC cells. (g) The scatter plot showing the differentially methylated sites (DMS) in the KMT2C-WT and KMT2C-Mut CCLE SCLC samples. (h) Pie charts showed the genomics region annotation (top) and CpGs subtypes (bottom) of hyper- and hypo- DMRs in PRMK compared to PRM. (i) The Venn diagram showed overlapping of the hypomethylated genes and open genes in PRMK compared to PRM (left); p-value was calculated by a hypergeometric test. The box plot displayed the normalized expression levels of 171 overlap genes of hypomethylated genes and open genes in PRM and PRMK (right), The box bounds the interquartile range divided by the median, with the whiskers extending to a maximum of 1.5 times the interquartile range beyond the box. p-value was calculated by Wilcoxon signed-rank test. (j) Dot blotting showed the expression of 5mC in PRMK organoids with vector or DNMT3A overexpression (left). The statistics of DNA 5mC levels in PRMK cells (right). (mean ± SeM, n = 3). Calculated by Student’s t-test, two-sided. All p-value, *, p < 0.05.
Extended Data Fig. 10 |. SAM treatment for KMT2C deficient SCLC.

(a) The dot blotting (left) and the relative levels (right) of 5mC in the PRMK organoids treated with vehicle or SAM. (mean ± SD, n = 3). *, p < 0.05, Calculated by Student’s t-test, two-sided. (b) The representative western blotting pictures showing the H3k4me1 and H3k4me2 levels in the PRMK organoids treated with vehicle or SAM. Three independent repeats. (c) The representative flow cytometry plots of CTCs in the peripheral blood of PRMK mice treated with vehicle or SAM. (d) Heatmap showing the differential pathways in SAM treated PRMK SCLC cells compared to those treated with vehicle, measured by RNA-seq analyses.
Supplementary Material
Acknowledgements
We thank Ruizhan Tong and the members of the C.C.–L.Y. laboratory for their technical support and suggestions and the Core Facilities of West China Hospital. This work was supported by the National Key R&D Program of China (2017YFA0505600, C.C.), the National Natural Science Foundation of China (81522003, 82170171, 81770157 and 81570150, C.C.; 81570150, F.N.; 8210102196, J.C.), the Sichuan Science and Technology Program (2020YFQ0059, 2020ZYD002, 2018JZ0077 and 2017TJPT0005, C.C.) and the 1.3.5. Project for Disciplines of Excellence, West China Hospital, Sichuan University (C.C.).
Footnotes
Competing interests
The authors declare no competing interests.
Code availability
The analysis code can be found at GitHub (https://github.com/pangxueyu233/KMT2C-in-SCLC-Metastasis).
Reporting Summary. Further information on research design is available in the Nature Research Reporting Summary linked to this article.
Additional information
Extended data is available for this paper at https://doi.org/10.1038/s43018-022-00361-6.
Supplementary information The online version contains supplementary material available at https://doi.org/10.1038/s43018-022-00361-6.
Peer review information Nature Cancer thanks the anonymous reviewers for their contribution to the peer review of this work.
Reprints and permissions information is available at www.nature.com/reprints.
Data availability
The RNA-seq, ATAC-seq, CUT&Tag, WGBS and scRNA-seq data in this study are deposited in the NCBI Gene Expression Omnibus under accession number GSE161570. The processed files for omics analysis were submitted to the Figshare database (https://figshare.com/articles/dataset/A_Coherent_Histone_and_DNA_Hypomethylation_Reprogramming_Drives_Small_Cell_Lung_Cancer_Metastasis/13206338). The SCLC genomics data were downloaded from cBioPortal (https://www.cbioportal.org/). The omics data of 39 SCLC cell lines were accessed from the CCLE database of the depmap portal (https://depmap.org/portal), including the mutation, CpG methylation, RNA-seq and annotation information. The RNA-seq data and clinical data of 81 individuals with SCLC were downloaded from ref. 21. The RNA-seq data of 86 individuals with SCLC were downloaded from ref. 47. The RNA-seq data of 120 SCLC CDX samples were downloaded from ref. 48 (https://doi.org/10.5281/zenodo.3574846). The scRNA-seq data of individuals with SCLC were downloaded from ref. 20. Source data are provided with this paper. All other data supporting the findings of this study are available from the corresponding author on reasonable request.
References
- 1.Valastyan S & Weinberg RA Tumor metastasis: molecular insights and evolving paradigms. Cell 147, 275–292 (2011). [DOI] [PMC free article] [PubMed] [Google Scholar]
- 2.Hu Z, Li Z, Ma Z & Curtis C Multi-cancer analysis of clonality and the timing of systemic spread in paired primary tumors and metastases. Nat. Genet. 52, 701–708 (2020). [DOI] [PMC free article] [PubMed] [Google Scholar]
- 3.Reiter JG et al. Minimal functional driver gene heterogeneity among untreated metastases. Science 361, 1033–1037 (2018). [DOI] [PMC free article] [PubMed] [Google Scholar]
- 4.Makohon-Moore AP et al. Limited heterogeneity of known driver gene mutations among the metastases of individual patients with pancreatic cancer. Nat. Genet. 49, 358–366 (2017). [DOI] [PMC free article] [PubMed] [Google Scholar]
- 5.Ramaswamy S, Ross KN, Lander ES & Golub TR A molecular signature of metastasis in primary solid tumors. Nat. Genet. 33, 49–54 (2003). [DOI] [PubMed] [Google Scholar]
- 6.van ‘t Veer LJ et al. Gene expression profiling predicts clinical outcome of breast cancer. Nature 415, 530–536 (2002). [DOI] [PubMed] [Google Scholar]
- 7.McDonald OG et al. Epigenomic reprogramming during pancreatic cancer progression links anabolic glucose metabolism to distant metastasis. Nat. Genet. 49, 367–376 (2017). [DOI] [PMC free article] [PubMed] [Google Scholar]
- 8.Gazdar AF, Bunn PA & Minna JD Small-cell lung cancer: what we know, what we need to know and the path forward. Nat. Rev. Cancer 17, 725–737 (2017). [DOI] [PubMed] [Google Scholar]
- 9.Matthews MJ, Kanhouwa S, Pickren J & Robinette D Frequency of residual and metastatic tumor in patients undergoing curative surgical resection for lung cancer. Cancer Chemother. Rep. 3 4, 63–67 (1973). [PubMed] [Google Scholar]
- 10.H.R.733—Recalcitrant Cancer Research Act of 2012 (US Congress, 2012); https://www.congress.gov/bill/112th-congress/house-bill/733
- 11.Augustyn A et al. ASCL1 is a lineage oncogene providing therapeutic targets for high-grade neuroendocrine lung cancers. Proc. Natl Acad. Sci. USA 111, 14788–14793 (2014). [DOI] [PMC free article] [PubMed] [Google Scholar]
- 12.Osborne JK et al. NeuroD1 regulates survival and migration of neuroendocrine lung carcinomas via signaling molecules TrkB and NCAM. Proc. Natl Acad. Sci. USA 110, 6524–6529 (2013). [DOI] [PMC free article] [PubMed] [Google Scholar]
- 13.Semenova EA et al. Transcription factor NFIB is a driver of small cell lung cancer progression in mice and marks metastatic disease in patients. Cell Rep. 16, 631–643 (2016). [DOI] [PMC free article] [PubMed] [Google Scholar]
- 14.Denny SK et al. NFIB promotes metastasis through a widespread increase in chromatin accessibility. Cell 166, 328–342 (2016). [DOI] [PMC free article] [PubMed] [Google Scholar]
- 15.Yang D et al. Intertumoral heterogeneity in SCLC is influenced by the cell type of origin. Cancer Discov. 8, 1316–1331 (2018). [DOI] [PMC free article] [PubMed] [Google Scholar]
- 16.Meuwissen R et al. Induction of small cell lung cancer by somatic inactivation of both Trp53 and Rb1 in a conditional mouse model. Cancer Cell 4, 181–189 (2003). [DOI] [PubMed] [Google Scholar]
- 17.Schaffer BE et al. Loss of p130 accelerates tumor development in a mouse model for human small-cell lung carcinoma. Cancer Res. 70, 3877–3883 (2010). [DOI] [PMC free article] [PubMed] [Google Scholar]
- 18.Rudin CM et al. Molecular subtypes of small cell lung cancer: a synthesis of human and mouse model data. Nat. Rev. Cancer 19, 289–297 (2019). [DOI] [PMC free article] [PubMed] [Google Scholar]
- 19.Ghandi M et al. Next-generation characterization of the Cancer Cell Line Encyclopedia. Nature 569, 503–508 (2019). [DOI] [PMC free article] [PubMed] [Google Scholar]
- 20.Stewart CA et al. Single-cell analyses reveal increased intratumoral heterogeneity after the onset of therapy resistance in small-cell lung cancer. Nat. Cancer 1, 423–436 (2020). [DOI] [PMC free article] [PubMed] [Google Scholar]
- 21.George J et al. Comprehensive genomic profiles of small cell lung cancer. Nature 524, 47–53 (2015). [DOI] [PMC free article] [PubMed] [Google Scholar]
- 22.Chen C et al. MLL3 is a haploinsufficient 7q tumor suppressor in acute myeloid leukemia. Cancer Cell 25, 652–665 (2014). [DOI] [PMC free article] [PubMed] [Google Scholar]
- 23.Hodgkinson CL et al. Tumorigenicity and genetic profiling of circulating tumor cells in small-cell lung cancer. Nat. Med. 20, 897–903 (2014). [DOI] [PubMed] [Google Scholar]
- 24.Yang D et al. Axon-like protrusions promote small cell lung cancer migration and metastasis. eLife 8, e50616 (2019). [DOI] [PMC free article] [PubMed] [Google Scholar]
- 25.Zhang ZM et al. Structural basis for DNMT3A-mediated de novo DNA methylation. Nature 554, 387–391 (2018). [DOI] [PMC free article] [PubMed] [Google Scholar]
- 26.Jia D, Jurkowska RZ, Zhang X, Jeltsch A & Cheng X Structure of Dnmt3a bound to Dnmt3L suggests a model for de novo DNA methylation. Nature 449, 248–251 (2007). [DOI] [PMC free article] [PubMed] [Google Scholar]
- 27.Gao Q et al. Deletion of the de novo DNA methyltransferase Dnmt3a promotes lung tumor progression. Proc. Natl Acad. Sci. USA 108, 18061–18066 (2011). [DOI] [PMC free article] [PubMed] [Google Scholar]
- 28.Mayle A et al. Dnmt3a loss predisposes murine hematopoietic stem cells to malignant transformation. Blood 125, 629–638 (2015). [DOI] [PMC free article] [PubMed] [Google Scholar]
- 29.Kandoth C et al. Mutational landscape and significance across 12 major cancer types. Nature 502, 333–339 (2013). [DOI] [PMC free article] [PubMed] [Google Scholar]
- 30.Alam H et al. KMT2D deficiency impairs super-enhancers to confer a glycolytic vulnerability in lung cancer. Cancer Cell 37, 599–617 (2020). [DOI] [PMC free article] [PubMed] [Google Scholar]
- 31.Shilatifard A The COMPASS family of histone H3K4 methylases: mechanisms of regulation in development and disease pathogenesis. Annu. Rev. Biochem. 81, 65–95 (2012). [DOI] [PMC free article] [PubMed] [Google Scholar]
- 32.Paco A, Aparecida de Bessa Garcia, S., Leitao Castro, J., Costa-Pinto, A. R. & Freitas, R. Roles of the HOX proteins in cancer invasion and metastasis. Cancers 13, 10 (2020). [DOI] [PMC free article] [PubMed] [Google Scholar]
- 33.Tiberio C et al. HOX gene expression in human small-cell lung cancers xenografted into nude mice. Int. J. Cancer 58, 608–615 (1994). [DOI] [PubMed] [Google Scholar]
- 34.Roe JS et al. Enhancer reprogramming promotes pancreatic cancer metastasis. Cell 170, 875–888 (2017). [DOI] [PMC free article] [PubMed] [Google Scholar]
- 35.Hanahan D Hallmarks of cancer: new dimensions. Cancer Discov. 12, 31–46 (2022). [DOI] [PubMed] [Google Scholar]
- 36.Rudin CM, Brambilla E, Faivre-Finn C & Sage J Small-cell lung cancer. Nat. Rev. Dis. Primers 7, 3 (2021). [DOI] [PMC free article] [PubMed] [Google Scholar]
- 37.Drapkin BJ & Rudin CM Advances in small-cell lung cancer (SCLC) translational research. Cold Spring Harb. Perspect. Med 11, a038240 (2020). [DOI] [PMC free article] [PubMed] [Google Scholar]
- 38.Chatterjee A, Rodger EJ & Eccles MR Epigenetic drivers of tumourigenesis and cancer metastasis. Semin. Cancer Biol. 51, 149–159 (2018). [DOI] [PubMed] [Google Scholar]
- 39.Fares J, Fares MY, Khachfe HH, Salhab HA & Fares Y Molecular principles of metastasis: a hallmark of cancer revisited. Signal Transduct. Target. Ther. 5, 28 (2020). [DOI] [PMC free article] [PubMed] [Google Scholar]
- 40.Gardner EE et al. Chemosensitive relapse in small cell lung cancer proceeds through an EZH2–SLFN11 axis. Cancer Cell 31, 286–299 (2017). [DOI] [PMC free article] [PubMed] [Google Scholar]
- 41.Mohammad HP et al. A DNA hypomethylation signature predicts antitumor activity of LSD1 inhibitors in SCLC. Cancer Cell 28, 57–69 (2015). [DOI] [PubMed] [Google Scholar]
- 42.Wu B et al. Epigenetic drug library screening identified an LSD1 inhibitor to target UTX-deficient cells for differentiation therapy. Signal Transduct. Target. Ther. 4, 11 (2019). [DOI] [PMC free article] [PubMed] [Google Scholar]
- 43.Drost J et al. Organoid culture systems for prostate epithelial and cancer tissue. Nat. Protoc. 11, 347–358 (2016). [DOI] [PMC free article] [PubMed] [Google Scholar]
- 44.Chen C et al. Cancer-associated IDH2 mutants drive an acute myeloid leukemia that is susceptible to Brd4 inhibition. Genes Dev. 27, 1974–1985 (2013). [DOI] [PMC free article] [PubMed] [Google Scholar]
- 45.Buenrostro JD, Giresi PG, Zaba LC, Chang HY & Greenleaf WJ Transposition of native chromatin for fast and sensitive epigenomic profiling of open chromatin, DNA-binding proteins and nucleosome position. Nat. Methods 10, 1213–1218 (2013). [DOI] [PMC free article] [PubMed] [Google Scholar]
- 46.Chen M et al. An epigenetic mechanism underlying chromosome 17p deletion-driven tumorigenesis. Cancer Discov. 11, 194–207 (2021). [DOI] [PMC free article] [PubMed] [Google Scholar]
- 47.Jiang L et al. Genomic landscape survey identifies SRSF1 as a key oncodriver in small cell lung cancer. PLoS Genet. 12, e1005895 (2016). [DOI] [PMC free article] [PubMed] [Google Scholar]
- 48.Simpson KL et al. A biobank of small cell lung cancer CDX models elucidates inter- and intratumoral phenotypic heterogeneity. Nat. Cancer 1, 437–451 (2020). [DOI] [PubMed] [Google Scholar]
Associated Data
This section collects any data citations, data availability statements, or supplementary materials included in this article.
Supplementary Materials
Data Availability Statement
The RNA-seq, ATAC-seq, CUT&Tag, WGBS and scRNA-seq data in this study are deposited in the NCBI Gene Expression Omnibus under accession number GSE161570. The processed files for omics analysis were submitted to the Figshare database (https://figshare.com/articles/dataset/A_Coherent_Histone_and_DNA_Hypomethylation_Reprogramming_Drives_Small_Cell_Lung_Cancer_Metastasis/13206338). The SCLC genomics data were downloaded from cBioPortal (https://www.cbioportal.org/). The omics data of 39 SCLC cell lines were accessed from the CCLE database of the depmap portal (https://depmap.org/portal), including the mutation, CpG methylation, RNA-seq and annotation information. The RNA-seq data and clinical data of 81 individuals with SCLC were downloaded from ref. 21. The RNA-seq data of 86 individuals with SCLC were downloaded from ref. 47. The RNA-seq data of 120 SCLC CDX samples were downloaded from ref. 48 (https://doi.org/10.5281/zenodo.3574846). The scRNA-seq data of individuals with SCLC were downloaded from ref. 20. Source data are provided with this paper. All other data supporting the findings of this study are available from the corresponding author on reasonable request.