Abstract
The phospholipid composition of Escherichia coli minicells has been studied as a model for the cell division site. Minicells appeared to be enriched in cardiolipin at the expense of phosphatidylglycerol. Mass spectrometry showed no differences between the gross acyl chain compositions of minicells and wild-type cells.
Escherichia coli cell division is initiated by formation of the FtsZ ring in the middle of the cell. Subsequently, other cell division proteins localize to this ring and together they form the divisome, which carries out the fission process. Although localization of the cell division proteins has been studied intensively, it is still not known how they find the correct position (16, 22). Presumably, divisomal proteins recognize a certain protein and lipid environment. The invagination process, as such, might also require a specific local phospholipid composition to facilitate membrane curvature. One aspect of the process with respect to membrane curvature might be the shape of the phospholipids, i.e., whether they are cones, inverted cones, or cylinders. For instance, cardiolipin (CL) has a cylindrical shape, whereas its Ca2+ form is cone shaped (for a review, see reference 9).
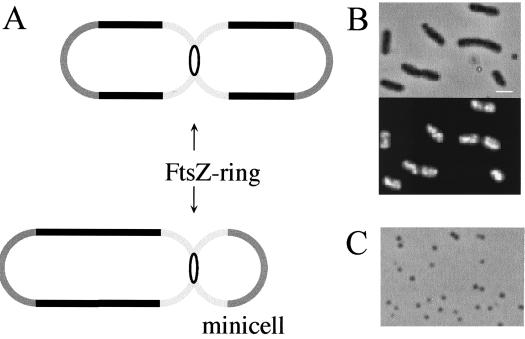
To gain more insight into whether specific phospholipids or specific lipid combinations are involved in the division process, we compared the phospholipid compositions of so-called minicells from mutant and wild-type cells. Minicells are formed after cell division at the cell pole in min mutants (1) (Fig. 1A).
FIG. 1.
Minicell formation. (A) Schematic representation of normal cell division and minicell formation. (B) Microscopic images of the minicell-producing strain LMC1088. The upper panel shows a phase-contrast image, and the lower panel shows the corresponding DAPI fluorescence image. Note that the minicells lack DNA and therefore do not show DAPI fluorescence. Bar = 1 μm. (C) Phase-contrast image of isolated minicells.
Isolation of minicells.
E. coli LMC500 lysA (25) was used as the wild-type strain, and LMC1088 was used as a minicell-forming mutant (constructed by E. Mulder [21]). Cells were grown to steady state (7) with a doubling time of 80 min at 28°C in glucose minimal medium. Minicells were isolated from a 5-liter cell culture of LMC1088. All steps were performed at 0 to 4°C. After harvest at an optical density at 450 nm of 0.2, the cells were resuspended in 100 ml of BSG (1.5 M NaCl, 20 mM KH2PO4, 50 mM Na2HPO4 · 2H2O, 0.1% [wt/vol] gelatin [pH 7.7]). Large cells were removed by centrifugation at low speed (5 min at 500 × g), and the remaining cells were subsequently pelleted by centrifugation for 10 min at 15,000 × g. After resuspension in 5 ml of BSG, the cell suspension was layered on a sucrose gradient prepared in BSG consisting of a 3-ml 20%, a 12-ml 10%, and an 18-ml 5% (wt/vol) sucrose top layer. Centrifugation was done in a swing-out rotor (Beckman JS-13) for 10 min at 2,500 × g. The minicell fraction was collected from the 5% sucrose layer and was washed with and then resuspended in a small volume of membrane buffer (50 mM KH2PO4/K2HPO4 [pH 7.2], 5 mM MgSO4, 0.5 mM Pefablock [Boehringer Mannheim, Mannheim, Germany]) and stored at −70°C. The purity was checked by DAPI (4′,6′-diamidino-2-phenylindole) fluorescence microscopy (Fig. 1B and C). Typically, the yield of minicells isolated from a 5-liter culture was 3 to 5 mg on a protein basis. If the minicell suspension contained more than 5% DNA-containing cells, the sucrose gradient centrifugation step and wash step were repeated.
Phospholipid head group analysis.
Phospholipids from 3-mg samples (based on protein content) were extracted (2) and separated by two-dimensional thin-layer chromatography (6) on boric acid-impregnated plates (thin-layer chromatography plates with silica gel 60; Merck, Germany) with chloroform-methanol-water-ammonia (120:75:6:2, vol/vol/vol/vol) as the first developer and chloroform-methanol-acetic acid (65:25:10, vol/vol/vol) for the second direction. The spots were visualized with iodine vapor. After being scraped from the plate, the lipid phosphorus of each spot was determined (8).
Phospholipid head group normal-cell and minicell composition.
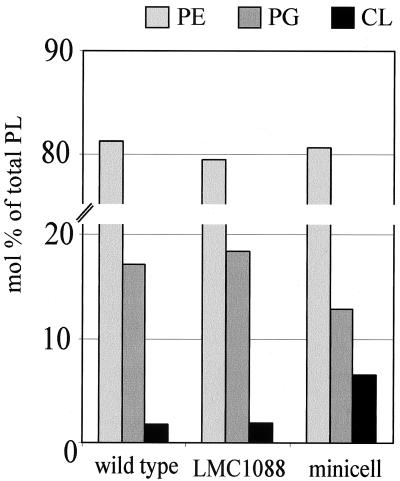
Exponentially growing wild-type cells were found to contain 81.1 mol% phosphatidylethanolamine (PE) (range, 78.4 to 86.7 mol%), 17.1 mol% phosphatidylglycerol (PG) (range, 11.4 to 19.9 mol%), and 1.8 mol% CL (range, 1.5 to 2.1 mol%) (n = 4) (Fig. 2), values which are in good agreement with those found in the literature (4). The phospholipid compositions of cells from the minicell-producing strain LMC1088 were more or less the same as those of the wild-type cells (Fig. 2). However, when the phospholipid composition of minicell extracts (n = 6) was compared with that of LMC1088 (n = 6), it was found that the amount of CL was increased from 1.9 mol% (range, 1.2 to 2.4 mol%) to 6.5 mol% (range, 3.1 to 9.9 mol%). By contrast, the amount of PG was decreased from 18.4 mol% (range, 17.4 to 19.5 mol%) to 12.8 mol% (range, 10.0 to 16.6 mol%). The amounts of PE appeared to be the same, 81.1 mol% (range, 79.4 to 86.7 mol%) in LMC1088 and 80.7 mol% (range, 76.4 to 84.7 mol%) in minicells.
FIG. 2.
Comparison of phospholipid (PL) head group compositions of E. coli LMC500 (wild type), LMC1088 (mutant), and minicells. Values are averages from four, six, and six duplicate experiments with LMC500, LMC1088, and minicells, respectively.
The phospholipid domains in E. coli have been visualized previously with the CL-specific fluorescent dye 10-N-nonyl acridine orange (19). Their polar localizations are compatible with our biochemical data. However, our data differ from those of Goodell and coworkers (10), who found a relative increase in the level of PG in minicells. We have no explanation for this discrepancy.
ESI-FTICR-MS.
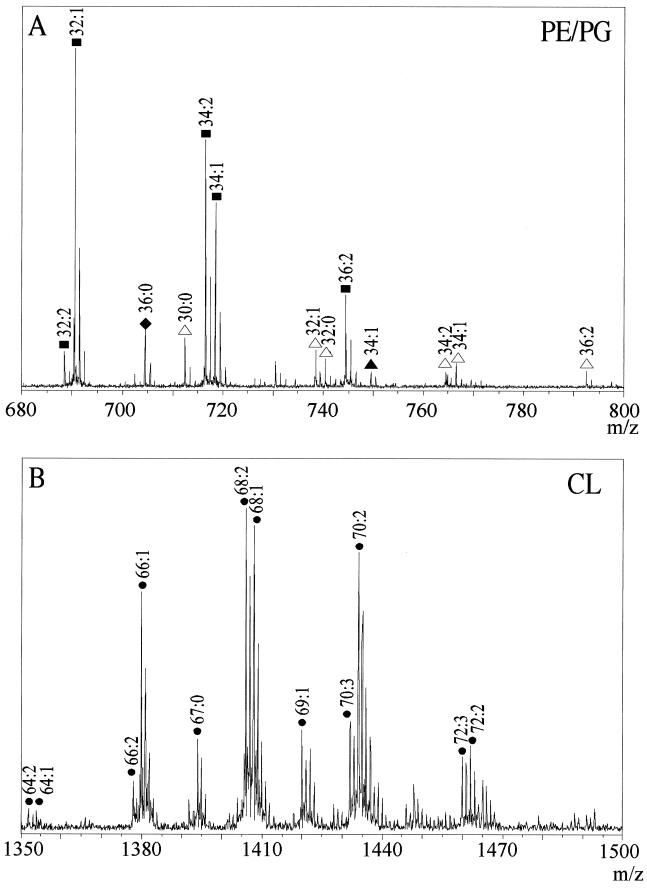
Electrospray ionization-Fourier transform ion cyclotron resonance mass spectrometry (ESI-FTICR-MS) was performed on a modified Bruker APEX 7.0e FTICR-MS (11, 13). High-resolution mass spectra of both wild-type and minicell phospholipid extracts were taken. Expanded mass spectral regions of wild-type extracts are shown in Fig. 3.
FIG. 3.
Positive-ion ESI-FTICR-MS analysis of E. coli phospholipids. A total phospholipid extract from wild-type cells was dissolved in dichloromethane-ethanol (7:3, vol/vol) and sprayed with 10 mM ammonium acetate. Expanded regions from broad-band mass spectra obtained after Fourier transformation of the ion cyclotron signal are shown. Individual phospholipid species are indicated by head group and overall acyl chain composition (expressed as x:y, where x is the number of carbon atoms and y is the number of unsaturated bonds). (A) Region between an m/z of 680 and an m/z of 800, containing mass spectral peaks derived from PE [M + H]+ (▪), PG [M + H]+ (▴), PG [M + NH4]+ (▵), and PA [M + H]+ (♦). (B) Region between an m/z of 1,350 and an m/z of 1,500, containing mass spectral peaks derived from CL [M + H]+ (●).
The first region of interest ranges from a mass-to-charge ratio (m/z) of 650 to an m/z of 800 (Fig. 3A), and it contains predominantly the singly charged PE, PG, and phosphatidic acid (PA) mass spectral peaks. The PE peaks are most abundant, as expected from the chemical phospholipid composition analysis. The PG species were observed chiefly as [M + NH4]+ ions. The total acyl chain lengths of the PG species varied between 30 and 36 carbon atoms, and they contained 0 to 2 unsaturated bonds. Only one species of PA (PA 36:0) was found in the mass spectra, which is not surprising since PA occurs in E. coli as only a minor phospholipid.
The second region of interest is that between an m/z of 1,350 and an m/z of 1,500 (Fig. 3B), and this region contains the singly charged CL ions. The most abundant ion series were [M + H]+ ions, with a gross acyl chain composition ranging from 66 to 72 carbon atoms and containing 0 to 3 unsaturated bonds. In addition to the saturated and unsaturated CL species with an even number of carbon atoms, two species with odd numbers of C atoms were also found (CL 67:0 and CL 69:1). All peaks derived from phospholipids were found in the spectra of wild-type and minicell extracts. Thus, a qualitative comparison indicated no clear-cut differences.
Lipids and cell division.
Kikuchi and coworkers (12) constructed a pgsA null mutant which was able to grow and divide despite the fact that PG and CL were not detectable (molar percentages of <0.001 in each case). The highly increased level of PA in the null mutant suggested that the absence of the anionic phospholipids PG and CL was functionally compensated for, at least in part, by PA (12). Thus, neither CL nor PG seems to be essential for growth (12; for a review, see reference 17). Although anionic phospholipids are necessary for cell viability, the exact phospholipid compositions may differ (see also reference 23).
One role of anionic phospholipids may be in the recruitment of cell division proteins by electrostatic interactions (for reviews, see references 17 and 18). For instance, SecA protein-dependent translocation of proteins across the inner membrane has been shown to be dependent on anionic phospholipids (3, 5, 14, 15). Since many membrane-anchored divisomal proteins have large periplasmic domains, it appears likely that membrane insertion also requires the presence of anionic phospholipids.
PE-deficient cells are incapable of division, and the filaments do not show visible constrictions (20; also reference 24 and references therein). However, in cells containing a pss-93 null mutation (pss encodes phosphatidylserine synthase), the essential cell division proteins FtsZ, FtsA, and ZipA were still able to localize to potential division sites (20). This suggests that PE is needed in the constriction process and less so in the positioning of the cytokinetic ring.
Despite the absence of a specific role for CL in cell division, one might speculate that the increase in the level of CL in minicells reflects the requirement of CL that proteins in the cell division complex (divisome) be either stabilized, activated, or both. A second possible role, as mentioned in the introduction, relates to the establishment of membrane curvature, as required for the initiation of cell constriction. Whether this polymorphic property is relevant for E. coli cell division remains to be established.
Acknowledgments
This work was supported in part by ALW-NWO (C.-M.K. and N.N.; program number 805-33-220-P) and by FOM-NWO (M.C.D. and R.M.A.H.).
REFERENCES
- 1.Adler H I, Fisher W D, Cohen A, Hardigree A. Miniature Escherichia coli cells deficient in DNA. Proc Natl Acad Sci USA. 1967;57:321–326. doi: 10.1073/pnas.57.2.321. [DOI] [PMC free article] [PubMed] [Google Scholar]
- 2.Bligh E G, Dyer W J. A rapid method of total lipid extraction and purification. Can J Biochem Physiol. 1959;37:911–917. doi: 10.1139/o59-099. [DOI] [PubMed] [Google Scholar]
- 3.Breukink E, Demel R A, Korte-Kool G, de Kruijff B. SecA insertion into phospholipids is stimulated by negatively charged lipids and inhibited by ATP: a monolayer study. Biochemistry. 1992;31:1119–1124. doi: 10.1021/bi00119a021. [DOI] [PubMed] [Google Scholar]
- 4.Cronan J E, Jr, Rock C O. Biosynthesis of membrane lipids. In: Neidhardt F C, Ingraham J L, Low K B, Magasanik B, Schaechter M, Umbarger H E, editors. Escherichia coli and Salmonella typhimurium: cellular and molecular biology. Washington, D.C.: American Society for Microbiology; 1987. pp. 474–497. [Google Scholar]
- 5.Den Blaauwen T, van der Wolk J P W, van der Does C, van Wely K H M, Driessen A J M. Thermodynamics of nucleotide binding to NBS-I of the Bacillus subtilis preprotein translocase subunit SecA. FEBS Lett. 1999;458:145–150. doi: 10.1016/s0014-5793(99)01139-4. [DOI] [PubMed] [Google Scholar]
- 6.Fine J B, Sprecher H. Unidimensional thin-layer chromatography of phospholipids on boric acid-impregnated plates. J Lipid Res. 1982;23:660–663. [PubMed] [Google Scholar]
- 7.Fishov I, Zaritsky A, Grover N B. On microbial states of growth. Mol Microbiol. 1995;15:789–794. doi: 10.1111/j.1365-2958.1995.tb02349.x. [DOI] [PubMed] [Google Scholar]
- 8.Fiske L M, Subbarow Y. The colorimetric determination of phosphorus. J Biol Chem. 1925;66:375–389. [Google Scholar]
- 9.Gennis R B. Biomembranes: molecular structure and function. New York, N.Y: Springer-Verlag; 1989. [Google Scholar]
- 10.Goodell E W, Schwarz U, Teather R M. Cell envelope composition of Escherichia coli K12: a comparison of the cell poles and the lateral wall. Eur J Biochem. 1974;47:567–572. doi: 10.1111/j.1432-1033.1974.tb03727.x. [DOI] [PubMed] [Google Scholar]
- 11.Heeren R M A, Boon J J. Rapid microscale analyses with an external ion source Fourier transform ion cyclotron resonance mass spectrometer. Int J Mass Spectrom Ion Processes. 1996;157/158:391–403. [Google Scholar]
- 12.Kikuchi S, Shibuya I, Matsumoto K. Viability of an Escherichia coli pgsA null mutant lacking detectable phosphatidylglycerol and cardiolipin. J Bacteriol. 2000;182:371–376. doi: 10.1128/jb.182.2.371-376.2000. [DOI] [PMC free article] [PubMed] [Google Scholar]
- 13.Koster S, Duursma M C, Boon J J, Nielen M W F, de Koster C G, Heeren R M A. Structural analysis of synthetic homo- and copolyesters by electrospray ionization on a Fourier transform cyclotron resonance mass spectrometer. J Mass Spectrom. 2000;35:739–748. doi: 10.1002/1096-9888(200006)35:6<739::AID-JMS3>3.0.CO;2-#. [DOI] [PubMed] [Google Scholar]
- 14.Kusters R, Dowhan W, de Kruijff B. Negatively charged phospholipids restore pre-PhoE translocation across phosphatidylglycerol-depleted Escherichia coli inner membranes. J Biol Chem. 1991;266:8659–8662. [PubMed] [Google Scholar]
- 15.Lill R, Dowhan W, Wickner W. The ATPase activity of SecA is regulated by acidic phospholipids, SecY, and the leader and mature domains of precursor proteins. Cell. 1990;60:271–280. doi: 10.1016/0092-8674(90)90742-w. [DOI] [PubMed] [Google Scholar]
- 16.Margolin W. Themes and variations in prokaryotic cell division. FEMS Microbiol Rev. 2000;24:531–548. doi: 10.1111/j.1574-6976.2000.tb00554.x. [DOI] [PubMed] [Google Scholar]
- 17.Matsumoto K. Dispensable nature of phosphatidylglycerol in Escherichia coli: dual roles of anionic phospholipids. Mol Microbiol. 2001;39:1427–1433. doi: 10.1046/j.1365-2958.2001.02320.x. [DOI] [PubMed] [Google Scholar]
- 18.McAuley K E, Fyfe P K, Ridge J P, Isaac N W, Codgell R J, Jones M R. Structural details of an interaction between cardiolipin and an integral membrane protein. Proc Natl Acad Sci USA. 1999;96:14706–14711. doi: 10.1073/pnas.96.26.14706. [DOI] [PMC free article] [PubMed] [Google Scholar]
- 19.Mileykovskaya E, Dowhan W. Visualization of phospholipid domains in Escherichia coli by using the cardiolipin-specific fluorescent dye 10-N-nonyl acridine orange. J Bacteriol. 2000;182:1172–1175. doi: 10.1128/jb.182.4.1172-1175.2000. [DOI] [PMC free article] [PubMed] [Google Scholar]
- 20.Mileykovskaya E, Sun Q, Margolin W, Dowhan W. Localization and function of early cell division proteins in filamentous Escherichia coli cells lacking phosphatidylethanolamine. J Bacteriol. 1998;180:4252–4257. doi: 10.1128/jb.180.16.4252-4257.1998. [DOI] [PMC free article] [PubMed] [Google Scholar]
- 21.Mulder E. Ph.D. thesis. Amsterdam, The Netherlands: University of Amsterdam; 1991. [Google Scholar]
- 22.Nanninga N. Morphogenesis of Escherichia coli. Microbiol Mol Biol Rev. 1998;62:110–129. doi: 10.1128/mmbr.62.1.110-129.1998. [DOI] [PMC free article] [PubMed] [Google Scholar]
- 23.Pluschke G, Hirota Y, Overath P. Function of phospholipids in Escherichia coli. J Biol Chem. 1978;253:5048–5055. [PubMed] [Google Scholar]
- 24.Rietveld A G, Verkleij A J, de Kruijff B. A freeze-fracture study of membrane morphology of phosphatidylethanolamine-deficient Escherichia coli cells. Biochim Biophys Acta. 1997;1324:263–272. doi: 10.1016/s0005-2736(96)00232-5. [DOI] [PubMed] [Google Scholar]
- 25.Taschner P E M, Huls P G, Pas E, Woldringh C L. Division behavior and shape changes in isogenic ftsZ, ftsQ, ftsA, pbpB, and ftsE cell division mutants of Escherichia coli during temperature shift experiments. J Bacteriol. 1988;170:1533–1540. doi: 10.1128/jb.170.4.1533-1540.1988. [DOI] [PMC free article] [PubMed] [Google Scholar]


