

Abstract
Background and Objectives
In the midst of the pandemic, new coronavirus mutants continue to emerge; the most relevant variant worldwide is omicron. Here, patients who recovered from the disease living in Jilin Province were analyzed to identify factors affecting the severity of omicron infection and to provide insights into its spread and early indication.
Methods
In this study, 311 cases of severe acute respiratory syndrome coronavirus 2 (SARS-CoV-2) were divided into two groups. Data on the patients’ demographic characteristics and laboratory tests, including platelet count (PLT), neutrophil count (NE), C-reactive protein (CRP), serum creatinine (SCR), and neutrophil-to-lymphocyte ratio (NLR), were collected. The biomarkers for moderate and severe coronavirus disease 2019 (COVID-19) and factors affecting the incubation period and time to subsequent negative nucleic acid amplification test (NAAT) were also investigated.
Results
Age, gender, vaccination, hypertension, stroke, chronic obstructive pulmonary disease (COPD)/chronic bronchitis/asthma, and some laboratory tests were statistically different between the two groups. In the receiver operating characteristic (ROC) analysis, PLT and CRP had higher area under the ROC curve values. In the multivariate analysis, age, hypertension, COPD/chronic bronchitis/asthma, and CRP were correlated with moderate and severe COVID-19. Moreover, age was correlated with longer incubation. In the Kaplan-Meier curve analysis, gender (male), CRP, and NLR were associated with longer time to subsequent negative NAAT.
Conclusions
Older patients with hypertension and lung diseases were likely to have moderate or severe COVID-19, and younger patients might have a shorter incubation. A male patient with high CRP and NLR levels might take more time to turn back negative in the NAAT.
Key words: SARS-CoV-2, omicron, epidemiology, laboratory tests, nucleic acid amplification test
Introduction
The novel coronavirus usually infects humans through the respiratory tract and causes damage to the respiratory system and various organs of the human body.[1] Since the first outbreak at the end of 2019, the novel coronavirus is still raging worldwide, causing great economic and health burden. In the midst of the coronavirus disease 2019 (COVID-19) pandemic, new virus mutants continue to emerge, such as alpha, beta, gamma, delta, and omicron, some of which have stronger virulence or stronger immune escape ability.[2] Presently, the most relevant variant worldwide is the omicron mutant.[2, 3, 4]
In November 2021, Botswana reported the first case of omicron sequencing. A few days later, Hong Kong, China reported another case of omicron sequencing in a traveler from South Africa.[5] In South Africa, COVID-19 cases increased by an average of 280 cases daily in the week before omicron was detected and further increased to 800 cases a day in the following week.[6] Omicron has some deletions and more than 30 mutations.[5] These deletions and mutations lead to increased transmissibility, stronger viral binding affinity, and higher antibody escape rates.[7, 8] For governments and the public, the main concerns regarding omicron include whether it is more contagious or has more severe clinical manifestations and side effects and whether it can bypass vaccine protection.
Jilin is a province located in the northeast of China with a population of 27 million. In 2020, we performed a local epidemiological analysis involving all patients with COVID-19 in Jilin Province.[9] In 2022, Jilin Province was again affected by the new coronavirus variant omicron. As of May 5, 2022, there have been more than 40,000 confirmed cases, with more than 39,000 cured cases and five cases of death in Jilin Province. In this study, we comprehensively analyzed 311 patients who recovered from the disease living in Jilin Province, China. We collected data on the patients’ demographic characteristics, COVID-19 illness, symptoms, lung computed tomography (CT), and peripheral blood laboratory results for statistics to identify the factors affecting the severity of COVID-19 and to provide insights into its spread and early indications. Hopefully, our experience will provide support to more areas worldwide in dealing with the new variant.
Methods
We conducted a retrospective study on the clinical characteristics of adult patients with confirmed severe acute respiratory syndrome coronavirus 2 (SARS-CoV-2) infection based on symptoms and the positive nucleic acid amplification test (NAAT) result of nasal and/ or pharyngeal swab specimens. Data on 311 patients were randomly extracted from Changchun Infectious Disease Hospital and Hepatobiliary Disease Hospital of Jilin Province from March 10, 2022 to May 6, 2022. According to the interim guidance of the World Health Organization and the ninth edition of the Diagnosis and Treatment Protocol for COVID-19 Patients in China, the patients were divided into the mild (M) (n = 259) and moderate and severe (MS) (n = 52) groups. The inclusion criteria for the M group were as follows: (1) epidemiology history; (2) acute onset of fever, cough, fatigue, sore throat, headache, ageusia, diarrhea, and other symptoms; (3) age ≥ 18 years; (4) positive NAAT result for SARS-CoV-2; and (5) two successive negative NAAT results as a necessary condition for discharge. For the MS group, patients should meet at least one additional condition, as follows: (1) a typical CT image of viral pneumonia; (2) PaO2/FiO2 ≤ 300 mmHg; (3) oxygen saturation in resting state ≤ 93%; or (4) shortness of breath and/or respiratory rate ≥ 30 times per minute. This study was approved by the Ethics Committee of the First Hospital of Jilin University (Approval No. 22y050-001). This is a retrospective study and the informed consent was obtained.
Using a medical information system, the data on the clinical characteristics of the patients, including laboratory tests and demographic characteristics, were obtained from the database. For the laboratory assessments, data on leukocyte count, hemoprotein, platelet count (PLT), neutrophil count (NE), lymphocyte count, C-reactive protein (CRP), total bilirubin (TBIL), blood urea nitrogen (BUN), serum creatinine (SCR) were collected, and the neutrophil-to-lymphocyte ratio (NLR) and platelet-to-lymphocyte ratio (PLR) were calculated for analysis. Time to subsequent negative NAAT was defined as the duration between the dates of the first positive NAAT result and the second of the two successive negative NAAT results. The incubation period was defined as the time between exposure to the virus and the onset of clinical symptoms. Then, we analyzed the correlation among the clinical characteristics, COVID-19 illness, time to subsequent negative NAAT, and incubation period.
In this study, the means ± standard deviations (SD) and/ or interquartile ranges were used to summarize continuous variables. Numbers and/or percentages were used to describe categorical and ordinal variables. The Wilcoxon rank sum test and t-test were performed for continuous variables. The chi-square test and Fisher’s exact test were applied to categorical variables. To calculate the optimal cutoff values for the laboratory tests, such as NLR and CRP, receiver operating characteristic (ROC) analysis was conducted. Logistic regression analysis was performed to identify the hazard ratios and 95% confidence intervals, which were used to evaluate the relative risk between COVID-19 illness and clinical characteristics. The Kaplan–Meier curve and Cox regression analyses were performed to determine the influence of clinical characteristics on the time to subsequent negative NAAT and incubation period. Statistical Package for the Social Sciences 19.0 (IBM Corp., Armonk, USA) was used to perform all statistical analyses, and P-values of less than 0.05 were used to indicate statistical significance.
Results
Clinical characteristics
The laboratory tests and demographic characteristics of the patients in this study are described in Table 1. In the M group, the average age was 47.5 ± 16.3 years, ranging from 19 to 88 years. In the MS group, the average age was 63.7 ± 16.4 years, ranging from 27 to 93 years. The proportion of female patients was higher in the M group than in the MS group (61.4% vs. 40.4%) (P < 0.05). No significant differences in the time to subsequent negative NAAT and incubation period were observed between the two groups. The percentage of unvaccinated patients was significantly higher in the MS group than in the M group (36.5% vs. 17.4%) (P < 0.05). Regarding therapeutic strategy, 211 patients received traditional Chinese medicine, 139 patients took Lianhua Qingwen capsules, and 7 patients received antibiotics. Common symptoms, including cough, fever, sore throat, muscle soreness, expectoration, dyspnea, dizziness, diarrhea, headache, ageusia, nasal obstruction, and fatigue, were recorded, and cough (70.0%) was the most common symptom before admission. Furthermore, 167 patients had two or more symptoms. Then, 124 patients had comorbidities, such as hypertension (22.8%), coronary heart disease (7.1%), diabetes (9.6%), stroke (3.5%), liver disease (3.5%), history of malignant tumor, chronic obstructive pulmonary disease (COPD)/chronic bronchitis/asthma (2.6%), gout (2.6%), and mental illness (1.6%). Between the two groups, PLT, NE, CRP, BUN, and NLR were significantly different (P < 0.05).
Table 1.
Demographics and clinical classification of 311 patients with the SARS-CoV-2 omicron variant
| Variable | Total (n = 311) | M group (n = 259) | MS group (n = 52) | P-value |
|---|---|---|---|---|
| Age | ||||
| < 60 years | 245 (78.8%) | 224 (86.5%) | 21 (40.4%) | < 0.001 |
| ≥ 60 years | 66 (21.2%) | 35 (13.5%) | 31 (59.6%) | |
| Gender | ||||
| Male | 120 (38.6%) | 89 (34.4%) | 31 (59.6%) | 0.001 |
| Female | 191 (61.4%) | 170 (65.6%) | 21 (40.4%) | |
| Incubation period (days) | 3.05 ± 2.63 | 3.07 ± 2.59 | 2.94 ± 2.81 | 0.78 |
| Time to subsequent negative NAAT (days) | 15.25 ± 7.03 | 14.91 ± 6.98 | 16.96 ± 7.09 | 0.055 |
| Vaccination | ||||
| Yes | 247 (79.4%) | 214 (82.6%) | 33 (63.5%) | 0.004 |
| No | 64 (20.6%) | 45 (17.4%) | 19 (36.5%) | |
| Therapeutic strategy | ||||
| Traditional Chinese medicine | 211 (67.8%) | 162 (62.5%) | 49 (94.23%) | < 0.001 |
| Lianhua Qingwen capsule | 139 (44.7%) | 134 (51.7%) | 5 (9.6%) | < 0.001 |
| Antibiotics | 7 (2.2%) | 1 (0.4%) | 6 (11.5%) | 0.369 |
| Symptoms before admission | ||||
| Cough | 217 (70.0%) | 178 (68.7%) | 39 (75.0%) | 0.369 |
| Fever | 106 (34.1%) | 88 (34.0%) | 18 (34.6%) | 0.929 |
| Sore throat | 94 (30.2%) | 77 (29.7%) | 17 (32.7%) | 0.671 |
| Muscle soreness | 57 (18.3%) | 46 (17.8%) | 11 (21.2%) | 0.564 |
| Expectoration | 36 (11.6%) | 24 (9.3%) | 12 (23.1%) | 0.005 |
| Dyspnea | 31 (10.0%) | 21 (8.1%) | 10 (19.2%) | 0.015 |
| Dizziness | 25 (8.0%) | 18 (6.9%) | 7 (13.5%) | 0.115 |
| Diarrhea | 14 (4.5%) | 13 (5.0%) | 1 (1.9%) | 0.326 |
| Headache | 19 (6.1%) | 14 (5.4%) | 5 (9.6%) | 0.247 |
| Ageusia | 8 (2.6%) | 7 (2.7%) | 1 (1.9%) | 0.746 |
| Nasal obstruction | 3 (1.0%) | 3 (1.2%) | 0 | 0.435 |
| Fatigue | 14 (4.5%) | 10 (3.9%) | 4 (7.7%) | 0.224 |
| Others | 5 (1.6%) | 5 (1.9%) | 0 | 0.312 |
| Only one symptom | 144 (46.3%) | 131 (50.6%) | 13 (25.0%) | 0.001 |
| Two or more symptoms | 167 (53.7%) | 128 (49.4%) | 39 (75.0%) | |
| Comorbidities | ||||
| No comorbidity | 187 (60.1%) | 170 (65.6%) | 17 (32.7%) | < 0.001 |
| Hypertension | 71 (22.8%) | 46 (17.8%) | 25 (48.1%) | < 0.001 |
| Coronary heart disease | 22 (7.1%) | 18 (6.9%) | 4 (7.7%) | 0.772 |
| Diabetes | 30 (9.6%) | 21 (8.1%) | 9 (17.3%) | 0.067 |
| Stroke | 11 (3.5%) | 6 (2.3%) | 5 (9.6%) | 0.023 |
| Liver disease | 11 (3.5%) | 7 (2.7%) | 4 (7.7%) | 0.093 |
| History of malignant tumor | 9 (2.9%) | 6 (2.3%) | 3 (5.8%) | 0.177 |
| COPD/chronic bronchitis/asthma | 8 (2.6%) | 3 (1.1%) | 5 (9.6%) | 0.004 |
| Gout | 8 (2.6%) | 7 (2.7%) | 1 (1.9%) | 0.747 |
| Mental illness | 5 (1.6%) | 5 (1.9%) | 0 | 0.594 |
| Laboratory tests | ||||
| WBC (×109/L) | 5.39 ± 2.08 | 5.28 ± 1.88 | 5.93 ± 2.82 | 0.119 |
| HB (g/L) | 137.76 ± 18.95 | 136.50 ± 20.72 | 139.04 ± 24.24 | 0.435 |
| PLT (×109/L) | 213.26 ± 65.70 | 218.06 ± 64.03 | 189.38 ± 68.27 | 0.004 |
| NE (×109/L) | 3.00 ± 1.69 | 2.87 ± 1.44 | 3.62 ± 2.54 | 0.043 |
| LY (×109/L) | 1.75 ± 0.72 | 1.76 ± 0.71 | 1.69 ± 0.76 | 0.514 |
| CRP (mg/L) | 12.05 ± 24.75 | 9.60 ± 20.84 | 24.14 ± 36.94 | 0.008 |
| TBIL (μmol/L) | 9.40 ± 8.70 | 9.24 ± 6.83 | 11.21 ± 9.46 | 0.167 |
| BUN (mmol/L) | 4.28 ± 1.28 | 4.30 ± 1.35 | 4.96 ± 2.13 | 0.038 |
| SCR (μmol/L) | 60.60 ± 19.03 | 59.67 ± 18.11 | 65.23 ± 22.71 | 0.055 |
| NLR | 2.08 ± 1.91 | 1.93 ± 1.45 | 2.87 ± 3.29 | 0.047 |
| PLR | 144.57 ± 87.52 | 144.24 ± 78.96 | 146.18 ± 122.53 | 0.913 |
SARS-CoV-2: severe acute respiratory syndrome coronavirus 2; NAAT: negative nucleic acid amplification test; M group: mild group; MS group: moderate and severe group; WBC: white blood cell count; HB: hemoprotein; PLT: platelet count; NE: neutrophil count; Ly: lymphocyte count; CRP: c-reactive protein; TBIL: total bilirubin; BUN: blood urea nitrogen; SCR: serum creatinine; NLR: neutrophil-to-lymphocyte ratio; PLR: platelet-to-lymphocyte ratio; COPD: chronic obstructive pulmonary disease.
Multivariate analysis of the factors affecting COVID-19 illness
We performed the ROC analysis on PLT, NE, CRP, BUN, and NLR to calculate the optimal cutoff values. The ROC curves are shown in Figure 1. The optimal cutoff values for PLT, NE, CRP, BUN, and NLR were 294, 3.650, 4.785, 4.830, and 2.995, respectively. Furthermore, the areas under the ROC curve are described in Table 2. As the potential diagnostic biomarkers for MS COVID-19, PLT, CRP, and eligible demographic characteristics, including age, gender, vaccination, symptoms before admission (i.e., expectoration and dyspnea), and comorbidities (i.e., hypertension, COPD/chronic bronchitis/asthma, and stroke), were investigated through the logistic regression analysis to determine the predictive effect on COVID-19 illness. Table 3 shows that age (≥ 60 years), hypertension, COPD/ chronic bronchitis/asthma, and CRP (≥ 4.785 mg/L) were negatively correlated with mild COVID-19 (P < 0.05), and the odds ratios were 2.707, 3.285, 9.508, and 5.792, respectively. According to the results, the patients who had the aforementioned factors would be more likely to have moderate or severe COVID-19.
Figure 1.

ROC analysis of PLT, NE, CRP, BUN and NLR for moderate and severe COVID-19 illness. The optimal cut-off values: PLT (294), NE (3.65), CRP (4.785), BUN (4.83), NLR (2.995). The area under curve: PLT (0.635), NE (0.580), CRP (0.737), BUN (0.574), NLR (0.580). PLT: platelet count; NE: neutrophil count; CRP: c-reactive protein; BUN: blood urea nitrogen; NLR: neutrophil-to-lymphocyte ratio; ROC: receiver operating characteristic.
Table 2.
Area under curve and optimal cut-off value of PLT, NE, CRP, BUN, SCR and NLR
| Variable | Area under curve | S.E. | 95% CI | Optimal cut-off value | P-value |
|---|---|---|---|---|---|
| PLT | 0.635 | 0.047 | 0.272–0.457 | 294 | 0.002 |
| NE | 0.580 | 0.045 | 0.491–0.669 | 3.65 | 0.069 |
| CRP | 0.737 | 0.034 | 0.671–0.804 | 4.785 | < 0.001 |
| BUN | 0.574 | 0.047 | 0.482–0.665 | 4.83 | 0.093 |
| NLR | 0.580 | 0.045 | 0.491–0.669 | 2.995 | 0.069 |
PLT: platelet count; NE: neutrophil count; CRP: c-reactive protein; BUN: blood urea nitrogen; NLR: neutrophil-to-lymphocyte ratio; S.E.: standard error; CI: confidence interval; SCR: serum creatinine.
Table 3.
Laboratory tests and demographic characteristics to predict COVID-19 illness
| Variable | Multivariate analysis model 1 |
Multivariate analysis model 2 |
||||||
|---|---|---|---|---|---|---|---|---|
| OR | S.E. | 95% CI | P-value | OR | S.E. | 95% CI | P-value | |
| Age (≥ 60 years) | 2.249 | 0.406 | 1.016–4.980 | 0.046 | 2.707 | 0.371 | 1.309–5.599 | 0.007 |
| Gender (Male) | 1.425 | 0.431 | 0.302–1.633 | 0.411 | - | - | - | - |
| No vaccination | 1.942 | 0.424 | 0.225–1.182 | 0.118 | - | - | - | - |
| Expectoration | 2.511 | 0.521 | 0.904–6.970 | 0.077 | - | - | - | - |
| Dyspnea | 1.379 | 0.531 | 0.488–3.903 | 0.544 | - | - | - | - |
| Hypertension | 3.473 | 0.410 | 1.556–7.750 | 0.002 | 3.285 | 0.384 | 1.547–6.973 | 0.002 |
| Stroke | 1.294 | 0.743 | 0.302–5.552 | 0.728 | - | - | - | - |
| COPD/chronic bronchitis/asthma | 11.546 | 0.969 | 1.728–77.161 | 0.012 | 9.508 | 0.877 | 1.705–53.031 | 0.010 |
| PLT (≥ 294×109/L) | 1.034 | 0.575 | 0.335–3.190 | 0.954 | - | - | - | - |
| CRP (≥ 4.785 mg/L) | 4.189 | 0.405 | 1.893–9.270 | < 0.001 | 5.792 | 0.377 | 2.768–12.120 | < 0.001 |
COVID-19: coronavirus disease 2019; COPD: chronic obstructive pulmonary disease; PLT: platelet count; CRP: c-reactive protein; OR: odds ratio; S.E.: standard error; CI: confidence interval.
Kaplan–Meier curves and Cox regression analysis of the factors affecting the incubation period
To investigate the factors that influence the incubation period, the Kaplan-Meier curve analysis was performed involving potential factors. The eligible demographic characteristics, including age, gender, vaccination, and comorbidities (i.e., hypertension, COPD/chronic bronchitis/asthma, and stroke) were included to identify their effects on the incubation period. The incubation period of the M group was 3.07 ± 2.59 days, ranging from 0 to 13 days, and that of the MS group was 2.94 ± 2.81 days, ranging from 0 to 11 days. No significant difference was observed between the two groups (P = 0.78). Table 4 and Figure 2 show that older patients (≥ 60 years) were more likely to undergo a longer incubation period than younger one (< 60 years) (P < 0.05).
Table 4.
Demographic characteristics to predict incubation period
| Variable | Mean | S.E. | 95% CI | P-value |
|---|---|---|---|---|
| Age | ||||
| < 60 years | 2.891 | 0.161 | 2.575–3.207 | 0.033 |
| ≥ 60 years | 3.451 | 0.325 | 2.814–4.087 | |
| Gender | ||||
| Male | 2.708 | 0.223 | 2.270–3.146 | 0.062 |
| Female | 3.272 | 0.197 | 2.887–3.657 | |
| Vaccination | ||||
| Yes | 3.105 | 0.164 | 2.784–3.427 | 0.681 |
| No | 2.859 | 0.353 | 2.168–3.551 | |
| Hypertension | ||||
| Yes | 2.972 | 0.331 | 2.323–3.620 | 0.937 |
| No | 3.079 | 0.167 | 2.752–3.406 | |
| COPD/chronic bronchitis/asthma | ||||
| Yes | 3.125 | 1.125 | 0.920–5.330 | 0.810 |
| No | 3.053 | 0.150 | 2.758–3.347 | |
| Stroke | ||||
| Yes | 3.727 | 1.010 | 1.748–5.707 | 0.387 |
| No | 3.030 | 0.150 | 2.736–3.324 |
COPD: chronic obstructive pulmonary disease; S.E.: standard error; CI: confidence interval.
Figure 2.
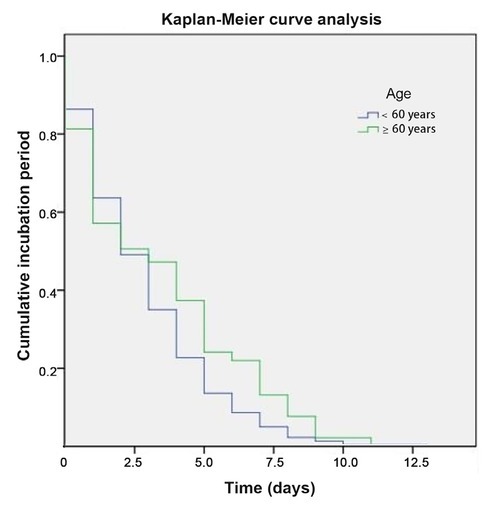
Kaplan-Meier curve analysis of age for incubation period. The elder patients (≥ 60 years) were more likely to have a longer incubation period than the younger (< 60 years). P < 0.05.
Kaplan–Meier curves and Cox regression analysis of the factors affecting the time to subsequent negative NAAT
To identify the factors affecting the time to subsequent negative NAAT, the Kaplan–Meier curve analysis was performed involving potential factors. The eligible demographic characteristics, including age, gender, vaccination, symptoms before admission (i.e., expectoration and dyspnea), comorbidities (i.e., hypertension, COPD/ chronic bronchitis/asthma, and stroke), therapeutic strategy (i.e., traditional Chinese medicine and Lianhua Qingwen capsules), and PLT, NE, CRP, BUN, and NLR were analyzed to clarify their effects on the time to subsequent negative NAAT. Similarly, no significant differences were observed between the two groups (P = 0.055). The time to subsequent negative NAAT was 14.91 ± 6.98 days, ranging from 2 to 36 days in the M group, and that in the MS group was 16.96 ± 7.09 days, ranging from 5 to 32 days. Table 5 and Figure 3 show that male, CRP (≥ 4.785 mg/L), and NLR (≥ 2.995) were correlated with a longer time to subsequent negative NAAT (P < 0.05). Then, a multivariate analysis of male, CRP, and NLR was performed. Table 6 reveals that only CRP (≥ 4.785 mg/L) was an independent risk factor for a longer time to subsequent negative NAAT (P < 0.05).
Table 5.
Laboratory tests and demographic characteristics to predict time to subsequent negative NAAT
| Variable | Mean | S.E. | 95% CI | P-value |
|---|---|---|---|---|
| Age | ||||
| < 60 years | 15.195 | 0.455 | 14.303–16.088 | 0.587 |
| ≥ 60 years | 15.396 | 0.805 | 13.818–16.973 | |
| Gender | ||||
| Male | 16.333 | 0.721 | 14.920–17.746 | 0.013 |
| Female | 14.576 | 0.459 | 13.676–15.476 | |
| Vaccination | ||||
| Yes | 15.166 | 0.429 | 14.325–16.007 | 0.367 |
| No | 15.594 | 1.010 | 13.615–17.572 | |
| Expectoration | ||||
| Yes | 16.500 | 1.320 | 13.912–19.088 | 0.194 |
| No | 15.091 | 0.416 | 14.276–15.906 | |
| Dyspnea | ||||
| Yes | 13.613 | 1.016 | 11.622–15.604 | 0.082 |
| No | 15.436 | 0.427 | 14.599–16.273 | |
| Hypertension | ||||
| Yes | 15.479 | 0.869 | 13.776–17.182 | 0.692 |
| No | 15.188 | 0.449 | 14.308–16.067 | |
| COPD/chronic bronchitis/asthma | ||||
| Yes | 16.250 | 3.087 | 10.200–22.300 | 0.686 |
| No | 15.228 | 0.402 | 14.441–16.015 | |
| Stroke | ||||
| Yes | 17.364 | 2.487 | 12.488–22.239 | 0.354 |
| No | 15.177 | 0.403 | 14.387–15.967 | |
| Traditional Chinese medicine | ||||
| Yes | 15.469 | 0.562 | 14.368–16.570 | 0.773 |
| No | 14.897 | 0.724 | 13.479–16.315 | |
| Lianhua Qingwen capsule | ||||
| Yes | 15.433 | 0.616 | 14.225–16.640 | 0.577 |
| No | 15.064 | 0.640 | 13.809–16.319 | |
| PLT | ||||
| < 294×109/L | 15.399 | 0.422 | 14.571–16.226 | 0.345 |
| ≥ 294×109/L | 14.114 | 1.203 | 11.757–16.472 | |
| NE | ||||
| < 3.65×10⁹/L | 15.355 | 0.448 | 14.477–16.233 | 0.949 |
| ≥ 3.65×10⁹/L | 14.962 | 0.856 | 13.285–16.640 | |
| CRP | ||||
| < 4.785 mg/L | 13.632 | 0.482 | 12.688–14.577 | < 0.001 |
| ≥ 4.785 mg/L | 17.635 | 0.627 | 16.406–18.864 | |
| BUN | ||||
| < 4.83 mmol/L | 15.725 | 0.495 | 14.755–16.694 | 0.105 |
| ≥ 4.83 mmol/L | 14.317 | 0.665 | 13.015–15.620 | |
| NLR | ||||
| < 2.995 | 14.828 | 0.420 | 14.006–15.651 | 0.021 |
| ≥ 2.995 | 17.531 | 1.120 | 15.335–19.726 |
NAAT: negative nucleic acid amplification test; COPD: chronic obstructive pulmonary disease; PLT: platelet count; NE: neutrophil count; CRP: c-reactive protein; BUN: blood urea nitrogen; NLR: neutrophil-to-lymphocyte ratio; S.E.: standard error; CI: confidence interval.
Figure 3.

Kaplan-Meier curve analysis of gender (A), CRP (B) and NLR (C) for time to subsequent negative NAAT. Male, elevated values of CRP (≥ 4.785mg/L) and NLR (≥ 2.995) were more inclined to undergo a longer time to subsequent negative NAAT than female, lowered values of CRP (< 4.785mg/L) and NLR (< 2.995). (P < 0.05). CRP: c-reactive protein; NLR: neutrophil-to-lymphocyte ratio; NAAT: nucleic acid amplification test.
Table 6.
Laboratory tests and demographic characteristics to predict time to subsequent negative NAAT
| Variable | Multivariate analysis model 1 |
Multivariate analysis model 2 |
||||||
|---|---|---|---|---|---|---|---|---|
| OR | S.E. | 95% CI | P-value | OR | S.E. | 95% CI | P-value | |
| Gender (Male) | 1.145 | 0.124 | 0.897–1.460 | 0.276 | - | - | - | - |
| CRP (≥ 4.785 mg/L) | 1.493 | 0.126 | 0.523–0.858 | 0.001 | 1.616 | 0.117 | 0.492–0.778 | < 0.001 |
| NLR (≥ 2.995) | 1.220 | 0.163 | 0.596–1.128 | 0.222 | - | - | - | - |
NAAT: negative nucleic acid amplification test; CRP: c-reactive protein; NLR: neutrophil-to-lymphocyte ratio; OR: odds ratio; S.E.: standard error; CI: confidence interval.
Discussion
COVID-19 is an infectious disease caused by SARS-CoV-2.[10, 11, 12, 13] Most people infected with the virus will experience mild-to-moderate respiratory illness.[14, 15] However, some will become seriously ill and require medical attention.[16, 17, 18, 19] Older individuals and those with underlying medical conditions, such as cardiovascular disease, chronic respiratory disease, diabetes, and cancer, are more likely to have serious illnesses.[20, 21, 22, 23] Anyone can get sick with COVID-19 and become seriously ill or die at any age.[24, 25, 26] The virus can spread from an infected person’s mouth or nose via small liquid particles when they cough, sneeze, speak, sing, or breathe. These particles range from larger respiratory droplets to smaller aerosols.[10,11,27]
Ever since scientists from Botswana and South Africa warned the world that the SARS-CoV-2 variant omicron could spread quickly,[2,28,29] researchers worldwide have been racing to understand the threat it poses to the world. The main concern about this variant is that it has high transmissibility. In contrast to the epidemic in 2020, when there were fewer than 100 confirmed cases in Jilin Province, China,[9] the current pandemic has reached more than 40,000 cases, as underlined by its rapid spread in different countries.[30] The epidemic has affected many cities in China and even had a huge impact on first-tier cities, such as Beijing and Shanghai.
This study included 311 patients who were randomly extracted from two hospitals in Jilin Province, China. We conducted a retrospective study on the clinical characteristics of adult cases with confirmed infection of the SARS-CoV-2 omicron variant. The mean age of the novel coronavirus cases was 50.2 years after excluding patients aged < 18 years. Patients in the MS group were significantly older than those in the M group. The number of female patients was higher, which is consistent with the results of some other studies[31, 32, 33]; however, there were slightly more men than women in the MS group. The incubation period in this study was approximately 3.05 days (range, 0–13 days), which was shorter than 4.2 days in Lee’s study and 3.6 days in Du’s study.[32,34] In this study, unvaccinated patients are prone to further disease progression. However, scientists are likely to see reduced effectiveness of vaccines in preventing infection worldwide.[35] This study revealed that the omicron variant may be more than 10 times as contagious as the original virus or twice as infectious as the delta variant and could be twice as likely to escape the current vaccine than the delta variant.[36] We found that cough, fever, sore throat, muscle soreness, and expectoration were the top five symptoms. Therefore, fever is not the only symptom, and patients with upper respiratory symptoms should also be vigilant.[37,38]
Peripheral inflammatory markers, such as leukocyte count, NE, NLR, PLR, and CRP levels, have been identified as independent predictors of prognosis in inflammatory diseases.[22,39,40] Moreover, NLR and PLR have recently been found to be associated with the prognosis of noninflammatory diseases, such as amputation, acute mesenteric artery embolism, and thrombosis.[41,42] Other peripheral blood indicators, including TBIL, BUN, and SCR, were also identified. In this study, although there were differences in PLT, NE, CRP, BUN, and NLR among the cases, we found that higher age, hypertension, or chronic lung disease and higher CRP levels were associated with MS COVID-19 after the multivariate analysis. This is similar to the results of a previous study,[43] in which NLR values were significantly increased in patients with severe COVID-19, but is different from the findings that NLR was an independent risk factor for severe illness in patients with COVID-19.[44, 45, 46] A pooled analysis by Lippi[47] showed a 2.5-fold increased risk of death from hypertension in patients with COVID-19; however, no other studies have examined the association between disease severity classification and complications of the omicron variant infection.
Quantifying the length of the incubation period for COVID-19 is a key research issue, as this information can guide public health control measures for infectious diseases.[48] Studies[49,50] have shown a strong association between the incubation period of the virus and the severity of disease presentation. In this study, the incubation period of the omicron variant was only 3.05 days, which is consistent with the milder clinical symptoms that the omicron variant usually causes. Meanwhile, we found that advanced age was the only factor affecting the incubation period in this study. We also focused on the influence of different influencing factors on the time from nucleic acid positivity to continuous negative NAAT. Male, CRP > 4.785 mg/L, and NLR > 2.995 may prolong this time and increase the length of hospital stay. Of note, CRP is an independent factor that affects the time from nucleic acid positivity to continuous negative NAAT in our analysis. We did not find any similar results in other omicron-related studies.
We conducted a retrospective study on the clinical characteristics of adult cases with confirmed infection with the SARS-CoV-2 omicron variant. The data are relatively comprehensive and have certain local characteristics, which can also reflect the clinical characteristics of the SARS-CoV-2 omicron variant in China at this time. However, this study is limited by its retrospective nature. We did not obtain all the patients’ information; however, a certain number of patients were randomly selected for our cohort. We did not sequence the entire genome of all patients to determine if they were infected with the SARS-CoV-2 omicron variant. Furthermore, the study did not include the treatment and outcome of certain patients who were transferred to advanced hospitals because of exacerbation of their disease.
Conclusions
Based on this study, older patients (≥ 60 years) with hypertension and lung diseases were more likely to have moderate or severe COVID-19, and younger patients (< 60 years) might have a shorter incubation period. A male patient with high CRP (≥ 4.785 mg/L) and NLR (≥ 2.995) values might take more time to turn back negative in the NAAT. CRP (≥ 4.785 mg/L) was an independent risk factor for a longer time to subsequent negative NAAT. The SARS-CoV-2, which has already infected 500 million individuals and caused more than 6 million deaths worldwide, is prone to genetic evolution with the development of mutations over time. The pandemic remains a huge challenge for the world, and it will continue to be the focus of global attention.
Footnotes
Availability of Data and Materials
The datasets used and/or analyzed during the current study are available from the corresponding author on reasonable request.
Source of Funding
This work was supported by National Natural Science Foundation of China Grant (U20A20342); Jilin Provincial Department of Science and Technology under Grant No. 20210204114YY; Jilin Provincial Development and Reform Commission under Grant No. 2020C031-4.
Author Contributions
Liu H prepared the manuscript. Wang S did the statistical analysis. Yang S, Luo J and Jie J collected the data. Luo SX revised the manuscript. Song L and Peng L designed the study and provided the funding. Li D and Hua S reviewed the results and made critical comments on the manuscript.
Ethnics Approval and Consent to Participate
This study was approved by the Ethics Committee of the First Hospital of Jilin University (Approval No. 22y050-001). This is a retrospective study and the informed consent was obtained.
Conflict of Interest
The authors declare that they have no competing interests.
References
- 1.Kapoor MC. Respiratory and cardiovascular effects of COVID-19 infection and their management. J Anaesthesiol Clin Pharmacol. 2020;36:S21–8. doi: 10.4103/joacp.JOACP_242_20. [DOI] [PMC free article] [PubMed] [Google Scholar]
- 2.Karim SSA, Karim QA. Omicron SARS-CoV-2 variant: a new chapter in the COVID-19 pandemic. Lancet. 2021;398:2126–8. doi: 10.1016/S0140-6736(21)02758-6. [DOI] [PMC free article] [PubMed] [Google Scholar]
- 3.Lino A, Cardoso MA, Martins-Lopes P, Gonçalves HMR. Omicron - The new SARS-CoV-2 challenge? Rev Med Virol. 2022;32:e2358. doi: 10.1002/rmv.2358. [DOI] [PMC free article] [PubMed] [Google Scholar]
- 4.McCallum M, Bassi J, De Marco A, Chen A, Walls AC, Di Iulio J. SARS-CoV-2 immune evasion by the B.1.427/B.1.429 variant of concern. Science. 2021;373:648–54. doi: 10.1126/science.abi7994. et al. [DOI] [PMC free article] [PubMed] [Google Scholar]
- 5.GISAID Tracking of variants. 2021. Available at: 2021. https://www.gisaid.org/hcov19-variants/. Available at. Accessed May 23, 2022.
- 6.Government of South Africa COVID-19. 2021. https://sacoronavirus.co.za/. Department of Health. Available at. Accessed May 23, 2022.
- 7.Greaney AJ, Starr TN, Gilchuk P, Zost SJ, Binshtein E, Loes AN. Complete Mapping of Mutations to the SARS-CoV-2 Spike Receptor-Binding Domain that Escape Antibody Recognition. Cell Host Microbe. 2021;29:44–57. doi: 10.1016/j.chom.2020.11.007. et al. .e9. [DOI] [PMC free article] [PubMed] [Google Scholar]
- 8.Harvey WT, Carabelli AM, Jackson B, Gupta RK, Thomson EC, Harrison EM. SARS-CoV-2 variants, spike mutations and immune escape. Nat Rev Microbiol. 2021;19:409–24. doi: 10.1038/s41579-021-00573-0. et al. [DOI] [PMC free article] [PubMed] [Google Scholar]
- 9.Liu H, Gao J, Wang Y, Jie J, Luo J, Xu Y. Epidemiological and clinical characteristics of 2019 novel coronavirus disease (COVID-19) in Jilin, China: A descriptive study. Medicine (Baltimore) 2020;99:e23407. doi: 10.1097/MD.0000000000023407. et al. [DOI] [PMC free article] [PubMed] [Google Scholar]
- 10.Wiersinga WJ, Rhodes A, Cheng AC, Peacock SJ, Prescott HC. Pathophysiology, Transmission, Diagnosis, and Treatment of Coronavirus Disease 2019 (COVID-19): A Review. Jama. 2020;324:782–93. doi: 10.1001/jama.2020.12839. [DOI] [PubMed] [Google Scholar]
- 11.Sharma A, Ahmad Farouk I, Lal SK. COVID-19: A Review on the Novel Coronavirus Disease Evolution, Transmission, Detection, Control and Prevention. Viruses. 2021;13:202. doi: 10.3390/v13020202. [DOI] [PMC free article] [PubMed] [Google Scholar]
- 12.Kalra A, Chawla N. Quandary Surrounding COVID19 Transmission. J Transl Intern Med. 2020;8:274–5. doi: 10.2478/jtim-2020-0041. [DOI] [PMC free article] [PubMed] [Google Scholar]
- 13.Oso BJ, Ogidi CO. Repositioning of Fungal-based Peptides as Modulators of Angiotensin-converting Enzyme-related Carboxypeptidase, SARS-coronavirus HR2 Domain, and Coronavirus Disease 2019 Main Protease. J Transl Intern Med. 2021;9:190–9. doi: 10.2478/jtim-2021-0038. [DOI] [PMC free article] [PubMed] [Google Scholar]
- 14.Ballow M, Haga CL. Why Do Some People Develop Serious COVID-19 Disease After Infection, While Others Only Exhibit Mild Symptoms? J Allergy Clin Immunol Pract. 2021;9:1442–8. doi: 10.1016/j.jaip.2021.01.012. [DOI] [PMC free article] [PubMed] [Google Scholar]
- 15.Yang H, Lu S. COVID-19 and Tuberculosis. J Transl Intern Med. 2020;8:59–65. doi: 10.2478/jtim-2020-0010. [DOI] [PMC free article] [PubMed] [Google Scholar]
- 16.Zhang TT, Dai B, Wang W. Should the High-flow Nasal Oxygen Therapy be used or Avoided in COVID-19? J Transl Intern Med. 2020;8:57–8. doi: 10.2478/jtim-2020-0018. [DOI] [PMC free article] [PubMed] [Google Scholar]
- 17.Li N, Jie Z. The Application of Corticosteroids in COVID-19: A Two-edged Sword. J Transl Intern Med. 2020;8:66–70. doi: 10.2478/jtim-2020-0011. [DOI] [PMC free article] [PubMed] [Google Scholar]
- 18.Sehgal V, Kalra A, Singh S, Ulmer B. Sex, Sleep, Steroids, and Lifestyle: Unraveling the Coronavirus Disease 2019 Conundrum. J Transl Intern Med. 2020;8:131–4. doi: 10.2478/jtim-2020-0021. [DOI] [PMC free article] [PubMed] [Google Scholar]
- 19.Redant S, Vanderhulst J, Maillart E, Attou R, Gallerani A, Honoré PM. Significance of Hypernatremia Due to SARS-CoV-2 Associated ARDS in Critically Ill Patients. J Transl Intern Med. 2020;8:255–60. doi: 10.2478/jtim-2020-0038. et al. [DOI] [PMC free article] [PubMed] [Google Scholar]
- 20.Zhang Z, Guo L, Huang L, Zhang C, Luo R, Zeng L. Distinct Disease Severity Between Children and Older Adults With Coronavirus Disease 2019 (COVID-19): Impacts of ACE2 Expression, Distribution, and Lung Progenitor Cells. Clin Infect Dis. 2021;73:e4154–65. doi: 10.1093/cid/ciaa1911. et al. [DOI] [PMC free article] [PubMed] [Google Scholar]
- 21.Tohidinia M, Sefid F. Identification B and T-Cell epitopes and functional exposed amino acids of S protein as a potential vaccine candidate against SARS-CoV-2/COVID-19. Microb Pathog. 2020;148:104459. doi: 10.1016/j.micpath.2020.104459. [DOI] [PMC free article] [PubMed] [Google Scholar]
- 22.Li XL, Wu C, Xie JG, Zhang B, Kui X, Jia D. Development and Validation of a Nomogram for Predicting the Disease Progression of Nonsevere Coronavirus Disease 2019. J Transl Intern Med. 2021;9:131–42. doi: 10.2478/jtim-2021-0030. et al. [DOI] [PMC free article] [PubMed] [Google Scholar]
- 23.Jin H, Yang S, Yang F, Zhang L, Weng H, Liu S. Elevated resting heart rates are a risk factor for mortality among patients with coronavirus disease 2019 in Wuhan, China. J Transl Intern Med. 2021;9:285–93. doi: 10.2478/jtim-2021-0042. et al. [DOI] [PMC free article] [PubMed] [Google Scholar]
- 24.Ladhani SN, Amin-Chowdhury Z, Davies HG, Aiano F, Hayden I, Lacy J. COVID-19 in children: analysis of the first pandemic peak in England. Arch Dis Child. 2020;105:1180–5. doi: 10.1136/archdischild-2020-320042. et al. [DOI] [PMC free article] [PubMed] [Google Scholar]
- 25.O’Driscoll M, Ribeiro Dos Santos G, Wang L, Cummings DAT, Azman AS, Paireau J. Age-specific mortality and immunity patterns of SARS-CoV-2. Nature. 2021;590:140–5. doi: 10.1038/s41586-020-2918-0. et al. [DOI] [PubMed] [Google Scholar]
- 26.Chen Y, Klein SL, Garibaldi BT, Li H, Wu C, Osevala NM. Aging in COVID-19: Vulnerability, immunity and intervention. Ageing Res Rev. 2021;65:101205. doi: 10.1016/j.arr.2020.101205. et al. [DOI] [PMC free article] [PubMed] [Google Scholar]
- 27.Chu DK, Akl EA, Duda S, Solo K, Yaacoub S, Schünemann HJ. Physical distancing, face masks, and eye protection to prevent person-to-person transmission of SARS-CoV-2 and COVID-19: a systematic review and meta-analysis. Lancet. 2020;395:1973–87. doi: 10.1016/S0140-6736(20)31142-9. [DOI] [PMC free article] [PubMed] [Google Scholar]
- 28.WHO. Classification of Omicron (B.1.1.529): SARS-CoV-2 Variant of Concern. 2021. https://www.who.int/news/item/26-11-2021-classification-of-omicron-(b.1.1.529)-sars-cov-2-variant-of-concern.Accessed Available at. May 23, 2022.
- 29.Viana R, Moyo S, Amoako DG, Tegally H, Scheepers C, Althaus CL. Rapid epidemic expansion of the SARS-CoV-2 Omicron variant in southern Africa. Nature. 2022;603:679–86. doi: 10.1038/s41586-022-04411-y. et al. [DOI] [PMC free article] [PubMed] [Google Scholar]
- 30.Planas D, Saunders N, Maes P, Guivel-Benhassine F, Planchais C, Buchrieser J. Considerable escape of SARS-CoV-2 Omicron to antibody neutralization. Nature. 2022;602:671–5. doi: 10.1038/s41586-021-04389-z. et al. [DOI] [PubMed] [Google Scholar]
- 31.Kim MK, Lee B, Choi YY, Um J, Lee KS, Sung HK. Clinical Characteristics of 40 Patients Infected With the SARS-CoV-2 Omicron Variant in Korea. J Korean Med Sci. 2022;37:e31. doi: 10.3346/jkms.2022.37.e31. et al. [DOI] [PMC free article] [PubMed] [Google Scholar]
- 32.Lee JJ, Choe YJ, Jeong H, Kim M, Kim S, Yoo H. Importation and Transmission of SARS-CoV-2 B.1.1.529 (Omicron) Variant of Concern in Korea, November 2021. J Korean Med Sci. 2021;36:e346. doi: 10.3346/jkms.2021.36.e346. et al. [DOI] [PMC free article] [PubMed] [Google Scholar]
- 33.SARS-CoV-2 B.1.1.529 (Omicron) Variant - United States, December 1-8, 2021. MMWR Morb Mortal Wkly Rep. 2021;70:1731–4. doi: 10.15585/mmwr.mm7050e1. CDC COVID-19 Response Team. [DOI] [PMC free article] [PubMed] [Google Scholar]
- 34.Du Z, Liu C, Wang L, Bai Y, Lau EHY, Wu P. Shorter serial intervals and incubation periods in SARS-CoV-2 variants than the SARS-CoV-2 ancestral strain. J Travel Med. 2022;29:taac052. doi: 10.1093/jtm/taac052. et al. [DOI] [PMC free article] [PubMed] [Google Scholar]
- 35.Callaway E. Omicron likely to weaken COVID vaccine protection. Nature. 2021;600:367–8. doi: 10.1038/d41586-021-03672-3. [DOI] [PubMed] [Google Scholar]
- 36.Chen J, Wang R, Gilby NB, Wei GW. Omicron Variant (B.1.1.529): Infectivity, Vaccine Breakthrough, and Antibody Resistance. J Chem Inf Model. 2022;62:412–22. doi: 10.1021/acs.jcim.1c01451. [DOI] [PMC free article] [PubMed] [Google Scholar]
- 37.Long B, Carius BM, Chavez S, Liang SY, Brady WJ, Koyfman A. Clinical update on COVID-19 for the emergency clinician: Presentation and evaluation. Am J Emerg Med. 2022;54:46–57. doi: 10.1016/j.ajem.2022.01.028. et al. [DOI] [PMC free article] [PubMed] [Google Scholar]
- 38.Wang J, Wang L, Li L, Xu J, Xu C, Li X. Enlightenments of Asymptomatic Cases of SARS-CoV-2 Infection. J Transl Intern Med. 2020;8:112–4. doi: 10.2478/jtim-2020-0017. et al. [DOI] [PMC free article] [PubMed] [Google Scholar]
- 39.Guthrie GJ, Charles KA, Roxburgh CS, Horgan PG, McMillan DC, Clarke SJ. The systemic inflammation-based neutrophil-lymphocyte ratio: experience in patients with cancer. Crit Rev Oncol Hematol. 2013;88:218–30. doi: 10.1016/j.critrevonc.2013.03.010. [DOI] [PubMed] [Google Scholar]
- 40.Hu H, Yao X, Xie X, Wu X, Zheng C, Xia W. Prognostic value of preoperative NLR, dNLR, PLR and CRP in surgical renal cell carcinoma patients. World J Urol. 2017;35:261–70. doi: 10.1007/s00345-016-1864-9. et al. [DOI] [PubMed] [Google Scholar]
- 41.Wang S, Liu H, Wang Q, Cheng Z, Sun S, Zhang Y. Neutrophil-to-Lymphocyte Ratio and Platelet-to-Lymphocyte Ratio Are Effective Predictors of Prognosis in Patients with Acute Mesenteric Arterial Embolism and Thrombosis. Ann Vasc Surg. 2018;49:115–22. doi: 10.1016/j.avsg.2018.01.059. et al. [DOI] [PubMed] [Google Scholar]
- 42.Wang Q, Liu H, Sun S, Cheng Z, Zhang Y, Sun X. Neutrophil-to-lymphocyte ratio is effective prognostic indicator for post-amputation patients with critical limb ischemia. Saudi Med J. 2017;38:24–9. doi: 10.15537/smj.2017.1.15936. et al. [DOI] [PMC free article] [PubMed] [Google Scholar]
- 43.Lagunas-Rangel FA.. Neutrophil-to-lymphocyte ratio and lymphocyte-to-C-reactive protein ratio in patients with severe coronavirus disease 2019 (COVID-19): A meta-analysis. J Med Virol. 2020;92:1733–4. doi: 10.1002/jmv.25819. [DOI] [PMC free article] [PubMed] [Google Scholar]
- 44.Liu Y, Du X, Chen J, Jin Y, Peng L, Wang HHX. Neutrophil-to-lymphocyte ratio as an independent risk factor for mortality in hospitalized patients with COVID-19. J Infect. 2020;81:e6–12. doi: 10.1016/j.jinf.2020.04.002. et al. [DOI] [PMC free article] [PubMed] [Google Scholar]
- 45.Xia X, Wen M, Zhan S, He J, Chen W. An increased neutrophil/ lymphocyte ratio is an early warning signal of severe COVID-19. Nan Fang Yi Ke Da Xue Xue Bao. 2020;40:333–6. doi: 10.12122/j.issn.1673-4254.2020.03.06. [DOI] [PMC free article] [PubMed] [Google Scholar]
- 46.Liu J, Li S, Liu J, Liang B, Wang X, Wang H. Longitudinal characteristics of lymphocyte responses and cytokine profiles in the peripheral blood of SARS-CoV-2 infected patients. EBioMedicine. 2020;55:102763. doi: 10.1016/j.ebiom.2020.102763. et al. [DOI] [PMC free article] [PubMed] [Google Scholar]
- 47.Lippi G, Wong J, Henry BM. Hypertension in patients with coronavirus disease 2019 (COVID-19): a pooled analysis. Pol Arch Intern Med. 2020;130:304–9. doi: 10.20452/pamw.15272. [DOI] [PubMed] [Google Scholar]
- 48.Awofisayo-Okuyelu A, McCarthy N, Mgbakor I, Hall I. Incubation period of typhoidal salmonellosis: a systematic review and meta-analysis of outbreaks and experimental studies occurring over the last century. BMC Infect Dis. 2018;18:483. doi: 10.1186/s12879-018-3391-3. [DOI] [PMC free article] [PubMed] [Google Scholar]
- 49.Quesada JA, López-Pineda A, Gil-Guillén VF, Arriero-Marín JM, Gutiérrez F, Carratala-Munuera C. Incubation period of COVID-19: A systematic review and meta-analysis. Rev Clin Esp (Barc) 2021;221:109–17. doi: 10.1016/j.rceng.2020.08.002. [DOI] [PMC free article] [PubMed] [Google Scholar]
- 50.Gussow AB, Auslander N, Wolf YI, Koonin EV. Prediction of the incubation period for COVID-19 and future virus disease outbreaks. BMC Biol. 2020;18:186. doi: 10.1186/s12915-020-00919-9. [DOI] [PMC free article] [PubMed] [Google Scholar]